

Abstract
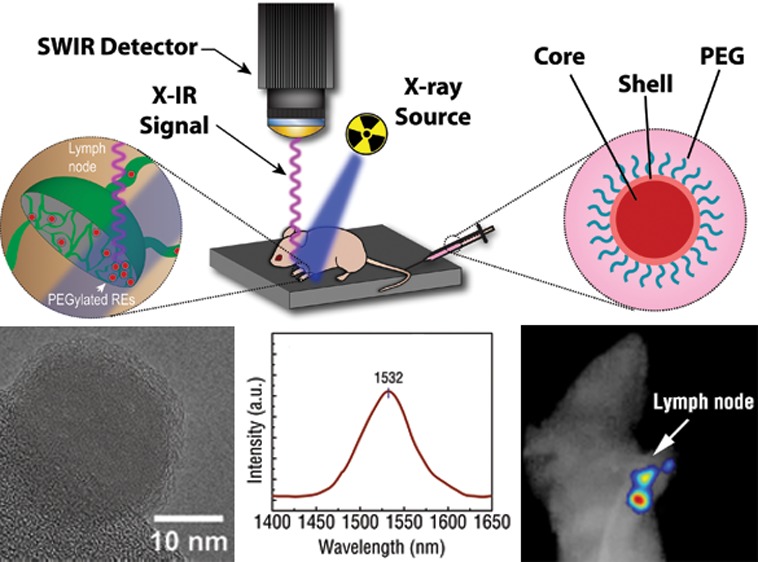
Shortwave infrared (SWIR or NIR-II) light provides significant advantages for imaging biological structures due to reduced autofluorescence and photon scattering. Here, we report on the development of rare-earth nanoprobes that exhibit SWIR luminescence following X-ray irradiation. We demonstrate the ability of X-ray-induced SWIR luminescence (X-IR) to monitor biodistribution and map lymphatic drainage. Our results indicate X-IR imaging is a promising new modality for preclinical applications and has potential for dual-modality molecular disease imaging.
Keywords: NIR-II, SWIR, second near-infrared, rare-earth, imaging, X-ray luminescence
Shortwave infrared (SWIR, alternatively referred to as NIR-II) imaging is an emerging optical modality that utilizes light in the second infrared window (1000–2300 nm) to visualize biological features with improved resolution and at greater tissue depth when compared to conventional near-infrared (NIR, 700–1000 nm) imaging approaches.1−3 These benefits have led to growing interest in the development of biologically benign molecular probes that can harness SWIR.4,5 While nanomaterials including single-wall carbon nanotubes (SWNTs)6−8 and quantum dots (QDs)9 have been investigated as SWIR imaging probes, these materials face significant translational challenges including low quantum efficiency, toxic compositions, and size-dependent emissions.
Rare-earth doped nanoprobes (REs) have recently shown great promise for SWIR molecular imaging.4 REs are inorganic nanoparticles composed of a lanthanide doped host material surrounded by a nondoped shell (Figure 1a). These core–shell nanostructured REs exhibit numerous advantageous imaging properties including exceptional photostability, tunable emissions with large Stokes shifts (>100 nm), and bright SWIR luminescence. These SWIR emissions can be induced from REs using continuous-wave NIR excitation, which has led to growing interest in the development of imaging approaches that utilize SWIR for biomedical applications.10 Previous work has shown that SWIR exhibits exceptional temporal and spatial resolving capabilities and can be used for tracking nanoparticle biodistribution, vascular mapping, and tumor detection.4
Figure 1.

Schematic of rare-earth doped nanoprobes showing the lanthanide-doped core surrounded by an undoped shell (a). TEM images of REs reveal spherical morphology (b). Individual lattice fringes were used to determine a predominantly hexagonal crystalline phase in the RE population (inset). REs displayed narrow size distribution as measured by analysis of TEM images (c). EDS confirmed the presence of the SWIR-emitting Er dopant in the REs (d).
We have recently shown that X-rays are capable of exciting the luminescent centers of various nanomaterials.11,12 In particular, X-ray irradiation of fluorescent nanomaterials such as metal–organic frameworks,13 gold nanoclusters,14 and radioluminescent nanophosphors11 induces emissions similar to those observed with traditional optical excitation. The use of X-rays allows for probe excitation to occur at essentially any depth, eliminates the background signal generated by tissue autofluorescence,15 and simplifies image reconstruction for optical tomography.12,16 Further modification of X-ray excitable probes with targeting agents and antibodies will extend the use of X-ray luminescence for applications in deep tissue molecular and cellular imaging.
Here, we report on the development of X-ray excitable RE probes with bright SWIR luminescence and demonstrate their potential for deep tissue imaging applications. Previous reports of X-ray luminescence have focused entirely on emissions in the visible or NIR spectral region, neglecting the advantages afforded to SWIR for deeper biological imaging. These advantages include reduced photon absorption,1 scattering,17 and tissue autofluorescence4 that lead to deeper photon penetration in biological tissue5,18 with high imaging fidelity.19 In this report, we demonstrate a novel mechanism for inducing SWIR emissions from various RE formulations using X-rays with ranging photon energies and provide the first demonstration of X-ray induced SWIR emission (X-IR) for biomedical imaging applications in nanoparticle tracking and lymphatic mapping.
REs composed of NaYF4 were synthesized according to the well-established solvothermal decomposition method20 and investigated for X-IR luminescence. A core–shell structure was adopted for the nanoparticles by first doping NaYF4 with rare-earth elements and subsequently surrounding the doped core with an undoped shell of NaYF4. The dopants chosen for this study were ytterbium (Yb) and erbium (Er) with the trivalent erbium (Er3+) dopant acting as the primary SWIR emitter. The NaYF4 host was doped with ∼2% Er and 20% Yb, which has been previously shown to exhibit the brightest visible21 and SWIR emissions.22 Both dopants were incorporated into the NaYF4 host using their respective trifluoracetate (TFA) precursors dissolved at ∼340 °C in the presence of an oleyamine surfactant. The as-synthesized surfactant-capped REs displayed uniform morphology (Figure 1b) and were approximately 17.5 ± 2.3 nm in diameter (Figure 1c) as measured by transmission electron microscopy (TEM). The observed lattice fringes were indicative of a predominately hexagonal (β) phase crystalline structure corresponding to RE formulations shown to have the brightest SWIR emission.23 To confirm the core–shell structure of the REs, we synthesized “core-only”, doped REs without the undoped NaYF4 shell (Supporting Information Figure S1). We characterized the “core-only” nanoparticles with TEM and found that the size distribution to be significantly smaller from the core–shell REs (Supporting Information Figure S2), exhibiting an average size of ∼8 nm likely due to the absence of the shell. Qualitative analysis of RE atomic composition was obtained using energy-dispersive X-ray spectroscopy (EDS) (Figure 1d). Elemental composition was estimated by comparing the relative peak intensities of each element and matched the theoretical formulation (Supporting Information Figure S3).
To assess the SWIR luminescence properties of REs, dried samples of REs were packed into optically transparent cuvettes and irradiated with low-energy, 40 kVp X-rays. The characteristic SWIR emissions of the Er dopant at 1525 nm were observed from the RE formulation using a SWIR detector (NIRvana 640, Princeton Instruments) coupled to a spectrometer (Figure 2a). The yttrium present in the host of the REs serves as an effective X-ray absorber with a K-edge at 17.0 keV, which is within the lower energy range for diagnostic X-rays. X-ray excitation of the REs resulted in emissions that corresponded to those observed following conventional NIR excitation (Supporting Information Figure S4). Energy transfer from the RE host lattice to the luminescent dopants resulted in SWIR emission corresponding to the characteristic Er3+ peak at 1550 nm observed from the 4I13/2 → 4I15/2 transition. Additional visible emissions characteristic of Er3+ were detected at 540 and 650 nm after X-ray excitation (Supporting Information Figure S5), similar to visible emissions observed after NIR excitation (Supporting Information Figure S6). While all visible emissions are dominated by electric dipole transitions, the 4I13/2 → 4I15/2 transition resulting in SWIR emissivity has been shown to contain both electric and magnetic dipole contribution.24 Others have proposed a possible mechanism describing the generation of X-ray luminescence from REs through a stepwise process involving the formation of electron–hole pairs (excitons), thermalization, excitation of the luminescent nanoparticle centers (rare-earth dopants) through energy transfer from excitons, relaxation of the excited luminescent center resulting in photon emission and finally heat generation.25 This process is highly dependent on various nanoparticle formulation parameters, including the host material26 and its crystalline phase25 as well as the concentration of activator25 and fluoride ions.27 The optical stability of the REs in the presence of high energy X-ray photons was evaluated under continuous irradiation. REs were subjected to high-energy, 320 kVp X-rays and SWIR signal intensity was monitored over time. The REs exhibited exceptional optical stability, with less than a 3% change in emission intensity after the delivery of a 50 Gy X-ray dose (Figure 2b). These results confirm that REs are amenable toward repeated X-IR imaging with minimal loss of signal.
Figure 2.

X-IR spectrum of REs shows a distinct SWIR emission peak centered around 1530 nm after X-ray irradiation (a). REs retain SWIR emission intensity after extended exposure to high energy (320 kVp) X-rays (b).
In order to investigate the use of REs for biomedical X-IR imaging applications, a cabinet irradiator unit was outfitted with a lead-shielded SWIR detector positioned perpendicular to a light-tight imaging space (Figure 3a). The cabinet irradiator allows for the delivery of superficial or orthovoltage X-rays at precise photon energies and doses. Approximately 0.1 g of REs was pressed into the 750 μm chambers of a hot spot resolution phantom (Micro Deluxe Phantom, Data Spectrum Corporation). The imaging system was capable of distinguishing the REs in the chambers and resolving X-IR signal between two chambers filled with REs and spaced 1.50 mm apart (Figure 3b). To determine the temporal resolution of the X-IR imaging system, SWIR emissions from 0.5 g of REs in a SWIR transparent cuvette (UVette, Eppendorf) were captured under various detector exposures following X-ray irradiation. The X-IR imaging system was capable of resolving SWIR emissions with 1 ms exposure using 320 kVp (Supporting Information Figure S7) and 80 kVp X-ray photons, and within 100 ms for low energy, 15 kVp X-rays (Figure 3c). All measurements were performed with a tube current of 12.5 mA. Video-rate detection of SWIR signal from REs opens the possibility for utilizing X-IR to conduct real-time biomedical imaging, such as in vivo nanoparticle detection and tracking.
Figure 3.

X-IR imaging system consists of a highly sensitive SWIR detector and X-ray irradiator cabinet enclosed within a light tight environment (a). X-IR was used to image REs placed inside a resolution phantom with rods 0.75 mm in diameter and 1.5 mm apart (b). Line profile across the phantom (inset, yellow dashed line on image). Exposure sensitivity of the X-IR imaging system was assessed by exciting REs under 80 kVp and 15 kVp X-rays (c). The X-IR detection sensitivity of REs was measured as a function of X-ray accelerating voltage at a constant electric current of 12.5 mA (d). Error bars represent pixel-to-pixel variation within a region of interest and propagated over three samples.
Next, the X-IR detection sensitivity of REs in the presence of water was determined by dispersing the nanoparticles in 2% agarose gels. Varying concentrations of REs (1.3 μM to 12.5 nM, corresponding to 10–0.1 mg mL–1) were irradiated with X-rays and imaged using the SWIR detector. The X-rays were conditioned with a 2 mm aluminum filter (HVL = ∼1 mm Cu) and all SWIR light between 800 and 1700 nm was collected by the imaging system. REs could be detected at the lowest tested concentration of 12.5 nM corresponding to 100 μg mL–1 using the X-IR imaging system (Figure 3d). The molecular weight of the REs were estimated from the average diameter of 18 nm and the density of bulk NaYF4 (4.21 g/cm3)4,28 and found to be as ∼7 × 10⁶ g/mol. For comparison, we synthesized and evaluated the X-IR emission characteristics of BaYF4 nanoparticles doped with 20% Yb and 2% Er. Previous studies have shown that, as with the NaYF4 host, these dopant concentrations generate the most efficient SWIR emission using the BaYF4 host.29 The same synthesis procedure used to form the NaYF4 nanoparticles was modified with a barium precursor to fabricate the BaYF4 nanoparticles. Our previous work has shown BaYF4 to be an effective host for observing X-ray induced visible luminescence.11 BaYF4 nanoparticles were found to exhibit similar X-IR emission characteristics as the NaYF4 REs (Supporting Information Figure S8) with comparable optical stability (Supporting Information Figure S9). However, for similar X-ray photon energies, REs composed of the NaYF4 host were found to exhibit ∼25% greater SWIR emission intensity at 1525 nm than ones synthesized with BaYF4 on a weight percent basis (Supporting Information Figure S10). While both NaYF4- and BaYF4-based REs could be detected at 0.1 mg mL–1, the BaYF4 nanoparticles required more energetic X-rays for detection (160 kVp compared to 80 kVp) (Supporting Information Figure S10). It is important to note that accelerating voltage also affects photon fluence and that for a given accelerating tube voltage the X-ray beam contains a broad spectrum of photon energies. Therefore, the X-IR emissions from both sets of REs display a strongly linear dependence (R2 > 0.99) to absorbed radiation dose, which suggests X-IR has the potential for quantitative imaging applications. Subsequent studies will focus on optimizing precise dopant schemes, as well as host composition, in order to systemically evaluate the impact of these parameters on X-IR intensity.
The translation of X-IR for preclinical imaging applications relies on the development of contrast agents that exhibit favorable biological properties while providing a high signal-to-noise ratio (SNR) for distinguishing features of biomedical relevance.30 REs have been previously shown to be well-tolerated in numerous in vivo studies31,32 and there exists longer term clinical translation potential for these materials with the FDA approval of yttrium-based microparticles.33 However, as-synthesized REs are hydrophobic due to a surface surfactant layer coating and quickly aggregate in aqueous solution. Therefore, REs require further surface modification in order to enable aqueous dispersion prior to biomedical use. Following synthesis and precipitation of the REs with excess EtOH, the flocculated REs were isolated by decanting the solvent and further purified by redispersion in toluene and precipitation in EtOH. The isolated oleylamine coated REs were rendered water-soluble with DSPE-2000-PEG by a ligand exchange procedure performed under sonication in the presence of tetrahydrofuran (THF). PEGylated REs were added dropwise into water and excess THF was allowed to evaporate overnight. Any remaining aggregates were removed by a 0.22 μm filter. TEM imaging of PEG modified REs clearly showed a 2.65 ± 0.65 nm amorphous “coating” surrounding the crystalline REs that was notably absent in the unmodified particles (Figure 4a). This coating likely corresponds to the layer of PEG added to the REs during ligand exchange. The water-soluble, PEGylated REs exhibited a narrow hydrodynamic diameter centered at 100 nm (Figure 4b) as determined by dynamic light scattering (DLS), in comparison to as-synthesized REs that rapidly aggregated in aqueous solution and displayed sizes above 1 μm with high polydispersity (data not shown). The PEGylated REs were stable in aqueous solution for up to a week postmodification with minimal aggregation.
Figure 4.
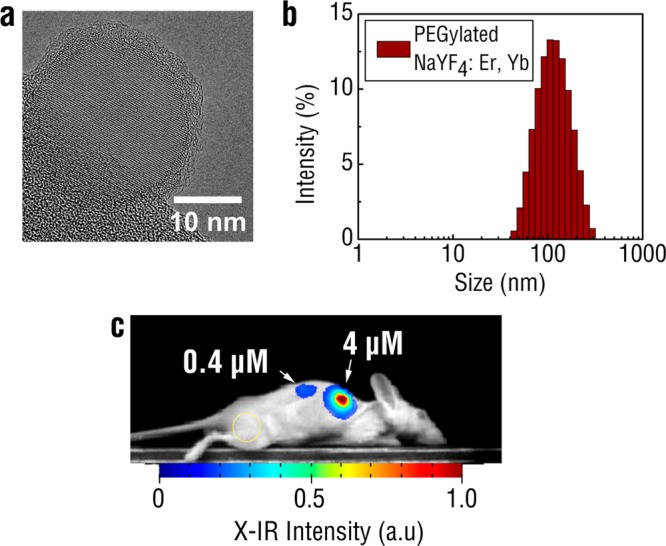
TEM of PEGylated REs reveals a uniform, amorphous coating surrounding the nanoprobes (a). Most of the nanoprobe is imaged over vacuum and the holey carbon support film is visible at the bottom left edge of the image. DLS of PEGylated REs in PBS indicates monodispersed particles around 100 nm in hydrodynamic diameter (b). PEGylated REs were mixed with Matrigel and injected subcutaneously into regions on the back flank of the mouse (c). X-IR imaging was performed using 320 kVp X-rays under 10 s exposure. Yellow circle indicates the sampled region used for the background.
Next, we evaluated the contrast capabilities of X-IR using mock tumor inclusions implanted in nude mice. A mixture of PEG-modified REs and Matrigel was subcutaneously injected into the back flanks of the mice. Anesthetized mice were imaged over 30 s using our custom X-IR imaging system operating under 320 kVp and 12.5 mA. SWIR emissions from the 75 μM RE inclusion were clearly detectable from the injection site with a complete absence of nonspecific autofluorescence elsewhere on the animal (Figure 4c). The signal-to-noise ratio was calculated as the ratio of the X-IR signal amplitude to the noise.34 A nearby region on the animal, indicated by the yellow circle, was chosen to represent the typical background signal observed during imaging. The SNR was then calculated using the following equation
| 1 |
Notably, there was an absence of observed tissue autofluorescence during X-IR imaging, similar to what has been previously reported during NIR excitation of REs.4,10 Image postprocessing revealed a ∼90 SNR between the X-IR signal from the mock tumor inclusion to a nearby region on the mouse. A second tumor inclusion with 10-fold more dilute REs (0.4 μM) was also implanted into the back of the mouse and generated a SNR of ∼9.5. For comparison, PEG-modified BaYF4 nanoparticles were also detectable after injection into the back of a mouse albeit at lower SNRs (Supporting Information Figure S11). The magnitude of these ratios results from both the minimal endogenous tissue autofluorescence of X-IR and exceptional SWIR signal production of REs. Both the minimal tissue autofluorescence and deeper penetration depth of X-ray photons provide significant improvements in SNR to X-IR over traditional imaging techniques that rely on purely X-ray or optical approaches. For example, our previous work has shown that X-ray luminescence can improve the SNR for imaging by over 200% compared to traditional X-ray fluoroscopy.35 Current efforts are focused on evaluating the performance of X-IR relative to traditional, NIR-induced SWIR imaging to better understand the relationship of SNR on imaging conditions and between techniques. The observed linear dependence of X-IR emissions on absorbed radiation dose (Figure 3d) as well as SNR on nanoparticle concentration (Figure 4c) suggests a similar relationship between SNR and X-ray dose. While higher doses increase the amount of SWIR photons from REs and may improve image quality, the total amount of radiation delivered must be carefully monitored when working with live animals.
We then assessed the ability of X-IR to track and image the in vivo clearance of REs deep within mice. The PEG-modified REs were intravenously injected into hairless mice and imaged after 15 min using X-rays generated at 320 kVp and 12.5 mA. A standard digital camera was used to take the white light image after the X-IR signal was captured. The biodistribution of REs was visualized by their X-IR signature in organs mediating nanoparticle clearance, such as the liver and spleen (Figure 5a), similar to previous observations using NIR excitation.36 The fainter X-IR signal observed in the lungs was likely due to nanoparticle accumulation or transient circulation of the REs in the respiratory vascular network prior to sacrifice. The X-IR signal from individual organs was confirmed after the organs were excised. These results highlight the combined potential of using a highly penetrating X-ray excitation source to detect an optical signal with enhanced deep tissue resolution within a small animal model. While the X-IR signal can be used to effectively monitor the anatomical localization of REs, resolving that the finer details of anatomical structure can be improved upon through several approaches. It is likely breathing and organ motion artifacts are contributing to a reduction in X-IR resolution similar to what has been observed during X-ray CT imaging.37 Introducing motion correction algorithms such as respiratory-gating38,39 during image processing and using narrower X-ray excitation40 could be incorporated into a more optimized X-IR imaging platform to improve spatial resolution further.
Figure 5.

RE clearance visualized in mice 15 min postinjection (p.i.) using X-IR imaging at 320 kVp and 30 s exposure (a). White light images presented for clarity. Organs were subsequently excised and imaged using X-IR to confirm RE presence. Schematic of lymphatic mapping using X-IR of PEGylated REs (b). PEGylated REs were injected into the footpad of the mouse and imaged 45 min p.i. (c). Distinct focal luminescence was visualized away from the injection site near the animal’s axillary and brachial lymph nodes. After dissection, X-IR signal could be traced to the local lymph nodes draining from the injection site (axillary lymph node shown in the inset). In contrast, contralateral lymph nodes did not show any notable X-IR signal.
We further evaluated X-IR for imaging anatomical structures with clinical importance. Sentinel lymph node mapping is a common technique used to visualize lymph nodes near a primary tumor site that are most likely to harbor metastases. Lymph node involvement during cancer metastasis is important and commonly used for clinical staging as well as assessing overall disease prognosis.41 Approximately 10 μL of 15 μM PEG-modified REs were injected into the forepaw pad of anesthetized hairless mice. These concentrations are comparable to intravenous doses of other nanoparticle-based imaging formulations31,42,43 and similar to concentrations used by others for X-ray luminescence imaging.44 After 45 min, the mouse was placed in the X-IR system and imaged using 320 kVp X-rays over 30 s. X-IR signal was observed to traverse into the lower limb of the animal and accumulate in two distinct regions near the draining lymph nodes (Figure 5b), similar to patterns of lymphatic drainage reported by others.45,46 Upon dissection, both the brachial and axillary lymph nodes were revealed to be the source of the observed X-IR emissions. Contralateral lymph nodes were excised and compared by X-IR imaging. In contrast to the nodes excised near the injection site, distant lymph nodes did not display pronounced X-IR emissions. Notably, the lack of any background from these distant lymph nodes highlights the exceptional SNR of X-IR for sensitive imaging applications. The ability of X-IR to resolve the finer details of lymphatic structure highlights the potential of REs for imaging localized disease lesions. Combined with molecular targeting strategies, the REs presented here could find use for rapidly assessing tumor aggressiveness by screening lymph node involvement during cancer metastasis with traditional X-ray diagnostic techniques, such as computed tomography (CT) and mammography, or newer imaging techniques such as X-ray tomosynthesis (Figure 5c).47
While NIR excitation of REs may offer advantages over X-IR for certain imaging applications, notably intraoperative or subsurface imaging, X-IR may be useful in clinical practices that involve X-rays or X-ray imaging. For example, X-IR may be useful for classifying disease status during the delivery of radiation therapy, enabling the identification of tumor margins by surgeons or quantification of delivery dose by radiation oncologists. In addition, raster scanning a narrow X-ray pencil beam through tissue can be used to generate optical scatter-free images of RE distribution with precise localization of the emitting nanoprobes source. Monte Carlo simulations were run to highlight the benefits of scatter-free pencil beam X-ray excitation compared to traditional NIR excitation (Supporting Information Figure S12).
As previously mentioned, the total radiation dose delivered must be monitored when working with live animals in any X-ray or nuclear imaging modality. Current microCT systems generally deliver a dose on the order of 10 cGy to rodents,48 while small animal SPECT and PET systems may deliver up to almost 100 cGy of whole body dose per experiment.49 On the basis of our current setup, our delivered dose would be on the order of 50–250 cGy depending on the exposure and accelerating voltage used. While this still is below the LD50/30 for radiation dose in mice (estimated at ∼7 Gy),50,51 high X-ray dose can affect the quantitative accuracy of longitudinal studies due to unwanted radiation-induced side effects.52 We anticipate that further improvements to both our imaging setup and formulation will reduce the doses delivered in this proof-of-concept study significantly. For example, our previous work has shown a subpicomolar detection sensitivity of nanoparticles using selective X-ray excitation at doses below 1 cGy,53 while others have noted significant improvements in X-ray luminescence intensity based on changes in nanoparticle composition.25
Our work presents the first demonstration of SWIR tissue imaging using diagnostic and therapeutic X-rays. By capitalizing on the exceptional tissue penetrating properties of X-rays, our work builds on recent reports utilizing visible X-ray luminescence for monitoring nanoparticle organ accumulation54,55 and advances nonvisible X-ray luminescence for high resolution, deep tissue anatomical imaging of nanoparticle biodistribution using SWIR light. Crucially, we are the first to show the capabilities of X-IR imaging for mapping lymphatic drainage of biologically modified nanoparticles at resolutions and SNR sufficient to identify individual nodes. Unlike other imaging approaches that combine imaging techniques such as nuclear/CT, nuclear/magnetic resonance, or CT/fluorescence molecular tomography, X-IR imaging does not rely on two independent imaging devices but instead combines the advantages of both X-ray and optical imaging synergistically to produce visual data that would otherwise not have been possible using either modality alone.
The implications of this proposed imaging technique will provide a new paradigm for preclinical and future clinical applications. For example, X-IR could be used to enrich CT imaging with spatially registered molecular information. By conjugating REs with targeted biomolecules, X-IR can be used to bridge gross anatomical X-ray imaging with the optical detection of targeted molecular biomarkers specific to disease states. Furthermore, the REs presented in this study were fabricated with erbium doping; however, other dopant schemes including holmium–ytterbium, thulium–ytterbium, and praseodymium–ytterbium can be used for tuning the peak emission wavelengths of the REs. Developing a library of such formulations opens the possibility for extending X-IR toward multispectral imaging applications and refining X-IR for simultaneously monitoring the interplay between multiple biological processes in vivo.
Glossary
Abbreviations
- RE
rare-earth doped nanoprobes
- SWIR and NIR-II
shortwave infrared
- X-IR
X-ray induced SWIR luminescence (X-IR)
- QD
quantum dots
- NIR
near-infrared
- TEM
transmission electron microscopy
- EDS
energy dispersive X-ray spectroscopy
- CT
computed tomography
- HVL
half value layer
- p.i
postinjection
- MR
magnetic resonance
- FMT
fluorescence molecular tomography
- dynamic light scattering
DLS
- polyethylene glycol
PEG
- trifluoracetate
TFA
Supporting Information Available
Supplemental methods, nanoparticle characterization, BaYF4:Er,Yb optical and X-IR properties. This material is available free of charge via the Internet at http://pubs.acs.org.
Author Contributions
The manuscript was written through contributions of all authors. All authors have given approval to the final version of the manuscript.
The authors are grateful for funding support offered by the NIBIB (1R01 EB016777), NCI (1R01 CA133474), and the U.S. Department of Defense, Breast Cancer Research Program award W81XWH-11-1-0087.
The authors declare no competing financial interest.
Funding Statement
National Institutes of Health, United States
Supplementary Material
References
- Smith A. M.; Mancini M. C.; Nie S. Nat. Nanotechnol. 2009, 4, 710–1. [DOI] [PMC free article] [PubMed] [Google Scholar]
- Welsher K.; Sherlock S. P.; Dai H. Proc. Natl. Acad. Sci. U.S.A. 2011, 108, 8943–8948. [DOI] [PMC free article] [PubMed] [Google Scholar]
- Hong G.; Lee J. C.; Robinson J. T.; Raaz U.; Xie L.; Huang N. F.; Cooke J. P.; Dai H. Nat. Med. 2012, 18, 1841–1846. [DOI] [PMC free article] [PubMed] [Google Scholar]
- Naczynski D. J.; Tan M. C.; Zevon M.; Wall B.; Kohl J.; Kulesa A.; Chen S.; Roth C. M.; Riman R. E.; Moghe P. V. Nat. Commun. 2013, 4, 2199. [DOI] [PMC free article] [PubMed] [Google Scholar]
- Hong G.; Diao S.; Chang J.; Antaris A. L.; Chen C.; Zhang B.; Zhao S.; Atochin D. N.; Huang P. L.; Andreasson K. I.; Kuo C. J.; Dai H. Nat. Photonics 2014, 8, 723–730. [DOI] [PMC free article] [PubMed] [Google Scholar]
- Welsher K.; Liu Z.; Sherlock S. P.; Robinson J. T.; Chen Z.; Daranciang D.; Dai H. Nat. Nanotechnol. 2009, 4, 773–80. [DOI] [PMC free article] [PubMed] [Google Scholar]
- Iverson N. M.; Barone P. W.; Shandell M.; Trudel L. J.; Sen S.; Sen F.; Ivanov V.; Atolia E.; Farias E.; McNicholas T. P.; Reuel N.; Parry N. M. A.; Wogan G. N.; Strano M. S. Nat. Nanotechnol. 2013, 8, 873–880. [DOI] [PMC free article] [PubMed] [Google Scholar]
- Yi H.; Ghosh D.; Ham M.-H.; Qi J.; Barone P. W.; Strano M. S.; Belcher A. M. Nano Lett. 2012, 12, 1176–1183. [DOI] [PMC free article] [PubMed] [Google Scholar]
- Rogach A. L.; Eychmuller A.; Hickey S. G.; Kershaw S. V. Small 2007, 3, 536–557. [DOI] [PubMed] [Google Scholar]
- Naczynski D. J.; Tan M. C.; Riman R. E.; Moghe P. V. J. Mater. Chem. B 2014, 2, 2958–2973. [DOI] [PMC free article] [PubMed] [Google Scholar]
- Sun C.; Pratx G.; Carpenter C. M.; Liu H.; Cheng Z.; Gambhir S. S.; Xing L. Adv. Mater. 2011, 23, H195–H199. [DOI] [PMC free article] [PubMed] [Google Scholar]
- Pratx G.; Carpenter C. M.; Sun C.; Rao R. P.; Xing L. Opt. Lett. 2010, 35, 3345–3347. [DOI] [PMC free article] [PubMed] [Google Scholar]
- Wang C.; Volotskova O.; Lu K.; Ahmad M.; Sun C.; Xing L.; Lin W. J. Am. Chem. Soc. 2014, 136, 6171–4. [DOI] [PMC free article] [PubMed] [Google Scholar]
- Osakada Y.; Pratx G.; Sun C.; Sakamoto M.; Ahmad M.; Volotskova O.; Ong Q.; Teranishi T.; Harada Y.; Xing L.; Cui B. Chem. Commun. (Cambridge) 2014, 50, 3549–51. [DOI] [PMC free article] [PubMed] [Google Scholar]
- Carpenter C. M.; Sun C.; Pratx G.; Rao R.; Xing L. Med. Phys. 2010, 37, 4011–8. [DOI] [PMC free article] [PubMed] [Google Scholar]
- Pratx G.; Carpenter C. M.; Sun C.; Rao R. P.; Xing L. Opt. Lett. 2010, 35, 3345–7. [DOI] [PMC free article] [PubMed] [Google Scholar]
- Lim Y. T.; Kim S.; Nakayama A.; Stott N. E.; Bawendi M. G.; Frangioni J. V. Mol. Imaging 2003, 2, 50–64. [DOI] [PubMed] [Google Scholar]
- Wang R.; Li X.; Zhou L.; Zhang F. Angew. Chem., Int. Ed. 2014, 126, 12282–12286. [Google Scholar]
- Hong G.; Lee J. C.; Robinson J. T.; Raaz U.; Xie L.; Huang N. F.; Cooke J. P.; Dai H. Nat. Med. 2012, 18, 1841–1846. [DOI] [PMC free article] [PubMed] [Google Scholar]
- Naczynski D. J.; Andelman T.; Pal D.; Chen S.; Riman R. E.; Roth C. M.; Moghe P. V. Small 2010, 6, 1631–1640. [DOI] [PubMed] [Google Scholar]
- Yi G. S.; Chow G. M. Adv. Funct. Mater. 2006, 16, 2324–2329. [Google Scholar]
- Liu X.; Chi Y.; Dong G.; Wu E.; Qiao Y.; Zeng H.; Qiu J. Opt. Express 2009, 17, 5885–5890. [DOI] [PubMed] [Google Scholar]
- Tan M. C.; Connolly J.; Riman R. E. J. Phys. Chem. C 2011, 115, 17952–17957. [Google Scholar]
- Balda R.; Garcia-Adeva A. J.; Fernández J.; Fdez-Navarro J. M. J. Opt. Soc. Am. B 2004, 21, 744–752. [Google Scholar]
- Sudheendra L.; Das G. K.; Li C.; Stark D.; Cena J.; Cherry S.; Kennedy I. M. Chem. Mater. 2014, 26, 1881–1888. [DOI] [PMC free article] [PubMed] [Google Scholar]
- Wojtowicz A.; Glodo J.; Wisniewski D.; Lempicki A. J. Lumin. 1997, 72, 731–733. [Google Scholar]
- Nepomnyashchikh A. I.; Radzhabov E. A.; Egranov A. V.; Ivashechkin V. F. Radiat. Meas. 2001, 33, 759–762. [Google Scholar]
- Cheng L.; Yang K.; Zhang S.; Shao M.; Lee S.; Liu Z. Nano Res. 2010, 3, 722–732. [Google Scholar]
- Zhai X.; Liu S.; Liu X.; Wang F.; Zhang D.; Qin G.; Qin W. J. Mater. Chem. C 2013, 1, 1525–1530. [Google Scholar]
- Frangioni J. V. Curr. Opin. Chem. Biol. 2003, 7, 626–34. [DOI] [PubMed] [Google Scholar]
- Xiong L.; Yang T.; Yang Y.; Xu C.; Li F. Biomaterials 2010, 31, 7078–85. [DOI] [PubMed] [Google Scholar]
- Abdul Jalil R.; Zhang Y. Biomaterials 2008, 29, 4122–8. [DOI] [PubMed] [Google Scholar]
- Murthy R.; Nunez R.; Szklaruk J.; Erwin W.; Madoff D. C.; Gupta S.; Ahrar K.; Wallace M. J.; Cohen A.; Coldwell D. M.; Kennedy A. S.; Hicks M. E. Radiographics 2005, 25Suppl 1S41–55. [DOI] [PubMed] [Google Scholar]
- de Chermont Q. l. M.; Chanéac C.; Seguin J.; Pellé F.; Maîtrejean S.; Jolivet J.-P.; Gourier D.; Bessodes M.; Scherman D. Proc. Natl. Acad. Sci. U.S.A. 2007, 104, 9266–9271. [DOI] [PMC free article] [PubMed] [Google Scholar]
- Carpenter C. M.; Sun C.; Pratx G.; Rao R.; Xing L. Med. Phys. 2010, 37, 4011–4018. [DOI] [PMC free article] [PubMed] [Google Scholar]
- Naczynski D. J.; Tan M. C.; Zevon M.; Wall B.; Kohl J.; Kulesa A.; Chen S.; Roth C. M.; Riman R. E.; Moghe P. V. Nat. Commun. 2013, 4, 2199. [DOI] [PMC free article] [PubMed] [Google Scholar]
- Barrett J. F.; Keat N. Radiographics 2004, 24, 1679–91. [DOI] [PubMed] [Google Scholar]
- Cavanaugh D.; Johnson E.; Price R. E.; Kurie J.; Travis E. L.; Cody D. D. Mol. Imaging 2004, 3, 55–62. [DOI] [PubMed] [Google Scholar]
- Li T.; Schreibmann E.; Yang Y.; Xing L. Phys. Med. Biol. 2006, 51, 253. [DOI] [PubMed] [Google Scholar]
- Klingenbeck-Regn K.; Schaller S.; Flohr T.; Ohnesorge B.; Kopp A. F.; Baum U. Eur. J. Radiol. 1999, 31, 110–124. [DOI] [PubMed] [Google Scholar]
- Krag D. N.; Anderson S. J.; Julian T. B.; Brown A. M.; Harlow S. P.; Costantino J. P.; Ashikaga T.; Weaver D. L.; Mamounas E. P.; Jalovec L. M.; Frazier T. G.; Noyes R. D.; Robidoux A.; Scarth H. M.; Wolmark N. Lancet Oncol. 2010, 11, 927–33. [DOI] [PMC free article] [PubMed] [Google Scholar]
- Ye L.; Yong K.-T.; Liu L.; Roy I.; Hu R.; Zhu J.; Cai H.; Law W.-C.; Liu J.; Wang K.; Liu J.; Liu Y.; Hu Y.; Zhang X.; Swihart M. T.; Prasad P. N. Nat. Nano 2012, 7, 453–458. [DOI] [PubMed] [Google Scholar]
- Zhang Y.; Hong G.; He W.; Zhou K.; Yang K.; Li F.; Chen G.; Liu Z.; Dai H.; Wang Q. Biomaterials 2013, 34, 3639–46. [DOI] [PubMed] [Google Scholar]
- Yi Z.; Zeng S.; Lu W.; Wang H.; Rao L.; Liu H.; Hao J. ACS Appl. Mater. Interfaces 2014, 6, 3839–46. [DOI] [PubMed] [Google Scholar]
- Thorek D. L. J.; Ulmert D.; Diop N.-F. M.; Lupu M. E.; Doran M. G.; Huang R.; Abou D. S.; Larson S. M.; Grimm J. Nat. Commun. 2014, 5. [DOI] [PMC free article] [PubMed] [Google Scholar]
- Jeon Y. H.; Kim Y.-H.; Choi K.; Piao J. Y.; Quan B.; Lee Y.-S.; Jeong J. M.; Chung J.-K.; Lee D. S.; Lee M. C. Mol. Imaging Biol. 2010, 12, 155–162. [DOI] [PubMed] [Google Scholar]
- Andersson I.; Ikeda D. M.; Zackrisson S.; Ruschin M.; Svahn T.; Timberg P.; Tingberg A. Eur. Radiol. 2008, 18, 2817–2825. [DOI] [PubMed] [Google Scholar]
- Figueroa S. D.; Winkelmann C. T.; Miller W. H.; Volkert W. A.; Hoffman T. J. Med. Phys. 2008, 35, 3866–3874. [DOI] [PMC free article] [PubMed] [Google Scholar]
- Funk T.; Sun M.; Hasegawa B. H. Med. Phys. 2004, 31, 2680–6. [DOI] [PubMed] [Google Scholar]
- Samarth R.; Kumar A. J. Radiat. Res. 2003, 44, 101–109. [DOI] [PubMed] [Google Scholar]
- Patchen M.; MacVittie T.; Souza L. Int. J. Radiat. Oncol. 1992, 22, 773–779. [DOI] [PubMed] [Google Scholar]
- Boone J. M.; Velazquez O.; Cherry S. R. Mol. Imaging 2004, 3, 149–58. [DOI] [PubMed] [Google Scholar]
- Pratx G.; Carpenter C. M.; Sun C.; Xing L. IEEE Trans. Med. Imaging 2010, 29, 1992–9. [DOI] [PMC free article] [PubMed] [Google Scholar]
- Yi Z.; Zeng S.; Lu W.; Wang H.; Rao L.; Liu H.; Hao J. ACS Appl. Mater. Interfaces 2014, 6, 3839–3846. [DOI] [PubMed] [Google Scholar]
- Zeng S.; Wang H.; Lu W.; Yi Z.; Rao L.; Liu H.; Hao J. Biomaterials 2014, 35, 2934–2941. [DOI] [PubMed] [Google Scholar]
Associated Data
This section collects any data citations, data availability statements, or supplementary materials included in this article.