

Abstract
Fluorine (19F) is a promising moiety for quantitative magnetic resonance imaging (MRI). It possesses comparable MR sensitivity to proton (1H) but exhibits no tissue background signal, allowing specific and selective assessment of the administrated 19F-containing compounds in vivo. Additionally, the MR spectra of 19F-containing compounds exhibited a wide range of chemical shifts (> 200 ppm). Therefore, both MR parameters (e.g. spin-lattice relaxation rate R1) and the absolute quantity of molecule can be determined with 19F MRI for unbiased assessment of tissue physiology and pathology. This article reviews quantitative 19F MRI applications for mapping tumor oxygenation, assessing molecular expression in vascular diseases, and tracking labeled stem cells.
Keywords: 19F MRI, perfluorocarbon nanoparticles, tumor oxygenation, molecular imaging, stem cells
Magnetic resonance imaging (MRI) is a powerful medical imaging modality with excellent sof-tissue contrast. MRI also provides a number of quantitative measures for unbiased assessment of tissue physiology and pathology. Quantitative MRI typically utilizes two approaches: 1) quantification of the intrinsic MR parameters (e.g., spin-lattice relaxation rate R1) of imaging moieties through fitting detected MR signal to a mathematical model; 2) determination of the absolute quantity of imaging moieties based on the registered MR signal intensity. While the first category of quantitative MRI can be achieved with any nucleus exhibiting a magnetic resonance effect, the second category is primarily restricted to those nuclei with no background tissue signal, such as fluorine (19F).
The feasibility of 19F MRI was first demonstrated by Holland and colleagues [6] four years after the development of 1H MRI [7]. 19F has 100% natural abundance, a spin of ½, and a gyromagnetic ratio of 40.08 MHz/T (slightly lower than the 42.58 MHz/T of 1H), resulting in 83% of the sensitivity of 1H [8, 9]. Additionally, the chemical shift of 19F is sensitive to the molecular environment of its nucleus because of the seven outer-shell electrons of 19F atom (as compared to only one electron of 1H). The 19F spectroscopic signature manifests a range of > 200 ppm [10, 11] (Fig. 1A), which permits unambiguous identification of distinctive 19F-containing compounds with 19F MRI. Finally, in contrast to the prominent 1H signal from mobile water in biological tissue, only trace amounts of 19F (< 10−6 M) are present in tissue, i.e., these being immobilized in solid phase in the teeth and bones [12]. For practical purposes, no background 19F MR signal exists in vivo. Thus, 19F is a preferred probe for quantitative MR applications because of its high sensitivity, unique spectroscopic signature, and no tissue background. This review will focus on studies involving 19F imaging. The role of 19F in quantitative MR spectroscopy is beyond the scope of this review and comprehensive reviews that summarize current knowledge on this topic have been published [13, 14].
Figure 1.

(A) Representative 19F spectrum of PFPE and PFOB nanoparticles shows the chemical shift of 19F signatures. The single PFPE peak and five discernible PFOB peaks are easily detected and individually resolved. (B) Chemical structure of PFPE shows its twenty 19F atoms. (C) Schematic of a PFPE nanoparticle functionalized with homing ligands in the outer phospholipid monolayer (shown in green). The PFPE nanoparticle provides 1H MR contrast by its surface payload of ~90,000 Gd3+ (shown in gold) and 19F MR contrast by ~100M 19F in its core. (From Morawski et al. [1] and Southworth et al. [2].)
PERFLUOROCARBON AS A USEFUL COMPOUND FOR QUANTITATIVE 19F MRI
Perfluorocarbons (PFCs) are a group of 19F-containing compounds derived from hydrocarbons by complete substitution of 1H with 19F [15] (Fig. 1B). PFCs are non toxic and biologically stable. After in vivo administration, PFCs are not metabolized by the tissue but cleared by circulation and then in large part vaporized to the air through respiration. Because of their high payload of 19F atoms, PFCs are the most frequently used compounds for 19F MRI [16, 17].
For biological applications, PFCs are typically emulsified into a nanoparticle form (nominal size ranging from < 100 nm to several hundreds of nm [18]) to overcome their hydrophobic and lipophobic constraints on preparation (Fig. 1C). A typical PFC nanoparticle emulsion formulated in our lab contains 40% (v/v) perfluorooctylbromide (PFOB), 2% (w/v) safflower oil, 2% (w/v) of surfactant commixture, 1.7% (w/v) glycerin, and water balance [19]. Each formulated PFC nanoparticle comprises a liquid PFC core encapsulated by a lipid monolayer, resulting in a high concentration of 19F atoms (~ 100 M) for 19F MRI at both clinical (e.g., 1.5T) and research (e.g., 9.4T) field strengths [20, 21]. Intravenously administrated PFC nanoparticles do not leak out of intact vasculature because of the relatively large particle size. Instead, PFC nanoparticles are removed from the blood stream primarily by the reticuloendothelial system and macrophage endocytosis that eventually expelled out of the lung through gaseous exchange. Blood half-life of PFC nanoparticles varies with particle size [18] with a typical value of 2–12 hours [22, 23].
Plain PFC nanoparticles can be functionalized with various agents for molecular imaging of vascular disease [24]. Multiple copies of binding ligands can be covalently or noncovalently linked to the particle surface for targeted binding to molecular epitopes in diseased regions, such as cancer angiogenesis, atherosclerotic plaques, and renal inflammation [25]. The particle surface also can be complexed with other imaging contrast agents (e.g., fluorescent lipids) for multi-modality imaging [26]. Finally, the lipid membrane of PFC nanoparticles can dissolve lipophilic drugs (e.g., fumagillin) for targeted drug delivery [27]. Overall, functionalized PFC nanoparticles enabled a wide variety 19F MRI applications.
APPLICATIONS
Assessing regional tumor hypoxia by 19F MRI pO2 mapping
Tumor hypoxia is a major therapeutic target in oncology [28–31]. Regional hypoxia is common in solid tumor because of the poorly organized tumor vasculature and the high oxygen demand of proliferative tumor cells. Hypoxic tumor cells are more resistant to radiotherapy and chemotherapy than well-oxygenated tumor cells [32]. Thus, non-invasive assessment of tumor hypoxia is critical for advancing tumor diagnosis and therapy [33, 34].
Quantitative 19F MRI of PFCs is the most extensively explored MRI method for in vivo mapping tumor oxygenation [15]. Although 1H MRI methods, such as blood oxygen level dependent (BOLD) MRI that utilizes T2* difference between paramagnetic deoxyhemoglobin and diamagnetic oxyhemoglobin [35], can achieve high spatial and temporal resolution to map tissue oxygenation without the need of exogenous agents, the detected change in blood oxygenation does not necessarily reflect tissue hypoxia. In contrast, PFCs can carry a high payload of O2 and possess a fast gas exchange rate with surrounding tissue through free diffusion [15]. Because of the paramagnetic effect of O2 [36], the partial pressure of dissolved O2 (pO2) in PFCs is linearly correlated with the 19F1 R of PFCs at a given temperature. Thus, MR determined 19F1 R of PFCs provides a non-invasive measure of tissue oxygenation when temperature is tightly controlled [37]. For certain PFCs exhibiting minimal sensitivity to physiological temperature variations within [30 – 42°C], such as hexafluorobenzene (HFB) and perfluoropolyether (PFPE), tissue oxygenation can be derived directly using the quantified 19F R1 and a priori calibrated R1 - pO2 curve [38]. The precision of the 19F MRI method can reach 1–3 mmHg in hypoxic region [39]. It has been shown that tumor pO2 measured by 19F MRI is comparable to that measured with fine electrode [40], fiberoptics [41], and near-infrared spectroscopy [42, 43].
Both PFCs and PFC nanoparticles have been used for assessing tumor oxygenation with 19F MRI. PFC nanoparticles administrated systematically can be sequestered in tumors, which is a method entailing minimal tissue damage [44, 45]. However, the major limitation of this method is that blood delivered PFC nanoparticles are primarily concentrated in well-vascularized tumor area instead of the poorly perfused hypoxic area, resulting in erroneous overestimation of tumor pO2 [46]. To avoid this problem, PFCs have been directly injected into different tumor regions to achieve a comprehensive spatial measure of pO2 [23, 39, 47]. Alternatively, PFCs can be enclosed in gas-permeable alginate capsules and implanted together with tumor cells to produce a stable pO2 readout [48] that can persist for up to 2 years [49].
Fast 19F MRI techniques, such as fluorocarbon relaxometry using echo planar imaging for dynamic oxygen mapping (FREDOM), have been developed for dynamic mapping of tumor pO2 [50, 51]. Using these techniques, heterogeneous distributions of pO2 was observed both within tumors and between large and small tumors [23]. The measured tumor pO2 exhibited a strong correlation with tumor size [41, 52, 53] except in a few reports [54]. Interestingly, oxygen inhalation only transiently elevated pO2 in some but not all types of tumors [4, 39, 43](Fig. 2). It was demonstrated that successful elevation of tumor pO2 during radiation therapy correlates with delayed tumor development [4], thus validating the usefulness of tumor pO2 mapping for prediction of therapeutic response.
Figure 2.
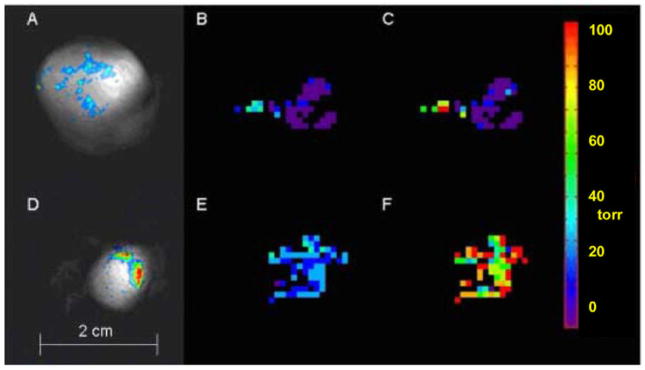
FREDOM determined pO2 maps of two representative AT1 tumors in rats. The pO2 value was calculated pixel-by-pixel based on the quantified 19F R1 and a priori calibrated 19F R1 - pO2 curve of HFB. (A and D) Composite 19F (displayed in color) and 1H (displayed in grayscale) MR images show HFB distribution in a large tumor (A, 3.6 cm3) and a small tumor (D, 1 cm3). (B and E) Baseline pO2 maps show higher pO2 in the small tumor when both animals were breathing air. Mean pO2 of large and small tumors were 0.1 ± 1.8 torr and 25.4 ± 1.1 torr, respectively. (C and F) Tumor pO2 maps of same animals obtained at 24 minutes after oxygen breathing, mean pO2 of large and small tumors were 8.1 ± 4.5 torr and 90.6 ± 3.9 torr, respectively. Both values were significantly higher than that of baseline (p < 0.01). (From Bourke et al. [4].)
In summary, 19F MRI of PFC facilitated pO2 mapping has been demonstrated in animal models at clinically achievable field strength (< 7T). Future translation of this technique to human will improve tumor prognosis and help predict the therapeutic response in patients.
Molecular 19F MRI with site-targeted PFC nanoparticles
The unique capability of 19F MRI to directly determine the absolute quantity of 19F atoms has been largely unexploited until very recently, primarily due to lack of a method for non-invasively delivering PFC nanoparticles to region of interest. Fortunately, functionalized PFC nanoparticles that are specifically targeted to vascular diseases and cancers have been employed experimentally for over a decade [24]. In the first stage, these particles carried paramagnetic agents for 1H MRI, and the binding of particles to region of interest was determined by the local proton signal enhancement relative to the native tissue contrast [26]. Thus, it is reasonable to expect that targeted delivery of functionalized PFC nanoparticles will also result in regional accumulation of 19F atoms above minimally required concentration for 19F MRI.
Neubauer et al. first reported a quantitative 19F MRI assessment of functionalized PFC nanoparticles [1]. Using fibrin-targeted PFC nanoparticles, the results showed that the bound particles on the surface of fibrin clots provided enough 19F atoms for 19F MRI at 4.7T field strength. Additionally, a linear relationship between the quantity of bound 19F atoms and the measured 19F MR signal was confirmed for functionalized PFC nanoparticles (Fig. 3A). By applying an external reference standard of 19F-containing compound that possesses different spectroscopic signature (Fig. 3B), the bound PFC nanoparticles on fibrin clot surface was quantitatively mapped with 19F MRI using the following equation:
where k is a constant calibrated a priori, representing the ratio between 19F MR signal of PFC nanoparticles and 19F MR signal of reference standard containing equal number of 19F atoms (Fig. 3C).
Figure 3.
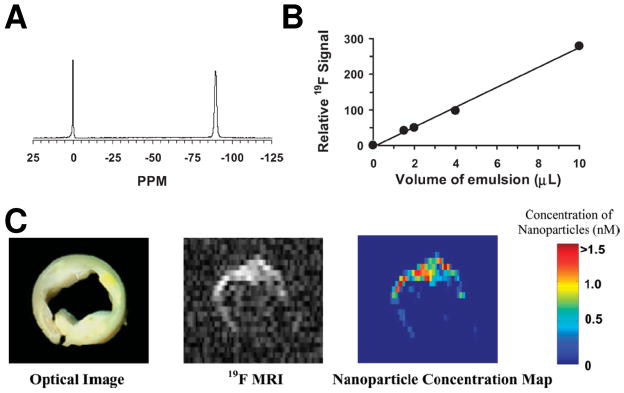
(A) A representative 19F spectrum of PFPE nanoparticle emulsion (−90 ppm) and trichlorofluormethane reference standard (0 ppm) acquired at 4.7 T. (B) The calibration curve for PFPE nanoparticle emulsion shows a linear relationship between the quantity of PFC nanoparticles and 19F signal intensity. (C) Left: An optical image of a human carotid endarterectomy sample shows moderate luminal narrowing and several atherosclerotic lesions. Middle: A 19F projection image acquired through the entire thickness of carotid artery sample shows high 19F signal along the lumen because of the binding of nanoparticles to fibrin. Right: The calculated concentration map of bound nanoparticles in the carotid sample based on 19F signal intensity in each voxel and the calibrated standard curve in (B). (From Morawski et al. [1].)
The later work of Caruthers et al. from the same group showed that the binding of functionalized PFOB and PFPE nanoparticles to biological specimen could be simultaneously or selectively assessed with 19F MRI at 1.5T field strength, validating the feasibility of this 19F MRI method for phenotypic characterization of pathological biosignatures in clinical settings [20]. Neubauer et al. further showed that incorporation of paramagnetic gadolinium (Gd3+) on PFC nanoparticles increased 19F1 R by four fold, resulting in up to 125% higher 19F signal intensity at 1.5T field strength [55]. However, direct mixing Gd3+ (up to 250 mM) in PFC nanoparticle emulsion has no detectable effect on 19F R1, suggesting Gd3+ must be in very close proximity to the PFC core of nanoparticles to affect 19F R1.
Recently, the potential for using quantitative 19F MRI of functionalized PFC nanoparticles to delineate vascular diseases was assessed in ex vivo studies. In a rabbit model of atherosclerotic valve angiogenesis, Waters et al. reported that valve leaflets of rabbits treated with αvβ3-integrin targeted PFC nanoparticles exhibited ~3 times higher 19F signal than valve leaflets treated with untargeted nanoparticles, suggesting the specific binding αvβ3-integrin targeted PFC nanoparticles to valve angiogenesis [56]. Southworth et al. produced further evidence for molecular 19F MRI of functionalized PFC nanoparticles in the kidneys of ApoE-knockout mice, an animal model of renal inflammation. In this case, ApoE-knockout mice treated with vascular cell adhesion molecular 1 (VCAM-1) targeted PFC nanoparticles exhibited substantial higher kidney 19F signal than ApoE-knockout mice treated with non-targeted PFC nanoparticles and control C57BL/6 mice treated with VCAM-1 targeted or non-targeted PFC nanoparticles, reflecting up regulated VCAM-1 expression in the kidneys of ApoE-knockout mice [2].
However, in vivo quantitative 19F MRI of site-targeted PFC nanoparticles is not straightforward because of the background signal from unbound circulating nanoparticles in the blood pool. A potential solution of this problem that utilized diffusion weighted 19F MRI technique has been recently reported. This technique specifically detects 19F signal from bound nanoparticles by applying a pair of diffusion sensitizing gradients to selectively suppress 19F signal from unbound (flowing) PFC nanoparticles [5] (Fig. 4).
Figure 4.
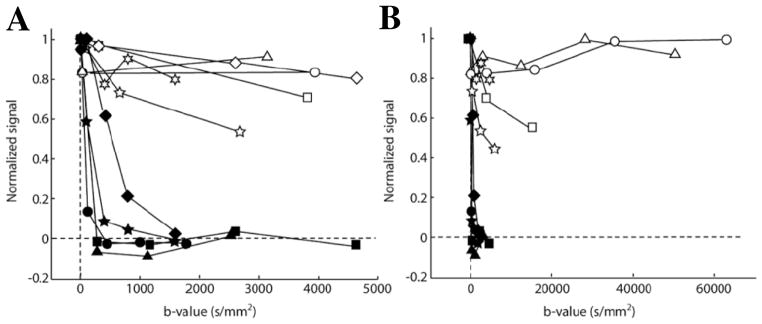
Diffusion weighted 19F signal in the ear of K14-HPV16 mice (open symbols), an animal model of squamous cell cancer with dysplastic lesions developed in the ear epidermis, and in the ear of control C57BL/6 mice (filled symbols). All animals were intravenously injected with of αvβ3-integrin targeted PFC nanoparticles before MRI. (A) Results acquired with modest b-values (i.e., an index of diffusion weighting) shows complete decay of 19F signal in control mouse ears when b-value > 1500 s/mm2. In contrast, a large fraction of 19F signal persisted in the ears of K14-HPV16 mice at all b-values, reflecting the specific binding of targeted nanoparticles to the ear neovasculature of K14-HPV16 mice. (B) Diffusion weighted 19F signal in the ears of K14-HPV16 mice persisted even when b-values > 10,000 s/mm2. (From Waters et al. [5].)
In summary, molecular 19F MRI of functionalized PFC nanoparticles has been demonstrated at both research (e.g., 11.7T) and clinical (e.g., 1.5T) field strengths. The site-targeted PFC nanoparticles are currently used in preclinical research. Clinical trials are expected within a few years.
In vivo stem cell trafficking using 19F MRI of intracellularly labeled PFC nanoparticles
Regenerative therapy using stem cells offers great promises for treating many types of diseases. The development of quantitative imaging methods to localize therapeutic stem cells in vivo is critical for noninvasive assessment of stem cell therapy [57]. Because of the excellent soft tissue contrast and readily available imaging contrast agents, 1H MRI has served as a primary method for stem cell trafficking [58, 59]. Typically, in vitro cultured stem cells are incubated with 1H MRI contrast agents, such as super-paramagnetic iron oxide or paramagnetic Gd-DTPA [60, 61], which results in uptake by endocytosis entailing the cells themselves to serve as imaging agents. Internalization of these contrast agents by stem cells generally requires transfection techniques or other adjunctive mechanical methods such as electroporation [62–64]. After in vivo administration, the labeled stem cells can be detected by 1H MRI based on the “negative” (i.e. dark) or “positive” (i.e. bright) contrast effects of the labeling agents. These 1H MRI techniques can detect as few as a single cell under certain circumstances [65].
It was recently shown that 19F MRI can be used as an alternative method for quantitative trafficking of stem cells in vivo [66]. The seminal work of Ahrens et al. demonstrated that PFPE nanoparticles could be effectively internalized by dendritic stem cells with the help of a cationic transfection agent [67]. The intracellular labeling of PFPE nanoparticles was proved to be a biologically safe and stable. After local injection or systematic delivery, the biodistribution of labeled cells could be specifically detected by 19F MRI at 11.7T. Subsequent work by our lab showed that PFC nanoparticles could be readily internalized by stem/progenitor cells without the need of transfection agent [3]. Using this technique, stem/progenitor cells can be labeled with multiple types of PFC (i.e., PFOB and PFPE) nanoparticles that can be rapidly detected by 19F MRI at both 1.5T and 11.7T field strengths (Fig. 5). In a recent study, Ruiz-Cabello et al. showed that PFPE nanoparticles with cationic surface charge could also be effectively internalized by neural stem cells without the need of transfection agents [21]. After in vivo administration into the mouse brain, the labeled cells remained viable and exhibited a constant19F signal that can be detected at 9.4T for up to one week, reflecting the stability and non-toxicity of this labeling technique.
Figure 5.

Localization of PFC nanoparticles labeled cells in mice using 19F MRI. (A) 19F MRI trafficking of stem/progenitor cells labeled with either PFOB (green) or PFPE (red) nanoparticles. Labeled cells were locally injected into the skeletal muscle of mouse thigh before MRI. (B–D) At 11.7T field strength, 19F spectral discrimination permits respective imaging of ~1×10⁶ PFOB-loaded cells (B) and PFPE-loaded cells (C). The composite 19F (displayed in color) and 1H (displayed in grayscale) image (D) reveals the location of PFOB labeled cells in the left leg and PFPE labeled cells in the right leg (dashed line indicates 3×3 cm2 field of view for 19F images). (E) Similarly, a 19F image acquired at 1.5T field strength shows 19F signal from ~4×10⁶ PFPE nanoparticles labeled cells. (F) The composite 19F and 1H image shows the location of PFPE nanoparticles labeled cells in a mouse thigh. Overall, the absence of background signal in 19F images (B, C, and E) enables unambiguous localization of PFC-containing cells at both 1.5 T and 11.7 T field strength. (From Partlow et al. [3].)
In vivo 19F MRI of the migration of PFPE nanoparticles labeled T cells has been reported by Ahrens and colleagues. The work of Srinivas et al. and Janjic et al. respectively demonstrated the homing of intraperitoneally injected T cells to the pancreas of diabetic mice and to the lymph nodes of BALB/c mice at 48 hours after cell injection [68, 69]. In a recent study by Srinivas et al., longitudinal19F MRI over 21 days delineated a dynamic accumulation of ovalbumin-specific T cells in the lymph node proximal to, but not distal to, the inflammatory region induced by focal chicken ovalbumin inoculation [70].
Despite the difference in the stem cell lines and labeling techniques, previous reports have delineated several common approaches for stem cell labeling and trafficking with 9F MRI: (1) intracellular labeling was confirmed by high resolution microscopy showing PFC nanoparticles within the cell cytosol; (2) the lack of cellular toxicity of internalized PFC nanoparticles was validated by the comparable viability, proliferation, and function between labeled cells and control cells; (3) the stability of cell labeling was reflected by the detectable 19F MR signal for up to 21 days post labeling; (4) after in vivo administration, labeled cells was specifically detected by 19F MRI based on their positive signal with no background; (5) the biodistribution of cells was visualized by overlaying 19F image of labeled cells on the 1H anatomical image acquired at the same location; (6) the local concentration of labeled cells was determined by quantitative 19F MRI. The primary limitation of this cell trafficking technique is its relative low sensitivity, i.e., a minimum of 2000 labeled cells are needed for detection with 19F MRI [3].
In summary, in vivo stem cell trafficking using 19F MRI of intracellularly labeled PFC nanoparticles is still restricted to preclinical research. Because of the low 19F signal intensity from individual labeled cell, MR experiments were mostly performed at high field strength (i.e., 9.4T and 11.7T) to improve the sensitivity of 19F MRI to labeled cells.
Other quantitative 19F MRI applications
Recently, 19F MRI of PFC nanoparticles has been used to detect cardiac and cerebral ischemia [71]. It was shown that intravenously administrated PFC nanoparticles were actively internalized by circulating monocytes/macrophages. After both acute cardiac and cerebral ischemia, the progressive accumulation of these immunocompetent cells in corresponding inflammatory areas was delineated on the composite 19F/1H image by overlaying the detected positive 19F signal on anatomical 1H image. The fast imaging time (~ 20 minutes) and high spatial resolution (~ 0.5 × 0.5 × 2 mm3) of 19F MRI suggested that this method could be applied to assess inflammatory diseases in general. However, the contracting viable myocardium may suffer motion induced 19F signal decay relative to the ischemic non-contracting myocardium and thus complicating MRI data interpretation.
Compounds other than PFCs have also been used for quantitative 19F MRI. For example, Higuchi et al. showed that 19F MRI using a 19F-containing amyloidophilic probe is more reliable than T1 and T2 weighted 1H MRI to detect amyloid β plaques in a mouse model of Alzheimer’s disease [72]. Additionally, Porcari showed 19F MRI delineated the biodistribution and pharmacokinetics of 19F-labeled boronophenylalanine, a carrier for Boron neutron capture therapy (BNCT), in rat glioma tumor [73, 74]. The results suggested that the ability to dynamically assess the concentration of boronophenylalanine in tumor may improve the outcome of BNCT by providing an estimation of optimal time for neutron irradiation [75]. Finally, fluorinated gases have been used in some studies to image and measure gas diffusion in lungs [76–78].
Conclusion
19F MRI is a promising quantitative medical imaging method for assessing the structure, function, and molecular display of various diseases. The ability to specifically detect administrated 19F-containing compounds without tissue background is a unique advantage over 1H MRI. Although 19F MRI was usually performed at relatively low spatial (millimeters) and temporal (minutes to hours) resolution because of low concentration of 19F atoms in region of interest, the improved MR sensitivity at higher field-strength (e.g., 7T) may overcome this limitation for translational application. Additionally, the development of functionalized PFC nanoparticles that can specifically accumulate in region of interest will also enhance the sensitivity 19F MRI. The major limitations of 19F MRI are the difficulties of approval for clinical use of 19F-containing agents and the requirement of additional hardware for registering the 19F nucleus on existing clinical 1H MR scanners.
In summary, quantitative 19F MRI has been applied to assess tumor pO2 for disease prognosis and optimization of therapy, to image vascular diseases with site-targeted PFC nanoparticles, and to monitor stem cell migration and proliferation. Because of the long blood half-life of PFC nanoparticles, novel imaging methods that can effectively suppress 19F signal from circulating PFC nanoparticles need to be developed to enable specific and dynamic assessment of PFC accumulation in region of interest. The continuous improvement in MR hardware and software will eventually permit widespread molecular imaging of 19F contrast agents on all imaging platforms.
References
- 1.Morawski AM, Winter PM, Yu X, Fuhrhop RW, Scott MJ, Hockett F, Robertson JD, Gaffney PJ, Lanza GM, Wickline SA. Quantitative “magnetic resonance immunohistochemistry” with ligand-targeted (19)F nanoparticles. Magn Reson Med. 2004;52(6):1255–1262. doi: 10.1002/mrm.20287. [DOI] [PubMed] [Google Scholar]
- 2.Southworth R, Kaneda M, Chen J, Zhang L, Zhang H, Yang X, Razavi R, Lanza G, Wickline SA. Renal vascular inflammation induced by Western diet in ApoE-null mice quantified by (19)F NMR of VCAM-1 targeted nanobeacons. Nanomedicine. 2009;5(3):359–367. doi: 10.1016/j.nano.2008.12.002. [DOI] [PMC free article] [PubMed] [Google Scholar]
- 3.Partlow KC, Chen J, Brant JA, Neubauer AM, Meyerrose TE, Creer MH, Nolta JA, Caruthers SD, Lanza GM, Wickline SA. 19F magnetic resonance imaging for stem/progenitor cell tracking with multiple unique perfluorocarbon nanobeacons. FASEB J. 2007;21(8):1647–1654. doi: 10.1096/fj.06-6505com. [DOI] [PubMed] [Google Scholar]
- 4.Bourke VA, Zhao D, Gilio J, Chang CH, Jiang L, Hahn EW, Mason RP. Correlation of radiation response with tumor oxygenation in the Dunning prostate R3327-AT1 tumor. Int J Radiat Oncol Biol Phys. 2007;67(4):1179–1186. doi: 10.1016/j.ijrobp.2006.11.037. [DOI] [PMC free article] [PubMed] [Google Scholar]
- 5.Waters EA, Chen J, Yang X, Zhang H, Neumann R, Santeford A, Arbeit J, Lanza GM, Wickline SA. Detection of targeted perfluorocarbon nanoparticle binding using 19F diffusion weighted MR spectroscopy. Magn Reson Med. 2008;60(5):1232–1236. doi: 10.1002/mrm.21794. [DOI] [PMC free article] [PubMed] [Google Scholar]
- 6.Holland GN, Bottomley PA, Hinshaw WS. 19F Magnetic Resonance Imaging. J Magn Reson. 1977;28:133–136. [Google Scholar]
- 7.Lauterbur PC. Image Formation by Induced Local Interactions: Examples Employing Nuclear Magnetic Resonance. Nature. 1973;242:190–191. [PubMed] [Google Scholar]
- 8.Bachert P. Pharmacokinetics using fluorine NMR in vivo. Prog Nucl Magn Reson Spectrosc. 1998;33:1–56. [Google Scholar]
- 9.Reid DG, Murphy PS. Fluorine magnetic resonance in vivo: a powerful tool in the study of drug distribution and metabolism. Drug Discov Today. 2008;13(11–12):473–480. doi: 10.1016/j.drudis.2007.12.011. [DOI] [PubMed] [Google Scholar]
- 10.Kaneda MM, Caruthers S, Lanza GM, Wickline SA. Perfluorocarbon Nanoemulsions for Quantitative Molecular Imaging and Targeted Therapeutics. Ann Biomed Eng. 2009;37(10):1922–1933. doi: 10.1007/s10439-009-9643-z. [DOI] [PMC free article] [PubMed] [Google Scholar]
- 11.Wolf W, Presant CA, Waluch V. 19F-MRS studies of fluorinated drugs in humans. Adv Drug Deliv Rev. 2000;41(1):55–74. doi: 10.1016/s0169-409x(99)00056-3. [DOI] [PubMed] [Google Scholar]
- 12.Code RF, Harrison JE, McNeill KG, Szyjkowski M. In vivo 19F spin relaxation in index finger bones. Magn Reson Med. 1990;13(3):358–369. doi: 10.1002/mrm.1910130303. [DOI] [PubMed] [Google Scholar]
- 13.Yu JX, Kodibagkar VD, Cui W, Mason RP. 19F: a versatile reporter for non-invasive physiology and pharmacology using magnetic resonance. Curr Med Chem. 2005;12(7):819–848. doi: 10.2174/0929867053507342. [DOI] [PubMed] [Google Scholar]
- 14.Yu JX, Cui W, Zhao D, Mason RP. Non-invasive physiology and pharmacology using 19F magnetic resonance. In: Tressaud A, Haufe G, editors. Fluorine And Health: Molecular Imaging, Biomedical Materials And Pharmaceuticals. Elsevier Science & Technology; 2008. pp. 198–276. [Google Scholar]
- 15.Spiess BD. Perfluorocarbon emulsions as a promising technology: a review of tissue and vascular gas dynamics. J Appl Physiol. 2009;106(4):1444–1452. doi: 10.1152/japplphysiol.90995.2008. [DOI] [PubMed] [Google Scholar]
- 16.Thomas SR, Clark LC, Ackerman JL, RPratt RG, Hoffmann RE, Busse LJ, Kinsey RA, Samaratunga RC. MR imaging of the lung using liquid perfluorocarbons. J Comput Assist Tomogr. 1986;10(1):1–9. doi: 10.1097/00004728-198601000-00001. [DOI] [PubMed] [Google Scholar]
- 17.Mattrey RF, Long DC. Potential role of PFOB in diagnostic imaging. Invest Radiol. 1988;23(Suppl 1):S298–301. doi: 10.1097/00004424-198809001-00066. [DOI] [PubMed] [Google Scholar]
- 18.Keipert PE, Otto S, Flaim SF, Weers JG, Schutt EA, Pelura TJ, Klein DH, Yaksh TL. Influence of perflubron emulsion particle size on blood half-life and febrile response in rats. Artif Cells Blood Substit Immobil Biotechnol. 1994;22(4):1169–1174. doi: 10.3109/10731199409138812. [DOI] [PubMed] [Google Scholar]
- 19.Morawski AM, Winter PM, Crowder KC, Caruthers SD, Fuhrhop RW, Scott MJ, Robertson JD, Abendschein DR, Lanza GM, Wickline SA. Targeted nanoparticles for quantitative imaging of sparse molecular epitopes with MRI. Magn Reson Med. 2004;51(3):480–486. doi: 10.1002/mrm.20010. [DOI] [PubMed] [Google Scholar]
- 20.Caruthers SD, Neubauer AM, Hockett FD, Lamerichs R, Winter PM, Scott MJ, Gaffney PJ, Wickline SA, Lanza GM. In vitro demonstration using 19F magnetic resonance to augment molecular imaging with paramagnetic perfluorocarbon nanoparticles at 1.5 Tesla. Invest Radiol. 2006;41(3):305–312. doi: 10.1097/01.rli.0000199281.60135.6a. [DOI] [PubMed] [Google Scholar]
- 21.Ruiz-Cabello J, Walczak P, Kedziorek DA, Chacko VP, Schmieder AH, Wickline SA, Lanza GM, Bulte JW. In vivo “hot spot” MR imaging of neural stem cells using fluorinated nanoparticles. Magn Reson Med. 2008;60(6):1506–1511. doi: 10.1002/mrm.21783. [DOI] [PMC free article] [PubMed] [Google Scholar]
- 22.Fan X, River JN, Muresan AS, Popescu C, Zamora M, Culp RM, Karczmar GS. MRI of perfluorocarbon emulsion kinetics in rodent mammary tumours. Phys Med Biol. 2006;51(2):211–220. doi: 10.1088/0031-9155/51/2/002. [DOI] [PubMed] [Google Scholar]
- 23.Zhao D, Jiang L, Mason RP. Measuring changes in tumor oxygenation. Methods Enzymol. 2004;386:378–418. doi: 10.1016/S0076-6879(04)86018-X. [DOI] [PubMed] [Google Scholar]
- 24.Lanza GM, Wallace KD, Scott MJ, Cacheris WP, Abendschein DR, Christy DH, Sharkey AM, Miller JG, Gaffney PJ, Wickline SA. A novel site-targeted ultrasonic contrast agent with broad biomedical application. Circulation. 1996;94(12):3334–3340. doi: 10.1161/01.cir.94.12.3334. [DOI] [PubMed] [Google Scholar]
- 25.Wickline SA, Neubauer AM, Winter P, Caruthers S, Lanza G. Applications of nanotechnology to atherosclerosis, thrombosis, and vascular biology. Arterioscler Thromb Vasc Biol. 2006;26(3):435–441. doi: 10.1161/01.ATV.0000201069.47550.8b. [DOI] [PubMed] [Google Scholar]
- 26.Winter PM, Morawski AM, Caruthers SD, Fuhrhop RW, Zhang H, Williams TA, Allen JS, Lacy EK, Robertson JD, Lanza GM, Wickline SA. Molecular imaging of angiogenesis in early-stage atherosclerosis with alpha(v)beta3-integrin-targeted nanoparticles. Circulation. 2003;108(18):2270–2274. doi: 10.1161/01.CIR.0000093185.16083.95. [DOI] [PubMed] [Google Scholar]
- 27.Winter PM, Neubauer AM, Caruthers SD, Harris TD, Robertson JD, Williams TA, Schmieder AH, Hu G, Allen JS, Lacy EK, Zhang H, Wickline SA, Lanza GM. Endothelial alpha(v)beta3 integrin-targeted fumagillin nanoparticles inhibit angiogenesis in atherosclerosis. Arterioscler Thromb Vasc Biol. 2006;26(9):2103–2109. doi: 10.1161/01.ATV.0000235724.11299.76. [DOI] [PubMed] [Google Scholar]
- 28.Brown JM. The hypoxic cell: a target for selective cancer therapy--eighteenth Bruce F Cain Memorial Award lecture. Cancer Res. 1999;59(23):5863–5870. [PubMed] [Google Scholar]
- 29.Kennedy KA, Teicher BA, Rockwell S, Sartorelli AC. The hypoxic tumor cell: a target for selective cancer chemotherapy. Biochem Pharmacol. 1980;29(1):1–8. doi: 10.1016/0006-2952(80)90235-x. [DOI] [PubMed] [Google Scholar]
- 30.Kizaka-Kondoh S, Inoue M, Harada H, Hiraoka M. Tumor hypoxia: a target for selective cancer therapy. Cancer Sci. 2003;94(12):1021–1028. doi: 10.1111/j.1349-7006.2003.tb01395.x. [DOI] [PMC free article] [PubMed] [Google Scholar]
- 31.Melillo G. Targeting hypoxia cell signaling for cancer therapy. Cancer Metastasis Rev. 2007;26(2):341–352. doi: 10.1007/s10555-007-9059-x. [DOI] [PubMed] [Google Scholar]
- 32.Davda S, Bezabeh T. Advances in methods for assessing tumor hypoxia in vivo: implications for treatment planning. Cancer Metastasis Rev. 2006;25(3):469–480. doi: 10.1007/s10555-006-9009-z. [DOI] [PubMed] [Google Scholar]
- 33.Krohn KA, Link JM, Mason RP. Molecular imaging of hypoxia. J Nucl Med. 2008;49(Suppl 2):129S–148S. doi: 10.2967/jnumed.107.045914. [DOI] [PubMed] [Google Scholar]
- 34.Mason RP, Ran S, Thorpe PE. Quantitative assessment of tumor oxygen dynamics: molecular imaging for prognostic radiology. J Cell Biochem Suppl. 2002;39:45–53. doi: 10.1002/jcb.10404. [DOI] [PubMed] [Google Scholar]
- 35.Haacke EM, Lai S, Yablonskiy DA, Lin W. In vivo validation of the bold mechanism: A review of signal changes in gradient echo functional MRI in the presence of flow. Int J Imaging Syst Technol. 1995;6(2–3):153–163. [Google Scholar]
- 36.Parhami P, Fung BM. Fluorine-19 relaxation study of perfluoro chemicals as oxygen carriers. J Phys Chem. 1983;87(11):1928–1931. [Google Scholar]
- 37.Zhang W, Ito Y, Berlin E, Roberts R, Berkowitz BA. Role of hypoxia during normal retinal vessel development and in experimental retinopathy of prematurity. Invest Ophthalmol Vis Sci. 2003;44(7):3119–3123. doi: 10.1167/iovs.02-1122. [DOI] [PubMed] [Google Scholar]
- 38.Kodibagkar VD, Wang X, Mason RP. Physical principles of quantitative nuclear magnetic resonance oximetry. Front Biosci. 2008;13:1371–1384. doi: 10.2741/2768. [DOI] [PubMed] [Google Scholar]
- 39.Zhao D, Ran S, Constantinescu A, Hahn EW, Mason RP. Tumor oxygen dynamics: correlation of in vivo MRI with histological findings. Neoplasia. 2003;5(4):308–318. doi: 10.1016/S1476-5586(03)80024-6. [DOI] [PMC free article] [PubMed] [Google Scholar]
- 40.Mason RP, Constantinescu A, Hunjan S, Le D, Hahn EW, Antich PP, Blum C, Peschke P. Regional tumor oxygenation and measurement of dynamic changes. Radiat Res. 1999;152(3):239–249. [PubMed] [Google Scholar]
- 41.Zhao D, Constantinescu A, Hahn EW, Mason RP. Tumor oxygen dynamics with respect to growth and respiratory challenge: investigation of the Dunning prostate R3327-HI tumor. Radiat Res. 2001;156(5 Pt 1):510–520. doi: 10.1667/0033-7587(2001)156[0510:todwrt]2.0.co;2. [DOI] [PubMed] [Google Scholar]
- 42.Kim JG, Zhao D, Song Y, Constantinescu A, Mason RP, Liu H. Interplay of tumor vascular oxygenation and tumor pO2 observed using near-infrared spectroscopy, an oxygen needle electrode, and 19F MR pO2 mapping. J Biomed Opt. 2003;8(1):53–62. doi: 10.1117/1.1527049. [DOI] [PubMed] [Google Scholar]
- 43.Xia M, Kodibagkar V, Liu H, Mason RP. Tumour oxygen dynamics measured simultaneously by near-infrared spectroscopy and 19F magnetic resonance imaging in rats. Phys Med Biol. 2006;51(1):45–60. doi: 10.1088/0031-9155/51/1/004. [DOI] [PubMed] [Google Scholar]
- 44.Mason RP, Antich PP, Babcock EE, Constantinescu A, Peschke P, Hahn EW. Non-invasive determination of tumor oxygen tension and local variation with growth. Int J Radiat Oncol Biol Phys. 1994;29(1):95–103. doi: 10.1016/0360-3016(94)90231-3. [DOI] [PubMed] [Google Scholar]
- 45.Mason RP, Antich PP, Babcock EE, Gerberich JL, Nunnally RL. Perfluorocarbon imaging in vivo: a 19F MRI study in tumor-bearing mice. Magn Reson Imaging. 1989;7(5):475–485. doi: 10.1016/0730-725x(89)90402-5. [DOI] [PubMed] [Google Scholar]
- 46.McIntyre DJO, McCoy CL, Griffiths JR. Tumor oxygen measurement by 19F magnetic resonance imaging of perfluorocarbons. Curr Sci. 1999;76:753–762. [Google Scholar]
- 47.Zhao D, Constantinescu A, Jiang L, Hahn EW, Mason RP. Prognostic radiology: quantitative assessment of tumor oxygen dynamics by MRI. Am J Clin Oncol. 2001;24(5):462–466. doi: 10.1097/00000421-200110000-00010. [DOI] [PubMed] [Google Scholar]
- 48.Noth U, Rodrigues LM, Robinson SP, Jork A, Zimmermann U, Newell B, Griffiths JR. In vivo determination of tumor oxygenation during growth and in response to carbogen breathing using 15C5-loaded alginate capsules as fluorine-19 magnetic resonance imaging oxygen sensors. Int J Radiat Oncol Biol Phys. 2004;60(3):909–919. doi: 10.1016/j.ijrobp.2004.07.671. [DOI] [PubMed] [Google Scholar]
- 49.Noth U, Grohn P, Jork A, Zimmermann U, Haase A, Lutz J. 19F-MRI in vivo determination of the partial oxygen pressure in perfluorocarbon-loaded alginate capsules implanted into the peritoneal cavity and different tissues. Magn Reson Med. 1999;42(6):1039–1047. doi: 10.1002/(sici)1522-2594(199912)42:6<1039::aid-mrm8>3.0.co;2-n. [DOI] [PubMed] [Google Scholar]
- 50.Hunjan S, Zhao D, Constantinescu A, Hahn EW, Antich PP, Mason RP. Tumor oximetry: demonstration of an enhanced dynamic mapping procedure using fluorine-19 echo planar magnetic resonance imaging in the Dunning prostate R3327-AT1 rat tumor. Int J Radiat Oncol Biol Phys. 2001;49(4):1097–1108. doi: 10.1016/s0360-3016(00)01460-7. [DOI] [PubMed] [Google Scholar]
- 51.Jordan BF, Cron GO, Gallez B. Rapid monitoring of oxygenation by 19F magnetic resonance imaging: Simultaneous comparison with fluorescence quenching. Magn Reson Med. 2009;61(3):634–638. doi: 10.1002/mrm.21594. [DOI] [PubMed] [Google Scholar]
- 52.Song Y, Constantinescu A, Mason RP. Dynamic breast tumor oximetry: the development of prognostic radiology. Technol Cancer Res Treat. 2002;1(6):471–478. doi: 10.1177/153303460200100607. [DOI] [PubMed] [Google Scholar]
- 53.Zhao D, Constantinescu A, Chang CH, Hahn EW, Mason RP. Correlation of tumor oxygen dynamics with radiation response of the dunning prostate R3327-HI tumor. Radiat Res. 2003;159(5):621–631. doi: 10.1667/0033-7587(2003)159[0621:cotodw]2.0.co;2. [DOI] [PubMed] [Google Scholar]
- 54.McNab JA, Yung AC, Kozlowski P. Tissue oxygen tension measurements in the Shionogi model of prostate cancer using 19F MRS and MRI. MAGMA. 2004;17(3–6):288–295. doi: 10.1007/s10334-004-0083-3. [DOI] [PubMed] [Google Scholar]
- 55.Neubauer AM, Myerson J, Caruthers SD, Hockett FD, Winter PM, Chen J, Gaffney PJ, Robertson JD, Lanza GM, Wickline SA. Gadolinium-modulated 19F signals from perfluorocarbon nanoparticles as a new strategy for molecular imaging. Magn Reson Med. 2008;60(5):1066–1072. doi: 10.1002/mrm.21750. [DOI] [PMC free article] [PubMed] [Google Scholar]
- 56.Waters EA, Chen J, Allen JS, Zhang H, Lanza GM, Wickline SA. Detection and quantification of angiogenesis in experimental valve disease with integrin-targeted nanoparticles and 19-fluorine MRI/MRS. J Cardiovasc Magn Reson. 2008;10(1):43. doi: 10.1186/1532-429X-10-43. [DOI] [PMC free article] [PubMed] [Google Scholar]
- 57.Ferreira L, Karp JM, Nobre L, Langer R. New Opportunities: The Use of Nanotechnologies to Manipulate and Track Stem Cells. Cell Stem Cell. 2008;3(2):136–146. doi: 10.1016/j.stem.2008.07.020. [DOI] [PubMed] [Google Scholar]
- 58.Budde MD, Frank JA. Magnetic tagging of therapeutic cells for MRI. J Nucl Med. 2009;50(2):171–174. doi: 10.2967/jnumed.108.053546. [DOI] [PMC free article] [PubMed] [Google Scholar]
- 59.Frank JA, Anderson SA, Kalsih H, Jordan EK, Lewis BK, Yocum GT, Arbab AS. Methods for magnetically labeling stem and other cells for detection by in vivo magnetic resonance imaging. Cytotherapy. 2004;6(6):621–625. doi: 10.1080/14653240410005267-1. [DOI] [PubMed] [Google Scholar]
- 60.Arbab AS, Yocum GT, Rad AM, Khakoo AY, Fellowes V, Read EJ, Frank JA. Labeling of cells with ferumoxides-protamine sulfate complexes does not inhibit function or differentiation capacity of hematopoietic or mesenchymal stem cells. NMR Biomed. 2005;18(8):553–559. doi: 10.1002/nbm.991. [DOI] [PubMed] [Google Scholar]
- 61.Modo M, Mellodew K, Cash D, Fraser SE, Meade TJ, Price J, Williams SC. Mapping transplanted stem cell migration after a stroke: a serial, in vivo magnetic resonance imaging study. Neuroimage. 2004;21(1):311–317. doi: 10.1016/j.neuroimage.2003.08.030. [DOI] [PubMed] [Google Scholar]
- 62.Daldrup-Link HE, Meier R, Rudelius M, Piontek G, Piert M, Metz S, Settles M, Uherek C, Wels W, Schlegel J, Rummeny EJ. In vivo tracking of genetically engineered, anti-HER2/neu directed natural killer cells to HER2/neu positive mammary tumors with magnetic resonance imaging. Eur Radiol. 2005;15(1):4–13. doi: 10.1007/s00330-004-2526-7. [DOI] [PubMed] [Google Scholar]
- 63.van den Bos EJ, Wagner A, Mahrholdt H, Thompson RB, Morimoto Y, Sutton BS, Judd RM, Taylor DA. Improved efficacy of stem cell labeling for magnetic resonance imaging studies by the use of cationic liposomes. Cell Transplant. 2003;12(7):743–756. doi: 10.3727/000000003108747352. [DOI] [PubMed] [Google Scholar]
- 64.Walczak P, Kedziorek DA, Gilad AA, Lin S, Bulte JW. Instant MR labeling of stem cells using magnetoelectroporation. Magn Reson Med. 2005;54(4):769–774. doi: 10.1002/mrm.20701. [DOI] [PubMed] [Google Scholar]
- 65.Shapiro EM, Sharer K, Skrtic S, Koretsky AP. In vivo detection of single cells by MRI. Magn Reson Med. 2006;55(2):242–249. doi: 10.1002/mrm.20718. [DOI] [PubMed] [Google Scholar]
- 66.Bulte JW. Hot spot MRI emerges from the background. Nat Biotechnol. 2005;23(8):945–946. doi: 10.1038/nbt0805-945. [DOI] [PubMed] [Google Scholar]
- 67.Ahrens ET, Flores R, Xu H, Morel PA. In vivo imaging platform for tracking immunotherapeutic cells. Nat Biotechnol. 2005;23(8):983–987. doi: 10.1038/nbt1121. [DOI] [PubMed] [Google Scholar]
- 68.Srinivas M, Morel PA, Ernst LA, Laidlaw DH, Ahrens ET. Fluorine-19 MRI for visualization and quantification of cell migration in a diabetes model. Magn Reson Med. 2007;58(4):725–734. doi: 10.1002/mrm.21352. [DOI] [PubMed] [Google Scholar]
- 69.Janjic JM, Srinivas M, Kadayakkara DK, Ahrens ET. Self-delivering nanoemulsions for dual fluorine-19 MRI and fluorescence detection. J Am Chem Soc. 2008;130(9):2832–2841. doi: 10.1021/ja077388j. [DOI] [PubMed] [Google Scholar]
- 70.Srinivas M, Turner MS, Janjic JM, Morel PA, Laidlaw DH, Ahrens ET. In vivo cytometry of antigen-specific t cells using 19F MRI. Magn Reson Med. 2009;62(3):747–753. doi: 10.1002/mrm.22063. [DOI] [PMC free article] [PubMed] [Google Scholar]
- 71.Flogel U, Ding Z, Hardung H, Jander S, Reichmann G, Jacoby C, Schubert R, Schrader J. In vivo monitoring of inflammation after cardiac and cerebral ischemia by fluorine magnetic resonance imaging. Circulation. 2008;118(2):140–148. doi: 10.1161/CIRCULATIONAHA.107.737890. [DOI] [PMC free article] [PubMed] [Google Scholar]
- 72.Higuchi M, Iwata N, Matsuba Y, Sato K, Sasamoto K, Saido TC. 19F and 1H MRI detection of amyloid beta plaques in vivo. Nat Neurosci. 2005;8(4):527–533. doi: 10.1038/nn1422. [DOI] [PubMed] [Google Scholar]
- 73.Porcari P, Capuani S, Campanella R, La Bella A, Migneco LM, Maraviglia B. Multi-nuclear MRS and 19F MRI of 19F-labelled and 10B-enriched p-boronophenylalanine-fructose complex to optimize boron neutron capture therapy: phantom studies at high magnetic fields. Phys Med Biol. 2006;51(12):3141–3154. doi: 10.1088/0031-9155/51/12/010. [DOI] [PubMed] [Google Scholar]
- 74.Porcari P, Capuani S, D’Amore E, Lecce M, La Bella A, Fasano F, Campanella R, Migneco LM, Pastore FS, Maraviglia B. In vivo (19)F MRI and (19)F MRS of (19)F-labelled boronophenylalanine-fructose complex on a C6 rat glioma model to optimize boron neutron capture therapy (BNCT) Phys Med Biol. 2008;53(23):6979–6989. doi: 10.1088/0031-9155/53/23/021. [DOI] [PubMed] [Google Scholar]
- 75.Porcari P, Capuani S, D’Amore E, Lecce M, La Bella A, Fasano F, Migneco LM, Campanella R, Maraviglia B, Pastore FS. In vivo(19)F MR imaging and spectroscopy for the BNCT optimization. Appl Radiat Isot. 2009 doi: 10.1016/j.apradiso.2009.03.065. [DOI] [PubMed] [Google Scholar]
- 76.Bierhals KA, Zheng Hu D, Zheng J, Yablonskiy DA, Woods JC, Gierada DS, Conradi MS. 19F MR imaging of ventilation and diffusion in excised lungs. Magn Reson Med. 2005;54(3):577–585. doi: 10.1002/mrm.20632. [DOI] [PubMed] [Google Scholar]
- 77.Kuethe DO, Caprihan A, Fukushima E, Waggoner RA. Imaging lungs using inert fluorinated gases. Magn Reson Med. 1998;39(1):85–88. doi: 10.1002/mrm.1910390114. [DOI] [PubMed] [Google Scholar]
- 78.Perez-Sanchez JM, Perez de Alejo R, Rodriguez I, Cortijo M, Peces-Barba G, Ruiz-Cabello J. In vivo diffusion weighted 19F MRI using SF6. Magn Reson Med. 2005;54(2):460–463. doi: 10.1002/mrm.20569. [DOI] [PubMed] [Google Scholar]