

Abstract
Background:
Fourier transform infrared (FTIR) microspectroscopy is a promising method for estimating the depth-wise composition of articular cartilage. The aim was to compare the specificity of two earlier introduced, presumably proteoglycan (PG)–specific FTIR parameters (i.e., absorption in the carbohydrate region with and without normalization with Amide I absorption) to estimate the reference PG content of normal and osteoarthritic human articular cartilage. This study is a direct continuation of our earlier studies, from which the presented data are reanalyzed.
Design:
Earlier, FTIR microspectroscopy, digital densitometry, histological analyses, and polarized light microscopy were conducted in vitro for articular cartilage samples of human patellae (n = 72). In the present study, earlier data were combined and statistically reanalyzed in a depth-wise manner to clarify the specificity of FTIR parameters introduced for the estimation of PG content of articular cartilage. Digital densitometry for Safranin O-stained samples was used to indicate reference PG content.
Results:
Direct absorption of the carbohydrate region estimated well the PG content in the middle and deep zones of articular cartilage and appeared to be superior compared to carbohydrate values normalized with Amide I absorption. However, in the superficial zone, the specificity of both FTIR-derived PG parameters was limited.
Conclusions:
Limitations of current FTIR-based PG parameters in the superficial zone of articular cartilage should be recognized and carefully taken into account in future studies using FTIR microspectroscopy for PG content estimation. Further research is needed to improve the specificity of FTIR parameters for the estimation of PG content of articular cartilage.
Keywords: Fourier transform infrared (FTIR) microspectroscopy, articular cartilage, proteoglycan content, specificity, depth-wise comparison
Introduction
In osteoarthritis (OA), articular cartilage undergoes dramatic changes in its composition.1 Fourier transform infrared (FTIR) microspectroscopy is a promising method for estimating the depth-wise composition of articular cartilage on a pixel-by-pixel basis. In FTIR microspectroscopy, absorption of infrared light is measured point by point within a microscopic tissue section, and infrared absorption spectrum is determined for each pixel. Different molecules in biological samples show typical absorption characteristics that can be used to detect and quantify the molecule of interest (e.g., proteoglycan [PG] and collagen in cartilage). At present, FTIR microspectroscopy is the only experimental technique enabling simultaneous measurement of depth-wise collagen and PG content.
In several studies using FTIR microspectroscopy, the collagen and PG contents of cartilage tissue have been determined.2-10 The most commonly used and simplest analysis technique is to directly calculate the areas under the absorbance spectrum. Specifically, areas under the Amide I peak (1585-1720 cm–1) and carbohydrate region (985-1140 cm–1) have been considered to estimate the collagen and PG contents, respectively.3 Furthermore, to reduce artifacts related to variation in thickness between the microscopic sections, Kim et al.6 suggested normalizing the absorbance in the carbohydrate region with that of the Amide I peak. Both of these PG parameters have been shown to correlate with the histologically or biochemically determined PG content.4,6 However, in human articular cartilage, we have earlier speculated that the use of a ratio parameter (i.e., ratio of carbohydrate to Amide I) includes more uncertainty than the direct area of the carbohydrate region, although actual reference data for the depth-wise distribution of PG content were not reported.1 Thus, comprehensive comparison of these two FTIR-derived PG parameters with the depth-wise reference data for the PG content has not been reported for human cartilage. Moreover, in a recent methodological study, the specificity of carbohydrate-based parameters was also clarified by enzymatically degrading the PGs in bovine cartilage tissue.11 That study concluded that specificity of current PG parameters may not be optimal, and these parameters seem to be somewhat affected by the collagen absorption.11 However, for human osteoarthritic cartilage, the depth-wise contribution of collagen absorption to FTIR-derived PG parameters is currently unknown.
The aim of this study was to compare the specificity of the two aforementioned FTIR microspectroscopical PG parameters to estimate the reference PG content of articular cartilage in a large sample material consisting of normal and osteoarthritic human tissue. Specifically, we aimed in answering the following questions: (1) when evaluating PG content with FTIR microspectroscopy, which one of the traditional parameters provides the best correspondence with the reference method (i.e., digital densitometry) in different tissue depths? (2) Should the absorbance in the carbohydrate region be normalized with that of the Amide I peak? (3) Are the current FTIR parameters sensitive enough to detect OA-related changes in the PG content? Furthermore, the contribution of collagen absorption to PG parameters was further clarified in this study.
Methods
Human Articular Cartilage Samples
In the present study, the experimental data from our earlier studies1,12 were combined and statistically reanalyzed in a depth-wise manner. The sample material consisted of human osteochondral samples (n = 72) from 14 patellae from the right knees of cadaveric human donors (aged 55 ± 18 years). Samples were prepared from 6 locations in each patella (superomedial, superolateral, central medial, central lateral, inferomedial, and inferolateral). After sample preparation, cartilage was detached from the subchondral bone and processed for FTIR microspectroscopy, histological analyses, polarized light microscopy, and digital densitometry.1,12
Histological Analyses
Histological grading was chosen as an indicator for OA progression.1,12 OA grade of all samples was assessed according to the Osteoarthritis Research Society International (OARSI) histopathology grading system with subgrades.13 Based on the OARSI grading, samples were divided into 3 groups: normal (n = 35, OARSI grade = 0), early OA (n = 15, OARSI grade = 1.0-1.5), and advanced OA (n = 22, OARSI grade = 2.0-4.5).
FTIR Microspectroscopy
For the evaluation of the PG and collagen contents, microscopic unstained sections (thickness = 3 µm) were used in FTIR microspectroscopy. Measurements were conducted with the PerkinElmer Spectrum Spotlight 300 imaging system (PerkinElmer, Shelton, CO) using the following measurement settings: spatial pixel resolution of 6.25 µm, spectral resolution of 4 cm–1, and acquired spectral region of 2000-670 cm–1. The depth-wise PG and collagen contents of the samples were estimated by measuring the integrated absorbance of the carbohydrate region (1140-985 cm–1) and Amide I peak (1585-1720 cm–1), respectively, from the pixel-wise infrared absorption spectrum.3 Furthermore, the ratio between the carbohydrate region and Amide I peak was calculated as a second indicator of the PG content.6
Digital Densitometry
Digital densitometry was used as a reference method to quantify the depth-wise PG distribution.12 Microscopic sections (thickness = 3 μm) were stained with Safranin O in standardized conditions (pH 4.6). The staining intensity of Safranin O in the microscopic sections was determined with a digital densitometer by quantifying optical density (OD) of the samples. OD is an index for a relative PG content.14,15 Three microscopic sections from each sample were analyzed and averaged to minimize error due to possible variation in section thickness.
Polarized Light Microscopy
To account for the presumably different zonal thicknesses between the groups in the PG content analysis, an enhanced polarized light microscopy (ePLM) system (Leitz Ortholux II POL, Leitz Wetzlar, Wetzlar, Germany) was used to estimate the relative thicknesses of superficial, middle, and deep zones in each OA group.1,16 Depth-dependent collagen fibril orientation and birefringence were calculated for each sample by averaging 3 parallel measurements, and the thickness of the superficial zone was estimated by combining this information. The interface between the middle and deep zones was localized at the point where the orientation curve reached the angle of close to 90° (perpendicular to cartilage surface). The estimation of the thickness of cartilage zones is described along with the schematic figure in an earlier study.17
Data Analysis
All data analyses were carried out using Matlab (version 7.2, MathWorks, Inc., Natick, MA) and SPSS (version 16, SPSS, Inc., Chicago, IL). The depth-wise profiles from FTIR microspectroscopy analyses (Amide I absorption, carbohydrate absorption, and carbohydrate/Amide I) and digital densitometry (OD) were extracted for each sample.1,12 All profiles were resampled to 100 points, and subsequently, FTIR microspectroscopical parameters were correlated point by point with a reference PG parameter (OD) in a depth-wise manner using Pearson’s correlation analysis. Furthermore, the differences between the linear Pearson’s correlation coefficients were statistically compared by using Fisher’s transform, as described by Steiger.18 A test was chosen so that two correlation coefficients were compared with each other at a time having one parameter in common, that is, the reference parameter for the PG content (OD). All depth-wise data were also averaged throughout the entire tissue depth to obtain bulk values for all samples and averaged within each structural zone to obtain zone-wise values.
The mixed linear model was used for statistical comparisons of the relative thicknesses of superficial, middle, and deep zones between the OA groups. In the model, OA group and sample location within the patella were set as fixed variables, and the cadaver was assigned as a random variable. Least significant difference (LSD) adjustment was used. More details of the mixed model for this sample set have been given in our recent study.1
Results
Visually, in all sample groups, reference PG parameter (OD) had a more abrupt slope and lower normalized values in the superficial zone than the FTIR-based PG parameters (Fig. 1).
Figure 1.
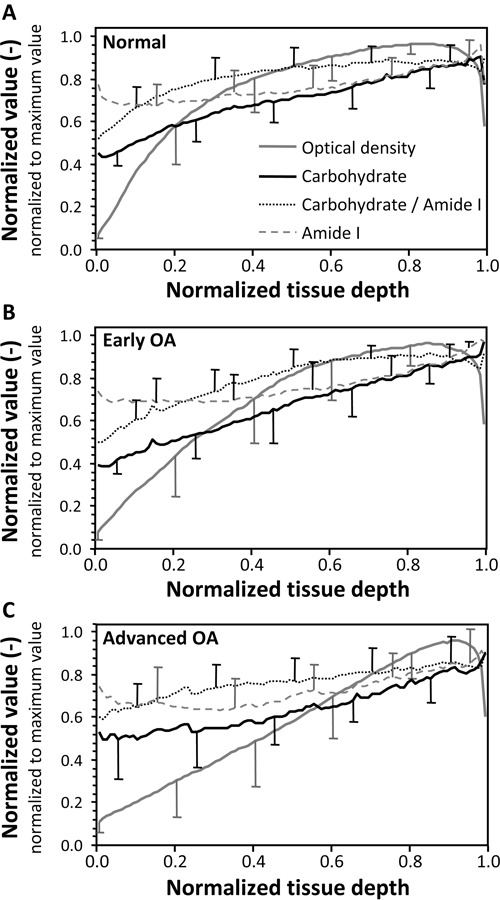
The mean depth-wise profiles of each Fourier transform infrared (FTIR) parameter (carbohydrate, Amide I, and carbohydrate/Amide I) and optical density (OD) within each sample group as normalized to their maximum value. (A) Normal samples, (B) early osteoarthritis (OA) samples, and (C) advanced OA samples. Standard deviations of the profiles have been indicated in the graphs.
Generally, it was observed that correlations were weak or mediocre in the superficial cartilage (~1%-10%), but they clearly increased when proceeding deeper in the tissue (Fig. 2). Correlations between the FTIR-derived PG parameters and OD were, in general, significantly (P < 0.05) higher than correlations between the Amide I absorption and OD. However, in advanced OA, the correlation between the Amide I absorption and OD was relatively high, and no significant differences existed when comparing with correlations between absorbance in the carbohydrate region and OD. The correlation between the carbohydrate/Amide I and OD was generally lower than between the nonnormalized carbohydrate region absorbance and OD. When pooling all the samples together, the correlation with OD seemed to be the highest with the carbohydrate region without normalization with the Amide I absorption.
Figure 2.
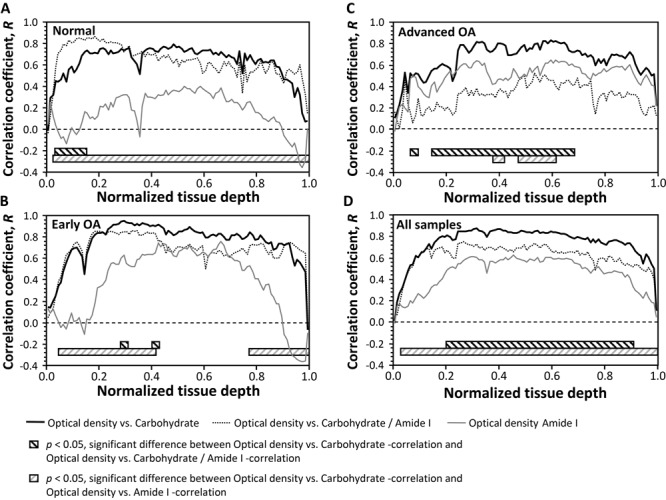
Depth-wise correlations between the optical density (OD) and Fourier transform infrared (FTIR) parameters as presented point by point for each osteoarthritis (OA) group and for whole-sample population. The statistical differences of the correlation coefficients between the OD and FTIR parameters are indicated with striped bars below the depth-wise correlation coefficients. (A) Normal samples, (B) early OA samples, (C) advanced OA samples, and (D) all samples pooled together.
The correlations between FTIR-derived PG parameters and OD after calculating bulk parameter values (averaged over the tissue depth) for all samples are reported in Table 1 and Figure 3. Generally, bulk correlations between the OD and carbohydrate region were better than between the OD and carbohydrate/Amide I. The correlations between the OD and Amide I absorption were relatively weak or mediocre in the normal and early OA groups. Instead, the OD versus Amide I correlation was relatively good in the advanced OA group.
Table 1.
Linear (Pearson’s) Correlation Coefficients (r) between the Fourier Transform Infrared–Derived Proteoglycan Parameters and the Optical Density (OD) in Each Structural Zone (Superficial, Middle, and Deep) and Averaged over the Entire Tissue Depth (Bulk)
| Group | Zone | Carbohydrate | Carbohydrate/Amide I | Amide I |
|---|---|---|---|---|
| Normal | Bulk | 0.709a | 0.700a | 0.224 |
| Superficial | 0.448a | 0.655a,b | 0.064 | |
| Middle | 0.721a | 0.820a | 0.191 | |
| Deep | 0.706a | 0.62 | 0.222 | |
| Early OA | Bulk | 0.864a | 0.747 | 0.495 |
| Superficial | 0.241 | 0.192 | 0.122 | |
| Middle | 0.822a | 0.805 | 0.312 | |
| Deep | 0.639a | 0.72 | 0.477 | |
| Advanced OA | Bulk | 0.762c | 0.318 | 0.605 |
| Superficial | 0.131 | 0.119 | 0.048 | |
| Middle | 0.615c | 0.203 | 0.512 | |
| Deep | 0.764c | 0.366 | 0.588 | |
| All samples | Bulk | 0.838a,c | 0.648 | 0.553 |
| Superficial | 0.297a | 0.312 | 0.096 | |
| Middle | 0.804a,c | 0.700a | 0.462 | |
| Deep | 0.828a,c | 0.671 | 0.523 |
OA = osteoarthritis.
Significantly higher r compared to that of the Amide I group (P < 0.05).
Significantly higher r compared to that of the carbohydrate group (P < 0.05).
Significantly higher r compared to that of the carbohydrate/Amide I group (P < 0.05).
Figure 3.

Scatter plots representing the linear correlation between the optical density (OD) and different Fourier transform infrared (FTIR) parameters: (A) OD versus carbohydrate absorption, (B) OD versus Amide I absorption, and (C) OD versus carbohydrate/Amide I. The different sample groups have been separated with different colors (white = normal, gray = early osteoarthritis [OA], and black = advanced OA). AU = absorption unit.
The mean relative thicknesses of the superficial, middle, and deep zones in each sample group are presented in Figure 4. The relative thickness of the superficial zone decreased significantly (P < 0.05) as OA progressed. In contrast, no significant changes in the relative thickness were observed in the middle zone. In the deep zone, a significant (P < 0.05) increase in the relative thickness was observed in advanced OA compared to normal samples.
Figure 4.
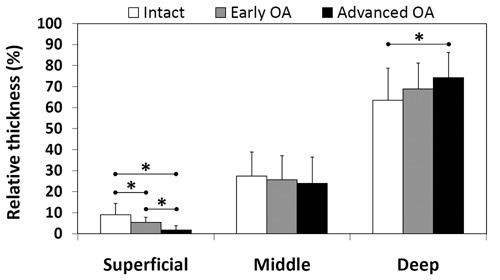
Relative thickness of superficial, middle, and deep zones in normal, early osteoarthritis (OA), and advanced OA groups. *P < 0.05; statistically significant difference between the sample groups (mixed linear model).
When comparing the zone-wise correlations between the FTIR-derived PG parameters and OD, the carbohydrate and carbohydrate/Amide I were rather similar in normal and early OA samples with the exception that the latter had a significantly (P < 0.05) stronger correlation with OD in the superficial zone (Table 1). In the advanced OA group as well as when all the samples were pooled together, the carbohydrate region absorbance correlated better with OD in the middle and deep zones compared to carbohydrate/Amide I. Overall, carbohydrate region absorbance showed significantly higher (P < 0.05) correlations with OD compared to Amide I in all groups except the advanced OA group and in the superficial zone of the early OA group (Table 1).
Discussion
In the present in vitro study, two different FTIR parameters, widely used for analysis of the PG content of articular cartilage, were compared in a depth-wise manner with the reference technique for PG determination (i.e., digital densitometry). The sample material consisted of both normal and osteoarthritic human articular cartilage. The results for the bulk parameter values of the whole tissue, as well as for the depth-wise values in the middle and deep zones, demonstrated good correlations between the FTIR-based PG parameters, especially direct absorbance in the carbohydrate region, and the reference technique (OD). However, in the superficial zone, correlations between the FTIR-based PG parameters with the reference values were relatively low in all OA groups. When considering this together with the fact that the mean normalized OD values in the superficial zone were also lower than the FTIR-based PG parameter values (Fig. 1), it can be concluded that the specificity of the currently investigated FTIR-based PG parameters is somewhat limited in the superficial tissue. This is consistent with our recent findings for bovine cartilage after enzymatic degradations.11 Consequently, it seems that in the superficial zone, where the PG content is at its lowest, also the collagen absorption has a small effect on the carbohydrate region of the infrared spectrum.
As might be expected,19 it was observed that the relative thickness of the superficial zone decreased as OA progressed. Furthermore, the relative thickness of the deep zone increased in advanced OA compared to normal samples. This increase was probably associated with the simultaneous wear of the superficial zone in advanced OA, as it also affects the relative thicknesses of other layers. Consequently, the present zone-wise thickness analysis supports the fact that the superficial zone is partly or completely vanished in severely osteoarthritic tissue due to superficial fraying, delamination, and disintegration. The varying thickness of the superficial layer should be recognized and taken into account in all depth-wise comparisons between different OA groups.
To clarify the effect of different thicknesses of the superficial zone between the groups, we also analyzed the FTIR-derived PG parameters and the OD separately for each zone. The results of this zone-wise analysis also demonstrated that correlations between the FTIR-derived PG parameters and the OD were weak in the superficial zone. Consequently, this analysis strengthens the conclusion that the specificity of current FTIR-derived PG parameters is limited in the superficial zone.
With regard to the estimation of PG content in the middle and deep zones, it seems that both FTIR-derived PG parameters estimate quite well the reference PG content in the normal and early OA groups. However, in advanced OA, the correlation between the OD and the carbohydrate/Amide I ratio remains low compared to the carbohydrate region alone. This may be explained by the simultaneous decrease in the Amide I absorption (i.e., estimate for the collagen content) in advanced OA. This was supported by the significant correlations between the OD and Amide I absorption in the middle and deep zones, especially in the advanced OA group. Consequently, when Amide I absorption becomes very small, the normalization of the carbohydrate region absorption with it leads to unstable values for estimation of the PG content. When considering this together with our recent results,11 it seems that the direct use of the carbohydrate region is more reasonable; however, care should be taken to minimize the section thickness artifacts. These artifacts are always present when calculating any nonnormalized absorbance values directly from the infrared spectrum. Conducting FTIR measurements from several sections within one sample is one way to minimize this variation.
It was demonstrated in our recent study that the carbohydrate/Amide I ratio underestimated the PG content of bovine articular cartilage in deep tissue both in normal samples and samples enzymatically digested with chondroitinase ABC.11 In the present human sample material, we did not observe similar behavior. This discrepancy between the studies may be explained by the differences in the species investigated. However, based on the conclusions above, it still seems that direct absorbance in the carbohydrate region estimated the reference PG content in the middle and deep zones better than the carbohydrate/Amide I ratio.
Articular cartilage, like all biological tissues, contains a very complicated structure at the molecular level. The solid matrix of articular cartilage is mainly composed of collagen and PG macromolecules.20 In the Amide I region of the spectrum (≈1585-1720 cm–1), infrared absorption is mainly related to the stretching vibrations of C=O dipoles.4 Both collagen and PG molecules include C=O dipoles,4 and consequently, the Amide I region of the spectrum is affected by both collagen and PGs. However, collagen molecules constitute nearly 75% of the cartilage solid matrix,21 thus making it the main contributor also in the Amide I region. In the carbohydrate region of the spectrum (≈1140-985 cm–1), it has been reported that infrared absorption is mainly related to C-O-C, C-OH, and C-C ring vibrations typical of PG molecules.4 However, in our recent study,11 as well as in the present study, it was demonstrated that absorption in the carbohydrate region is likely affected by the collagens. Thus, in articular cartilage, it is not straightforward to relate the specific area of the absorption spectrum to the specific molecular component. This sets many challenges for the development of new spectral analysis techniques for FTIR analysis of articular cartilage.
In our earlier study, we concluded using the same sample set that the PG content, estimated with the FTIR-based PG parameters, was significantly reduced in the superficial zone in early OA compared to normal samples.1 Although the present analysis indicated that collagen absorption contributes also to the FTIR-based PG parameters, our earlier comparisons between OA groups can be considered reliable because Amide I absorption did not simultaneously decrease in early OA compared to the normal group.1 Thus, Amide I absorption induced some offset to the FTIR-based PG parameters contributing similarly to both OA groups.
In conclusion, direct area of the carbohydrate region appears to estimate the PG content of the articular cartilage rather well in the middle and deep zones, as well as in the bulk analysis, at different levels of cartilage degradation. However, in the superficial zone, the specificity of the commonly used FTIR-based PG parameters was also affected by Amide I absorption, contributed by collagen, and was therefore limited. Thus, when using the current FTIR analysis methods for the estimation of PG content of the cartilage, these limitations in the specificity should be recognized and taken into account. More research and parameter development are still needed to further improve the sensitivity and specificity of FTIR microspectroscopy to accurately quantify the PG content also in the superficial cartilage.
Footnotes
Declaration of Conflicting Interests: The author(s) declared no potential conflicts of interests with respect to the authorship and/or publication of this article.
Funding and Acknowledgments: Financial support from the Academy of Finland (project 127198) and Ministry of Education, Finland (University of Eastern Finland grant, project 5741) is acknowledged. We cordially thank Professor Ilkka Kiviranta, MD, PhD; Panu Kiviranta, MD, PhD; and Eveliina Lammentausta, PhD, for the original human sample material. Jaana Mäkitalo, BSc, is acknowledged for conducting preliminary data analysis, and Lassi Rieppo, BSc, is acknowledged for technical support.
References
- 1. Saarakkala S, Julkunen P, Kiviranta P, Mäkitalo J, Korhonen RK. Depth-wise progression of osteoarthritis in human articular cartilage: investigation of composition, structure and biomechanics. Osteoarthritis Cartilage. 2010;18:73-81. [DOI] [PubMed] [Google Scholar]
- 2. Bi X, Yang X, Bostrom MP, Camacho NP. Fourier transform infrared imaging spectroscopy investigations in the pathogenesis and repair of cartilage. Biochim Biophys Acta. 2006;1758:934-41. [DOI] [PubMed] [Google Scholar]
- 3. Boskey A, Pleshko Camacho N. FT-IR imaging of native and tissue-engineered bone and cartilage. Biomaterials. 2007;28:2465-78. [DOI] [PMC free article] [PubMed] [Google Scholar]
- 4. Camacho NP, West P, Torzilli PA, Mendelsohn R. FTIR microscopic imaging of collagen and proteoglycan in bovine cartilage. Biopolymers. 2001;62:1-8. [DOI] [PubMed] [Google Scholar]
- 5. David-Vaudey E, Burghardt A, Keshari K, Brouchet A, Ries M, Majumdar S. Fourier transform infrared imaging of focal lesions in human osteoarthritic cartilage. Eur Cell Mater. 2005;10:51-60. [DOI] [PubMed] [Google Scholar]
- 6. Kim M, Bi X, Horton WE, Spencer RG, Camacho NP. Fourier transform infrared imaging spectroscopic analysis of tissue engineered cartilage: histologic and biochemical correlations. J Biomed Opt. 2005;10:031105. [DOI] [PubMed] [Google Scholar]
- 7. Potter K, Kidder LH, Levin IW, Lewis EN, Spencer RG. Imaging of collagen and proteoglycan in cartilage sections using Fourier transform infrared spectral imaging. Arthritis Rheum. 2001;44:846-55. [DOI] [PubMed] [Google Scholar]
- 8. West PA, Bostrom MP, Torzilli PA, Camacho NP. Fourier transform infrared spectral analysis of degenerative cartilage: an infrared fiber optic probe and imaging study. Appl Spectrosc. 2004;58:376-81. [DOI] [PubMed] [Google Scholar]
- 9. West PA, Torzilli PA, Chen C, Lin P, Camacho NP. Fourier transform infrared imaging spectroscopy analysis of collagenase-induced cartilage degradation. J Biomed Opt. 2005;10:14015. [DOI] [PubMed] [Google Scholar]
- 10. Saadat E, Lan H, Majumdar S, Rempel DM, King KB. Long-term cyclical in vivo loading increases cartilage proteoglycan content in a spatially specific manner: an infrared microspectroscopic imaging and polarized light microscopy study. Arthritis Res Ther. 2006;8:R147. [DOI] [PMC free article] [PubMed] [Google Scholar]
- 11. Rieppo L, Saarakkala S, Närhi T, Holopainen J, Lammi MJ, Helminen HJ, et al. Quantitative analysis of spatial proteoglycan content in articular cartilage with Fourier transform infrared imaging spectroscopy: critical evaluation of analysis methods and specificity of the parameters. Microsc Res Tech. 2010;73:503-12. [DOI] [PubMed] [Google Scholar]
- 12. Kiviranta P, Lammentausta E, Toyras J, Kiviranta I, Jurvelin JS. Indentation diagnostics of cartilage degeneration. Osteoarthritis Cartilage. 2008;16:796-804. [DOI] [PubMed] [Google Scholar]
- 13. Pritzker KP, Gay S, Jimenez SA, Ostergaard K, Pelletier JP, Revell PA, et al. Osteoarthritis cartilage histopathology: grading and staging. Osteoarthritis Cartilage. 2006;14:13-29. [DOI] [PubMed] [Google Scholar]
- 14. Kiviranta I, Jurvelin J, Tammi M, Säämänen AM, Helminen HJ. Microspectrophotometric quantitation of glycosaminoglycans in articular cartilage sections stained with Safranin O. Histochemistry. 1985;82:249-55. [DOI] [PubMed] [Google Scholar]
- 15. Király K, Lapveteläinen T, Arokoski J, Törrönen K, Modis L, Kiviranta I, et al. Application of selected cationic dyes for the semiquantitative estimation of glycosaminoglycans in histological sections of articular cartilage by microspectrophotometry. Histochem J. 1996;28:577-90. [DOI] [PubMed] [Google Scholar]
- 16. Rieppo J, Hallikainen J, Jurvelin JS, Helminen HJ, Hyttinen MM. Novel quantitative polarization microscopic assessment of cartilage and bone collagen birefringence, orientation and anisotropy. Transact Orthop Res Soc. 2003;28:570. [Google Scholar]
- 17. Julkunen P, Kiviranta P, Wilson W, Jurvelin JS, Korhonen RK. Characterization of articular cartilage by combining microscopic analysis with a fibril-reinforced finite-element model. J Biomech. 2007;40:1862-70. [DOI] [PubMed] [Google Scholar]
- 18. Steiger JH. Tests for comparing elements of a correlation matrix. Psychol Bull. 1980;87:245-51. [Google Scholar]
- 19. Buckwalter JA, Mankin HJ. Articular cartilage: Part II. Degeneration and osteoarthritis, repair, regeneration, and transplantation. J Bone Joint Surg Am. 1997;79:612-32. [PubMed] [Google Scholar]
- 20. Muir H. The chemistry of the ground substance of joint cartilage. In: Sokoloff L, editor. The joints and synovial fluid. New York: Academic Press; 1980. p. 27-94. [Google Scholar]
- 21. Mow VC, Guo XE. Mechano-electrochemical properties of articular cartilage: their inhomogeneities and anisotropies. Annu Rev Biomed Eng. 2002;4:175-209. [DOI] [PubMed] [Google Scholar]