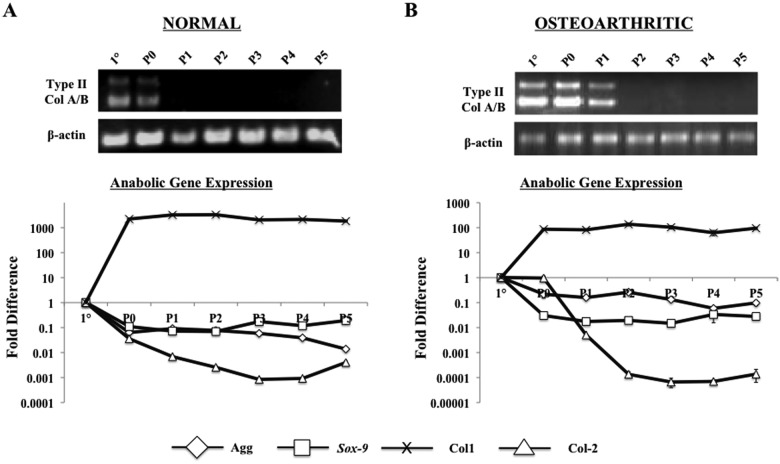
Figure 1.
PCR of cartilage gene expressions in monolayer culture. Analyzed in triplicate. (A) Analysis of normal human chondrocytes. Band sizes for type II collagen A/B are 701 bp and 494 bp, respectively. Quantitative PCR indicated increase in type I collagen (Col1) and decrease in type II collagen (Col2), aggrecan, and Sox-9. (B) Analysis for OA human chondrocytes. Similar trends as the normal chondrocytes in A, with expression of type II collagen A/B lasting for one more passage than normal cells.

