

Abstract
Triple-negative breast cancers (TNBC), negative for estrogen receptor, progesterone receptor, and Her2 amplification, are resistant to standard targeted therapies and exhibit a poor prognosis. Furthermore, they are highly heterogeneous with respect to genomic alterations, and common therapeutic targets are lacking though substantial evidence implicates dysregulated kinase signaling. Recently, six subtypes of TNBC were identified based on gene expression and were proposed to predict sensitivity to a variety of therapeutic agents including kinase inhibitors. To test this hypothesis, we screened a large collection of well-characterized, small-molecule kinase inhibitors for growth inhibition in a panel of TNBC cell lines representing all six subtypes. Sensitivity to kinase inhibition correlated poorly with TNBC subtype. Instead, unsupervised clustering segregated TNBC cell lines according to clinically relevant features including dependence on epidermal growth factor signaling and mutation of the PTEN tumor suppressor. We further report the discovery of kinase inhibitors with selective toxicity to these groups. Overall, however, TNBC cell lines exhibited diverse sensitivity to kinase inhibition consistent with the lack of common driver mutations in this disease. While our findings support specific kinase dependencies in subsets of TNBC, they are not associated with gene expression-based subtypes. Instead we find that mutation status can be an effective predictor of sensitivity to inhibition of particular kinase pathways for subsets of TNBC.
Keywords: breast cancer, triple-negative breast cancer, cell-based therapeutics, kinase inhibitors, molecular subtype, targeted therapy
Introduction
Triple negative breast cancers (TNBCs) disproportionately affect younger women and African-American women and exhibit a particularly aggressive phenotype. This disease remains a major therapeutic challenge due to its resistance to anti-hormonal and anti-HER2-targeted therapies, both of which are effective in treating breast cancers that overexpress these key cellular receptors (1, 2). While TNBC patients respond well to chemotherapy initially, the frequency of relapse is high compared to other breast tumors (3), underscoring the need for the development of targeted therapies. However, studies have failed to identify tractable genomic alterations that consistently occur in a large fraction of TNBC (4–7), and consequently the molecular alterations that drive TNBC are still largely unclear. Functional viability screens represent an alternative approach to identify drivers of this disease by systematically assessing the consequences of eliminating expression of potential protein drivers (8, 9) or their catalytic activity (10) on cell viability.
Protein kinases represent attractive therapeutic targets due to their broad participation in pathways driving cell proliferation and survival and their readily targeted ATP-binding pocket. Dysregulated EGFR, PI3K pathway, and mTOR signaling have been associated with TNBC and represent potential therapeutic targets (5, 11–15), although the results of clinical trials using agents targeting these pathways have been disappointing (16, 17). Additionally, the protein tyrosine phosphatase PTPN12 was recently identified as a tumor suppressor in TNBC, while another phosphatase, UBASH3B, is overexpressed in TNBC (18, 19). These findings suggest that kinase signaling may represent a therapeutic opportunity in TNBC. Furthermore, given the heterogeneity of TNBC, it would be valuable to identify predictors of kinase inhibitor sensitivity to increase therapeutic success.
Recent studies have aimed to identify subtypes of breast cancer, including within TNBC, based on gene expression profiles or responses to gene knockdown (9, 20, 21). There has also been considerable focus on identifying predictive biomarkers for TNBC therapeutic response on a large scale (9, 10, 20, 21). Importantly, six subtypes of TNBC have recently been defined based on gene expression signatures, and these include two basal-like groups, mesenchymal-like, mesenchymal stem-like, immunomodulatory, and luminal androgen receptor types (20). The predictive value of these TNBC subtypes is still unclear, and additional studies to examine the key genetic events driving TNBC would be useful in understanding the molecular diversity of TNBC and predicting therapeutic benefit (22, 23).
In this study, we used systematic pharmacological inhibition of kinases using a highly characterized collection of kinase inhibitors in a panel of twelve TNBC cell lines in order to characterize kinase dependencies in TNBC. Importantly, the TNBC cell lines we screened included representatives of each of the six subtypes of TNBC recently defined by gene expression, and we sought to determine if these subtypes predicted response to our kinase inhibitor panel. We found that TNBC subtypes based on gene expression were poor predictors of response to our inhibitor panel, implying that gene expression alone may be insufficient to predict response to kinase targeted therapies in TNBC cell line models. Instead, we identified subgroups of cell lines with similar responses to EGFR and PI3K pathway inhibitors, and demonstrated that PI3K inhibitor sensitivity can be predicted by PTEN mutation status in TNBC.
Materials and Methods
Cell Lines
BT20, BT549, HCC38, HCC70, HCC1143, HCC1187, HCC1806, Hs578T, and MDA-MB231 human TNBC cell lines were obtained from the American Type Culture Collection (ATCC). CAL148 and MFM223 TNBC cell lines were obtained from Leibniz Institute DSMZ-German Collection of Microorganisms and Cell Cultures. MDA-MB468 cells were obtained from ATCC as part of the NCI-60 panel via the Cell Culture Facility at Fox Chase Cancer Center. All cell lines were purchased from suppliers that routinely authenticate cell lines using short tandem repeat profiling. The MDA-MB468 cells have not been authenticated by our group since their purchase from ATCC in 2003. All cell lines were cultured according to the supplier’s recommendations. All cell lines were amplified and frozen at low passage number within two months of receipt, and all experiments were performed within 20 passages of thawing. For cell viability assays, between 200 and 3000 low-passage cells were plated per well in 384-well microplates using the Matrix Wellmate automated plate filler (Thermo Scientific). Optimal cell plating density was determined prior to screening for each cell line to allow for at least two population doublings and to avoid confluency by the end of the one week assay period (Supplementary Table 1).
Kinase inhibitors
A kinase inhibitor library containing 160 well-characterized kinase inhibitors was purchased from EMD Millipore. Neratinib, afatinib, PD153035, and GSK2126458 were purchased from Selleck Chem. RAD001 and GDC0980 were provided by Joseph Testa (Fox Chase Cancer Center), and BEZ235 was supplied by Timothy Yen (Fox Chase Cancer Center). The following compounds were purchased from LC Labs: bosutinib isomer, dasatinib, dovitinib, erlotinib, gefitinib, imatinib, lapatinib, masitinib, mubritinib, nilotinib, pazopanib, roscovitine, sorafenib, sunitinib, tandutinib, tofacitinib, tozasertib, vandetanib, vatalanib, and VX702. All compounds were solubilized and stored at −80°C in 100% dimethyl sulfoxide (DMSO).
Kinase Inhibitor Screen
Twenty-four hours after cell seeding in 384-well plates, cells were treated with DMSO or one of eight doses of kinase inhibitors (final concentration range 64 pM – 5 μM). Inhibitors were added by pin transfer, and the final concentration of DMSO was <0.3% for all inhibitor concentrations. This DMSO concentration was determined to have minimal effect on cell viability in each cell line. Cell viability was assessed one week later using the CellTiter Glo luminescent cell viability assay (Promega). Screening was performed in duplicate on separate days. Duplicate dose-response data were averaged and fit using a sigmoidal dose-response curve in GraphPad Prism 6.0 in order to generate half maximal effective concentration values (EC50).
Statistical Methods
Heat map
A re-ordered heat map of EC50 values for all kinase-inhibitor pairs was obtained using two-way hierarchical clustering based on Manhattan distance and complete linkage. No scaling was applied to this data. These choices of distance metric and linkage method are robust to outlying observations and identify compact clusters of cell lines associated with sub-groups of kinase inhibitors based on their EC50 values. In addition, this approach effectively handles the presence of a large number of observations in the dataset with an EC50 value of 20 μM. For the identification of Group-selective inhibitors, EC50 values across the three Groups identified by hierarchical clustering were compared using the Kruskal-Wallis test to identify inhibitors where EC50 values were significantly lower in a particular group compared to the other groups.
Identification of potential cell line-specific kinase drivers
Each kinase inhibitor in the panel was first classified as either toxic (EC50< 5 μM) or non-toxic (EC50 ≥ 5 μM) to a given cell line. Next we used published in vitro specificity data for these kinase inhibitors against 300 kinases (kir.fccc.edu and (24)) to binarize the target spectrum of each inhibitor such that each of the 300 kinases was classified as either “targeted” (inhibited by > 50% in vitro) or “non-targeted” (inhibited by ≤ 50% in vitro) by a given inhibitor. Frequency data for each kinase across all inhibitors was summarized in the form of a 2 X 2 contingency table, and a one-sided Fisher’s exact test of association between compound toxicity and kinase targeting was performed.
Additional statistical methods
All other tests were two-sided and used a Type I Error of 5%. Due to the exploratory nature of this study, whose primary goal is to generate new hypotheses, no correction for multiple hypothesis testing was performed. All computations were performed in the R statistical language and environment(25).
For statistical analysis of gene mutation frequency, data were derived from the Cancer Cell Line Encyclopedia and the COSMIC database(10, 26), and Fisher’s exact test was used to associate the presence of mutations with Group membership.
Results
TNBC molecular subtype is a poor predictor of kinase inhibitor sensitivity
In order to gain insight into kinases important for growth and survival of TNBC, we screened a well-characterized library of 180 known kinase inhibitors (24) for growth inhibition of a panel of 12 TNBC cell lines, selected to represent each of the recently defined gene expression subtypes (molecular subtypes) of TNBC (20). Importantly, this inhibitor set has been shown to target the majority of human protein kinases (24) and includes FDA-approved drugs as well as commercially available research compounds. We treated cells with 8 doses of each kinase inhibitor (5 μM – 64 pM) for one week and monitored cell viability, relative to solvent-treated control wells, using the CellTiter Glo assay to measure ATP released from cell lysates. The one week treatment time was chosen to increase the sensitivity of the viability assay for slower-growing cell lines. Viability data were fit to a sigmoidal dose-response curve and EC50 values were determined for each inhibitor-cell line pair (Figure 1). Seven inhibitors had no effect on any of the tested cell lines, and these inhibitors were excluded from further analysis. The complete data set is presented in Supplementary Table 1.
Figure 1. Experimental setup of kinase inhibitor screen.
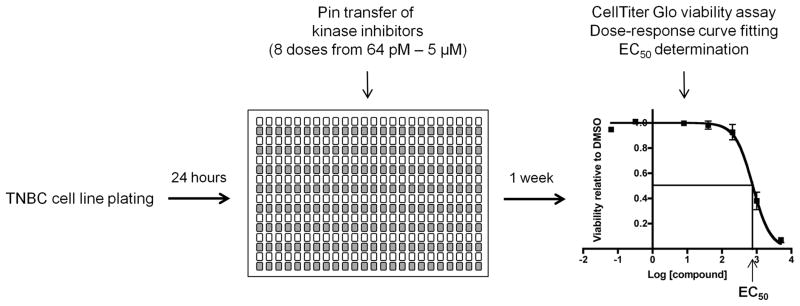
TNBC and control cells were plated in 384-well plates, and 24 hours later, kinase inhibitors were added via pin transfer. Cells were incubated in the presence of inhibitors for one week, after which cell viability was assessed. Duplicate screening data were normalized to DMSO-treated controls, and dose-response curves were fitted using GraphPad Prism version 6.0. EC50 values were generated and represent cell line responses to the kinase inhibitors.
Overall we observed significant heterogeneity in the effect of the compounds across the cell line panel (Figure 2), consistent with the genomic heterogeneity observed in TNBC (5, 20). For example, some TNBC cell lines, including MDA-MB468, HCC1806, CAL148, and BT20, were highly sensitive to kinase inhibition, exhibiting median EC50 values in the low micromolar range (black bars in Figure 2). Other cell lines, particularly HCC38, HCC1143, Hs578T, MDA-MB231, and MFM223, were strikingly resistant to the majority of kinase inhibitors tested. Notably, general sensitivity to kinase inhibition did not strictly correlate with TNBC molecular subtype (Figure 2).
Figure 2. TNBC cell lines are differentially sensitive to kinase inhibitors.

EC50 values for 12 TNBC cell lines treated with 180 kinase inhibitors for one week were sorted into bins of 2 μM increments. Black bars correspond to the bins containing the median EC50 value for each cell line. EC50 values ≥ 20 μM were set to 20 μM. TNBC cell lines are grouped according to gene expression subtype as described (20).
Sensitivity of TNBC cell lines to individual compounds was also highly variable, suggesting that individual cell lines may exhibit diverse kinase dependencies (Supplementary Table 1). We used two-way, unsupervised hierarchical clustering to group TNBC cell lines with similar responses to the kinase inhibitors. Likewise, kinase inhibitors were clustered based on similarities in their toxicity profiles (Figure 3; Supplementary Figure 1). This analysis revealed three major subgroups within the cell line panel (Groups 1, 2, and 3), representing cell lines with most similar responses to the set of kinase inhibitors tested (Figure 3). As a singlet cell line, the CAL148 cell line was included in Group 1, given its proximity to Group 1 cell lines after clustering, to increase the number of representatives of this group. As discussed below, though, CAL148 cells exhibit features that distinguish them from other Group 1 cell lines. Strikingly, cell lines of the same molecular subtype did not generally co-cluster, suggesting that these subtypes do not strongly predict inhibitor sensitivity. To test this rigorously and quantitatively, we used the Adjusted Rand Index (ARI) and Normalized Mutual Information (NMI) indices to assess whether there is an association between molecular subtype and the three Groups determined by kinase inhibitor profiling (27, 28). The majority of TNBC cell lines in our panel fall into one of three major gene expression-based subtypes; basal-like (BL), mesenchymal-like (ML), and luminal androgen receptor (LAR) (20). Two additional subtypes with only one representative cell line each (HCC1187, immunomodulatory subtype and BT20, unclassified) were excluded from the analysis. Next we calculated the ARI and NMI for the association between BL, ML, and LAR subtypes and Groups 1, 2, and 3 as −0.079 and 0.22, respectively, indicating poor correlations between the two groupings. A test of significance of the null hypothesis that there is no association between the classes (ARI or NMI = 0) against the one-sided alternative was performed using permutation testing. The realized p values based on 1000 random permutations were 0.84 (ARI) and 0.61 (NMI) indicating that there is no evidence for association between BL, ML, and LAR subtypes and Groups 1, 2, and 3. Consistent with this finding, we found no kinase inhibitors with statistically significant toxicity specifically against cells of any one molecular subtype (not shown). Thus, our results indicate that molecular subtype is not a strong predictor of kinase inhibitor sensitivity.
Figure 3. Hierarchical clustering of EC50 values reveals groups of similarly-sensitive TNBC cell lines.

Two-way hierarchical clustering of the TNBC cell line kinase inhibitor screening dataset, presented as a heat map of EC50 values. Cell line names are coded according to gene expression-based subtype (20) as follows: open squares – basal-like 1; black squares – basal-like 2; open circles – mesenchymal; black circles – mesenchymal stem-like; gray circles – luminal androgen receptor; open hexagons – immunomodulatory; gray squares – unclassified. A fully-labeled high resolution version is presented in Supplementary Figure 1, and the full data table is presented as Supplementary Table 1.
Analysis of the clustering of kinase inhibitors revealed the presence of two major subgroups. Strikingly, the lower inhibitor cluster in Figure 3 included a disproportionate number of compounds that potently inhibited growth of all cell lines. We hypothesized that these highly toxic compounds might include compounds that inhibit a larger number of kinase targets (more promiscuous inhibitors). Indeed, we found that the mean Gini coefficients, a measure of inhibitor selectivity ranging from 0 (promiscuous) to 1 (perfectly selective), of the two clusters were modestly different but showed strong statistical significance (Supplementary Figure 2; 0.67 vs. 0.60 for inhibitor clusters 1 and 2, respectively; p = 2.293 x 10⁻⁵) (24, 29).
Identification of TNBC subgroups with similar kinase dependency
We next examined our data to identify kinase inhibitors that exhibited Group-selective toxicity. We performed a Kruskal-Wallis comparison of the mean EC50 values for each inhibitor across Groups 1, 2, and 3. Supplementary Table 2 presents the ranked list of compounds according to p value. We observed that several of the compounds most selectively toxic for Group 1 cell lines were reported previously to inhibit EGFR catalytic activity (24). Consistent with this finding, the BT20 Group 1 cell line has been previously shown to have increased EGFR expression and activity and has increased sensitivity to genotoxic drugs following pretreatment with EGFR inhibitors (14, 30, 31). To validate dependence on EGFR catalytic activity for the growth of Group 1 cells, we tested three additional EGFR inhibitors (afatinib, neratinib, and PD153035) in cell viability assays in each cell line. We calculated the mean EC50 for the 20 EGFR inhibitors from our screening set and afatinib, neratinib, and PD153035 in each cell line (Figure 4A; complete dataset in Supplementary Table 3). Consistent with EGFR-dependence, Group 1 cell lines BT20 and HCC1806 were 7- to 15-fold more sensitive to treatment with EGFR inhibitors compared to cell lines of Groups 2 and 3. Not surprisingly, CAL148 cells, which segregate from other Group 1 cell lines (Figure 3), did not show increased sensitivity to EGFR inhibitors. Figure 4B presents examples of the most selective compounds for Group 1, with additional compounds significantly toxic to Group 1 shown in Supplementary Figure 3. In addition to inhibitors of EGFR (PD174265 and EGFR/ErbB2/ErbB4 Inhibitor), these include inhibitors of Rho kinase and the CDK2 cell cycle kinase. Notably, an additional inhibitor of Rho kinase, Y-27632, was also more toxic to Group 1, although this selectivity did not reach statistical significance (Supplementary Table 2). These data suggest that Rho kinase might also promote the growth of Group 1 cell lines.
Figure 4. Group 1 TNBC cell lines are disproportionately sensitive to EGFR inhibition.

A. Scatter plot of EC50 values over a one-week treatment period for 23 EGFR inhibitors. Mean EC50 value for all EGFR inhibitors was determined for each TNBC cell line and is shown by a black line. Groups 1, 2, and 3 correspond to clusters of TNBC cell lines as shown in Figure 3. B. Sensitivity of Groups 1, 2, and 3 to four kinase inhibitors, determined to be statistically significantly more toxic to Group 1. Error bars denote variation in EC50 values within Groups 1, 2, and 3.
Examples of kinase inhibitors preferentially toxic for Group 2 are shown in Figure 5A. These include AGL2043, an inhibitor of PDGFR and other type III receptor tyrosine kinases and SU9516, a cyclin-dependent kinase inhibitor. Intriguingly, all three Group 2 cell lines were previously shown to be highly sensitive to siRNA-mediated depletion of the CDK2/5/6 partner cyclin D1 (32). In addition, the Aurora kinase inhibitors tozasertib and an additional Aurora kinase/CDK inhibitor were selectively toxic to Group 2 cells. Other compounds selectively toxic to Group 2 include the VEGFR inhibitor vatalanib, in clinical development, and a BCR-ABL inhibitor.
Figure 5. Kinase inhibitors showing selective toxicity against Group 2 TNBC cell lines.

A. Sensitivity of cell lines in Groups 1, 2, and 3 to six kinase inhibitors, determined to be statistically significantly more toxic to Group 2. Error bars denote variation in EC50 values within Groups 1, 2, and 3. B. EC50 values over a one-week treatment period for 22 PI3K pathway inhibitors are shown as a scatter plot. The mean EC50 value for all PI3K pathway inhibitors was calculated for each TNBC cell line and is shown by a black line. Groups 1, 2, and 3 correspond to clusters of TNBC cell lines as determined in Figure 3. PTEN-mutant cell lines are indicated (*).
No kinase inhibitors tested were selectively toxic to Group 3 cell lines, consistent with their general resistance to the kinase inhibitor panel (Figure 3). To identify potential kinase drivers of individual cell lines in Group 3, we performed a statistical test for association between compound toxicity and the inhibition of particular kinases. This approach takes advantage of previous comprehensive target characterization of the kinase inhibitors in our library (24). Inhibitors were classified as either toxic (EC50< 5 μM) or non-toxic (EC50 ≥ 5 μM) for a cell line, and kinases were classified as targeted by an inhibitor if they were inhibited by > 50% in the in vitro analysis. Fisher’s exact tests were then used on a kinase by kinase basis to assess whether cellular toxicity was associated with inhibition of that particular kinase. The analysis produced numerous significantly enriched kinase targets for each of the Group 3 cell lines (Supplementary Table 4). Among the kinases most significantly associated with cellular toxicity for any member of Group 3 (p < 1 x 10⁻⁶) were the fibroblast growth factor receptors (FGFR) 1 and 2 in MFM223 cells. This finding is consistent with data showing FGFR2 gene amplification and a dependence on FGFR2 activity for survival in this cell line (33, 34). Although analysis of existing gene expression data failed to generally associate kinase expression with sensitivity to inhibitors of those kinases (data not shown), increased expression of FGFR2 in MFM223 cells is consistent with FGFR dependence in this cell line. We also identified CDK6 and CDK1 as putative kinase drivers in HCC38 cells, consistent with previous evidence of their sensitivity to CDK4/6 inhibition (32). Additionally, inhibition of the tyrosine kinase FES/FPS was identified as highly significantly associated with toxicity to HCC1143 cells. FES/FPS has been previously associated with tumor growth and metastasis in breast cancer (35). These and the other significantly associated kinases identified from our statistical analysis warrant further investigation to examine their roles in growth and survival of these TNBC cell lines.
Our findings demonstrate that Group 1 TNBC cell lines exhibit a dependence on EGFR for growth or survival, consistent with a plethora of data supporting a role for this receptor in a subset of TNBC (14, 15, 31). In addition to EGFR, we have shown that inhibitors of Rho kinase and CDK2 are preferentially toxic to Group 1 cell lines. We have also identified kinase inhibitors selectively toxic to Group 2 cell lines, including those targeting CDKs, PDGFR, VEGFR, and Aurora kinase, all of which have been previously associated with TNBC (32, 36–38). Finally, we have identified a group of TNBC cell lines (Group 3) that appear generally resistant to kinase inhibition, and while as a group they do not appear to show a common dependence on a particular kinase pathway, we have identified potential dependencies for individual cell lines.
Features of TNBC cell lines predict kinase inhibitor response
In order to gain insight into the molecular features of TNBC cell lines that drive Group membership, we examined whether any mutations are over-represented in any particular Group. The mutation status of 623 genes was determined for each cell line using data from the COSMIC database and the Cancer Cell Line Encyclopedia (10, 26), and Fisher’s exact test was used to determine whether any particular gene was disproportionately mutated in any of the three Groups. Mutations in the lipid phosphatase and tumor suppressor PTEN were significantly associated with Group 2 cell lines (p=0.01), but no mutations reached significance in Groups 1 or 3 (p < 0.05). Indeed, all three Group 2 cell lines, BT549, HCC70, and MDA-MB468, have PTEN mutations that render the cells null for PTEN protein expression (39, 40).
PTEN opposes the activity of PI3 kinases (PI3K), suggesting that elevated PI3K pathway activity may contribute to the growth and survival of Group 2 TNBC cells. To test this hypothesis, we calculated the mean EC50 value for inhibitors of PI3K pathway kinases for all cell lines, including 18 inhibitors from our screening panel and 4 additional PI3K pathway inhibitors (BEZ235, RAD001, GDC0980, and GSK2126458; complete data set in Supplementary Table 5). These inhibitors include compounds that target PI3K directly as well as the downstream kinases Akt and mTOR. Generally, we found increased sensitivity of Group 2 cell lines to inhibition of PI3K signaling relative to cell lines in Groups 1 and 3 (Figure 5B). An additional PTEN null cell line, CAL148 from Group 1, was also highly sensitive overall to PI3K pathway inhibition. This observation is consistent with the role of PTEN loss in activation of the PI3K pathway and subsequent sensitivity to agents targeting this pathway. The BT20 Group 1 cell line was also quite sensitive to PI3K pathway inhibition, likely due to the presence of the H1047R activating mutation in PI3K (41). Despite sensitivity to PI3K pathway inhibitors, CAL148 and BT20 cells did not cluster with Group 2, perhaps because this dependence is overwhelmed by a general sensitivity to the majority of compounds tested (Figure 2). Overall, these results show that PTEN mutations predict sensitivity to PI3K pathway inhibitors in TNBC cell line models and highlight the relevance of performing functional assays in TNBC cell lines in demonstrating kinase inhibitor sensitivity.
Discussion
Both the aggressiveness of TNBC and the lack of therapeutic success with targeted agents have prompted studies to better characterize the disease and to predict which patients will benefit from which therapies (9, 20, 21). Here we have sought to further characterize the relevance of TNBC molecular subtypes defined by gene expression and their value for predicting sensitivity to kinase inhibition. We found that cell lines from the same molecular subtype were differentially sensitive to kinase inhibitors in our panel (Figure 3). We also found that no kinase inhibitors showed toxicity selectively to a particular molecular subtype (data not shown). These findings suggest that TNBC molecular subtypes may not be strong predictors of response to kinase inhibition. This finding can be understood based on the diverse potential mechanisms for dysregulation of kinase signaling other than alterations in expression at the mRNA level, including mutation or alteration in upstream regulators. Indeed, we found that although molecular subtype did not strongly predict kinase inhibitor sensitivity, PTEN mutation status correlated well with sensitivity to inhibitors of the PI3K pathway (Figure 5B). Thus, gene expression signatures on their own are unlikely to be generally effective predictors of kinase inhibitor sensitivity and highlight the advantages of functional profiling to identify kinases critical for TNBC growth.
Functional pharmacological profiling, though a powerful approach for characterizing cultured cell lines, is poorly suited to guiding personalized therapies for patient tumors. Consequently, clinically relevant biomarkers such as gene mutation or overexpression that predict kinase inhibitor sensitivity must first be identified in cell line panels and subsequently validated through clinical trials. Because our data and others’ suggests that TNBC may exhibit a broad and heterogeneous dependence on diverse kinase pathways, functional profiling of very large and diverse arrays of cell lines will likely be required to identify dependencies on specific individual kinases that may be present in only a small proportion of TNBC patients. Nevertheless, even the modestly sized cell line panel examined here revealed expected dependencies on EGFR and PI3K pathways in a subset of TNBCs as well as additional subtype-selective agents (Figures 4&5).
While we found that kinase inhibitor sensitivity was not generally well predicted by molecular subtype, sensitivity to other anti-cancer agents has been linked to molecular subtype both in cell lines and clinically (20, 42, 43). For example, chemotherapeutic agents, such as cisplatin, taxanes, and anthracyclines, are more toxic to basal-like TNBCs, while the androgen receptor antagonist bicalutamide is selectively toxic to cell lines of the LAR subtype (20, 43). Interestingly, the SRC/ABL kinase inhibitor dasatinib was previously reported to exhibit preferential toxicity for mesenchymal-like TNBC cell lines (20). While it did not reach statistical significance, our mesenchymal-like cell lines, BT549, Hs578T, and MDA-MB231, were more sensitive to dasatinib than cells of other TNBC subtypes (p = 0.12).
Our unsupervised hierarchical clustering of cell lines based on their similarity of kinase inhibitor sensitivity identified three major Groups of TNBC cell lines. We identified a significant feature of Group 1 as sensitivity to EGFR inhibition, and all EGFR inhibitors that we tested were toxic to BT20 and HCC1806 Group 1 cell lines, pointing to a subset of TNBC that is highly dependent on this kinase for growth and/or survival. The CAL148 cell line, included in Group 1 to increase the number of cell line representatives for this group, was not more sensitive to EGFR inhibitors, and we suggest that CAL148 cells rely more on alternate kinases for survival. We observed that CAL148 cells were the most sensitive to kinase inhibitors overall (Figures 2 and 3), suggesting the possibility that the specific kinases critical to the growth of CAL148 cells are overshadowed by a general sensitivity to kinase inhibitors (Figures 2 and 3).
In non-small cell lung cancer, increased efficacy of EGFR inhibitors can be seen in patients with high EGFR copy number, increased EGFR expression, or mutated EGFR (44, 45). Although EGFR mutations in TNBC are rare, EGFR overexpression or amplification has been reported in some TNBCs and basal breast cancers, making it an attractive therapeutic target for TNBC (12, 46–49). Our results suggest that EGFR expression or amplification, as seen in BT20 and HCC1806 cells(30, 49), is associated with response to small molecule inhibitors of EGFR (Figure 4A). Interestingly, though, the MDA-MB468 cell line also expresses high levels of EGFR(49) but is not highly sensitive to EGFR inhibitors (Figure 4A). This suggests that for some high EGFR-expressing TNBCs, additional features may attenuate sensitivity to EGFR inhibition and is consistent with low patient response rate of anti-EGFR antibody cetuximab treatment in TNBC (17). Thus, a more complete understanding of the role of the EGFR pathway and its response to EGFR inhibitors in TNBC is needed to improve the prognostic value of EGFR overexpression for response to EGFR-targeted therapies.
A second group (Group 2) of TNBC cells showed increased sensitivity to PI3K pathway inhibition associated with mutations in the tumor suppressor PTEN. In fact, three of four PTEN-mutant cell lines in our TNBC panel clustered in Group 2. PI3K pathway activation, either through mutational activation of PI3K or loss of the negative regulator PTEN, has been associated with TNBC, and our results confirm that a subset of TNBCs is dependent on PI3K signaling for growth (5, 10, 26, 50, 51). Interestingly, CAL148 and BT20 cells, which are both highly sensitive to PI3K inhibitors (Figure 5B), have documented activating PI3K mutations (H1047R) (10, 26). Our results suggest that routine sequencing for PTEN and PI3K mutations in TNBC patients would predict sensitivity to PI3K pathway inhibitors, and, consistent with this, recent evidence demonstrates increased efficacy of a highly-selective Akt inhibitor in PTEN-mutant cancer cell lines grown in culture and as xenografts(52).
Interestingly, we found no inhibitors significantly more toxic to Group 3 cell lines than to the other groups, and no mutations that we tested were enriched in Group 3. Group 3 cell lines appear overall to be more resistant to the kinase inhibitor panel, as evidenced by higher EC50 values generally (median EC50 values: 20 μM for Group 3; 15 μM for Group 2; and 5.33 μM for Group 1; Figures 2 and 3). It has previously been shown that kinome reprogramming occurs following treatment of TNBC cells with MEK inhibitors, suggesting plasticity of the kinome in response to single-agent kinase inhibitors (53). The increased resistance of Group 3 cell lines might be due to a more inherent ability to rewire kinase signaling in response to kinase inhibition, and therefore combination therapies may be required to target the growth of these cell lines. Upon further analysis of potential kinase dependencies in individual Group 3 cell lines, we found that CDKs, FGFR, and FES/FPS, which have previously been associated with breast cancer (32–34, 36), were most significantly associated with toxicity to specific cell lines of Group 3 (Supplementary Table 4). More broadly, the statistical method we have used to identify these associations provides an unbiased and widely applicable approach to identify candidate driver kinases from pharmacological profiling data in cell lines using compound libraries with defined target spectrums.
There have been several recent efforts focused on large-scale pharmacological studies of cancer cell lines though none have focused exclusively on triple-negative breast cancers (10, 21, 54). The heterogeneity of this disease and the lack of predominant driver mutations suggest that the success of this approach for TNBC will depend on large and diverse, well-characterized cell line panels with adequate annotation of mutation status and gene expression. Indeed, our analysis indicates that sensitivity to existing kinase inhibitors can be predicted based on clinically obtainable markers. Functional profiling of the diversity of TNBC remains a promising approach to defining these actionable kinase dependencies. While RNAi-mediated kinase inactivation is a successful alternative approach (9), pharmacological kinase inactivation provides a simpler and less expensive approach better suited to the large cell line panels required to capture the diversity of TNBC.
Supplementary Material
Acknowledgments
Financial support: This work was supported by a fellowship from the Sass Foundation, Inc., (Roslyn, New York) to L.S. Fink and by National Institutes of Health Grants T32 CA009035 to L.S. Fink (awarded to Fox Chase Cancer Center), R01 GM083025 to J.R. Peterson and P30 CA006927 to Fox Chase Cancer Center.
We thank James Duncan and Neil Johnson (Fox Chase Cancer Center) for comments on the manuscript. We also thank the Cell Culture Facility (Fox Chase Cancer Center) and Margret Einarson of the High Throughput Screening and Translational Research Facility (Fox Chase Cancer Center) for technical assistance.
Footnotes
Conflict of interest statement: We have no conflicts of interest to disclose.
References
- 1.Goldenberg MM. Trastuzumab, a recombinant DNA-derived humanized monoclonal antibody, a novel agent for the treatment of metastatic breast cancer. Clin Ther. 1999;21:309–18. doi: 10.1016/S0149-2918(00)88288-0. [DOI] [PubMed] [Google Scholar]
- 2.Jordan VC, Brodie AM. Development and evolution of therapies targeted to the estrogen receptor for the treatment and prevention of breast cancer. Steroids. 2007;72:7–25. doi: 10.1016/j.steroids.2006.10.009. [DOI] [PMC free article] [PubMed] [Google Scholar]
- 3.Liedtke C, Mazouni C, Hess KR, Andre F, Tordai A, Mejia JA, et al. Response to neoadjuvant therapy and long-term survival in patients with triple-negative breast cancer. J Clin Oncol. 2008;26:1275–81. doi: 10.1200/JCO.2007.14.4147. [DOI] [PubMed] [Google Scholar]
- 4.Curtis C, Shah SP, Chin SF, Turashvili G, Rueda OM, Dunning MJ, et al. The genomic and transcriptomic architecture of 2,000 breast tumours reveals novel subgroups. Nature. 2012;486:346–52. doi: 10.1038/nature10983. [DOI] [PMC free article] [PubMed] [Google Scholar]
- 5.Shah SP, Roth A, Goya R, Oloumi A, Ha G, Zhao Y, et al. The clonal and mutational evolution spectrum of primary triple-negative breast cancers. Nature. 2012;486:395–9. doi: 10.1038/nature10933. [DOI] [PMC free article] [PubMed] [Google Scholar]
- 6.Banerji S, Cibulskis K, Rangel-Escareno C, Brown KK, Carter SL, Frederick AM, et al. Sequence analysis of mutations and translocations across breast cancer subtypes. Nature. 2012;486:405–9. doi: 10.1038/nature11154. [DOI] [PMC free article] [PubMed] [Google Scholar]
- 7.Stephens PJ, Tarpey PS, Davies H, Van Loo P, Greenman C, Wedge DC, et al. The landscape of cancer genes and mutational processes in breast cancer. Nature. 2012;486:400–4. doi: 10.1038/nature11017. [DOI] [PMC free article] [PubMed] [Google Scholar]
- 8.Petrocca F, Altschuler G, Tan SM, Mendillo ML, Yan H, Jerry DJ, et al. A genome-wide siRNA screen identifies proteasome addiction as a vulnerability of basal-like triple-negative breast cancer cells. Cancer Cell. 2013;24:182–96. doi: 10.1016/j.ccr.2013.07.008. [DOI] [PMC free article] [PubMed] [Google Scholar]
- 9.Brough R, Frankum JR, Sims D, Mackay A, Mendes-Pereira AM, Bajrami I, et al. Functional Viability Profiles of Breast Cancer. Cancer Discov. 2011;1:260–73. doi: 10.1158/2159-8290.CD-11-0107. [DOI] [PMC free article] [PubMed] [Google Scholar]
- 10.Barretina J, Caponigro G, Stransky N, Venkatesan K, Margolin AA, Kim S, et al. The Cancer Cell Line Encyclopedia enables predictive modelling of anticancer drug sensitivity. Nature. 2012;483:603–7. doi: 10.1038/nature11003. [DOI] [PMC free article] [PubMed] [Google Scholar]
- 11.Montero JC, Esparis-Ogando A, Re-Louhau MF, Seoane S, Abad M, Calero R, et al. Active kinase profiling, genetic and pharmacological data define mTOR as an important common target in triple-negative breast cancer. Oncogene. 2014;33:148–56. doi: 10.1038/onc.2012.572. [DOI] [PubMed] [Google Scholar]
- 12.Perou CM, Sorlie T, Eisen MB, van de Rijn M, Jeffrey SS, Rees CA, et al. Molecular portraits of human breast tumours. Nature. 2000;406:747–52. doi: 10.1038/35021093. [DOI] [PubMed] [Google Scholar]
- 13.Marty B, Maire V, Gravier E, Rigaill G, Vincent-Salomon A, Kappler M, et al. Frequent PTEN genomic alterations and activated phosphatidylinositol 3-kinase pathway in basal-like breast cancer cells. Breast Cancer Res. 2008;10:R101. doi: 10.1186/bcr2204. [DOI] [PMC free article] [PubMed] [Google Scholar]
- 14.Corkery B, Crown J, Clynes M, O’Donovan N. Epidermal growth factor receptor as a potential therapeutic target in triple-negative breast cancer. Annals of oncology : official journal of the European Society for Medical Oncology / ESMO. 2009;20:862–7. doi: 10.1093/annonc/mdn710. [DOI] [PubMed] [Google Scholar]
- 15.Masuda H, Zhang D, Bartholomeusz C, Doihara H, Hortobagyi GN, Ueno NT. Role of epidermal growth factor receptor in breast cancer. Breast Cancer Res Treat. 2012;136:331–45. doi: 10.1007/s10549-012-2289-9. [DOI] [PMC free article] [PubMed] [Google Scholar]
- 16.Reeder-Hayes KE, Carey LA, Sikov WM. Clinical trials in triple negative breast cancer. Breast disease. 2010;32:123–36. doi: 10.3233/BD-2010-0310. [DOI] [PubMed] [Google Scholar]
- 17.Carey LA, Rugo HS, Marcom PK, Mayer EL, Esteva FJ, Ma CX, et al. TBCRC 001: randomized phase II study of cetuximab in combination with carboplatin in stage IV triple-negative breast cancer. J Clin Oncol. 2012;30:2615–23. doi: 10.1200/JCO.2010.34.5579. [DOI] [PMC free article] [PubMed] [Google Scholar]
- 18.Sun T, Aceto N, Meerbrey KL, Kessler JD, Zhou C, Migliaccio I, et al. Activation of multiple proto-oncogenic tyrosine kinases in breast cancer via loss of the PTPN12 phosphatase. Cell. 2011;144:703–18. doi: 10.1016/j.cell.2011.02.003. [DOI] [PMC free article] [PubMed] [Google Scholar]
- 19.Lee ST, Feng M, Wei Y, Li Z, Qiao Y, Guan P, et al. Protein tyrosine phosphatase UBASH3B is overexpressed in triple-negative breast cancer and promotes invasion and metastasis. Proc Natl Acad Sci U S A. 2013;110:11121–6. doi: 10.1073/pnas.1300873110. [DOI] [PMC free article] [PubMed] [Google Scholar]
- 20.Lehmann BD, Bauer JA, Chen X, Sanders ME, Chakravarthy AB, Shyr Y, et al. Identification of human triple-negative breast cancer subtypes and preclinical models for selection of targeted therapies. J Clin Invest. 2011;121:2750–67. doi: 10.1172/JCI45014. [DOI] [PMC free article] [PubMed] [Google Scholar]
- 21.Heiser LM, Sadanandam A, Kuo WL, Benz SC, Goldstein TC, Ng S, et al. Subtype and pathway specific responses to anticancer compounds in breast cancer. Proc Natl Acad Sci U S A. 2012;109:2724–9. doi: 10.1073/pnas.1018854108. [DOI] [PMC free article] [PubMed] [Google Scholar]
- 22.Prat A, Adamo B, Cheang MC, Anders CK, Carey LA, Perou CM. Molecular characterization of basal-like and non-basal-like triple-negative breast cancer. The oncologist. 2013;18:123–33. doi: 10.1634/theoncologist.2012-0397. [DOI] [PMC free article] [PubMed] [Google Scholar]
- 23.Turner NC, Reis-Filho JS. Tackling the diversity of triple-negative breast cancer. Clin Cancer Res. 2013;19:6380–8. doi: 10.1158/1078-0432.CCR-13-0915. [DOI] [PubMed] [Google Scholar]
- 24.Anastassiadis T, Deacon SW, Devarajan K, Ma H, Peterson JR. Comprehensive assay of kinase catalytic activity reveals features of kinase inhibitor selectivity. Nat Biotechnol. 2011;29:1039–45. doi: 10.1038/nbt.2017. [DOI] [PMC free article] [PubMed] [Google Scholar]
- 25.R Development Core Team. R: A language and environment for statistical computing. Vienna, Austria: R Foundation for Statistical Computing; 2014. [Google Scholar]
- 26.Bamford S, Dawson E, Forbes S, Clements J, Pettett R, Dogan A, et al. The COSMIC (Catalogue of Somatic Mutations in Cancer) database and website. British journal of cancer. 2004;91:355–8. doi: 10.1038/sj.bjc.6601894. [DOI] [PMC free article] [PubMed] [Google Scholar]
- 27.Steinley D. Properties of the Hubert-Arabie adjusted Rand index. Psychological methods. 2004;9:386–96. doi: 10.1037/1082-989X.9.3.386. [DOI] [PubMed] [Google Scholar]
- 28.Strehl A, Ghosh J. Cluster Ensembles – A Knowledge Reuse Framework for Combining Partitionings. Journal of Machine Learning Research. 2002;3:583–617. [Google Scholar]
- 29.Graczyk PP. Gini coefficient: a new way to express selectivity of kinase inhibitors against a family of kinases. Journal of medicinal chemistry. 2007;50:5773–9. doi: 10.1021/jm070562u. [DOI] [PubMed] [Google Scholar]
- 30.Lebeau J, Goubin G. Amplification of the epidermal growth factor receptor gene in the BT20 breast carcinoma cell line. Int J Cancer. 1987;40:189–91. doi: 10.1002/ijc.2910400210. [DOI] [PubMed] [Google Scholar]
- 31.Lee MJ, Ye AS, Gardino AK, Heijink AM, Sorger PK, MacBeath G, et al. Sequential application of anticancer drugs enhances cell death by rewiring apoptotic signaling networks. Cell. 2012;149:780–94. doi: 10.1016/j.cell.2012.03.031. [DOI] [PMC free article] [PubMed] [Google Scholar]
- 32.Kang J, Sergio CM, Sutherland RL, Musgrove EA. Targeting cyclin-dependent kinase 1 (CDK1) but not CDK4/6 or CDK2 is selectively lethal to MYC-dependent human breast cancer cells. BMC cancer. 2014;14:32. doi: 10.1186/1471-2407-14-32. [DOI] [PMC free article] [PubMed] [Google Scholar]
- 33.Turner N, Lambros MB, Horlings HM, Pearson A, Sharpe R, Natrajan R, et al. Integrative molecular profiling of triple negative breast cancers identifies amplicon drivers and potential therapeutic targets. Oncogene. 2010;29:2013–23. doi: 10.1038/onc.2009.489. [DOI] [PMC free article] [PubMed] [Google Scholar]
- 34.Sharpe R, Pearson A, Herrera-Abreu MT, Johnson D, Mackay A, Welti JC, et al. FGFR signaling promotes the growth of triple-negative and basal-like breast cancer cell lines both in vitro and in vivo. Clin Cancer Res. 2011;17:5275–86. doi: 10.1158/1078-0432.CCR-10-2727. [DOI] [PMC free article] [PubMed] [Google Scholar]
- 35.Zhang S, Chitu V, Stanley ER, Elliott BE, Greer PA. Fes tyrosine kinase expression in the tumor niche correlates with enhanced tumor growth, angiogenesis, circulating tumor cells, metastasis, and infiltrating macrophages. Cancer Res. 2011;71:1465–73. doi: 10.1158/0008-5472.CAN-10-3757. [DOI] [PMC free article] [PubMed] [Google Scholar]
- 36.Bender RJ, Mac Gabhann F. Expression of VEGF and semaphorin genes define subgroups of triple negative breast cancer. PLoS One. 2013;8:e61788. doi: 10.1371/journal.pone.0061788. [DOI] [PMC free article] [PubMed] [Google Scholar]
- 37.Santarpia L, Qi Y, Stemke-Hale K, Wang B, Young EJ, Booser DJ, et al. Mutation profiling identifies numerous rare drug targets and distinct mutation patterns in different clinical subtypes of breast cancers. Breast Cancer Res Treat. 2012;134:333–43. doi: 10.1007/s10549-012-2035-3. [DOI] [PMC free article] [PubMed] [Google Scholar]
- 38.Xu J, Wu X, Zhou WH, Liu AW, Wu JB, Deng JY, et al. Aurora-A identifies early recurrence and poor prognosis and promises a potential therapeutic target in triple negative breast cancer. PLoS One. 2013;8:e56919. doi: 10.1371/journal.pone.0056919. [DOI] [PMC free article] [PubMed] [Google Scholar]
- 39.Li J, Yen C, Liaw D, Podsypanina K, Bose S, Wang SI, et al. PTEN, a putative protein tyrosine phosphatase gene mutated in human brain, breast, and prostate cancer. Science. 1997;275:1943–7. doi: 10.1126/science.275.5308.1943. [DOI] [PubMed] [Google Scholar]
- 40.Weigelt B, Warne PH, Downward J. PIK3CA mutation, but not PTEN loss of function, determines the sensitivity of breast cancer cells to mTOR inhibitory drugs. Oncogene. 2011;30:3222–33. doi: 10.1038/onc.2011.42. [DOI] [PubMed] [Google Scholar]
- 41.Hollestelle A, Elstrodt F, Nagel JH, Kallemeijn WW, Schutte M. Phosphatidylinositol-3-OH kinase or RAS pathway mutations in human breast cancer cell lines. Mol Cancer Res. 2007;5:195–201. doi: 10.1158/1541-7786.MCR-06-0263. [DOI] [PubMed] [Google Scholar]
- 42.Lehmann BD, Pietenpol JA. Identification and use of biomarkers in treatment strategies for triple-negative breast cancer subtypes. The Journal of pathology. 2014;232:142–50. doi: 10.1002/path.4280. [DOI] [PMC free article] [PubMed] [Google Scholar]
- 43.Masuda H, Baggerly KA, Wang Y, Zhang Y, Gonzalez-Angulo AM, Meric-Bernstam F, et al. Differential response to neoadjuvant chemotherapy among 7 triple-negative breast cancer molecular subtypes. Clin Cancer Res. 2013;19:5533–40. doi: 10.1158/1078-0432.CCR-13-0799. [DOI] [PMC free article] [PubMed] [Google Scholar]
- 44.Hirsch FR, Varella-Garcia M, Bunn PA, Jr, Franklin WA, Dziadziuszko R, Thatcher N, et al. Molecular predictors of outcome with gefitinib in a phase III placebo-controlled study in advanced non-small-cell lung cancer. J Clin Oncol. 2006;24:5034–42. doi: 10.1200/JCO.2006.06.3958. [DOI] [PubMed] [Google Scholar]
- 45.Tsao MS, Sakurada A, Cutz JC, Zhu CQ, Kamel-Reid S, Squire J, et al. Erlotinib in lung cancer - molecular and clinical predictors of outcome. N Engl J Med. 2005;353:133–44. doi: 10.1056/NEJMoa050736. [DOI] [PubMed] [Google Scholar]
- 46.Livasy CA, Karaca G, Nanda R, Tretiakova MS, Olopade OI, Moore DT, et al. Phenotypic evaluation of the basal-like subtype of invasive breast carcinoma. Modern pathology : an official journal of the United States and Canadian Academy of Pathology, Inc. 2006;19:264–71. doi: 10.1038/modpathol.3800528. [DOI] [PubMed] [Google Scholar]
- 47.Sorlie T, Perou CM, Tibshirani R, Aas T, Geisler S, Johnsen H, et al. Gene expression patterns of breast carcinomas distinguish tumor subclasses with clinical implications. Proc Natl Acad Sci U S A. 2001;98:10869–74. doi: 10.1073/pnas.191367098. [DOI] [PMC free article] [PubMed] [Google Scholar]
- 48.Tilch E, Seidens T, Cocciardi S, Reid LE, Byrne D, Simpson PT, et al. Mutations in EGFR, BRAF and RAS are rare in triple-negative and basal-like breast cancers from Caucasian women. Breast Cancer Res Treat. 2014;143:385–92. doi: 10.1007/s10549-013-2798-1. [DOI] [PubMed] [Google Scholar]
- 49.Liu T, Yacoub R, Taliaferro-Smith LD, Sun SY, Graham TR, Dolan R, et al. Combinatorial effects of lapatinib and rapamycin in triple-negative breast cancer cells. Mol Cancer Ther. 2011;10:1460–9. doi: 10.1158/1535-7163.MCT-10-0925. [DOI] [PMC free article] [PubMed] [Google Scholar]
- 50.Craig DW, O’Shaughnessy JA, Kiefer JA, Aldrich J, Sinari S, Moses TM, et al. Genome and transcriptome sequencing in prospective metastatic triple-negative breast cancer uncovers therapeutic vulnerabilities. Mol Cancer Ther. 2013;12:104–16. doi: 10.1158/1535-7163.MCT-12-0781. [DOI] [PubMed] [Google Scholar]
- 51.Gonzalez-Angulo AM, Ferrer-Lozano J, Stemke-Hale K, Sahin A, Liu S, Barrera JA, et al. PI3K pathway mutations and PTEN levels in primary and metastatic breast cancer. Mol Cancer Ther. 2011;10:1093–101. doi: 10.1158/1535-7163.MCT-10-1089. [DOI] [PMC free article] [PubMed] [Google Scholar]
- 52.Lin J, Sampath D, Nannini MA, Lee BB, Degtyarev M, Oeh J, et al. Targeting activated Akt with GDC-0068, a novel selective Akt inhibitor that is efficacious in multiple tumor models. Clin Cancer Res. 2013;19:1760–72. doi: 10.1158/1078-0432.CCR-12-3072. [DOI] [PubMed] [Google Scholar]
- 53.Duncan JS, Whittle MC, Nakamura K, Abell AN, Midland AA, Zawistowski JS, et al. Dynamic reprogramming of the kinome in response to targeted MEK inhibition in triple-negative breast cancer. Cell. 2012;149:307–21. doi: 10.1016/j.cell.2012.02.053. [DOI] [PMC free article] [PubMed] [Google Scholar]
- 54.Garnett MJ, Edelman EJ, Heidorn SJ, Greenman CD, Dastur A, Lau KW, et al. Systematic identification of genomic markers of drug sensitivity in cancer cells. Nature. 2012;483:570–5. doi: 10.1038/nature11005. [DOI] [PMC free article] [PubMed] [Google Scholar]
Associated Data
This section collects any data citations, data availability statements, or supplementary materials included in this article.