Abstract
Off-resonant radiofrequency irradiation in tissue indirectly lowers the water signal by saturation transfer processes: On the one hand, there are selective chemical exchange saturation transfer (CEST) effects originating from exchanging endogenous protons resonating a few ppm from water; on the other hand, there is the broad semi-solid magnetization transfer (MT) originating from immobile protons associated with the tissue matrix with kHz line-widths. Recently it was shown that endogenous CEST contrasts can be strongly affected by the MT background so that corrections are needed to derive accurate estimates of CEST effects. Herein we show that a full analytical solution of the underlying Bloch-McConnell equations for both MT and CEST provides insights into their interaction and suggests a simple means to isolate their effects. The presented analytical solution, based on the eigenspace solution of the Bloch-McConnell equations, extends previous treatments by allowing arbitrary line-shapes for the semi-solid MT effects and simultaneously describing multiple CEST pools in the presence of a large MT pool for arbitrary irradiation. The structure of the model indicates that semi-solid MT and CEST effects basically add up inversely in determining the steady-state Z-spectrum, as previously shown for direct saturation and CEST effects. Implications for existing previous CEST analyses in the presence of a semi-solid MT are studied and discussed. It turns out that to accurately quantify CEST contrast, a good reference Z-value, the observed longitudinal relaxation rate of water, and the semi-solid MT pool size fraction, must all be known.
Introduction
There is increasing interest in chemical exchange saturation transfer contrast as several metabolites have been reported to be detectable by this approach in vivo (1), including amide protons in proteins (2, 3), creatine (4, 5), glutamate (6) and glucose (7, 8). However, the signal of both endogenous DIACEST agents and exogenous PARACEST agents (9) may be altered by concomitant effects from direct saturation and semi-solid magnetization transfer (MT) (1, 10, 11). Recently, it was shown that changes in underlying MT can affect CEST signals evaluated by asymmetry analysis, which makes a proper understanding of their non-linear interaction necessary (12–15).
Recent studies have allowed insight into the interaction between direct water saturation and CEST, and showed that the effects add up inversely (1, 12, 13). This inverse addition of CEST effects was also assumed for the interaction between CEST and semi-solid MT, but was not investigated in detail.
In this study, we show that semi-solid MT be described by the same formalism as CEST and be understood as a form of T1ρ-decay. The major benefit of this approach (compared to numerical multi-pool simulations) is that the interactions of the effects become clear by inspection of the analytical formula. Herein we give a general formula for R1ρ for systems including semi-solid MT with Gaussian, Lorentzian or Super-Lorentzian line-shapes as previously observed in vivo. This new approach describing semi-solid MT is in agreement with the well-known and validated steady-state solution of Henkelman et al. (16, 17), as well as with the R1ρ-models valid for CEST (13, 18, 19); thus by putting previous approaches on a common ground, we give a unified analytical theory for semi-solid MT and CEST.
As a model for analysis, we used a three-pool-system similar to human muscle tissue: in muscle, the semi-solid MT has a pool size fraction of about 7% (20), and a dominant CEST effect from creatine has been reported (5). As the guanidinium protons of creatine are in the intermediate exchange regime at physiological conditions (21) efficient labelling requires high saturation power (1), which leads to a strong semi-solid MT contribution to the obtained Z-spectra. A three-pool-system like this is investigated by Bloch-McConnell simulation, as well as experimentally using creatine in cross-linked bovine serum albumin (BSA) as a phantom.
We show that the experimental data can be modeled accurately with the adjusted R1ρ-model, which provides evidence for a simple but elegant result; namely, the steady-state Z-spectrum is basically given by the eigenvalue of the free system R1obs divided by the eigenvalue of the irradiated system R1ρ. The eigenvalue of the free system is exactly the observed decay rate in an inversion recovery experiment. Further, we show that the reduction in the CEST effect in the presence of MT can be understood by the fact that R1ρ is a superposition of all rotating frame relaxation rates. This allows for the isolation of the CEST effect by determining the exchange-dependent relaxation rate (Rex), and therefore, the dilution by a semi-solid MT pool can be corrected. Implications for existing CEST correction techniques such as AREX (12) or iTIP (22) in the presence of semi-solid MT pool are studied and discussed.
Theory
Bloch McConnell equations for two and three pools
The dynamics of magnetization of a dipolar coupled spin-system during off-resonant irradiation can be described by the Bloch-McConnell (BM) equations (23) including chemically exchanging spins.
In the rotating frame of reference (x, y, z) defined by the frequency ωrf of the oscillating field B1(t), the BM equations for three pools, water (pool a), CEST (pool b) and a semi-solid pool (pool c) with the combined magnetization vector
| (1) |
read (24)
| (2) |
where A is a 7×7 matrix as given in Appendix A. The constant vector C is given by the longitudinal relaxation rates and the equilibrium magnetizations M0:
| (3) |
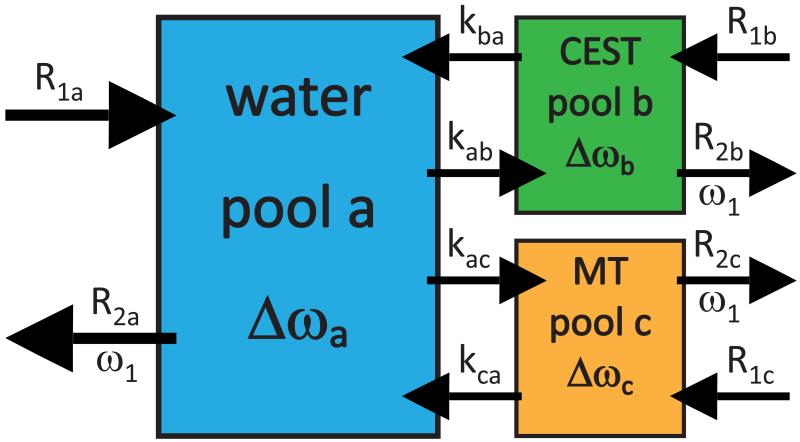
The matrix A and thus the whole equation system is characterized by the following parameters (see figure 1): The quantity Δω Δωa ωrf − ωa is the radio frequency offset relative to the Larmor frequency ωa of pool a (for 1H: ωa/B0 = γ = 267.5 rad/μTs). The offset of pool b: Δωb = ωrf − ωb = Δω − δbωa, is shifted by δb relative to the abundant–spin resonance. Similarly, the offset of the MT pool is Δωc. Longitudinal relaxation rates R1,a/b = 1/T1,a/b can be in the order of Hz, while transverse relaxation rates R2,a/b = 1/T2,a/b can be in the order of 10–100 Hz for in vivo 1H systems. For macromolecules and bound water R2c can take values up to 106 Hz (20). The line-shape of the macromolecular pool, which is not always Lorentzian, can be incorporated in the Bloch-McConnell system by introducing the term Rrfc, which allows modeling of arbitrary MT line-shapes such as Lorentzian, Gaussian, and Super-Lorentzian line-shapes (see Appendix A). The population fraction fb = M0b/M0a can be assumed to be < 1 %, hence kab is small compared to kba. In contrast, the pool size fraction of MT, namely fc = M0c/M0a, can be as large as 19 % for cartilage, but is in the range of several percent for most tissues (20). Similar to Desmond et al. (24) we neglect direct exchange between MT and CEST pools, which is plausible as long the pools are small compared to the water pool.
Figure 1.
3-pool model of a water proton pool (pool a), one solute pool with exchanging site (CEST pool b), and the semi-solid MT pool of bound water (pool c). All pools recover magnetization by their longitudinal relaxation rate R1, and loose magnetization by R2, due to RF irradiation with amplitude B1=ω1/γ. The exchange rate kca of the MT pool is typically in the range of several 10 s−1.
The formal solution of the Bloch-McConnell equation is given by
| (4) |
This equation is effectively an algorithm due to the computationally complex matrix exponent, but is here and commonly used for numerical solution of the Bloch-McConnell equations (25).
Eigenspace solution
The solution of the Bloch-McConnell equations for two pools, water pool a and rare pool b, predicts that the water z magnetization after long irradiation at the rf frequency offset Δω, normalized by the equilibrium magnetization (Z(Δω)=Mz,sat(Δω) /M0) is given by (13)
| (5) |
In the two pool case, the longitudinal relaxation in the rotating frame is given as a superposition (13)
| (6) |
where the water relaxation in the rotating frame Reff is given by (26)
| (7) |
with
| (8) |
and the exchange dependent relaxation for a CEST pool is given by (13)
| (9) |
In previous work, this Rex-formula for CEST was also used for MT (13, 15). However, this equation was derived using six coupled Bloch-McConnell equations that implicitly assume a Lorentzian line shape, which is not applicable to the semi-solid MT pool, and hence may give inaccurate results for MT. Instead, a new function has to be found. Here, we employ the eigenvalue calculation formalism (see Appendix A3), which was successful for CEST (13), to also derive a suitable eigenvalue for the 4×4 Bloch-McConnell equations used for MT. The algorithm of our previous work (13) applied to the 4×4 BM equations yields (see appendix A3):
| (10) |
where r1a = R1a − Reff , r2a = R2a − Reff , and r1c = R1c + Rrfc − Reff. An implementation of this formula can be found online (27).
The hypothesis of this work is that all three pools –water, CEST and MT – can be described simultaneously, by superimposing their rotating frame relaxations:
| (11) |
, which is valid for fb,fc<<1.
Influence of the MT pool on R1
A semi-solid MT pool has also a strong contribution on the T1 recovery of water: the free eigenvalue is given by (16) (see also appendix A4)
| (12) |
One can show that R1ρ approaches R1obs in the limit of far off-resonant irradiation (Δωa→∞) (see appendix A3). If we apply the same limit to the Z-spectrum formula (eq. (5)), the cosine term becomes 1, and, as the Z-value must also be 1, R1ρ and R1a should actually be equal. As this is not the case, the numerator of eq. (5) must be R1obs, not R1a.
The adjusted Z-spectrum in the case of CEST and a semi-solid MT pool is thus given by
| (13) |
With this steady state, the R1obs-normalized R1ρ-model is given by (13):
| (14) |
where Zi is the initial magnetization before saturation.
As derived in appendix A5, for large fc a further term improves the solution:
| (15) |
This term can be understood by the fact that was calculated by the two-pool model, and was artificially incorporated in the 3-pool-model.
To verify our theory, calculated Z-spectra are compared to the numerical solution of the full Bloch-McConnell equations, described in the next section. In the case of an MT pool only, the steady-state Z-spectra were also compared to the previously validated formula of Henkelman et al. (16) which reads
| (16) |
Methods
Bloch-McConnell simulations
For simulations equation (4) was evaluated using the expm function of MATLAB (MATLAB version 8.2.0.701 Natick, Massachusetts: The MathWorks Inc., 2013) (25). Standard parameters were chosen similar to muscle tissue at 3T (20): water: T1a=1.412 s, T2a= 50 ms, Δωa=0 ppm; MT: T1c=1 s, T2c=8.7 μs, fc=7.4 %, kca= 66 s−1, Δωc=0 ppm; For CEST a pool similar to creatine in muscle was assumed, based on the creatine phantom experiments at in vivo conditions of Goerke et al. (21): T1b=1.412 s, T2b=15 ms, fb=0.14 %, kba=1500 s−1, Δωb=1.9 ppm. The static field B0 was 9.4 T, the standard irradiation was realized by a block pulse of RF amplitude B1=2 μT and a pulse duration tsat=10 s. The the analytic R1ρ-model (eqs. (14,15)) was also implemented in MATLAB; the source code can be downloaded from the website http://www.cest-sources.org (27).
Phantom preparation
Two 3-ml-phantoms were created and buffered using phosphate-based sodium-potassium buffer at pH=7.3. For both phantoms, a semi-solid MT pool was achieved by adding BSA, which was then cross-linked by adding 25μl/3ml glutheraldehyde. In one phantom, a CEST pool was realized by adding 50mM creatine to the solutions. Creatine has an exchanging guanidinium group (−NH2) resonating at approximately 1.9 ppm (21).
NMR acquisition and evaluation
CEST images were acquired using a spin-echo echo-planar imaging using a triple reference reconstruction (14, 28). Imaging parameters were: FOV: 32×32, matrix: 64×64, slice thickness: 4 mm, TE = 30 ms. Both phantoms were in the same FOV. All further data refer to averaged pixel values within each phantom.
The pre-saturation of the CEST images was achieved by continuous wave irradiation of 7s. Seven different B1 amplitudes were used: 0.5μT, 0.75μT, 1μT, 1.5μT, 2μT, 3μT and 4μT. Frequency offsets were distributed with higher sampling around the CEST pool: ±1000 Hz to ±600 Hz in steps of 20 Hz. From ±600 Hz to ±100 Hz in steps of 100 Hz, from −40Hz to 40 Hz in steps of 20 Hz. Semi-solid MT was sampled using the following offsets in Hz: ±1100, ±1200, +1833, +2637, +3793, +5456, +7848, +11288, +16238, +23357, +33598, +48329, +69519. In additions, an unsaturated image M0 was acquired after saturation at 100 kHz.
T1 maps were acquired using the same EPI readout after an inversion recovery pulse with 10 different inversion times.
Results
2-pool-simulation – water and MT
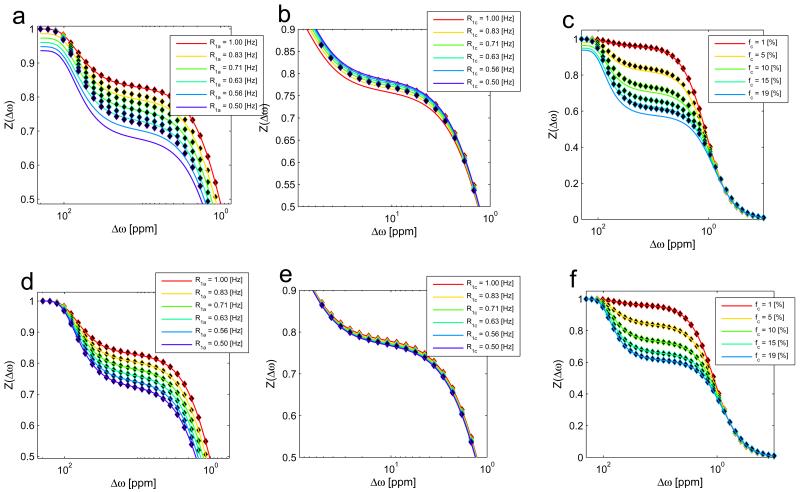
In a first experiment the full-BM-simulation for a 2-pool system (water pool a and MT pool c) was compared with the naive R1ρ-model of equation (5), and with the R1ρ-model extended by R1obs in the enumerator, equation (13). The muscle-like pool system was altered in the parameters R1a, R1c and the MT pool size fraction fc, which have the strongest effect on R1obs. It turns out that the simulated Z-spectra (Figure 2, dots) can be described much more accurately by the extended approach (eq. (13)) than by the naive approach (eq. (5)). The naive R1ρ-model (Figure 2a-c) is valid only if R1a≈R1c and if fc is small. The R1obs-normalized R1ρ-model (Figure 2d-f), is able to describe variations in R1 and a MT pool size fraction up to 19% which corresponds to the MT in cartilage. Thus in the following, the term “R1ρ-model” refers to the extended approach (eq. (13)) .
Figure 2.
Influence of relaxation changes by the MT pool: Top row: R1a in the enumerator (eq. (13)). Bottom row: R1obs in the enumerator (eq. (5)). Obviously, if using the original theory with R1a in the enumerator the theory does not fit the data especially it does not converge to 1 for far off-resonant offsets. If R1obs is used in the enumerator, the theory fits the simulated Z-spectra much better. Thus R1obs has to be chosen in the enumerator as given in equation (13).
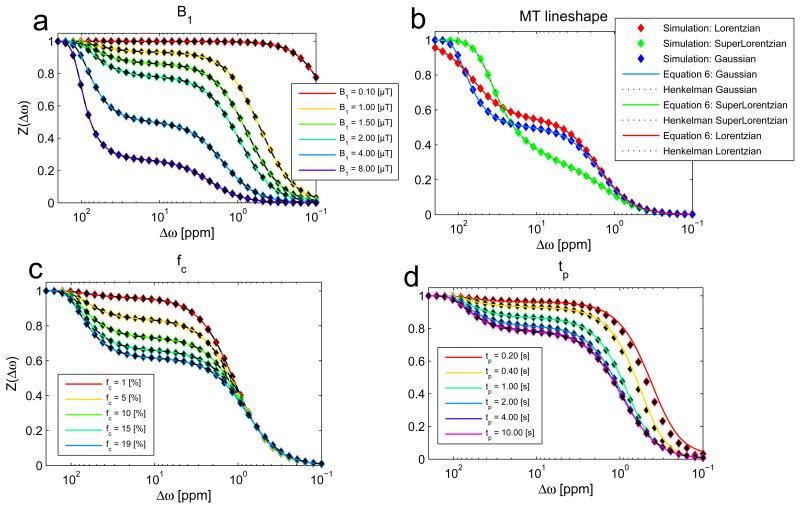
The R1ρ-model is in agrees with the Henkelman model (eq. (16)) and the full-BM-simulation for different B1 (Figure 3a), different MT lineshapes (Figure 3b) and different MT pool size fractions fc(Figure 3c). In contrast to the Henkelman model, the R1ρ-model is also applicable for non-steady-state saturation (Figure 3d): Simulation and analytical solution match with good accuracy down to saturation times of tsat=0.8s which corresponds to approximately 0.5·T1a. (For saturations less than 0.8s, and especially at smaller offsets, the magnetization dynamics are dictated by eigenvalues besides the smallest, which is outside the regime of validity for our approach (13). The Henkelman model is valid only in a steady-state which is nearly coincident with the solution at 10s of saturation (red line, Fig 3d).
Figure 3.
The R1ρ-model (solid lines) matches the full numerical simulation (dots) as well as the Henkelman solution (dashed lines) for different B1 (a), different MT lineshapes (b) and different MT pool sizes up to 19% (c). In contrast to the Henkelman model, the R1ρ-model is also able to describe non-steady-state irradiation (d): As other eigenvalues than R1ρ become more important for short irradiation times, the R1ρ-model deviates from the full simulation for saturation times much lower than T1. For offsets relevant for CEST (>1ppm) the R1ρ-model is accurate already after ~0.4 s of irradiation.
2-pool-experiment – cross-linked BSA
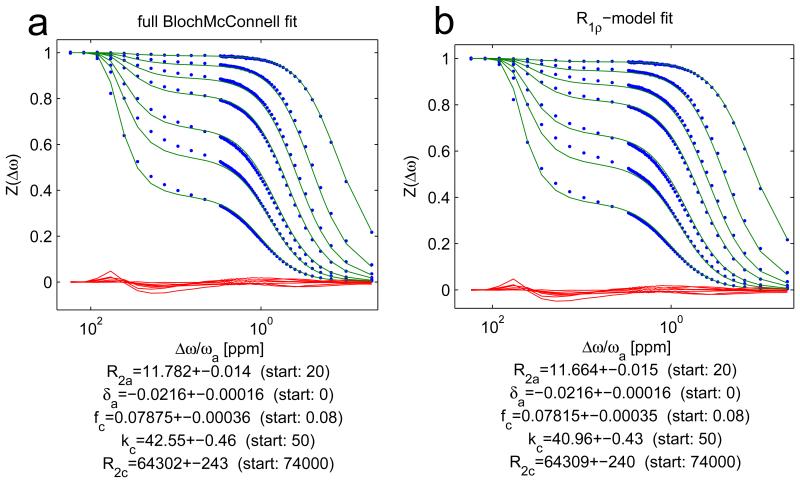
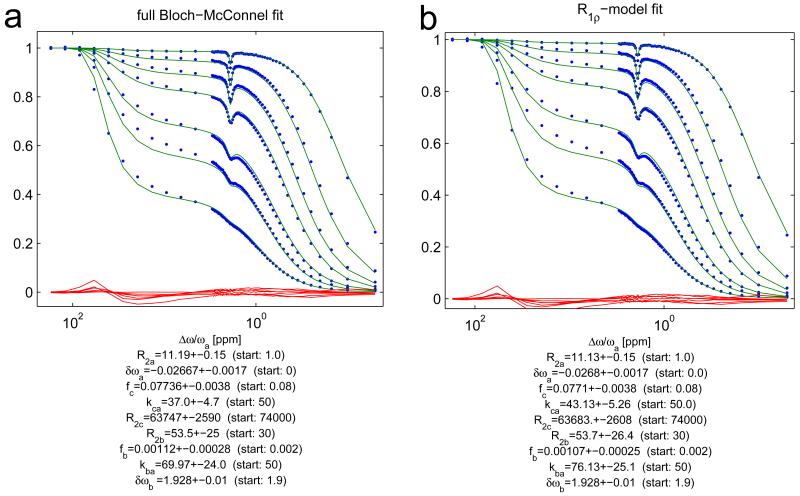
Experimentally, the R1ρ-model was validated by a multiple-B1-fit to Z-spectra data of a cross-linked BSA phantom. By providing R1obs to the fit algorithm, a complete quantification is possible. The fit using the full Bloch-McConnell simulation (Figure 4a) and the fit using the R1ρ-model (Figure 4b) show very similar outcomes and yield fit parameters which agree within their 95%-confidence intervals. Thus, the R1ρ-model is sufficient to quantitatively describe our experimental data. Deviations from the data for both models might be due to a wrong lineshape. We tested Lorentzian, SuperLorentzian and Gaussian lineshapes, and the latter gave the smallest residuals. Residuals are very similar for both models, which indicates that the R1ρ-model is as good as the full BM simulation.
Figure 4.
Experimental Z-spectrum data from the cross-linked BSA phantom (dots) together with the multiple-B1-fit using the full Bloch-McConnell simulation (a) and the fit using the R1ρ-model of equation (13) (b): All fit parameters agree within two confident intervals.
3-pool-simulation – water, MT and CEST
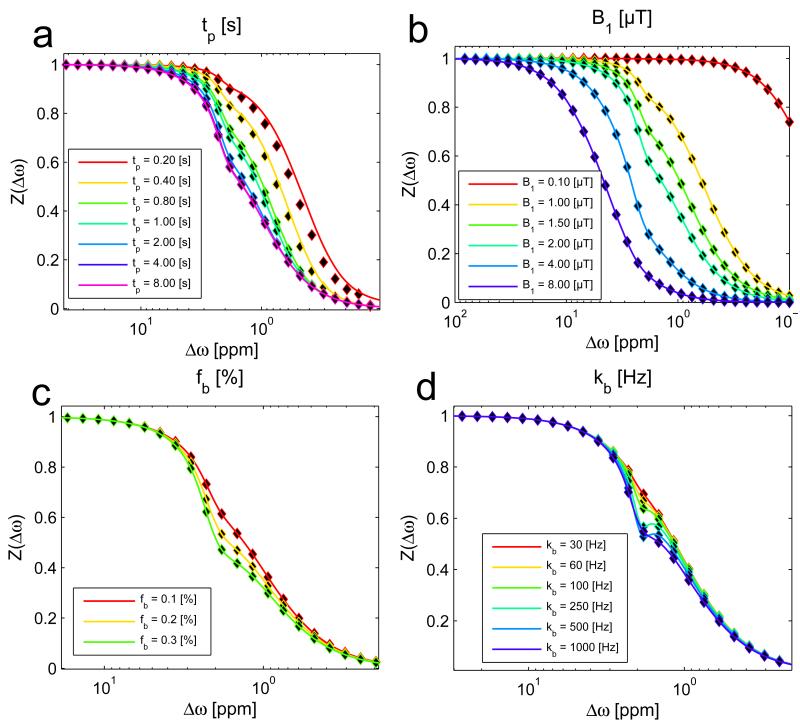
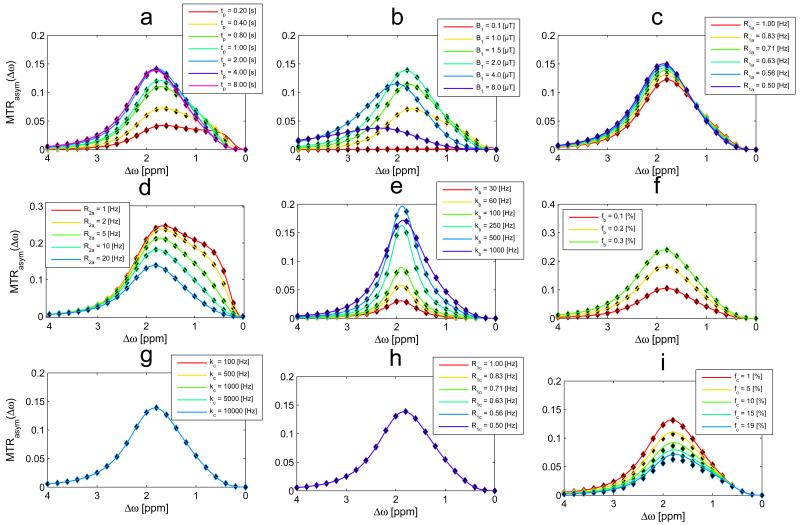
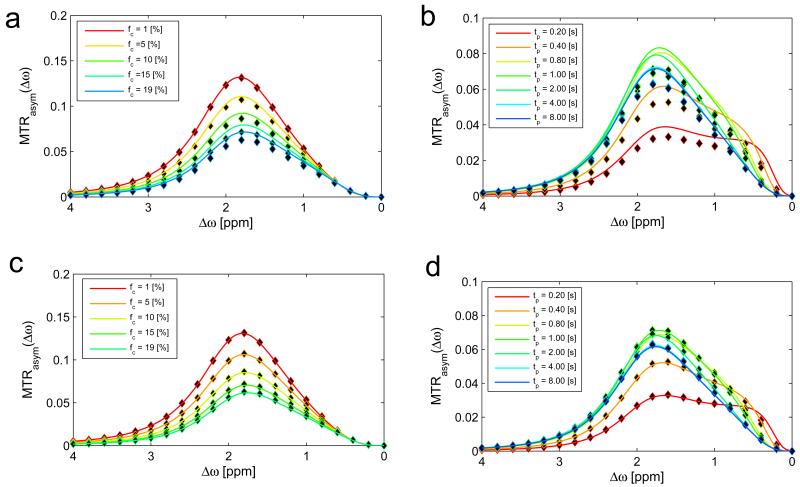
The agreement of the two-pool system of water and semi-solid MT with full Bloch-McConnell simulations and previous approaches provides a solid basis for a three-pool-model of water, MT, and CEST. In a first step, we focus on changes in the MT by adding a CEST pool: the R1ρ-model and the full-BM-simulation match also in the case of a three-pool-system for different saturation parameters (Figure 5a-b) and CEST-pool parameters (Figure 5c-d). By zooming into to the spectral range of the CEST resonance (Figure 6) it can be seen: The description of the CEST effect is accurate for a variety of irradiation- and relaxation parameters, as well as CEST pool and MT pool parameters. The spillover and MT dilution effects (apparent for large B1 and fc, respectively) is well described by the R1ρ-model. Only for MT pool fractions (fc larger than 10%) a deviation from the full-BM-simulation is observed. This deviation can actually be very nicely compensated by using the extended R1ρ-model with the R1ρ of eq. (15), improving the MTRasym prediction for larger fc (Figure 7 a,c). Application in the transient-state proves that the rate R1ρ of eq. (15) is also beneficial in this case (Figure 7 b,d).
Figure 5.
Interaction of CEST and MT: The R1ρ-model (solid lines) matches the full numerical simulation (dots) for different saturation times (a) after ~0.4 s of irradiation, for different irradiation power B1 (b) and different CEST pool sizes (c), as well as for very different exchange rates of the CEST pool (d). For detailed view of CEST effects see the asymmetry plots in figure 6.
Figure 6.
Interaction of CEST and MT: The asymmetry of Z-spectra calculated by the R1ρ-model (eq. (10), solid lines) matches the outcome of the full BM simulation (dots) for different saturation times (a), for different irradiation power B1 (b) and different water relaxation (c,d), and different CEST pool parameters (e,f). Where the MT pool parameters R1c and kc (g,h) do not alter the CEST effect much, the MT pool size fraction fc (i) dilutes the apparent CEST effect. This dilution is not described properly by the R1ρ-model of eq. (10) (i).
Figure 7.
Interaction of CEST and a large semisolid MT up to fc=19%. The asymmetry of Z-spectra calculated by the R1ρ-model (eq. (11), solid lines) matches the outcome of the full BM simulation (dots) only for small fc (a). Figure (b) reveals that the CEST effect with an MT pool of 19% can also not be modeled by eq. (11) for different saturation times. Figure (c) and (d) show the same plots now with the R1ρ-model using equation (15): The additional term describes the dilution of the CEST effect properly. The transient-state plots (b) and (d) indicate that the added term has to be a factor of Rex and not of R1obs, which is dominant in the steady-state.
3-pool-experiment – cross-linked BSA and creatine
In a next step we compare the R1ρ-model with the full Bloch-McConnell solution by fitting experimental data of a system of water, MT, and CEST which was realized by a cross-linked BSA phantom containing 50mM of creatine (figure 8). First of all, the determined MT pool parameters with (figure 8) or without (figure 4) addition of creatine did not change within the confidence intervals. Secondly, the fit does not match to the data perfectly for the full-BM-simulation as well as for the R1ρ-model. This might be due to the limitation of the three pool system, as in the phantom may exist more and less restricted creatine molecules within the cross-linked-BSA matrix; this might lead to a distribution of chemical exchange rates and relaxation parameters of the CEST pool. Another explanation could be direct exchange between MT and CEST pool which was neglected in the R1p-model, as well as in the full-BM-simulation. Also, the creatine fraction seems to be too small in both cases. Nevertheless, the validation on the level of the BM solution can still be performed and shows that parameters obtained by the R1ρ-model are very close to parameters obtained by fitting the data with the full-BM-simulation. Both parameter sets match within the 95%-confidence interval. Thus, the R1ρ-model is able to quantitatively describe experimental three-pool data as well as the full-BM simulation, in the case of asymmetric populations, long enough saturation (>>T2a), and no direct exchange between MT and CEST.
Figure 8.
Interaction of CEST and MT in experiment. Experimental Z-spectrum data from the phantom with creatine-cross-linked-BSA (dots) together with the multiple-B1-fit using the full-BM-simulation (a), using the fit using the R1ρ-model of equation (15): The parameters obtained by the models agree within two confident intervals. The analytical R1ρ model (b) seem to yield a higher exchange rate but a lower creatine concentration.
Given that MT and CEST can be described by the R1ρ-model, this leads to the following conclusions:
Our model should be able to fit to in vivo data with the same accuracy as a numerical BM-fit
The interaction of water saturation, CEST and MT is given by the addition of their individual contributions to R1ρ as expressed by eq. (15) .. Thus to isolate them from one another, e.g. isolating a CEST signal from water saturation and MT, we just need an estimate of their R1ρ as a reference. In particular, it is not necessary to know the line-shape. Having R1obs, estimation of the reference R1ρ,ref is the estimation of the reference Z-value (as R1ρ,ref≈Zref/R1obs). Finding Zref is a common problem in CEST-MRI and can be solved e.g. by asymmetry analysis (29), three-point-methods(12, 14, 30), or Lorentzian fit approaches (11, 31, 32).
As R1obs is mainly affected by the large MT pool and less by the CEST pool of interest (see also Appendix A4), a relaxation compensation of CEST effects can be simply performed after measuring the R1obs of water by a saturation/inversion recovery experiment.
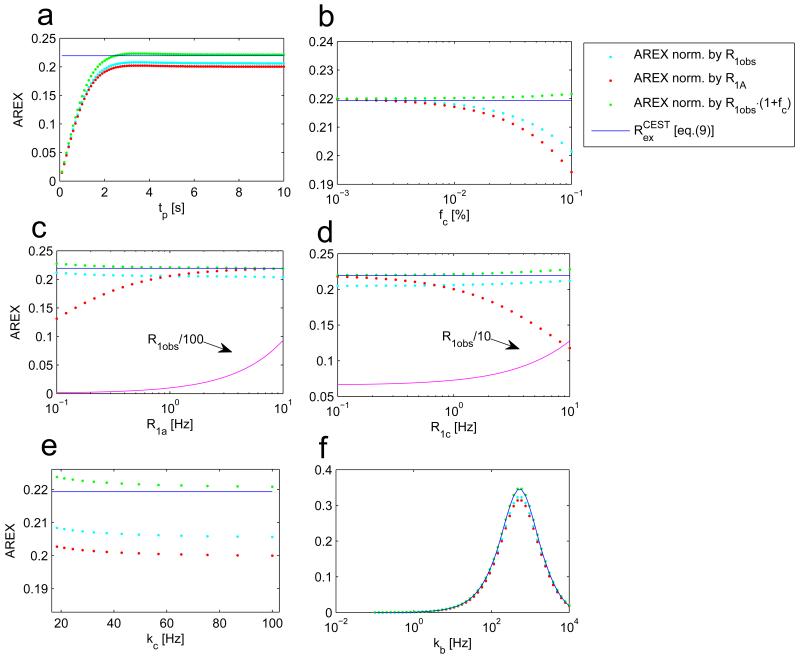
- Finally, the spillover and T1 corrected CEST evaluation AREX (apparent exchange-dependent relaxation (12, 14), based on the inverse metric of the Z-spectrum, should also be valid for systems with semi-solid MT if R1a is altered to R1obs, and a term (1+fc) is added in the AREX formula: Instead of
it should read:(17)
To validate this last point, we performed a simulation of AREX scaled by R1a, AREX scaled by R1obs, as well as AREX scaled by R1obs·(1+fc). The parameters R1obs and fc can actually be measured by the selective inversion recovery sequence of Gochberg et al. (33-35). Figure 9 reveals that AREX as defined in eq. (18) yields the best estimate of Rex in a steady-state and remains constant under changes of relaxation and MT pool parameters fc, kca, R1a and R1c, and describes the corrected chemical exchange saturation transfer effect well in the slow-, intermediate- and fast exchange regimes.(18)
Figure 9.
AREX evaluation of creatine CEST normalized with R1a (red dots) and normalized by R1obs (cyan dots) and normalized by R1obs(1+fc) (green dots). As expected the AREX metric requires steady-state to be able to yield Rex (a). For all variations (b-f), the AREX normalized by R1obs(1+fc) (eq. (18)) seems to be less sensitive on changes of the individual pools and their relaxations and yields a robust estimation of the theoretical exchange-dependent relaxation Rex (blue solid line).
Discussion
Understanding saturation transfer experiments in a biophysical context requires understanding complex multi-pool interactions. In a saturation transfer experiment in vivo, first, the relaxation of the water pool has to be described; second, several exchanging or dipolar coupled pools are present; and third, the semi-solid pool of relatively immobile protons associated with the tissue matrix must be accounted. All these effects are already described by the Bloch-McConnell differential equations (36) and their multi-pool extensions (37). However, the Bloch-McConnell equations do not allow direct insight into how the isolated effects interact to affect the multi-pool Z-spectrum. Herein, we showed that this insight into the interaction of CEST and semi-solid MT can be obtained by a combined analytical solution based on relaxation in the rotating frame.
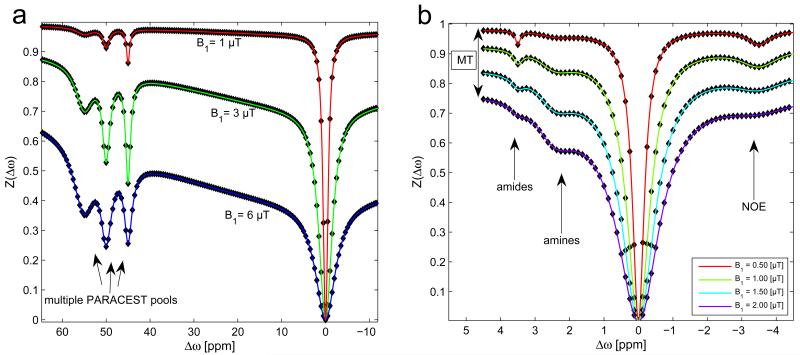
The overall Z-spectrum is in practice dominated by two eigenvalues: the smallest eigenvalue of the free system, which is R1obs, and the eigenvalue of the irradiated system which is R1ρ. The steady-state Z-spectrum is basically given by R1obs divided by R1ρ. Herein we gave a general formula for R1ρ for systems including semi-solid MT with Gaussian, Lorentzian or Super-Lorentzian line-shapes previously observed in vivo. The outcome of the analytic fit with the R1ρ-model compared to the full numeric fit model shows agreement of all parameters within the 95% confidence interval. In addition, this new approach agrees with the well-known and validated steady-state solution of Henkelman et al. (16, 17), as well as with the R1ρ-models valid for CEST (13, 18, 19); thus by putting previous approaches on a common ground, we give a unified analytical theory for semi-solid MT and CEST able to describe multiple CEST pools in the presence of in-vivo-like MT (see figure 10). Our previous analytical approaches to describe CEST and MT were not able to quantify the MT properly, especially MT lineshapes other than Lorentzian, and large fc values were not accounted (11, 13).
Figure 10.
(a) Simulation of Z-spectra of multiple PARACEST agents in a muscle-like water/MT system at 9.4T for different B1 (1,3,6μT) after 2 s of irradiation. Simulation (dots) and analytical solution (lines) match also in the case of large MT contribution at B1=6μT. The PARACEST pools were assumed to have the same R1=0.7 Hz, and R2=30.30 Hz, and fractions f=0.2%, with exchange rates of 1000Hz at 45ppm, 2000 Hz at 50 and 5000Hz at 55ppm. (b) Simulation of Z-spectra of endogenous CEST effects apparent in white brain matter with a shifted semi-solid MT (at −2.6ppm, fc=13.9%) at 7T for different B1 after 10 s of irradiation. The used NOE concentration was 2.39 %. Amide and amide concentration was set to 0.2%. kamide was 30 Hz, kamine = 1500 Hz and kNOE=20 Hz.
MT modeling
Analytical solutions for transient- and steady-state Z-spectra for MT were previously given in the articles of Adler, Swanson and Yeung (38, 39); instead of modeling MT by the Bloch-McConnell equations, the dipolar coupled Bloch-Solomon equations were solved by a Laplace transformation or a projection operator technique. In addition, the Redfield-Provotorov equations (40, 41) were also used to describe MT, which are more suitable to a solid-like system and allow arbitrary MT line-shapes (42). The extension to Gaussian line-shapes for the semi-solid pool were incorporated here and showed to fit cross-linked BSA data more accurately (42). Henkelman et al. showed that these line-shapes can actually be incorporated in the simpler Bloch-McConnell equation system for which an analytical solution for the steady-state magnetization was given (16, 43). Our approach is in that way similar to Henkelmans’ and the results are in agreement in steady-state; beyond that, our approach extends Henkelmans’ approach for application in the transient-state and shows that both transient- and steady-state are dictated by R1ρ.
CEST modeling
In the case of CEST, several approximate solutions of the Bloch-McConnell system for MTRasym have been given by Zhou et al. (29) and Sun et al. (10, 44, 45). However, these solutions did not allow calculation of the whole Z-spectrum. A first analytic solution for the whole Z-spectrum was based on a probabilistic combination of single Z-spectra (11). This turns out to be a nice fitting model and also implicitly incorporates the inverse metric (1, 12), but it does not accurately describe a full Bloch-McConnell simulated Z-spectrum, especially for larger B1. The first accurate solutions based on eigenspace analysis of the Bloch-McConnell system – or the similarity of off-resonant spin-lock and CEST – were given by Jin et al. (18, 19) and extended for arbitrary transverse relaxation by Zaiss et al. (1, 13, 46) and formed the basis of the presented R1ρ-model. For fc→0 and fb<<1 our model is completely in agreement with the previous solution for CEST (13). The incorporation of larger transverse relaxations of the exchanging pool already allowed to simulate a semi-solid-like MT effect by the previous model (13), but this did not yield quantitative MT results and could not incorporate arbitrary MT line-shapes.
Experimental outcome MT
The parameters obtained by the numerical fit for the proton fraction fc = (7.9±0.4) % agree well with other MT experiments employing 15% cross-linked BSA of fc = (9.0±1)% (34) and fc = (8.5±0.4)% (33). As well, the magnetization transfer exchange rate kca = (42.6±5.5) s−1 is in agreement with the value measured at B0 = 2 T by Gochberg and Gore (33) of kca = (45 ± 5) s−1. A Gaussian line-shape of the semi-solid MT was assumed, which is known to not match perfectly to the MT of cross-linked BSA (38, 39, 47). Still the T2c-value of cross-linked-BSA agrees with 15.5 μs well to values in the 10 μs range reported previously (33). Altogether, the phantom is very near the in-vivo situation where MT parameters are (20): fc = 5–10%, kca = 20 – 50 s−1, T2c = 10 μs. In vivo, the MT pool can be shifted to negative frequencies. This phenomenon might be better realized by egg-white phantoms (48) or lamellar liquid crystal approaches (49).
Experimental outcome MT with CEST
MT parameters are very near the parameters without creatine, so the semi-solid MT seems to be almost unaffected by addition of creatine. However, CEST parameters are actually lower as expected. A control experiment of only creatine and water at pH= 7.3 (data not shown) suggests that under the crosslinking process, the relative proton fraction drops from 0.15% to 0.11 % and the exchange rate from 460 s−1 to 72 s−1 while R2b increases from 20 s−1 to 55 s−1. The drop in concentration could be to reduced accessibility of the creatine protons if cross-linked BSA is apparent, or to non-specific binding effects. The transport of the saturated protons within the water might also be decreased, which could be an explanation for both, lower exchange rate and lower proton fraction. In addition, the pH value is not easy to define in a semi-solid gel and it could have decreased due to addition of gluteraldehyde. It is also known that BSA buffers itself to pH ~7, in the cross-linked state it might lose this ability and the acidity of creatine might lower the pH-value. The drop in exchange rate would correspond to a pH drop from 7.3 to 6.53 according to the calibration given by Goerke et al. (21). The increased R2b value indicates that the creatine molecules are more restricted in cross-linked BSA.
Superposition of R1ρ and inverse metric
In a recent paper, Desmond and Stanisz (24) stated “Most importantly, the CEST/MT spectrum was not simply an addition of the CEST and MT spectra, indicating that the effects of each pool on the MR signal were not independent.” (with permission, from Desmond and Stanisz, (2012), MRM,67: 979-990). The presented R1ρ-model can now give an answer to the question of interaction of CEST and MT by inspection of the theory: (i) With a dominant semi-solid MT the apparent longitudinal relaxation rate R1obs changes, (ii) saturation transfer effects in the steady-state Z-spectrum add up inversely, (iii) the CEST effect is additionally diluted by the factor (1+fc). Actually, the term (1+fc) is not surprising as it can also be understood with Trott and Palmers original theory (26): in their paper Rex = pa · fbkb with in the case of two pools; for three pools this can be extended to yielding the mentioned term if fb<<1.
With that knowledge, we are able to isolate the exchange-dependent part by extending previous approaches. For the transient method iTIP of Jin et al. (22), which is able to directly measure R1p, our results imply that the factor (1+fc) has to be added after isolation of Rex. For the steady-state method AREX (12) we showed that a factor of R1obs(1+fc) has to be used to normalize the inverse difference (Figure 9). Interestingly, R1obs as well as fc can be measured by the same sequence using the selective inversion recovery sequence published by Gochberg et al. (34). Finally, for correction of a CEST effect not all water and MT pool parameters have to be known, but just a good reference scan together with R1obs and fc. In particular, the MT line-shape is not so important.
In our previous studies of CEST in stroke (12) and glioma (14) already the observed R1 was used for normalization, which now turned out to be correct and not just an approximation. The term (1+fc) was not included but will not change the general outcome of these studies, as the term does change the outcome only slightly.
Compartment issues
The first question about AREX was, which R1 has to be used, the intrinsic water pool R1a or the observed R1obs, detectable as slow rate constant in an inversion recovery sequence, could be answered: if there is one compartment in a voxel, R1obs is the better choice. But what happens if there is more than one water compartment, such as water in intra-cellular and extra-cellular space having different R1obs?
If these compartments are in exchange faster than T1obs, an average R1obs and R1ρ would observable and the presented theory and thus AREX would still be valid. AREX is also approximately valid if the extra-cellular partition is small, which might still be the case in healthy tissue: the compartmental fraction of extra-cellular (F) compared to intra-cellular (1-F) is about F=9-19% for muscle tissue (50, 51) and F=19±8% for rat brain matter (52) (we use uppercase F here for compartment fractions, pool size fractions have a lower case f). However, in tumors it could be higher or lower depending in the tumor type. If F is not negligible it should be possible to determine the individual R1obs and fractions of the compartments by a multi-exponential fit of the recovery of the voxel signal, as done in lung perfusion imaging (53). With F and R1obs,intra again AREX can be applied, and also be corrected from the dilution factor (1-F). So, with a little more effort, AREX can also be applied for CEST evaluation in the case of multi-compartments.
We think that in vivo the case of an average R1obs and R1p is most probable since typical intracellular exchange lifetimes are ~ 550 ms in brain tissue (52, 54), which is faster than typical observed T1 times in tissue. Also, a recent study of rodent glioma of Xu et al. (55) could not detect an additional significant slow R1 rate in GM, WM or tumor regions, indicating that either F is small or the compartments are in equilibrium. Then, the multi-compartment issue is not critical anymore for AREX or any CEST evaluation.
To experimentally find out if AREX improves CEST quantification in vivo, one could investigate CEST contrasts before and after gadolinium contrast agent injection, which should decrease the extra-cellular T1 significantly. Also, comparison of AREX at different static field strength, which also changes T1, might give more insight into this issue.
CONCLUSIONS
We have presented an analytical model describing Z-spectra of a water pool in the presence of a semi-solid MT pool and multiple CEST pools valid for transient- and steady-state saturation transfer experiments. The model extends R1ρ descriptions of CEST for semi-solid MT, and agrees with the accepted Henkelman-MT-model. This general model allows to describe in vivo Z-spectra where large semi-solid MT effects overlap and dilute CEST signals, and in addition, the analytical form reveals how CEST effects have to be normalized to yield a pure exchange-weighted contrast within a semi-solid microenvironment.
Beyond these insights, the presented model has other benefits of an analytical solution such as fast calculation, possible symbolic optimization and simple implementation into Z-spectra fitting routines.
ACKNOWLEDGEMENTS
The whole R1ρ-approach was strongly inspired by the work of Oleg Trott and Arthur Palmer, as well as Tao Jin who first transferred it to the CEST world. We are also thankful for inspiring exchange with Leif Schröder and his group about their ‘ideal’ CEST system HyperCEST. We are grateful for funding by the German academic exchange service DAAD, and the NIH grants 1R01EB017767 and 1R01CA184693.
List of abbreviations
- AREX
apparent exchange-dependent relaxation
- BM
Bloch-McConnell
- BSA
bovine serum albumin
- CEST
chemical exchange saturation transfer
- DIACEST
diamagnetic CEST agent
- MT
magnetization transfer
- NOE
Nuclear Overhauser Enhancment
- PARACEST
paramagnetic CEST agent
- Reff
effective relaxation in the rotating frame, R1ρ of water
- Rex
exchange-dependent relaxation
- R1ρ
longitudinal relaxation in the rotating frame
APPENDIX
A1. The case of water and CEST and MT
In the rotating frame of reference (x, y, z) defined by the frequency ωrf of the oscillating field B1(t), the BM equations for three pools, water (pool a), CEST (pool b) and a semi-solid pool (pool c) with the combined magnetization vector
| (A1) |
read
| (A2) |
where the 7×7 matrix A is given by
| (A3) |
In this equations system no direct exchange between MT and CEST is assumed. The matrix contains a new term Rrfc which takes into account the line-shape of the macromolecular pool
| (A4) |
Different line shape functions g(Δω) were employed (16, 17): Lorentzian for liquid pools
| (A5) |
or Gaussian for solid–like pools. For semi–solid structures in living tissue a super–Lorentzian lineshape defined by
| (A6) |
The constant vector C is given by the longitudinal relaxation rates and the thermal magnetizations M0:
| (A7) |
The quantity Δω Δωa ωrf − ωa is the radio frequency offset relative to the Larmor frequency ωa of pool a (for 1H: ωa/B0 γ 267.5 rad/μTs). The offset of pool b: Δωb ωrf − ωb Δω −δbωa, is shifted by δb relative to the abundant–spin resonance. Analogous for Δωc.
Longitudinal relaxation rates R1,a/b = 1/T1,a/b are in the order of Hz, while transverse relaxation rates R2,a/b = 1/T2,a/b are in the order of 10–100 Hz for in vivo 1H systems. For macromolecules and bound water R2c can take values up to 106 Hz (20). The population fraction fb can be assumed to be < 1 %, hence kab is small compared to kba. In contrast, for MT fc can be as large as 19 % for cartilage, but is in the range of several percent for most tissues (20).
A2. In the case of water and CEST
| (A8) |
| (A9) |
| (A10) |
The R1ρ-model describing this system was given in refs. (13, 26, 46).
A3. In the case of water and MT
| (A11) |
| (A12) |
| (A13) |
The fraction of the first coefficients of the characteristic polynomial of A yields an approximation of the smallest eigenvalue in modulus λ1, if the eigenvalues are hierarchic (13):
| (A14) |
To increase the hierarchy the matrix A, an thus the accuracy of this approximation, A can be shifted by the unperturbed solution (13). The shifted matrix is given by
| (A15) |
With r1a = R1a − Reff, r2a = R2a − Reff, and r1c = Rrfc − Reff, this simplifies to
Using equation (A14) for A’ yields the eigenvalue of the shifted system reading:
| (A16) |
The shift back yields the full relaxation in the rotating frame for water and MT which is
In the limit of far off-resonant irradiation (Δω → ∞), and under the assumption kca>>R1 the relaxation in the rotating frame becomes
which is equal to the observed longitudinal relaxation of the free system described in the next section.
A4. The observed R1 relaxation time R1obs
Without irradiation the three pool system simplifies to
The estimation of the smallest eigenvalue using equation (A14) yields R1obs:
Expanding the fraction by 1/(kbakca) and assuming R1x<<kxa yields the approximation
| (A17) |
Similarly the two pool system yields, in agreement with equation (12)
| (A18) |
Obviously, the observed R1 relaxation rate is governed by water relaxation and the MT pool (pool c). The contribution of pool b can be neglected as CEST pools have a low relative concentration fb<1%.
A5. Combination of two 2-pool model to a 3-pool model
One can actually use equation (A14) to derive the eigenvalue for the 3-pool system. However this calculation leads to very complicated expressions. To check if the combined 2-pool solution matches with the 3-pool solution one can compare them in the far off-resonant irradiation limit (Δω → ∞), as well as under the assumption of full saturation ω → ∞. Thus, we use the 7×7 matrix of equation (A3), shift it by the two-pool R1ρ of water and MT (eq. (A16), use equation (A14) to get a 3-pool eigenvalue and do the following limit, which should yield the on-resonant Rex:
In in vivo situations we can assume that is much smaller than fc, thus the approximation holds
| (A19) |
In a 2-pool model this limit is given by (1, 13)
This means that the Rex in the presence of an MT pool is additionally suppressed by a factor of 1/(1+fc). We think that this must be incorporated similarly for all added pools, but as long as f<<1 holds, this is just a minor term and the extension is most important for the large MT pool.
References
- 1.Zaiss M, Bachert P. Chemical exchange saturation transfer (CEST) and MR Z-spectroscopy in vivo: a review of theoretical approaches and methods. Phys. Med. Biol. 2013;58:R221–R269. doi: 10.1088/0031-9155/58/22/R221. [DOI] [PubMed] [Google Scholar]
- 2.Zhou J, Payen J-F, Wilson DA, et al. Using the amide proton signals of intracellular proteins and peptides to detect pH effects in MRI. Nat Med. 2003;9:1085–1090. doi: 10.1038/nm907. [DOI] [PubMed] [Google Scholar]
- 3.Jones CK, Schlosser MJ, van Zijl PCM, et al. Amide proton transfer imaging of human brain tumors at 3T. Magn. Reson. Med. 2006;56:585–592. doi: 10.1002/mrm.20989. [DOI] [PubMed] [Google Scholar]
- 4.Kogan F, Haris M, Debrosse C, et al. In vivo chemical exchange saturation transfer imaging of creatine (CrCEST) in skeletal muscle at 3T. J. Magn. Reson. Imaging JMRI. 2013 doi: 10.1002/jmri.24412. [DOI] [PMC free article] [PubMed] [Google Scholar]
- 5.Kogan F, Haris M, Singh A, et al. Method for high-resolution imaging of creatine in vivo using chemical exchange saturation transfer. Magn. Reson. Med. 2013 doi: 10.1002/mrm.24641. [DOI] [PMC free article] [PubMed] [Google Scholar]
- 6.Cai K, Haris M, Singh A, et al. Magnetic resonance imaging of glutamate. Nat. Med. 2012;18:302–306. doi: 10.1038/nm.2615. [DOI] [PMC free article] [PubMed] [Google Scholar]
- 7.Chan KWY, McMahon MT, Kato Y, et al. Natural D-glucose as a biodegradable MRI contrast agent for detecting cancer. Magn. Reson. Med. 2012;68:1764–1773. doi: 10.1002/mrm.24520. [DOI] [PMC free article] [PubMed] [Google Scholar]
- 8.Walker-Samuel S, Ramasawmy R, Torrealdea F, et al. In vivo imaging of glucose uptake and metabolism in tumors. Nat. Med. 2013;19:1067–1072. doi: 10.1038/nm.3252. [DOI] [PMC free article] [PubMed] [Google Scholar]
- 9.Zhang S, Merritt M, Woessner DE, et al. PARACEST agents: modulating MRI contrast via water proton exchange. Acc. Chem. Res. 2003;36:783–790. doi: 10.1021/ar020228m. [DOI] [PubMed] [Google Scholar]
- 10.Sun PZ, Sorensen AG. Imaging pH using the chemical exchange saturation transfer (CEST) MRI: Correction of concomitant RF irradiation effects to quantify CEST MRI for chemical exchange rate and pH. Magn. Reson. Med. Off. J. Soc. Magn. Reson. Med. Soc. Magn. Reson. Med. 2008;60:390–397. doi: 10.1002/mrm.21653. [DOI] [PubMed] [Google Scholar]
- 11.Zaiss M, Schmitt B, Bachert P. Quantitative separation of CEST effect from magnetization transfer and spillover effects by Lorentzian-line-fit analysis of Z-spectra. J. Magn. Reson. 2011;211:149–155. doi: 10.1016/j.jmr.2011.05.001. [DOI] [PubMed] [Google Scholar]
- 12.Zaiss M, Bachert P. Inverse Z-spectrum analysis for spillover-, MT-, and T1-corrected steady-state pulsed CEST-MRI – application to pH-weighted MRI of acute stroke. NMR Biomed. 27:240–252. doi: 10.1002/nbm.3054. doi: 10.1002/nbm.3054. [DOI] [PMC free article] [PubMed] [Google Scholar]
- 13.Zaiss M, Bachert P. Exchange-dependent relaxation in the rotating frame for slow and intermediate exchange - modeling off-resonant spin-lock and chemical exchange saturation transfer. NMR Biomed. 2013;26:507–518. doi: 10.1002/nbm.2887. [DOI] [PubMed] [Google Scholar]
- 14.Xu J, Zaiss M, Zu Z, et al. On the origins of chemical exchange saturation transfer (CEST) contrast in tumors at 9.4 T. NMR Biomed. 2014;27:406–416. doi: 10.1002/nbm.3075. [DOI] [PMC free article] [PubMed] [Google Scholar]
- 15.Scheidegger R, Wong ET, Alsop DC. Contributors to contrast between glioma and brain tissue in chemical exchange saturation transfer sensitive imaging at 3Tesla. NeuroImage. 2014 doi: 10.1016/j.neuroimage.2014.05.036. [DOI] [PMC free article] [PubMed] [Google Scholar]
- 16.Henkelman RM, Huang X, Xiang QS, et al. Quantitative interpretation of magnetization transfer. Magn. Reson. Med. 1993;29:759–766. doi: 10.1002/mrm.1910290607. [DOI] [PubMed] [Google Scholar]
- 17.Henkelman RM, Stanisz GJ, Graham SJ. Magnetization transfer in MRI: a review. NMR Biomed. 2001;14:57–64. doi: 10.1002/nbm.683. [DOI] [PubMed] [Google Scholar]
- 18.Jin T, Autio J, Obata T, et al. Spin-locking versus chemical exchange saturation transfer MRI for investigating chemical exchange process between water and labile metabolite protons. Magn. Reson. Med. 2011;65:1448–1460. doi: 10.1002/mrm.22721. [DOI] [PMC free article] [PubMed] [Google Scholar]
- 19.Jin T, Wang P, Zong X, et al. Magnetic resonance imaging of the Amine-Proton EXchange (APEX) dependent contrast. NeuroImage. 2012;59:1218–1227. doi: 10.1016/j.neuroimage.2011.08.014. [DOI] [PMC free article] [PubMed] [Google Scholar]
- 20.Stanisz GJ, Odrobina EE, Pun J, et al. T1, T2 relaxation and magnetization transfer in tissue at 3T. Magn. Reson. Med. 2005;54:507–512. doi: 10.1002/mrm.20605. [DOI] [PubMed] [Google Scholar]
- 21.Goerke S, Zaiss M, Bachert P. Characterization of creatine guanidinium proton exchange by water-exchange (WEX) spectroscopy for absolute-pH CEST imaging in vitro. NMR Biomed. 2014;27:507–518. doi: 10.1002/nbm.3086. [DOI] [PubMed] [Google Scholar]
- 22.Jin T, Kim S-G. Quantitative chemical exchange sensitive MRI using irradiation with toggling inversion preparation. Magn. Reson. Med. 2012;68:1056–1064. doi: 10.1002/mrm.24449. [DOI] [PMC free article] [PubMed] [Google Scholar]
- 23.McConnell HM. Reaction Rates by Nuclear Magnetic Resonance. J. Chem. Phys. 1958;28:430. [Google Scholar]
- 24.Desmond KL, Stanisz GJ. Understanding quantitative pulsed CEST in the presence of MT. Magn. Reson. Med. 2012;67:979–990. doi: 10.1002/mrm.23074. [DOI] [PubMed] [Google Scholar]
- 25.Woessner DE, Zhang S, Merritt ME, et al. Numerical solution of the Bloch equations provides insights into the optimum design of PARACEST agents for MRI. Magn. Reson. Med. 2005;53:790–799. doi: 10.1002/mrm.20408. [DOI] [PubMed] [Google Scholar]
- 26.Trott O, Palmer Arthur G. R1rho relaxation outside of the fast-exchange limit. J. Magn. Reson. San Diego Calif 1997. 2002;154:157–160. doi: 10.1006/jmre.2001.2466. [DOI] [PubMed] [Google Scholar]
- 27.Zaiss M. 2014 http://www.cest-sources.org. Cest-Sourcesorg.
- 28.Hu X, Le TH. Artifact reduction in EPI with phase-encoded reference scan. Magn. Reson. Med. 1996;36:166–171. doi: 10.1002/mrm.1910360126. [DOI] [PubMed] [Google Scholar]
- 29.Zhou J, Wilson DA, Sun PZ, et al. Quantitative description of proton exchange processes between water and endogenous and exogenous agents for WEX, CEST, and APT experiments. Magn. Reson. Med. 2004;51:945–952. doi: 10.1002/mrm.20048. [DOI] [PubMed] [Google Scholar]
- 30.Jin T, Wang P, Zong X, et al. MR imaging of the amide-proton transfer effect and the pH-insensitive nuclear overhauser effect at 9.4 T. Magn. Reson. Med. 2013;69:760–770. doi: 10.1002/mrm.24315. [DOI] [PMC free article] [PubMed] [Google Scholar]
- 31.Jones CK, Huang A, Xu J, et al. Nuclear Overhauser enhancement (NOE) imaging in the human brain at 7T. NeuroImage. 2013;77:114–124. doi: 10.1016/j.neuroimage.2013.03.047. [DOI] [PMC free article] [PubMed] [Google Scholar]
- 32.Desmond KL, Moosvi F, Stanisz GJ. Mapping of amide, amine, and aliphatic peaks in the CEST spectra of murine xenografts at 7 T. Magn. Reson. Med. 2013 doi: 10.1002/mrm.24822. [DOI] [PubMed] [Google Scholar]
- 33.Gochberg DF, Gore JC. Quantitative imaging of magnetization transfer using an inversion recovery sequence. Magn. Reson. Med. 2003;49:501–505. doi: 10.1002/mrm.10386. [DOI] [PubMed] [Google Scholar]
- 34.Ou X, Gochberg DF. MT effects and T1 quantification in single-slice spoiled gradient echo imaging. Magn. Reson. Med. 2008;59:835–845. doi: 10.1002/mrm.21550. [DOI] [PMC free article] [PubMed] [Google Scholar]
- 35.Dortch RD, Li K, Gochberg DF, et al. Quantitative magnetization transfer imaging in human brain at 3 T via selective inversion recovery. Magn. Reson. Med. 2011;66:1346–1352. doi: 10.1002/mrm.22928. [DOI] [PMC free article] [PubMed] [Google Scholar]
- 36.Bloch F. Nuclear Induction. Phys. Rev. 1946;70:460. [Google Scholar]
- 37.Li AX, Hudson RHE, Barrett JW, et al. Four-pool modeling of proton exchange processes in biological systems in the presence of MRI-paramagnetic chemical exchange saturation transfer (PARACEST) agents. Magn. Reson. Med. 2008;60:1197–1206. doi: 10.1002/mrm.21752. [DOI] [PubMed] [Google Scholar]
- 38.Yeung HN, Swanson SD. Transient decay of longitudinal magnetization in heterogeneous spin systems under selective saturation. J. Magn. Reson. 1969. 1992;99:466–479. [Google Scholar]
- 39.Adler RS, Yeung HN. Transient Decay of Longitudinal Magnetization in Heterogeneous Spin Systems Under Selective Saturation. III. Solution by Projection Operators. J. Magn. Reson. A. 1993;104:321–330. [Google Scholar]
- 40.Redfield AG. Nuclear Magnetic Resonance Saturation and Rotary Saturation in Solids. Phys. Rev. 1955;98:1787–1809. [Google Scholar]
- 41.Provotorov BN. Magnetic resonance saturation in crystals. Sov. Phys. JETP-USSR. 1962;14:1126–1131. [Google Scholar]
- 42.Yeung HN, Adler RS, Swanson SD. Transient Decay of Longitudinal Magnetization in Heterogeneous Spin Systems under Selective Saturation. IV. Reformulation of the Spin-Bath-Model Equations by the Redfield-Provotorov Theory. J. Magn. Reson. A. 1994;106:37–45. [Google Scholar]
- 43.Morrison C, Stanisz G, Henkelman RM. Modeling Magnetization Transfer for Biological-like Systems Using a Semi-solid Pool with a Super-Lorentzian Lineshape and Dipolar Reservoir. J. Magn. Reson. B. 1995;108:103–113. doi: 10.1006/jmrb.1995.1111. [DOI] [PubMed] [Google Scholar]
- 44.Sun PZ, van Zijl PCM, Zhou J. Optimization of the irradiation power in chemical exchange dependent saturation transfer experiments. J. Magn. Reson. 2005;175:193–200. doi: 10.1016/j.jmr.2005.04.005. [DOI] [PubMed] [Google Scholar]
- 45.Sun PZ, Farrar CT, Sorensen AG. Correction for artifacts induced by B(0) and B(1) field inhomogeneities in pH-sensitive chemical exchange saturation transfer (CEST) imaging. Magn. Reson. Med. 2007;58:1207–1215. doi: 10.1002/mrm.21398. [DOI] [PubMed] [Google Scholar]
- 46.Zaiss M, Schnurr M, Bachert P. Analytical solution for the depolarization of hyperpolarized nuclei by chemical exchange saturation transfer between free and encapsulated xenon (HyperCEST) J. Chem. Phys. 2012;136:144106. doi: 10.1063/1.3701178. [DOI] [PubMed] [Google Scholar]
- 47.Yeung HN, Adler RS, Swanson SD. Transient Decay of Longitudinal Magnetization in Heterogeneous Spin Systems under Selective Saturation. IV. Reformulation of the Spin-Bath-Model Equations by the Redfield-Provotorov Theory. J. Magn. Reson. A. 1994;106:37–45. [Google Scholar]
- 48.Zhou J, Yan K, Zhu H. A simple model for understanding the origin of the amide proton transfer MRI signal in tissue. Appl. Magn. Reson. 2012;42:393–402. doi: 10.1007/s00723-011-0306-5. [DOI] [PMC free article] [PubMed] [Google Scholar]
- 49.Malyarenko DI, Zimmermann EM, Adler J, et al. Magnetization transfer in lamellar liquid crystals. Magn. Reson. Med. 2013 doi: 10.1002/mrm.25034. n/a–n/a. [DOI] [PMC free article] [PubMed] [Google Scholar]
- 50.Strijkers GJ, Hak S, Kok MB, et al. Three-compartment T1 relaxation model for intracellular paramagnetic contrast agents. Magn. Reson. Med. 2009;61:1049–1058. doi: 10.1002/mrm.21919. [DOI] [PubMed] [Google Scholar]
- 51.Landis CS, Li X, Telang FW, et al. Equilibrium transcytolemmal water-exchange kinetics in skeletal muscle in vivo. Magn. Reson. Med. 1999;42:467–478. doi: 10.1002/(sici)1522-2594(199909)42:3<467::aid-mrm9>3.0.co;2-0. [DOI] [PubMed] [Google Scholar]
- 52.Quirk JD, Bretthorst GL, Duong TQ, et al. Equilibrium water exchange between the intra- and extracellular spaces of mammalian brain. Magn. Reson. Med. 2003;50:493–499. doi: 10.1002/mrm.10565. [DOI] [PubMed] [Google Scholar]
- 53.Gaass T, Dinkel J, Bauman G, et al. Non-contrast-enhanced MRI of the pulmonary blood volume using two-compartment-modeled T1 -relaxation. J. Magn. Reson. Imaging JMRI. 2012;36:397–404. doi: 10.1002/jmri.23674. [DOI] [PubMed] [Google Scholar]
- 54.Meier C, Dreher W, Leibfritz D. Diffusion in compartmental systems. II. Diffusion-weighted measurements of rat brain tissue in vivo and postmortem at very large b-values. Magn. Reson. Med. 2003;50:510–514. doi: 10.1002/mrm.10558. [DOI] [PubMed] [Google Scholar]
- 55.Xu J, Li K, Zu Z, et al. Quantitative magnetization transfer imaging of rodent glioma using selective inversion recovery. NMR Biomed. 2014;27:253–260. doi: 10.1002/nbm.3058. [DOI] [PMC free article] [PubMed] [Google Scholar]


