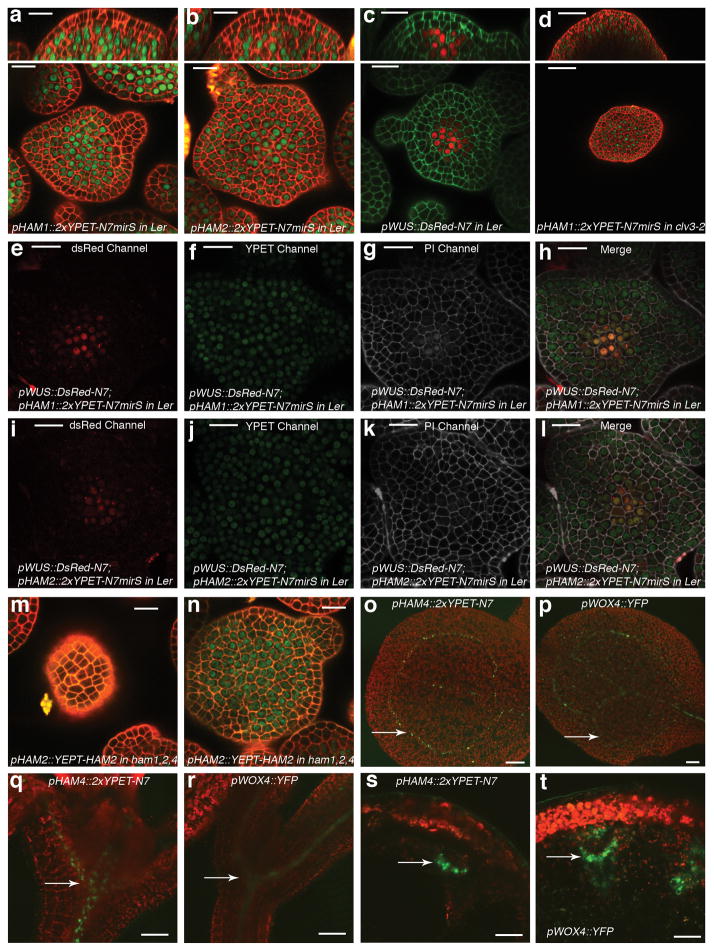
Figure 3. HAM and WUS/WOX expression domains overlap.
Expression of (a) pHAM1::2xYPET-N7microRNAsensitive marker (pHAM1::2xYPET-N7mirS) (green), (b) pHAM2::2xYPET-N7mirS (green), (c) pWUS::DsRed-N7 (red) in L-er inflorescence meristem (IM), and (d) pHAM1::2xYPET-N7mirS (green) marker in a clv3-2 IM. Orthogonal (upper panels) and transverse section (lower panels) views of the same plant are shown. (e–l) Overlapping expression patterns of pWUS::DsRed-N7 with pHAM1::2xYPET-N7mirS or pHAM2::2xYPET-N7mirS in the same shoot meristems (see Methods). Panels (from left to right): dsRed (red); YPET (green); PI (gray); merged channels. (m–n) Expression of pHAM2::YPET-HAM2 translation almarker (green) in L1 (m) and L3 (n) of the same ham1,2,4 SAM.(o–t) Overlapping expression patterns of pHAM4::2xYPET-N7and pWOX4::YFP (green, arrows) in the provascular and procambium cells in cotyledons (o–p), seedlings (q–r), and stem transverse sections (s–t). PIcounter stain: red (a–b, d, m–n), green (c), gray (g–h, k–l). Chlorophyll autofluorescence: red (o–t). Bars = 50 μm in (d, s–t); 200 μm in (o); 100 μm in (p–r); 20 μm in (a–c, e–n).

