Abstract
Foxp3+ regulatory T cells (Tregs) are required for immune homeostasis. One notable distinction between conventional T cells (Tconv) and Tregs is differential phosphatidylinositol 3-kinase (PI3K) activity: only Tconv downregulate PTEN, the primary negative regulator of PI3K, upon activation. Here, we show that control of PI3K in Tregs is essential for lineage homeostasis and stability. Mice lacking Pten in Tregs developed an autoimmune-lymphoproliferative disease characterized by excessive TH1 responses and B cell activation. Diminished control of PI3K activity in Tregs led to reduced CD25 expression, accumulation of Foxp3+CD25− cells and ultimately, loss of Foxp3 expression in these cells. Collectively, these data demonstrate that control of PI3K signaling by PTEN in Tregs is critical to maintain their homeostasis, function and stability.
Regulatory T cells (Tregs) defined by expression of the transcription factor Foxp3 are required for normal immune homeostasis. Mutation of the Foxp3 gene in mouse and human leads to the scurfy phenotype and IPEX disease, respectively, both characterized by the lack of functional Tregs, autoimmunity, and systemic polyclonal lymphoproliferation1, 2. This central role of Tregs in immune tolerance has led to a focus on defining the signals that govern Treg generation, function and stability3. Critical among these signals are those delivered by the interleukin 2 receptor (IL-2R), as enhancement of IL-2R signaling dramatically expands Tregs in vivo4. Among the signals activated via the IL-2R, phosphorylation of STAT5 appears to be particular important for Treg maintenance and expansion5.
In addition to activation of STAT5, IL-2 also initiates signaling through phosphatidylinositol 3-kinase (PI3K), which can be activated as well via the TCR or CD286, 7. The primary negative regulator of PI3K is phosphatase and tensin homolog on chromosome 10 (PTEN), a lipid phosphatase, which catalyzes the reverse reaction of PI3K8. Demonstrating the importance of PI3K regulation in immune homeostasis, animals harboring one inactive PTEN allele, develop systemic autoimmunity, which has been attributed in part to defects in thymic negative selection, as well as in Fas-mediated and activation-induced cell death in potential effector T cells. While T cell-specific PTEN deficiency leads to a lethal CD4+ T cell lymphoma of thymic origin7, 9, 10, when lymphoma development is prevented by early thymectomy, systemic autoimmunity is observed, indicating that targeting PTEN in T cells is sufficient to disturb self-tolerance.
We and others, have previously shown that regulatory T cells, but not effector T cells, maintain high amounts of PTEN expression, thus preventing the downstream activation of PI3K targets following IL-2 stimulation, while allowing further JAK-STAT signaling11, 12. Indeed, control of PTEN via the scaffold protein Disc large homolog 1 is critical for human Treg function in vitro13. This suggests that Tregs require a mechanism of PI3K control distinct from effector T cells.
Consistent with this notion, PI3K signaling inhibits in vitro Treg differentiation and homeostasis, while rapamycin promotes Treg proliferation and accumulation in the periphery14–18. Conversely, pharmacological inhibition of PI3K signaling enhances in vitro Treg differentiation14, 19 and expression of a constitutively active Akt allele in Tregs leads to an overall dampening of the Treg gene signature, including reduced expression of Foxp3, Il2ra (CD25), and Ctla416.
To define the cell-intrinsic function of the PI3K pathway in Treg homeostasis, we generated mice lacking expression of PTEN specifically within the Foxp3+ population, termed Pten-ΔTreg mice. Disruption of PTEN did not result in catastrophic decreases in Foxp3+ Tregs; in fact, there was an increase in the CD25− subset of Foxp3+ cells. However, despite the continued presence of the Foxp3+ Treg population, Pten-ΔTreg mice developed a systemic polyclonal lymphoproliferative disease and renal failure. Female mice heterozygous for Foxp3-Cre were initially healthy, but over time their wild-type Treg compartment was replaced by PTEN-deficient Tregs, and they ultimately succumbed to disease. Further studies revealed that loss of PTEN was associated with disruptions in cellular metabolism and energy utilization. Finally, we found that elevation of PI3K signaling in PTEN-deficient regulatory T cells led directly to the successive loss of CD25 followed by Foxp3, and the emergence of ‘ex’-Foxp3 cells (i.e., cells which were once Foxp3+ but appear to have permanently lost Foxp3 expression). Together, these data show that control of PI3K signaling via PTEN is required to maintain Treg homeostasis, function and Foxp3 expression.
Results
Generation of Pten-ΔTreg mice
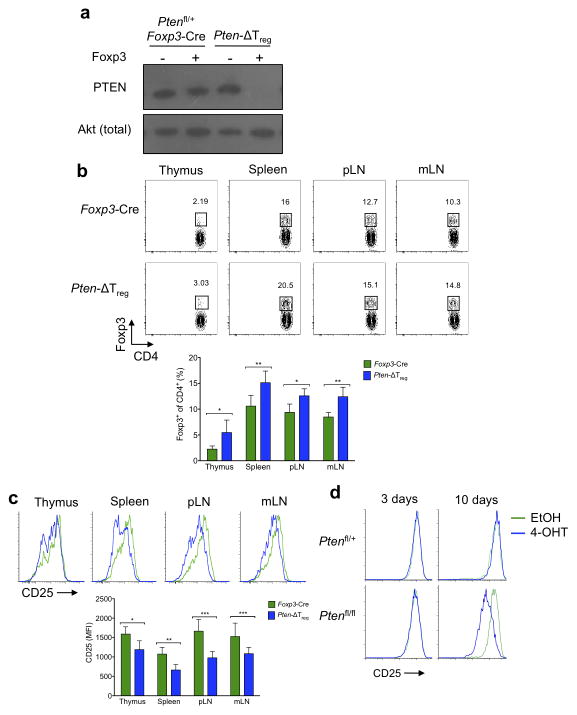
Ptenfl/fl and Foxp3-Cre mice were crossed to generate Pten-ΔTreg mice, which lack PTEN expression specifically in the Foxp3+ population of cells (Fig. 1a). Unlike animals lacking PTEN in all T cells19, Pten-ΔTreg mice developed an expanded Treg population in multiple tissues at young ages, while maintaining normal T cell development (Fig. 1b, Supplementary Fig. 1a). Though these PTEN-deficient Tregs were generally phenotypically normal (Supplementary Fig. 1b), they expressed substantially lower amounts of the high-affinity IL-2 receptor subunit, CD25, than did control Pten+/+ Foxp3-Cre Tregs (Fig. 1c). To exclude the possibility that downregulation of CD25 was a consequence of unappreciated developmental abnormalities, we used a tamoxifen-inducible system to delete PTEN in vitro from pre-existing Foxp3+ cells. Deletion of PTEN led to a marked reduction in CD25 expression (Fig. 1d), thus demonstrating that PTEN deletion is sufficient to downregulate CD25 in otherwise normal Tregs.
Figure 1.
Characterization of Pten-ΔTreg mice. (a) Foxp3+ and Foxp3− cells were sort purified from the indicated mice and cell populations were analyzed by immunoblotting for PTEN and total Akt. (b) Analysis of CD4 and Foxp3 in cells isolated from the indicated tissues (pLN, peripheral lymph node; mLN, mesenteric lymph node). n = 10, representative of 10 experiments; *p < 0.001, **p < 0.0001 by two-way ANOVA. (c) Expression of CD25 on Foxp3+ cells isolated from thymus, spleen, pLN and mLN from Pten-ΔTreg and wild-type mice. n = 10, representative of 10 experiments; *p < 0.05, **p < 0.01, ***p < 0.001 by two-way ANOVA. (d) CD4+CD25+CD62L+ sorted Tregs from Ptenfl/+ or Ptenfl/fl Rosa26-CreER mice were cultured for the indicated times in vitro in the presence of 4-OH tamoxifen (4-OHT) to induce Cre-mediated excision of Pten and assessed for CD25 expression. Representative of 2 experiments. All error bars shown are mean ± SD.
Development of disease in Pten-ΔTreg mice
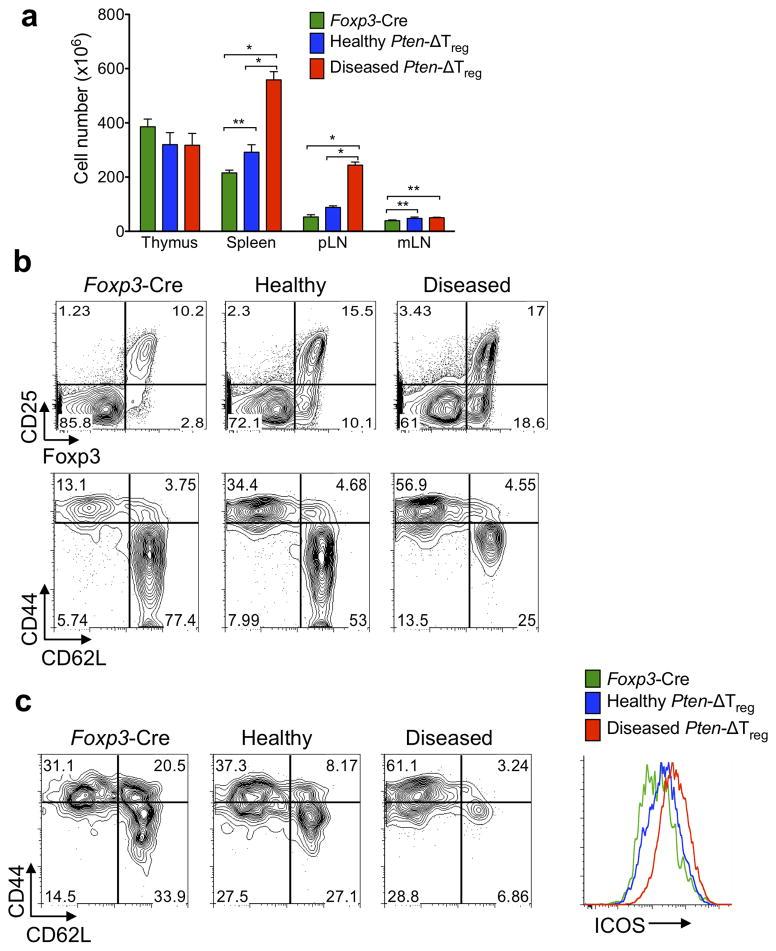
Despite their enlarged Treg compartment, Pten-ΔTreg mice developed peripheral lymphoproliferative disease (defined as grossly visible lymphadenopathy) with age (Fig. 2a) that appeared as early as 12 weeks of age, and by 28 weeks of age affected approximately 80% of animals. While lymphoproliferation affected secondary lymphoid tissue, thymic cellularity was not increased, most likely due to the affects of autoimmunity (see below) with B cell infiltration of the thymus (data not shown). Interestingly, the lymphocyte compartments of diseased Pten-ΔTreg mice were notable for a further increase in the population of Foxp3+CD25− cells compared to healthy mice, and a large expansion of activated CD4+CD44hiCD62Llo T cells (Fig. 2b). Expanded CD44hiCD62Llo cells were seen within the Treg compartment itself, in association with elevated ICOS expression (Fig. 2c).
Figure 2.
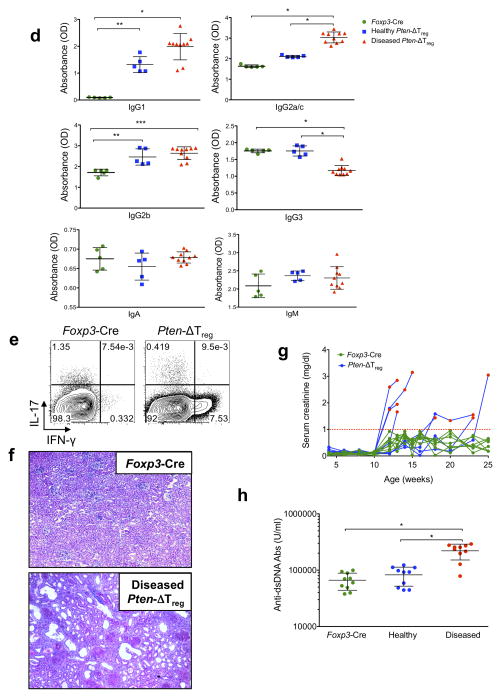
Pten-ΔTreg mice develop spontaneous systemic lymphoproliferative disease with age. (a) (Left) Cell numbers from the indicated tissues of Foxp3-Cre control mice, healthy appearing Pten-ΔTreg mice, and diseased Pten-ΔTreg mice (as assessed by gross lymphadenopathy, typical age 15 – 18 weeks). n = 3 for diseased Pten-ΔTreg or 5 for other groups; representative of 5 experiments; *p < 0.0001, **p < 0.01 by two-way ANOVA. (b) Flow cytometric analysis of CD4+ cells (top) and CD4+Foxp3− cells (bottom) from spleen of wild-type mice, Pten-ΔTreg mice, and diseased Pten-ΔTreg mice. Representative of 10 experiments. (c) Foxp3+ Tregs were isolated from wild-type, Pten-ΔTreg and diseased Pten-ΔTreg mice and analyzed for expression of CD44, CD62L and ICOS. Representative of 10 experiments. (d) Serum IgG1, IgG3a/c, IgG2b, IgG3, IgA and IgM concentrationss from the three groups of mice as defined above. n = 10 for diseased Pten-ΔTreg and 5 for other groups, representative of 3 experiments; *p < 0.0001, **p < 0.001, ***p = 0.0001 by one-way ANOVA. (e) CD4+ cells from lymph nodes of control mice and diseased Pten-ΔTreg mice were isolated, restimulated ex vivo and stained for IFN-γ and IL-17, representative of 5 experiments. (f) Hematoxylin and eosin staining of renal tissue from a representative wild-type (top) and Pten-ΔTreg mouse (bottom); 10x magnification. (g) Serum creatinine concentrations in Pten-ΔTreg mice with age. n = 8, representative of 2 experiments. Red symbols indicate age at which visible lymphadenopathy occurred; red line indicates the level at which kidney failure is diagnosed in mice. (h) Anti-double stranded DNA antibody concentrations in Pten-ΔTreg mice. n = 10, representative of 2 experiments; *p < 0.0001 by one-way ANOVA. All error bars shown are mean ± SD.
We observed a large accumulation of germinal center B cells in both healthy and diseased Pten-ΔTreg mice (Supplementary Fig. 2a), accompanied by high concentrations of serum IgG1, IgG2a/c and IgG2b, and a decrease in IgG3 in diseased mice (Fig. 2d). Consistent with elevations in immunogloblulin concentrations, Pten-ΔTreg mice had marked increases in TFH cell numbers (defined as CD4+ICOS+CXCR5+Foxp3− cells) in the spleen (Supplementary Fig. 2b). Increases in TFR cell numbers were also observed (Supplementary Fig. 2b), consistent with the general increases in Treg cell numbers observed in Pten-ΔTreg mice. In addition, when conventional T cells from diseased Pten-ΔTreg mice were stimulated ex vivo, a large population of IFN-γ producing cells was detected (Fig. 2e). There was no increase in IL-17 production from T cells isolated from either spleen, mesenteric lymph node or colonic lamina propria (Fig. 2e and data not shown). Consistent with this, both Tregs and conventional T cells isolated from Pten-ΔTreg mice had elevated expression of the chemokine receptor CXCR3, which promotes cell homing to sites of TH1-type inflammation (Supplementary Fig. 2c)20. These data collectively suggest that Pten-ΔTreg mice develop a TH1-type lymphoproliferative disease involving both T and B cells.
Most visceral organs from aged and visibly ill Pten-ΔTreg mice had normal gross and histologic appearance (data not shown), with the notable exception of the kidneys (Fig. 2f), which revealed a proliferative glomerulonephritis, interstitial infiltrates and cortical atrophy. This histologic picture was accompanied by elevations in serum concentrations of anti-double stranded DNA antibodies and creatinine (Fig. 2g,h). The rise in serum creatinine concentrations corresponded temporally with the onset of visible lymphadenopathy, indicating that kidney failure and autoimmunity occurred concomitantly. As with secondary lymphoid organs, we found a large population of Foxp3+CD25− cells within the diseased kidneys (Supplementary Fig. 2d).
As PTEN deletion in T cells and non-lymphoid cells can lead to malignancy in mice and humans9, 21, we addressed the possibility that Pten-ΔTreg mice had developed malignant disease rather than autoimmunity. One characteristic of autoimmunity in thymectomized Pten-ΔT mice is the maintenance of normal TCR Vβ diversity, while PTEN-null T cell malignancies are monoclonal10. We found comparable TCR Vβ diversity in both naïve CD4+ cells and Treg isolated from diseased mice, strongly suggesting that the hyperplastic cells were not malignant (Supplementary Fig. 2e). Finally, the expanded population of T cells also predominantly expressed low amounts of CD24 (HSA), in contrast with what is observed in PTEN-deficient T cell malignancies, which, like thymocytes, are CD24hi (Supplementary Fig. 2e)10, 22. Thus the expanded population of T cells in Pten-ΔTreg mice is a polyclonal non-malignant population.
Defective regulation by PTEN-deficient Tregs
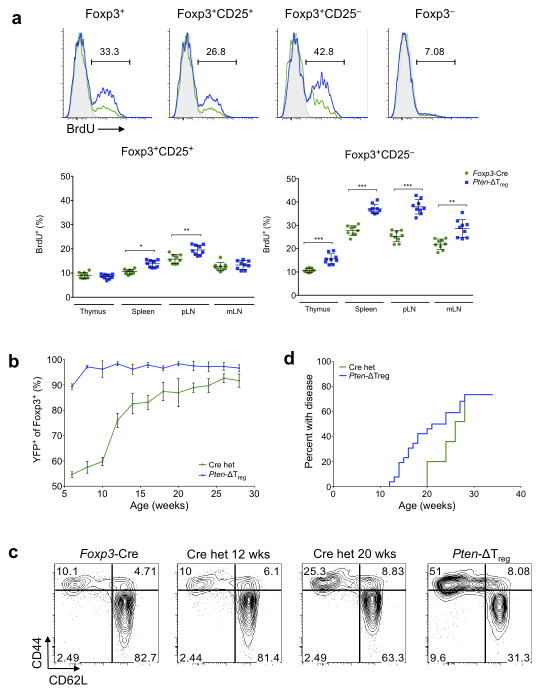
As we observed elevated numbers of Tregs in Pten-ΔTreg mice, we next used BrdU labeling to assess their in vivo proliferative capacity. While PTEN-deficient Foxp3+CD25+ Tregs were more proliferative than wild-type controls, BrdU incorporation was highest in the Foxp3+CD25− Treg subset (Fig. 3a). Interestingly, these proliferative differences in Foxp3+CD25+ and Foxp3+CD25− cells were seen in both Pten-ΔTreg mice as well as wild-type controls (Fig. 3a). To further assess the in vivo maintenance of PTEN-deficient Tregs, we utilized the X-linked nature of the Foxp3-Cre knock-in transgene and bred female Ptenfl/fl mice to be heterozygous for Foxp3-Cre23. Due to random X-inactivation, Foxp3-Cre heterozygous females should maintain a 50:50 ratio of Cre+YFP+ PTEN-deficient Tregs:Cre−YFP− PTEN-sufficient wild-type Tregs. This was the case in young Cre heterozygous mice, which did not develop activated T cell accumulation at the same time as their Pten-ΔTreg counterparts. However, over time, we found that the PTEN-deficient Tregs were increased in number relative to wild-type Tregs in the blood and lymph nodes of Foxp3-Cre heterozygous females (Fig. 3b and data not shown), and this was accompanied by the eventual onset of disease (Fig. 3c,d), presumably due to the loss of wild-type Tregs.
Figure 3.
Expansion of PTEN-deficient Tregs in vivo. (a) Wild-type and Pten-ΔTreg mice were injected i.p. with BrdU every 12 h for 3 consecutive days. Cells were isolated from thymus, spleen, pLN and mLN and assessed for BrdU incorporation. n = 9, representative of 4 experiments; *p < 0.001, **p < 0.002, ***p < 0.0001 by t-test. (b) Female Ptenfl/fl mice were bred to express one allele of Foxp3-Cre (Cre heterozygous mice) and followed over time along with female Pten-ΔTreg mice (homozygous for Foxp3-Cre). n = 20. (c) Flow cytometric analysis of peripheral blood CD4+Foxp3− T cells from mice as in panel b plus a wild-type Foxp3-Cre control mouse. (d) Aged Ptenfl/fl Cre heterozygous female mice develop disease similar to Pten-ΔTreg mice with delayed onset, n = 20 (Cre het) or 35 (Pten-ΔTreg). All error bars shown are mean ± SD.
From these data, we hypothesized that the lymphoproliferative disease seen in Pten-ΔTreg mice could result from three distinct, but non-mutually exclusive processes: PTEN-deficient Tregs were unable to perform normal regulatory functions and control effector T cell responses; PTEN deletion caused Treg lineage instability, therefore generating pathogenic PTEN-deficient effector cells; and transient expression of Foxp3 by non-Tregs caused aberrant excision of PTEN, leading to the generation of pathogenic PTEN-deficient non-Tregs.
We first excluded the possibility of transient expression of Foxp3 in non-Tregs leading to Cre-mediated Pten excision by assessing Pten recombination status at the genomic locus in sorted cell populations from young, healthy Pten-ΔTreg mice (Supplementary Fig. 3)24. Using primers to specifically detect the deleted Pten locus, we found that recombination of Pten was only seen in Foxp3+ populations and in neither naïve nor activated T cells, indicating that Cre-mediated Pten excision was faithful and confined to the Foxp3+ Treg population.
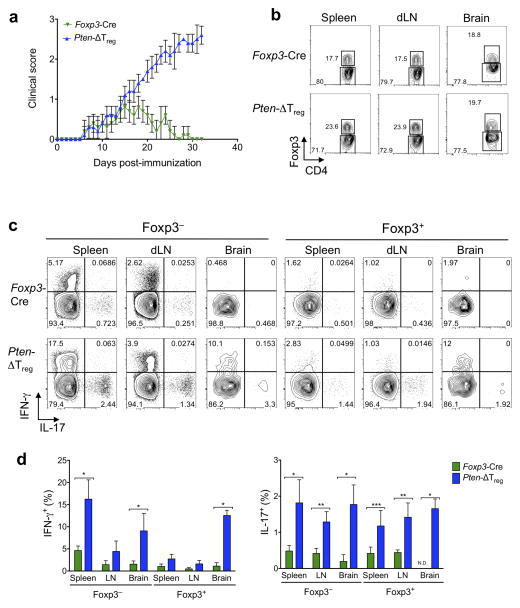
Next, we used the experimental autoimmune encephalomyelitis (EAE) model to analyze the in vivo functional capacity of PTEN-deficient Tregs. We found that while the initial onset of disease was similar in Pten-ΔTreg and wild-type mice, Pten-ΔTreg mice were unable to spontaneously resolve the disease, a process which has previously been shown to be Treg dependent25. Notably, progression of symptoms in Pten-ΔTreg mice occurred despite the mice maintaining high numbers of Foxp3+ cells in secondary lymphoid organs as well as in the brain itself (Fig. 4a,b), and as would be anticipated, disease severity was accompanied by increased production of IFN-γ and IL-17 by effector T cells (Fig. 4c). Interestingly, however, we found that Foxp3+ cells in Pten-ΔTreg mice produced IL-17 to a similar degree as did non-Tregs (Fig. 4c), suggesting that these PTEN-deficient Tregs might be pathogenic in vivo.
Figure 4.
Loss of PTEN prevents the ability of Tregs to resolve autoimmune inflammation. (a) Wild-type and Pten-ΔTreg mice were immunized s.c. with myelin oligodendrocyte peptide emulsified in complete Freund’s adjuvant (CFA) to induce experimental autoimmune encephalomyelitis (EAE), and clinical disease severity was monitored for 35 days post-immunization. n = 10, representative of 3 experiments; p < 0.0001 by two-way ANOVA. (b) Representative flow cytometric analysis for CD4 and Foxp3 in the spleen, draining lymph nodes and brain of mice in panel a at day 35. (c) T cells as in panel b were restimulated ex vivo and assessed for production of IFN-γ and IL-17. Left set of panels are gated on CD4+Foxp3− cells and the right set of panels are gated on CD4+Foxp3+ cells. n = 5, representative of 3 experiments. (d) Compilation of data from the experiments in c. N.D. = not detected; *p < 0.0001, **p < 0.001, ***p < 0.01 by two-way ANOVA. All error bars shown are mean ± SD.
The apparent functional defects of PTEN-deficient Foxp3+ cells in our in vivo models led to the question of whether these cells were bona fide Tregs. We performed transcriptional analysis on PTEN-deficient Foxp3+CD25+ and Foxp3+CD25− cells and found that both populations of PTEN-deficient Tregs maintained normal expression of Treg signature genes26 including Foxp3, Ctla4 and Nrp1 (Supplementary Fig. 4). Collectively, these data show that Pten-ΔTreg mice were unable to resolve the inflammatory insult of EAE, despite the continued presence of high numbers of Tregs.
Elevated glycolytic activity in PTEN-deficient Tregs
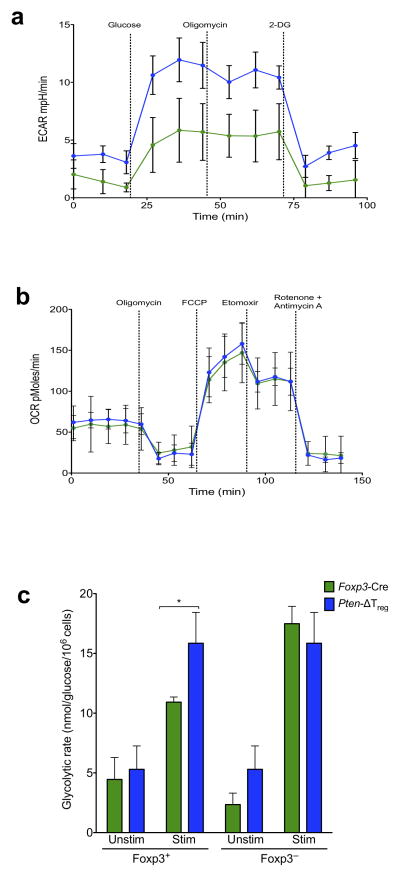
Metabolic programming may dictate T cell fate decisions that occur during differentiation27; PI3K activity promotes glycolytic metabolism in various cell types including conventional T cells28, while in contrast Tregs favor oxidative metabolism to meet their energy demands29. Strikingly, we observed that Tregs from Pten-ΔTreg mice had a much higher glucose-stimulated increase in extracellular acidification rate (ECAR – an indirect measurement of glycolysis), compared to wild-type Tregs (Fig. 5b). The mitochondrial ATP synthase inhibitor oligomycin did not further increase ECAR but decreased the oxygen consumption rate (OCR – an indicator of mitochondrial respiration), suggesting that maximal glycolytic capacity was reached by the initial addition of glucose in both populations (data not shown). The return of ECAR to basal levels in response to the addition of 2-deoxy-glucose indicates that glucose-stimulated changes in ECAR were due to glycolysis (Fig. 5b). In contrast to this, the ATP coupled respiration and the spare respiratory capacity (SRC) of PTEN-deficient Tregs as measured by the OCR, after addition of oligomycin and FCCP respectively was similar to that of wild-type Tregs (Fig. 5c). Further, addition of etomoxir, which blocks mitochondrial fatty acid oxidation, followed by rotenone and antimycin (to block complex-I and complex-III of the electron transport chain respectively) reduced the SRC in both PTEN-deficient Tregs and wild-type Tregs to a similar degree (Fig. 5c). This overlapping mitochondrial profile between the two populations suggests that mitochondrial function was unimpaired in Tregs in the absence of PTEN. Finally, to independently confirm the increase in glycolytic metabolism of Pten-ΔTreg cells, we measured their glycolytic rate via assessing the generation of 3H2O from [3-3H]-glucose. Consistent with our Seahorse data, we found that Pten-ΔTreg cells possessed a higher glycolytic rate than their wild-type counterparts upon activation (Fig. 5d). Together, these findings indicate that PTEN deficiency in Tregs renders them hyperglycolytic, a bioenergetic state that could disrupt their homeostasis and cause functional instability.
Figure 5.
PTEN deficiency skews Treg metabolism toward glycolysis. (a,b) Tregs from Pten-ΔTreg and wild-type mice were purified and subjected to a glycolysis stress (a) or mito-stress test (b) to assess the bioenergetic profile of these cells. n = 3 samples per group, representative of 2 experiments. (c) The indicated populations of cells were isolated from Pten-ΔTreg or wild-type mice, stimulated and treated with [3-3H] glucose to measure the generation of 3H2O as an indicator of the glycolytic rate of cells. n = 4, representative of 3 experiments; *p < 0.01 by two-way ANOVA. All error bars shown are mean ± SD.
PTEN-deficient Tregs are unstable
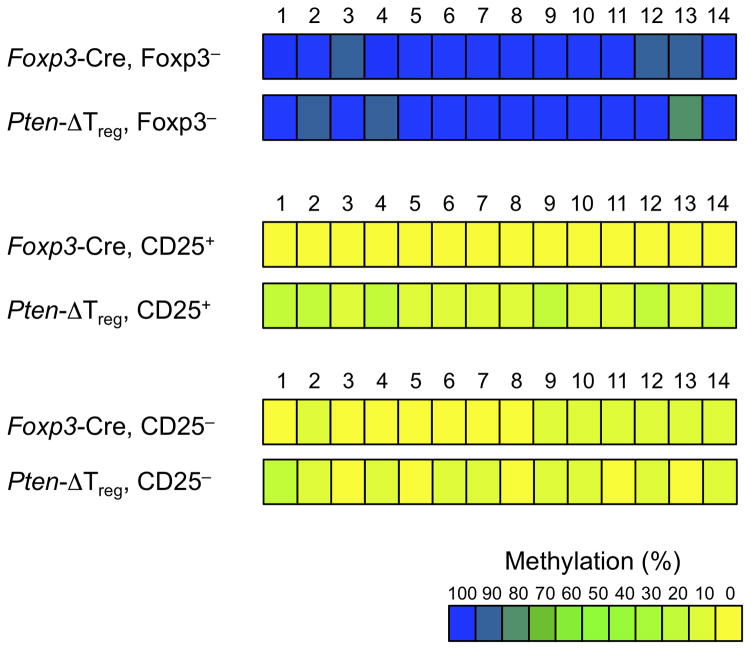
While the severity of EAE-related inflammation in Pten-ΔTreg mice as well as the ultimate development of autoimmune disease onset in Cre heterozygous females may be a result of an inherent inability of PTEN-deficient Tregs to perform normal regulatory function, these data could also indicate compromised stability of PTEN-deficient Tregs, particularly during inflammatory settings. One potential marker of Treg instability as a result of PTEN loss would be methylation of the Treg-specific demethylated region (TSDR)30. Methylation of the Foxp3 locus has been associated previously with maintenance of Foxp3 expression and resultant Treg stability30. Therefore, we analyzed TSDR methylation in Foxp3+CD25+ and Foxp3+CD25− cells purified by sorting from wild-type and Pten-ΔTreg mice. We observed a moderate reduction of TSDR demethylation in CD25+ PTEN-deficient Tregs compared to wild-type CD25+ Tregs (Fig. 6). Interestingly, a similar “loss” of demethylation was observed in both populations of Foxp3+CD25− Tregs, which is consistent with lower expression of Foxp3 protein in both wild-type and PTEN-deficient CD25− Tregs (31–33 and Supplementary Fig. 5).
Figure 6.
TSDR methylation analysis. Methylation status of CpG motifs of the Foxp3 locus was assessed by bisulfite sequencing of the indicated populations of sorted cells (data were averaged from 4 – 5 mice per group and > 76 total sequences per group).
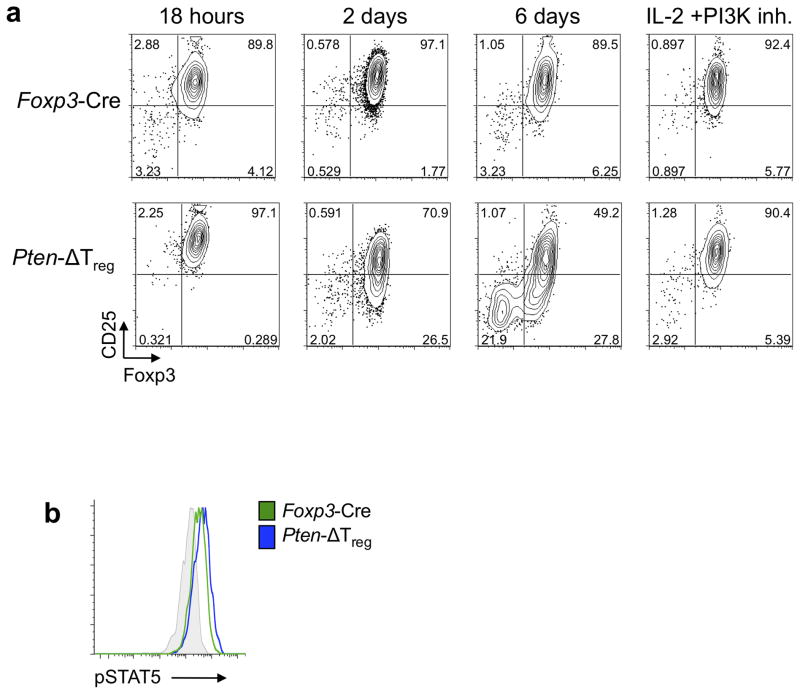
To more directly evaluate PTEN-deficient Treg stability, sort purified in vitro-induced Foxp3+CD25+ Tregs were cultured in the presence of IL-2. We observed that PTEN-deficient Tregs began to downregulate CD25 expression by 48h, and subsequently lost expression of Foxp3 (Fig. 7a). Blockade of PI3K signals prevented both CD25 and Foxp3 loss, but had no effect on wild-type Tregs (Fig. 7a). As loss of CD25 expression preceded loss of Foxp3, the Foxp3+CD25− phenotype may be an initial, and perhaps inciting, step in Treg destabilization. The fact that neither supplemental IL-2 nor PI3K inhibition alone was able to fully stabilize Foxp3 and CD25 expression (Supplementary Fig. 6a), provides further evidence for the importance of the proper integration and modulation of PI3K and CD25 signals in Treg stability.
Figure 7.
PTEN deletion leads to Treg instability in vitro. (a) CD4+Foxp3+CD25+ iTregs from Ptenfl/fl Foxp3GFP-hCre mice with indicated genotypes were sorted and cultured in the presence of IL-2 with or without the PI3K inhibitor (10 μM LY294002) for 6 d and expression of Foxp3 and CD25 was monitored at indicated times. Representative of 3 experiments. (b) Foxp3+ cells were isolated from wild-type and Pten-ΔTreg mice, serum starved for 1 h and stimulated for 30 min in the presence of 200 IU/ml hIL-2. Cells were then immediately fixed, permeabilized and assessed for pSTAT5 levels by phospho-flow cytometry. Grey = isotype control. Representative of 3 experiments.
As PI3K activation is upstream of both mTORC1 and mTORC2, we assessed the activation of these two arms of the mTOR pathway via the phosphorylation of their downstream targets S6 (mTORC1) and Akt (Serine 473, mTORC2). While PTEN-deficient Tregs exhibited enhanced phosphorylation of Akt both at baseline and following TCR/CD28 stimulation, pS6 levels were not increased over control Tregs either at rest or after stimulation (Supplementary Fig. 6b), indicating a preferential over-activation of mTORC2. Similarly, inhibition of Akt (which is activated by PI3K and mTORC2) was more effective than rapamycin, which primarily affects mTORC1, at restoring CD25 expression on PTEN-deficient Tregs in vitro (Supplementary Fig. 6c).
STAT5 binds to the Foxp3 promoter, thus regulating its expression and possibly stability5. As CD25 downregulation preceded loss of Foxp3 expression in vitro, we assessed the downstream phosphorylation of STAT5 within PTEN-deficient Foxp3+CD25+ Tregs. Importantly, we found brief stimulation with IL-2 induced similar amounts of pSTAT5 in Foxp3+CD25+ cells from both Pten-ΔTreg mice and wild-type mice, demonstrating that elevated PI3K signaling does not alter the ability of Tregs to respond to IL-2 stimulation (Fig. 7b)11.
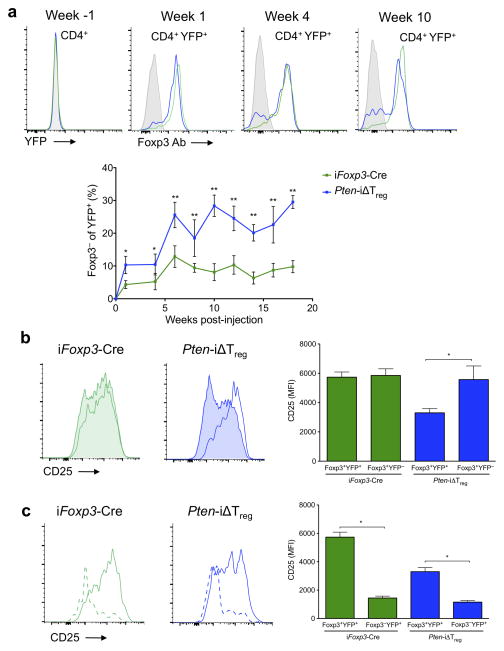
As noted above, a deleted Pten allele was only detected in Foxp3+ cells in young, healthy Pten-ΔTreg mice (Supplementary Fig. 3). Thus, we speculated that appearance of the genomic deletion in the Foxp3− population would be suggestive of PTEN-deficient Treg instability. In fact, we found evidence of Pten deletion at the genomic level in the activated CD4+ CD44hiCD62LloFoxp3− population of cells in diseased mice (Supplementary Fig. 7), consistent with this hypothesis. To further examine if these PTEN-deleted effector cells did indeed derive from bona fide Tregs, we took advantage of fate-mapping to assess and quantify the loss of Foxp3 in Tregs following deletion of PTEN. Ptenfl/fl mice were crossed to Foxp3eGFP-Cre-ERT2 Rosa26-YFP mice34 to generate Pten-iΔTreg mice. In these animals, treatment with tamoxifen leads to deletion of PTEN in Foxp3+ cells, which are simultaneously “marked” by excision of a stop codon in the ubiquitously expressed Rosa26 locus, allowing the transcription and expression of YFP. While in theory, eGFP can be used as a surrogate for Foxp3 expression, in practice we found that the eGFP signal in the Foxp3 locus was relatively weak compared with the much stronger YFP signal in the Rosa26 locus (data not shown). This, coupled with the known high degree of spectral emission overlap between GFP and YFP, made it simpler to assess Foxp3 expression directly by antibody staining while preserving Rosa26-YFP expression (Supplementary Fig. 8). A population of Foxp3− cells within the YFP+ population could be distinguished in the blood of both Pten-iΔTreg mice and wild-type Foxp3eGFP-Cre-ERT2 Rosa26-YFP mice (iFoxp3-Cre) as early as 1 week after initiation of a 5 day course of tamoxifen (Fig. 8a). Notably, by 10 weeks post-tamoxifen treatment, the percentage of ‘ex’-Foxp3 cells in Pten-iΔTreg mice was ~30%, i.e., three times higher than that seen in control animals (Fig. 8a). This increase in ‘ex’-Foxp3 cells persisted for as long as 18 weeks post-tamoxifen (the last time point at which animals were bled). Confirming data from female Pten-ΔTreg mice heterozygous for Foxp3-Cre, reduction of CD25 expression was specific for Tregs in which PTEN was deleted (Fig. 8b). As ‘ex’-Foxp3 cells were observed in both control and Pten-iΔTreg mice, we also examined their expression of CD25, and found similar reductions in CD25 expression following loss of Foxp3 in both animals (Fig. 8c). Collectively, these data indicate that PTEN is important for the maintenance of Treg CD25 expression and Treg stability in vivo.
Figure 8.
PTEN deletion leads to Treg instability in vivo. Control and Pten-iΔTreg mice were treated with a 5 d course of tamoxifen as per Materials and Methods. Peripheral blood was assessed at the indicated time points. (a) Detection and quantification of ‘ex’-Foxp3 cells. All plots are gated on CD4+YFP+ cells, except Week -1, which is gated on total CD4+ cells. n = 5, representative of 3 experiments; *p <0.05, **p < 0.0001 by two-way ANOVA. (b) Expression of CD25 on Foxp3+ cells. CD25 staining of Foxp3+YFP+ Tregs (unshaded) and Foxp3+YFP− (shaded) unlabeled Tregs from a representative animal at week 20 as per panel a. n = 5, representative of 3 experiments, *p < 0.0001 by two-way ANOVA. (c) Expression of CD25 on ‘ex’-Foxp3 cells. CD25 staining of Foxp3−YFP+ (dashed) and Foxp3+YFP+ (solid) cells for the animal shown in panel b. n = 5, representative of 3 experiments; *p < 0.0001 by two-way ANOVA. All error bars are mean ± SD.
Discussion
The data presented in this manuscript, together with another group35, demonstrate that PTEN-mediated control of PI3K activity is critical for the function and stability of murine Foxp3+ regulatory T cells. Disruption of PTEN results in reduced CD25 expression, the accumulation of Foxp3+CD25− cells, and ultimately, the loss of Foxp3 expression. Prior to the discovery and characterization of the Foxp3 transcription factor, high expression of CD25 was used to demarcate Tregs from effector T cells. As such, little relevance has been attributed to the small portion of Foxp3+ cells with low CD25 expression, and they have only been assessed in minimal detail compared to canonical Foxp3+CD25+ cells. Here, we have identified a population of Foxp3+CD25− cells in Pten-ΔTreg mice, which appear to be intermediates during the complete destabilization of canonical Foxp3+CD25+ Tregs. Accordingly, these Foxp3+CD25− “Treg” cells displayed a transitional phenotype, where their Treg transcriptional profile was maintained despite a partially methylated Foxp3 TSDR, consistent with their lower Foxp3 protein expression.
We observed nearly normal CD25 expression in newly-generated PTEN-deficient Tregs in the thymus, suggesting that the destabilization process occurred after the generation of canonical Tregs expressing high levels of CD25. Strikingly, the small population of Foxp3+CD25− “Tregs” present in wild-type mice was seen to have much the same transcriptional profile as their PTEN-deficient counterparts. It is possible that loss of PTEN expression causes proliferation and/or confers a survival advantage upon a normal population of unstable Foxp3+CD25− cells, which are non-pathogenic in wild-type mice either due to proper regulation by Foxp3+CD25+ Tregs or because they are short-lived. Alternatively, the large population of Foxp3+CD25−ICOS+ cells in Pten-ΔTreg mice could be an expanded population of effector Tregs (eTR), which have been reported to express low CD25 at the steady state and require ICOS rather than IL-2 for maintenance36. Interestingly, inflammation has been shown to drive the proliferation of eTR and skew cells away from a cTR phenotype36. This finding, along with our data above, suggest that PTEN loss may be crucial in either eTR differentiation or maintenance.
The functional stability of Tregs remains a controversial issue, with several conflicting reports regarding the existence, origin and physiological/pathological role of unstable Tregs31, 32, 34, 37, 38. Recently, non-Treg cells have been demonstrated to transiently express Foxp3 upon activation, thus generating a small population of ‘ex’-Foxp3 cells, which are not ‘ex’-Tregs31. These data indicated that the Treg lineage itself was stable, but “unfaithful” expression of Foxp3 may occur, leading to a population of cells with unstable Foxp3 expression. However, the loss of Foxp3 in bona fide Tregs occurs in multiple autoimmune settings32, 38. Activated by self-antigen, these destabilized Tregs acquired effector function and pathogenicity in models of autoimmunity. Consistent with these findings, we find no evidence that PTEN deletion is occurring in non-Tregs. We show that ‘ex’-Foxp3 cells may also be generated from bona fide Foxp3+CD25+ Tregs that lack PTEN in a stepwise manner in vitro, with loss of CD25 preceding loss of Foxp3. Finally, using lineage reporter mice, we observe that the basal rate of generation of ‘ex’-Foxp3 cells from Tregs in vivo increases approximately three-fold when PTEN is absent.
Despite a normal transcriptional profile compared to PTEN-sufficient Tregs, Foxp3+CD25− cells expressed lower Foxp3 protein than canonical Foxp3+CD25+ Tregs, suggesting that the Foxp3+CD25− Treg population may be enriched for cells with unstable Foxp3 expression. Interestingly, this difference in Foxp3 expression was observed in wild-type Tregs as well as in PTEN-deficient Tregs; this association of Foxp3 and CD25 expression has been seen by other groups previously31–33.
The etiology of lymphoproliferation and autoimmunity in Pten-ΔTreg mice may be multifactorial. We provide evidence that PTEN-deficient Tregs exhibit lineage instability and can convert into Foxp3− cells. As the TCR repertoire of Tregs may be biased to self-antigen recognition39, this suggests the possibility that disease may be caused by conversion of PTEN-deficient Tregs into pathogenic effectors. Although this process of Foxp3 loss in Tregs occurs in wild-type mice as well, the absence of disease might be due to the comparative lesser degree of Treg instability and/or the fact that loss of PTEN confers an important survival advantage10 upon ‘ex’-Foxp3 cells. However if ‘ex’-Foxp3 cells are pathogenic, they must be “restrainable” by wild-type Tregs, as female mice heterozygous for Foxp3-Cre do not become ill until their wild-type Tregs are largely lost, and Pten-iΔTreg remain healthy after tamoxifen injection and resultant loss of Foxp3 in a substantial percentage of Tregs. Alternatively, ‘ex’-Foxp3 cells that accumulate as a result of PTEN loss may not be pathogenic per se, with disease in Pten-ΔTreg mice being a consequence of an intrinsic defect in regulation by PTEN-deficient Tregs. The inability of Pten-ΔTreg mice to resolve EAE in consistent with this possibility.
Activation of signaling through PI3K and mTOR inhibits peripheral Treg induction14. One possible mechanism for PI3K control of Tregs is via the Foxo1 and Foxo3a (Foxos) transcription factors, which bind to and promote Foxp3 transcription, but are inactivated by PI3K, 17. Indeed, deletion of Foxos severely inhibits both Treg generation and function in vivo, while constitutive nuclear localization of Foxos prevents these defects18. Additionally, the maintenance of Treg stability and function by the Neuropilin-1 (Nrp-1)/Semaphorin 4a (Sema4a) signaling axis is due in part to upregulation of PTEN and subsequent nuclear localization of Foxos upon Nrp-1 ligation40. Interestingly however, Pten-ΔTreg mice develop a different phenotype than animals in which Tregs lack Foxo1 expression (as the latter does not affect CD25− expression, nor promote inflammation induced Treg instability) and thus have heightened mTORC2 activation18. These disparate phenotypes suggest that multiple factors downstream of PTEN are critical in instructing the Treg lineage.
Modulation of PI3K signaling can alter cellular metabolism27. For example, overexpression of PTEN inhibits glycolysis and skews energy generation toward oxidative metabolism41. Interestingly, Tregs preferentially utilize lipid oxidation for energy, a process characterized by high AMP-activated protein kinase (AMPK) activity29. This contrasts with effector T cells, which primarily utilize glycolysis as a means of energy generation29, 42. Our data demonstrate that loss of PTEN enhances glycolysis in Tregs. The importance of metabolic programs in cellular activation and cell fate decisions is well recognized43, 44, including a role in determining if cells become in vitro induced Tregs or induced effectors29. Whether alterations in metabolism can affect a pre-existing lineage decision is not known, however the finding that Treg loss of PTEN shifts their metabolic profile suggests that this may be a contributing mechanism by which PTEN deletion destabilizes the Treg lineage, perhaps via an effect on CD25 expression, which precedes loss of Foxp3 during in vitro culture.
T cells may express other lipid phosphatases in addition to PTEN that control PI3K signals. One such family, the PH-domain leucine-rich repeat protein phosphatase (PHLPP), is expressed at high levels in murine and human Tregs, and is required for optimal iTreg development and Treg function45. Our data indicate that despite the expression of additional lipid phosphatases in Tregs, PTEN has a non-redundant function in PI3K control and Treg maintenance.
The identification of PI3K as a nodal control point for Treg homeostasis is particularly relevant given the clinical development of PI3K inhibitors for the treatment of autoimmunity or cancer. In the latter arena, the target of PI3K inhibition is the tumor cell itself, although interestingly it was reported recently that inactivation of PI3Kδ in Tregs disabled tumor-induced immune suppression and enabled immune-mediated tumor regression in murine models46. Whether PI3K blockade has a dominant role in inhibiting regulatory or effector T cell responses is likely to be context and dose-dependent. Our own results showing that high PI3K activity may cripple regulatory responses underscore the complexity of immune system control via this pathway.
Online methods
Mice
Ptenfl/fl 9 were bred with Foxp3-YFP-Cre knock-in mice47 provided by A. Rudensky (Memorial Sloan Kettering Cancer Center, New York, NY), to generate Pten-ΔTreg mice or with Foxp3eGFP-Cre-ERT2 Rosa26-YFP mice34– provided by A. Rudensky) to generate mice with tamoxifen inducible loss of PTEN in Tregs (Pten-iΔTreg mice). Control animals were either littermates or appropriate age/sex-matched Pten+/+Foxp3-YFP-Cre or Foxp3eGFP-Cre-ERT2 Rosa26YFP mice. Foxp3GFP-hCre mice48 and Rosa26cre-ER mice49 have been previously described. Unless otherwise stated, all figures are representative of experiments performed with healthy 6 – 8 week old mice. All mice were housed in specific pathogen-free conditions at Massachusetts General Hospital and the University of California, San Francisco, and all procedures were performed in accordance with protocols approved by each institution’s Institutional Animal Care and Use Committee.
Detection of PTEN protein and assessment of the Pten genomic locus
Specific deletion of PTEN in Foxp3+ cells at the protein level was assessed via western blotting as described previously23. PTEN recombination at the genomic DNA level was performed on highly pure sorted cell populations using previously described primers to specifically detect Ptenflox and deleted Pten alleles24.
Flow cytometry and cell sorting
Fluorescent anti-CD4 (GK1.5), anti-CD8 (53-6.7), anti-CD24 (30-F1), anti-CD25 (PC-61), anti-CD39 (Duha59), anti-CD44 (IM7), anti-CD62L (MEL-14), anti-CD73 (TY/11.8), anti-CD122 (5H4), anti-CD132 (TUGm2), anti-CXCR3 (CXCR3-173), anti-CXCR5 (L138D7), anti-ICOS (7E.17G9), anti-IFN-γ (XMG1.2), anti-IL-17 (TC11-18H10.1), anti-TCRVβ2 (B20.6) and anti-TCRVβ8 (MR5-2) antibodies were purchased from Biolegend, while anti-PTEN (A2B1), anti-CTLA-4 (UC10-4F10-11), anti-PD-1 (29F.1A12) and anti-CD127 (SB/199) fluorescent antibodies were purchased from BD Biosciences. Anti-Foxp3 intracellular staining kit and anti-Foxp3 (FJK-16s) antibodies were purchased from eBioscience. For intracellular cytokine staining, cells were restimulated with Leukocyte Activation Cocktail (BD Biosciences) for 5 h at 37°C. For phospho-flow cytometry, cells were serum starved at 37°C for 1 hen activated for 15 minutes with either IL-2 (pSTAT5) or αCD3 and αCD28 (pAkt and pS6). Cells were fixed with paraformaldehyde and permeabilized with methanol. Unconjugated anti-pSTAT5, anti-Akt Ser 473 and anti-S6 antibodies were purchased from Cell Signaling and secondary detection antibody was purchased from Jackson ImmunoResearch. For flow cytometric determination of PTEN, cells were stained with anti-CD25 and anti-CD4 antibodies and then fixed and permeabilized with BD cytofix/cytoperm reagent to preserve endogenous YFP fluorescence. Cells were then stained with an anti-PTEN antibody and run on LSR II flow cytometer. Cells were analyzed on a BD FACSCalibur, BD LSRII or Beckman Coulter Navios and sorted on a BD FACSAria II to over 95% purity; data were analyzed using FlowJo (Tree Star).
Treg culture conditions
Tregs were cultured in RPMI medium supplemented with 10% heat-inactivated fetal bovine serum, non-essential amino acids, sodium pyruvate, L-glutamine, HEPES, β-ME with 200 (for in vitro induced Tregs) or 2,000 IU/ml (nTregs) recombinant human IL-2 (Chiron). In vitro induction of Foxp3 from naïve CD4+ T cells was done by stimulation of T cells with plate-bound anti-CD3 (0.1 μg/ml clone 145-2C11 overnight) and anti-CD28 (1 μg/ml clone PV-1 overnight) in the presence of 5 ng/ml TGF-β. PI3K inhibitors were used at the following concentrations: 10 μM LY294002, 100 nM Rapamycin, 100 nM Wortmannin, 1 μM Akt Inhibitor VIII.
Acute deletion of PTEN in vitro
Tregs from Ptenfl/+ or Ptenfl/fl mice that also contained Rosa26-CreER were sorted by expression of CD4+CD25+CD62L+ and stimulated in vitro with anti-CD3 and anti-CD28 coated beads (Dynabeads Mouse T-Activator CD3/CD28, Invitrogen). On day 4 of culture, cells were either treated with 500 nM 4-hydroxytamoxifen (4-OHT, Sigma) or vehicle (ethanol) for the duration of the experiment. CD25 expression was assessed on CD4+Foxp3+ cells 3 and 10 days after start of treatment.
ELISA
Serum was collected from mice via cardiac puncture for serum Igs and anti-double stranded DNA (anti-dsDNA) antibodies or by serial bleeding for serum creatinine. Immunoglobulin concentrations were detected using the eBioscience Ready-SET-Go! Mouse Ig Isotyping ELISA kit, creatinine concentrations were detected using an ELISA kit from US Biological following the manufacturer’s instructions and anti-dsDNA antibodies were detected with an ELISA kit from Alpha Diagnostic as per the manufacturer’s instructions.
In vivo BrdU labeling
Mice were injected with 1 mg BrdU (BD Biosciences) i.p. every 12 h for 3 consecutive days. Mice were sacrificed 12 hours after the final injection and cells were stained using a BrdU labeling kit (BD Biosciences) following the manufacturer’s instructions.
Induction of EAE
Mice were immunized subcutaneously with MOG 35–55 peptide (UCLA Biopolymers Core) emulsified in Complete Freund’s Adjuvant (CFA, Difco) with M. tuberculosis (Difco). Additionally, mice were injected with Pertussis toxin (PT, List Biological Laboratories) i.p. on days 0 and 2 following immunization. Animals were evaluated daily in a blinded manner for signs of disease by the following criteria: 0: no disease; 1: flaccid tail paralysis; 2: hind limb paresis; 3: bilateral hind limb paralysis; 4: fore and hind limb paralysis.
Tamoxifen treatment
Foxp3eGFP-Cre-ERT2 Rosa26-YFP (iFoxp3 Cre) and Ptenfl/fl Foxp3eGFP-Cre-ERT2 Rosa26-YFP (Pten-iΔTreg) mice were injected with 2 mg of tamoxifen (Sigma) i.p. for 5 consecutive days to induce Foxp3eGFP-Cre-ERT2 activity. To simultaneously detect Foxp3 by antibody staining while preserving Rosa-YFP fluorescence, cells were pre-fixed with 2% paraformaldehyde (Electron Microscopy Sciences), fixed and permeabilized using an eBioscience kit and stained intracellularly with an anti-Foxp3 antibody as above.
Histology
Histologic analysis was performed as previously described23.
Metabolic studies
Extracellular acidification rate (ECAR) and oxygen consumption rate (OCR) were measured by the glycolysis-stress and mito-stress tests, respectively using the XF24 extracellular flux analyzer (Seahorse Bioscience). Briefly, sorted cells were rested for 20–22 hrs in the presence of 1ng/ml IL-2 and 5ng/ml IL-7 followed by the glycolysis-stress test that consisted of seeding 0.5–1 × 10⁶ purified cells in glucose free XF Assay media onto a 24 well XF plate coated with cell tak (BD biosciences, CN 354240) followed by sequential addition of glucose (20mM), oligomycin (1μM) and 2-deoxy glucose (20mM). The mito-stress test was performed using glucose (25mM) containing XF assay media and consisted of sequential addition of oligomycin (1μM), FCCP(1.5μM), etomoxir (200μM) followed finally by rotenone (100nM) and antimycin (1μM).
The glycolytic rate was determined by measuring the conversion of 5-3H glucose to tritiated 3H2O as described previously50. Briefly, 0.5–1.5 × 10⁶ purified cells were either unstimulated or stimulated in the presence of plate-bound anti-CD3 (5ug/ml) and anti-CD28 (5ug/ml) and IL-2: 200U/ml. Cells were harvested between 22–24hrs, washed in 1X PBS, resuspended and incubated in Krebs buffer (pH 7.4, 115 mM NaCl, 2 mM KCl, 25mM NaHCO3, 1mM MgCl2, 0.25% BSA) for 30 min at 37°C. Following incubation, 10μCi of radio-labeled 5-3H glucose along with 5 μl 1M cold glucose was added to the cells and incubated for another additional 1 h at 37°C. Reactions were quenched by addition of 0.5ml of 0.2M HCl. The diffusion chamber setup, the scintillation counting and the calculation of the glycolytic rate were performed as described previously50. A cell free sample with 10μCi of radio-labeled 5-3H glucose was included as a negative control and 0.5 μCi of radio-labeled 3H2O was included as a positive control.
Methylation analysis of Foxp3 locus
Genomic DNA from sorted cells was bisulfite converted using the EZ DNA Methylation-Direct kit (Zymo Research) according to the manufacturer’s protocol. Methylation-specific PCR primer sequences 5′-TATT TTTTTGGGTTTTGGGATATTA-3′ (forward) and 5′-AACCAACCAACTTCCT ACACTATCTAT-3′ (reverse) were used to amplify intron 1 of Foxp3 (corresponding to Foxp3 CNS2). PCR products were subcloned into pGEM-T Easy vectors (Promega) and sequenced (9–21 sequences per mouse).
Transcriptional profiling
Foxp3+CD25+ and Foxp3+CD25− cells were double-sorted to high purity, and RNA was extracted with TRIzol (Life Technologies) according to the manufacturer’s instructions. Samples were run in triplicate using a GeneChip Mouse Gene ST 1.0 Array (Affymetrix) and analyzed using GENE-E, GenePattern and Gene Set Enrichment Analysis (Broad Institute).
Supplementary Material
Acknowledgments
This work was supported by NIH grants R56AI083304 (LAT), R21AI105607 (LAT and JAB), P01HL018646 (LAT) and T32AI007529 (CMB), by a pre-doctoral training grant from the Cancer Research Institute (AH), and by a shared instrumentation grant 1S10RR023440.
Footnotes
Author contributions
A.H., M.D., B.P., P.T.S., J.Q., N.T. and V.A.G. designed and performed experiments; C.M.B., J.C.R., and A.H.S. designed experiments; A.H., M.D., J.A.B. and L.A.T. designed the study; A.H. and L.A.T. wrote the manuscript with assistance from M.D. and J.A.B.
Competing financial Interests
The authors declare a competing financial interest. For information see, xxxxxxxxxxx.
Accession codes: GSE60057
References
- 1.Hori S, Nomura T, Sakaguchi S. Control of regulatory T cell development by the transcription factor Foxp3. Science. 2003;299:1057–1061. doi: 10.1126/science.1079490. [DOI] [PubMed] [Google Scholar]
- 2.Fontenot JD, Gavin MA, Rudensky AY. Foxp3 programs the development and function of CD4+CD25+ regulatory T cells. Nature immunology. 2003;4:330–336. doi: 10.1038/ni904. [DOI] [PubMed] [Google Scholar]
- 3.Huynh A, Zhang R, Turka LA. Signals and pathways controlling regulatory T cells. Immunol Rev. 2014;258:117–131. doi: 10.1111/imr.12148. [DOI] [PubMed] [Google Scholar]
- 4.Webster KE, et al. In vivo expansion of T reg cells with IL-2-mAb complexes: induction of resistance to EAE and long-term acceptance of islet allografts without immunosuppression. J Exp Med. 2009;206:751–760. doi: 10.1084/jem.20082824. [DOI] [PMC free article] [PubMed] [Google Scholar]
- 5.Burchill MA, Yang J, Vogtenhuber C, Blazar BR, Farrar MA. IL-2 receptor beta-dependent STAT5 activation is required for the development of Foxp3+ regulatory T cells. J Immunol. 2007;178:280–290. doi: 10.4049/jimmunol.178.1.280. [DOI] [PubMed] [Google Scholar]
- 6.Ward SG, Ley SC, MacPhee C, Cantrell DA. Regulation of D-3 phosphoinositides during T cell activation via the T cell antigen receptor/CD3 complex and CD2 antigens. Eur J Immunol. 1992;22:45–49. doi: 10.1002/eji.1830220108. [DOI] [PubMed] [Google Scholar]
- 7.Di Cristofano A, et al. Impaired Fas response and autoimmunity in Pten+/− mice. Science. 1999;285:2122–2125. doi: 10.1126/science.285.5436.2122. [DOI] [PubMed] [Google Scholar]
- 8.Stambolic V, et al. Negative regulation of PKB/Akt-dependent cell survival by the tumor suppressor PTEN. Cell. 1998;95:29–39. doi: 10.1016/s0092-8674(00)81780-8. [DOI] [PubMed] [Google Scholar]
- 9.Suzuki A, et al. T cell-specific loss of Pten leads to defects in central and peripheral tolerance. Immunity. 2001;14:523–534. doi: 10.1016/s1074-7613(01)00134-0. [DOI] [PubMed] [Google Scholar]
- 10.Liu X, et al. Distinct roles for PTEN in prevention of T cell lymphoma and autoimmunity in mice. J Clin Invest. 2010;120:2497–2507. doi: 10.1172/JCI42382. [DOI] [PMC free article] [PubMed] [Google Scholar]
- 11.Bensinger SJ, et al. Distinct IL-2 receptor signaling pattern in CD4+CD25+ regulatory T cells. J Immunol. 2004;172:5287–5296. doi: 10.4049/jimmunol.172.9.5287. [DOI] [PMC free article] [PubMed] [Google Scholar]
- 12.Zeiser R, et al. Differential impact of mammalian target of rapamycin inhibition on CD4+CD25+Foxp3+ regulatory T cells compared with conventional CD4+ T cells. Blood. 2008;111:453–462. doi: 10.1182/blood-2007-06-094482. [DOI] [PMC free article] [PubMed] [Google Scholar]
- 13.Zanin-Zhorov A, et al. Scaffold protein Disc large homolog 1 is required for T-cell receptor-induced activation of regulatory T-cell function. Proceedings of the National Academy of Sciences of the United States of America. 2012;109:1625–1630. doi: 10.1073/pnas.1110120109. [DOI] [PMC free article] [PubMed] [Google Scholar]
- 14.Sauer S, et al. T cell receptor signaling controls Foxp3 expression via PI3K, Akt, and mTOR. Proceedings of the National Academy of Sciences of the United States of America. 2008;105:7797–7802. doi: 10.1073/pnas.0800928105. [DOI] [PMC free article] [PubMed] [Google Scholar]
- 15.Zeng H, et al. mTORC1 couples immune signals and metabolic programming to establish T(reg)-cell function. Nature. 2013;499:485–490. doi: 10.1038/nature12297. [DOI] [PMC free article] [PubMed] [Google Scholar]
- 16.Haxhinasto S, Mathis D, Benoist C. The AKT-mTOR axis regulates de novo differentiation of CD4+Foxp3+ cells. J Exp Med. 2008;205:565–574. doi: 10.1084/jem.20071477. [DOI] [PMC free article] [PubMed] [Google Scholar]
- 17.Ouyang W, et al. Foxo proteins cooperatively control the differentiation of Foxp3+ regulatory T cells. Nat Immunol. 2010;11:618–627. doi: 10.1038/ni.1884. [DOI] [PubMed] [Google Scholar]
- 18.Ouyang W, et al. Novel Foxo1-dependent transcriptional programs control T(reg) cell function. Nature. 2012;491:554–559. doi: 10.1038/nature11581. [DOI] [PMC free article] [PubMed] [Google Scholar]
- 19.Walsh PT, et al. PTEN inhibits IL-2 receptor-mediated expansion of CD4+ CD25+ Tregs. J Clin Invest. 2006;116:2521–2531. doi: 10.1172/JCI28057. [DOI] [PMC free article] [PubMed] [Google Scholar]
- 20.Koch MA, et al. The transcription factor T-bet controls regulatory T cell homeostasis and function during type 1 inflammation. Nature immunology. 2009;10:595–602. doi: 10.1038/ni.1731. [DOI] [PMC free article] [PubMed] [Google Scholar]
- 21.Li J, et al. PTEN, a putative protein tyrosine phosphatase gene mutated in human brain, breast, and prostate cancer. Science. 1997;275:1943–1947. doi: 10.1126/science.275.5308.1943. [DOI] [PubMed] [Google Scholar]
- 22.Xiong H, et al. Characterization of two distinct lymphoproliferative diseases caused by ectopic expression of the Notch ligand DLL4 on T cells. PLoS One. 2013;8:e84841. doi: 10.1371/journal.pone.0084841. [DOI] [PMC free article] [PubMed] [Google Scholar]
- 23.Zhang R, et al. An obligate cell-intrinsic function for CD28 in Tregs. J Clin Invest. 2013;123:580–593. doi: 10.1172/JCI65013. [DOI] [PMC free article] [PubMed] [Google Scholar]
- 24.Backman SA, et al. Deletion of Pten in mouse brain causes seizures, ataxia and defects in soma size resembling Lhermitte-Duclos disease. Nature genetics. 2001;29:396–403. doi: 10.1038/ng782. [DOI] [PubMed] [Google Scholar]
- 25.McGeachy MJ, Stephens LA, Anderton SM. Natural recovery and protection from autoimmune encephalomyelitis: contribution of CD4+CD25+ regulatory cells within the central nervous system. J Immunol. 2005;175:3025–3032. doi: 10.4049/jimmunol.175.5.3025. [DOI] [PubMed] [Google Scholar]
- 26.Hill JA, et al. Foxp3 transcription-factor-dependent and -independent regulation of the regulatory T cell transcriptional signature. Immunity. 2007;27:786–800. doi: 10.1016/j.immuni.2007.09.010. [DOI] [PubMed] [Google Scholar]
- 27.Wang R, Green DR. Metabolic checkpoints in activated T cells. Nat Immunol. 2012;13:907–915. doi: 10.1038/ni.2386. [DOI] [PubMed] [Google Scholar]
- 28.Frauwirth KA, et al. The CD28 signaling pathway regulates glucose metabolism. Immunity. 2002;16:769–777. doi: 10.1016/s1074-7613(02)00323-0. [DOI] [PubMed] [Google Scholar]
- 29.Michalek RD, et al. Cutting edge: distinct glycolytic and lipid oxidative metabolic programs are essential for effector and regulatory CD4+ T cell subsets. J Immunol. 2011;186:3299–3303. doi: 10.4049/jimmunol.1003613. [DOI] [PMC free article] [PubMed] [Google Scholar]
- 30.Polansky JK, et al. DNA methylation controls Foxp3 gene expression. European journal of immunology. 2008;38:1654–1663. doi: 10.1002/eji.200838105. [DOI] [PubMed] [Google Scholar]
- 31.Miyao T, et al. Plasticity of Foxp3(+) T cells reflects promiscuous Foxp3 expression in conventional T cells but not reprogramming of regulatory T cells. Immunity. 2012;36:262–275. doi: 10.1016/j.immuni.2011.12.012. [DOI] [PubMed] [Google Scholar]
- 32.Komatsu N, et al. Pathogenic conversion of Foxp3(+) T cells into TH17 cells in autoimmune arthritis. Nature medicine. 2014;20:62–68. doi: 10.1038/nm.3432. [DOI] [PubMed] [Google Scholar]
- 33.Wan YY, Flavell RA. Regulatory T-cell functions are subverted and converted owing to attenuated Foxp3 expression. Nature. 2007;445:766–770. doi: 10.1038/nature05479. [DOI] [PubMed] [Google Scholar]
- 34.Rubtsov YP, et al. Stability of the regulatory T cell lineage in vivo. Science. 2010;329:1667–1671. doi: 10.1126/science.1191996. [DOI] [PMC free article] [PubMed] [Google Scholar]
- 35.Shrestha S, et al. The Pten-mTORC2 axis coordinates Treg stability and control of TH1 and TFH cell flexibility. Nature Immunology. (In press) [Google Scholar]
- 36.Smigiel KS, et al. CCR7 provides localized access to IL-2 and defines homeostatically distinct regulatory T cell subsets. The Journal of experimental medicine. 2014;211:121–136. doi: 10.1084/jem.20131142. [DOI] [PMC free article] [PubMed] [Google Scholar]
- 37.Zhou X, et al. Instability of the transcription factor Foxp3 leads to the generation of pathogenic memory T cells in vivo. Nat Immunol. 2009;10:1000–1007. doi: 10.1038/ni.1774. [DOI] [PMC free article] [PubMed] [Google Scholar]
- 38.Bailey-Bucktrout SL, et al. Self-antigen-driven activation induces instability of regulatory T cells during an inflammatory autoimmune response. Immunity. 2013;39:949–962. doi: 10.1016/j.immuni.2013.10.016. [DOI] [PMC free article] [PubMed] [Google Scholar]
- 39.Hsieh CS, Zheng Y, Liang Y, Fontenot JD, Rudensky AY. An intersection between the self-reactive regulatory and nonregulatory T cell receptor repertoires. Nat Immunol. 2006;7:401–410. doi: 10.1038/ni1318. [DOI] [PubMed] [Google Scholar]
- 40.Delgoffe GM, et al. Stability and function of regulatory T cells is maintained by a neuropilin-1-semaphorin-4a axis. Nature. 2013;501:252–256. doi: 10.1038/nature12428. [DOI] [PMC free article] [PubMed] [Google Scholar]
- 41.Garcia-Cao I, et al. Systemic elevation of PTEN induces a tumor-suppressive metabolic state. Cell. 2012;149:49–62. doi: 10.1016/j.cell.2012.02.030. [DOI] [PMC free article] [PubMed] [Google Scholar]
- 42.Gwinn DM, et al. AMPK phosphorylation of raptor mediates a metabolic checkpoint. Molecular cell. 2008;30:214–226. doi: 10.1016/j.molcel.2008.03.003. [DOI] [PMC free article] [PubMed] [Google Scholar]
- 43.Delgoffe GM, et al. The mTOR kinase differentially regulates effector and regulatory T cell lineage commitment. Immunity. 2009;30:832–844. doi: 10.1016/j.immuni.2009.04.014. [DOI] [PMC free article] [PubMed] [Google Scholar]
- 44.Dang EV, et al. Control of T(H)17/T(reg) balance by hypoxia-inducible factor 1. Cell. 2011;146:772–784. doi: 10.1016/j.cell.2011.07.033. [DOI] [PMC free article] [PubMed] [Google Scholar]
- 45.Patterson SJ, et al. Cutting edge: PHLPP regulates the development, function, and molecular signaling pathways of regulatory T cells. J Immunol. 2011;186:5533–5537. doi: 10.4049/jimmunol.1002126. [DOI] [PMC free article] [PubMed] [Google Scholar]
- 46.Ali K, et al. Inactivation of PI(3)K p110delta breaks regulatory T-cell-mediated immune tolerance to cancer. Nature. 2014;509:407–411. doi: 10.1038/nature13444. [DOI] [PMC free article] [PubMed] [Google Scholar]
- 47.Rubtsov YP, et al. Regulatory T cell-derived interleukin-10 limits inflammation at environmental interfaces. Immunity. 2008;28:546–558. doi: 10.1016/j.immuni.2008.02.017. [DOI] [PubMed] [Google Scholar]
- 48.Zhou X, et al. Selective miRNA disruption in T reg cells leads to uncontrolled autoimmunity. J Exp Med. 2008;205:1983–1991. doi: 10.1084/jem.20080707. [DOI] [PMC free article] [PubMed] [Google Scholar]
- 49.Badea TC, Wang Y, Nathans J. A noninvasive genetic/pharmacologic strategy for visualizing cell morphology and clonal relationships in the mouse. J Neurosci. 2003;23:2314–2322. doi: 10.1523/JNEUROSCI.23-06-02314.2003. [DOI] [PMC free article] [PubMed] [Google Scholar]
- 50.Vander Heiden MG, et al. Growth factors can influence cell growth and survival through effects on glucose metabolism. Mol Cell Biol. 2001;21:5899–5912. doi: 10.1128/MCB.21.17.5899-5912.2001. [DOI] [PMC free article] [PubMed] [Google Scholar]
Associated Data
This section collects any data citations, data availability statements, or supplementary materials included in this article.


