Abstract
Although an anatomical connection from CA1 to CA3 via the Entorhinal Cortex (EC) and through backprojecting interneurons has long been known it exist, it has never been examined quantitatively on the single neuron level, in the in-vivo nonpatholgical, nonperturbed brain. Here, single spike activity was recorded using a multi-electrode array from the CA3 and CA1 areas of the rodent hippocampus (N=7) during a behavioral task. The predictive power from CA3→CA1 and CA1→CA3 was examined by constructing Multivariate Autoregressive (MVAR) models from recorded neurons in both directions. All nonsignificant inputs and models were identified and removed by means of Monte Carlo simulation methods. It was found that 121/166 (73%) CA3→CA1 models and 96/145 (66%) CA1→CA3 models had significant predictive power, thus confirming a predictive ‘Granger’ causal relationship from CA1 to CA3. This relationship is thought to be caused by a combination of truly causal connections such as the CA1→EC→CA3 pathway and common inputs such as those from the Septum. All MVAR models were then examined in the frequency domain and it was found that CA3 kernels had significantly more power in the theta and beta range than those of CA1, confirming CA3’s role as an endogenous hippocampal pacemaker.
Keywords: Hippocampus, CA3, CA1, Functional connectivity, Reentrance, MVAR model, Granger causality
1 Introduction
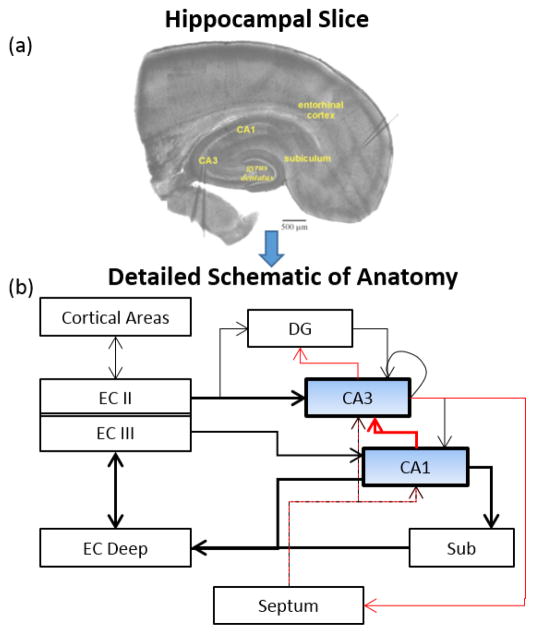
Information flow through the hippocampus has long been viewed in the context of the trisynaptic pathway, a series of feedforward synapses from the entorhinal Cortex (EC) through the Dentate Gyrus and area CA3 to area CA1. However, there has long been evidence to support the notion that CA1 may also causally influence CA3 (see Fig. 1). Deadwyler et al. (1975) showed that population spikes from the hippocampus can reenter the hippocampus via the EC, thus giving the first evidence of a Hippocampal-entorhinal loop through which the CA1→CA3 causal influence may occur. It was later found that hippocampal reentrance was facilitated by the connections between CA1, the Subiculum, and the EC (Finch et al., 1986). Also, it was shown that the topology between the EC and the hippocampus is preserved, i.e. information which leaves the hippocampus returns to the same hippocampal neurons via the EC (Buzsáki, 1989; Tamamaki and Nojyo, 1995). Additionally, interneurons have been found in CA1 which directly backproject to CA3 (Sik et al., 1994).
Fig. 1.
(A) Horizontal rodent hippocampal slice showing anatomical locations of the areas dealt with in our model. (B) Detailed schematic representation of anatomical connectivity of hippocampus. Black and red lines show excitatory and inhibitory connections, respectively. Notice that information from CA1 may enter CA3 via a direct inhibitory connection (bold red line), or via multisynaptic paths through the entorhinal Cortex (bold black line)
Much work has been done to associate the Hippocampal-entorhinal loop with sustaining and spreading seizures. Pare et al. (1992) showed in Guinea Pig slice preparations that seizures will only occur once interictal activity is able to reenter the hippocampus through the Dentate Gyrus. The reverberation of ictal activity through the entorhinal-Hippocampal loop was later corroborated in rats using various in-vitro epilepsy models (Stringer and Lothman, 1992; Nagao et al., 1996; Barbarosie and Avoli, 1997). Bragin et al. (1997) showed that ictal activity in-vivo did not simply reverberate around the hippocampal-entorhinal loop in fixed cycles, but was probably sustained by multiple nested oscillators, many of which may independently initiate ictal population spikes.
Although much work has been done to study the causal connection from CA1 to CA3 in the context of epilepsy, its function in the working nonpathologic brain remains largely unknown. Buzsáki (1989) showed that the ability of population spikes to reenter the hippocampus depends on the behavioral state of the animal. Furthermore, it has been shown that the CA1→EC pathway is able to undergo long-term potentiation, suggesting a role for this pathway in learning and memory (Craig and Commins, 2005). Furthermore, much experimental and computational research has implicated reverberatory neural activity between bidirectionally connected regions in sustaining working (short-term) memory (Fuster, 2000; Wang, 2001). In particular, this reverberatory activity can lead to rhythmogenesis which has been widely and successfully linked to performance in different memory tasks across several animals (Winson, 1978; Berry and Thompson, 1978; Wiebe and Stäubli, 2001; Staubli and Xu, 1995). Thus, given the central role of the hippocampus in consolidating working memories to the cortex, it seems reasonable to hypothesize that bidirectional causal connections between hippocampal regions play an important role in this process.
Although several studies have explored the causal connection from CA1 to CA3 on a network level, using local field potentials, and usually in the context of epilepsy, no studies have yet explored this connection on a single neuron level in the nonpathologic, nonperturbed brain. In the past, our group has developed several multiple-input nonparametric predictive models characterizing the dynamics from CA3 to CA1 for point-process data recorded in rodents during a behavioral task (Song et al., 2007; Zanos et al., 2008; Marmarelis et al., 2012; Sandler et al., 2014). These models have been validated both analytically and in-vivo, in the context of hippocampal prosthesis (Berger et al., 2012; Hampson et al., 2012a). In the present study, we use similar models to show that a ‘Granger-like’ causal relationship exists from CA1→CA3. Furthermore, we show that the predictive power of this relationship is as strong as that from CA3→CA1. Lastly, we show how the bidirectional dynamics between CA3 and CA1 can be used to shed light on the emergence and propagation of the hippocampal theta and gamma rhythms.
2 Methods
2.1 Experimental Protocols and Data Preprocessing
Male Long-Evans rats were trained to criterion on a two lever, spatial Delayed-NonMatch-to-Sample (DNMS) task. Spike trains were recorded in-vivo during performance of the task with multi-electrode arrays implanted in the CA3 and CA1 regions of the hippocampus. These experiments were conducted in the labs of Dr. Deadwyler and Dr. Hampson at Wake-Forest University and have been described in detail in our previous publications (Hampson et al., 2012a). Only neural activity from trials where the rat successfully completed the DNMS task was used. Spikes were sorted, time-stamped, and discretized using a 2ms bin. Spike train data from 1s before to 5s after the sample presentation phase of the DNMS task was extracted and concatenated into one time series. In total, 74 CA3 cells and 84 CA1 cells were recorded during 9 sessions in 7 different animals (table 1). As previous studies have shown that the cell dynamics vary depending whether the trial involved the left or right lever (Hampson et al., 2012a), separate MIMO models were constructed for both types of trials for a total of 166 CA3→CA1 and 145 CA1→CA3 models. Time series lengths varied due to the number of trials in the session and ranged from 30 seconds to 5 minutes. As the motivation behind our modeling is to quantify predictive power between the CA3 and CA1 regions, no attempt was made to separate principal cells and interneurons.
Table 1.
Summary of obtained data. Subsession labels LA, LB, RA, and RB refer respectively to left hippocampus A-nonmatch, left hippocampus B-nonmatch, right hippocampus A-nonmatch, and right hippocampus B-nonmatch. A-nonmatch and B-nonmatch refer to the right and left lever during the DNMS task. See Hampson et al. (2012a). Last row indicates totals.
| Animal | Session | Subsessions | CA3 Cell Count | CA1 Cell Count |
|---|---|---|---|---|
| 1098 | 53 | LA,RA,LB,RB | 15 | 23 |
| 1099 | 58 | LA,LB | 4 | 8 |
| 1141 | 60 | RA,RB | 4 | 7 |
| 1134 | 100 | LA,RA,LB,RB | 12 | 12 |
| 1148 | 116 | LA,LB | 4 | 8 |
| 1147 | 117 | LA,LB | 6 | 4 |
| 118 | LA,RA,LB,RB | 12 | 8 | |
| 1154 | 120 | LA,RA,LB,RB | 9 | 8 |
| 124 | LA,RA,LB,RB | 8 | 6 | |
|
| ||||
| 7 | 9 | 28 | 74 | 84 |
2.2 Model Configuration and Estimation
Nonparametric multiple-input linear autoregressive models were used to model the dynamical transformation between input and output spike trains (see Fig. 2). Thus, each model consisted of a feedforward component, reflecting the effect of the N input cells on the output cell and a feedback/autoregressive component reflecting the subthreshold and suprathreshold effects the output cell has on itself. Thus, the output y is calculated as:
| (1) |
where kn reflects the feedforward kernel of input n, and kAR reflects the autoregressive/feedback kernel. In order to reduce the amount of parameters in the model, we applied the Laguerre expansion technique to expand the feedforward and feedback kernels over L Laguerre basis functions (Marmarelis and Orme, 1993). This technique has also been shown to dramatically reduce the amount of data needed to estimate accurate dynamic input-output time-series models (Marmarelis, 2004). Thus, the input and output data records were first convolved with the Laguerre functions:
| (2) |
| (3) |
where bl is the lth Laguerre basis function. By first convolving with the La-guerre basis functions, the dynamical effects of the past input epochs are removed and we are left with a simple regression of contemporaneous data. Substituting equations (2) and (3) into equation (1) we have:
| (4) |
where cl,xi and cl,y are the feedforward and feedback Laguerre expansion coefficients. All model parameters were estimated using minimum mean square error (MMSE) estimation. The memory of our system was fixed at 300ms, in accordance with previous studies (Song et al., 2007; Lu et al., 2011). The Laguerre parameter was fixed at 0.84 to reflect this system memory (Marmarelis, 2004).
Fig. 2.
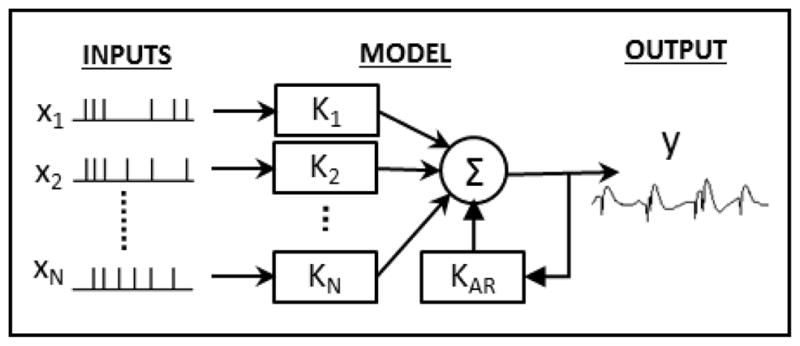
Model Configuration. Each model has N point-process inputs which each go through a linear kernel, Ki. These inputs are then summed with the output of the feedback kernel, KAR to generate the final output, y(t), which is a continuous signal
2.3 Model Selection
In theory, the most predictive model would include all recorded inputs. However, such a model would be susceptible to overfitting, and would not reveal which neurons are causally connected to each other. To overcome this issue a forward step-wise selection procedure was used to minimize overfitting and prune out all inputs which are not causally related to the output (Song et al., 2009a). Given an output cell and M potential input cells recorded during the same session, the following steps were used to select the N input cells which are causally connected to the output cell. First, the data was divided into training (in-sample) and testing (out-of-sample) sets. Then, M single-input single-output (SISO) models were constructed with each of the potential inputs. The model whose predicted output had the highest correlation, as measured by the Pearson correlation-coefficient, ρ, with the actual output was selected. Afterwards, N-1 two input models were constructed using the previously selected input and one of the remaining potential inputs. If any of the inputs were able to raise ρ, the input which raised ρ the most was selected; otherwise, the procedure was ended, and only 1 input was selected. This procedure was repeated until either none of the inputs were able to raise ρ, or all M potential neurons were selected. The N selected neurons were then used as the model input.
2.4 Model Validation
To avoid overfitting, Monte Carlo style simulations were used to select those models which represent significant causal connections between input and output neurons and do not just fit noise (Zanos et al., 2008). The following procedure was used: in each run the real input was replaced with a surrogate Poisson input having the same mean firing rate (MFR) as the real input. A model was then generated between the surrogate input and the real output, and the Pearson correlation coefficient, ρi, was obtained as a metric of performance. T=40 such simulations were conducted for each output and a set of performance metrics, , was obtained. Then, using Fischer’s transformation, we tested the hypothesis, H0, that ρ was within the population of {ρi}. If this hypothesis could be rejected at the 95% significance level, the model was deemed significant.
2.5 Kernel Analysis
In order to gain understanding of the underlying CA3→CA1 and CA1→CA3 dynamics, several features of the estimated kernels were analyzed. The total area, both positive and negative, of a kernel reflects the influence the associated input has on the output, and thus can be used as a measure of the predictive power the given input has on the output. The excitatory index, defined as the ratio of positive area to total area, was used to quantify whether a given input cell has an excitatory or inhibitory influence on the output cell. Thus, an excitatory index of 1 corresponds to an entirely excitatory input, while an excitatory index of 0 corresponds to an entirely inhibitory input.
To quantify how the kernels contribute to neuronal oscillations, the power within the kernels in the given frequency band was calculated. In order to compare the power in a given frequency band between two kernels, the power in the given band was normalized by the total kernel power. These metrics are summarized in table 2.
Table 2.
Summary of kernel analysis metrics used
| Metric | Interpretation | Formula | Notes | ||
|---|---|---|---|---|---|
| Total Power (TP) | Predictive power of given input |
|
|||
| Excitatory Index (EI) | Inhibitory/Excitatory connections |
|
|
||
| Band Power (BP) | Power in frequency band between [a,b]Hz |
|
K(f) = DFT[k(t)] |
2.6 Principal Dynamic Mode Analysis
A major issue of data based system identification is how to extract features of the underlying system from subject to subject variability. This issue is particulary pertinent when dealing with large datasets such as those in this study. One approach developed by our group to deal with this issue is to extract the global Principal Dynamic Modes (PDMs) of the system (Marmarelis, 2004; Marmarelis et al., 2013, 2014). Essentially, the PDMs are an efficient system-specific set of basis functions which parsimoniously describe the linear dynamics of each input-output transformation. The global PDMs were obtained in a two step process: first, all kernels of each input from every animal were concatenated in a rectangular matrix. Then singular value decomposition (SVD) was performed on the rectangular matrix to obtain all the significant singular vectors, which are the global PDMs. Here, two sets of PDMs were obtained for both the CA3→CA1 and CA1→CA3 feedforward transformation. It was found that 3 global PDMs were sufficient to describe the linear dynamics of each transformation.
2.7 Statistical Analysis
Unless otherwise noted, the unpaired Mann-Whitney U test was used to access whether significant differences exist between two samples. This test was used since it does not assume a normal distribution, and much of our data was found to be skewed/nonnormal. Shift estimates (Hodges-Lehman) and confidence intervals were estimated as prescribed by Higgins (2003). In order to estimate the scale estimate, or the ratio between two samples, the data was first log-transformed and then scale estimate was taken to be the antilog of the shift estimate.
In addition to the Pearson correlation coefficient, ρ, Receiver Operating Characteristic (ROC) curves were used to visualize model performance. ROC curves plot the true positive rate against the false positive rate over the putative range of threshold values for the continuous output, y (Zanos et al., 2008). The area under the curve (AUC) of ROC plots are used as a performance metric of the model, and have been shown to be equivalent to the Mann-Whitney two sample statistic (Hanley and McNeil, 1982). The AUC ranges from 0 to 1, with 0.5 indicating a random predictor and higher values indicating better model performance. The ρ and AUC metrics were chosen as they measure the similarity between a continuous ‘prethreshold’ signal and a spike train. The continuous ‘prethreshold’ signal was chosen over adding a threshold trigger and comparing true output spike train with an output ‘postthreshold’ spike train for two reasons. First, this allows us to avoid specifying the threshold trigger value, which relies on the somewhat arbitrary tradeoff between true-positive and false-negative spikes (Marmarelis et al., 2013). Also, similarity metrics between two spike trains often require the specification of a ‘binning parameter’ to determine the temporal resolution of the metric (van Rossum, 2001; Victor and Purpura, 1997).
3 Results
3.1 Estimated Models
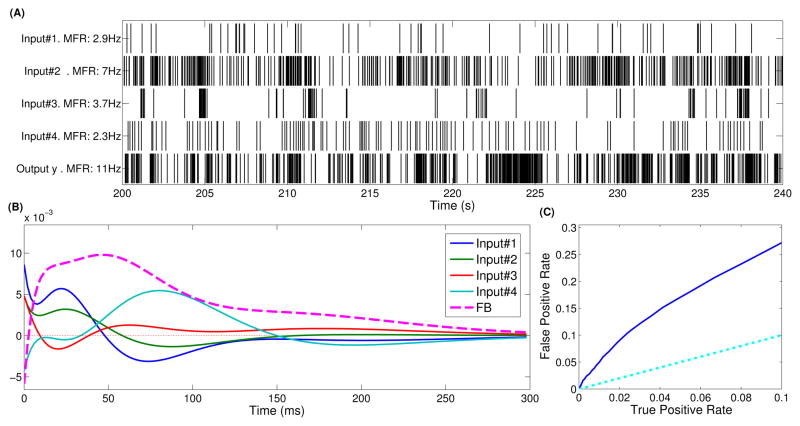
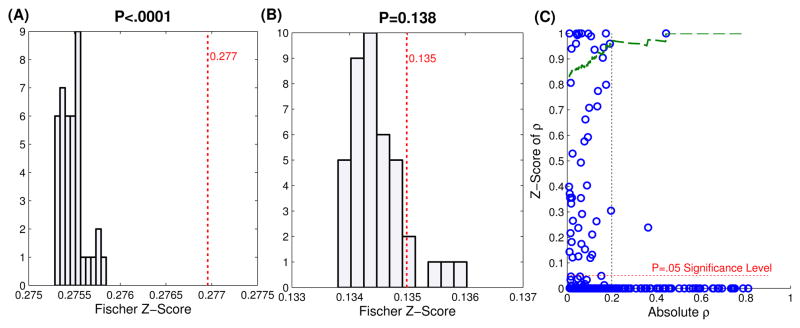
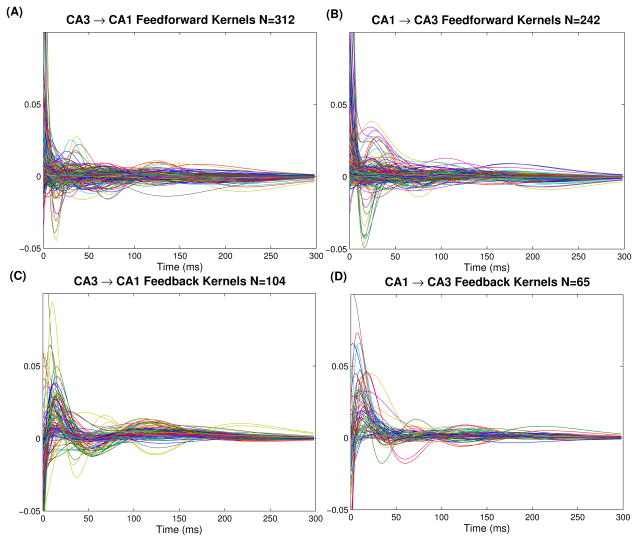
166 CA3→CA1 and 145 CA1→CA3 multiple-input single-output (MISO) models, spanning 7 animals (table 1), were examined to determine whether a predictive relationship exists going from CA1→CA3 and how this relationship compares with the established predictive relationship from CA3→CA1. A representative CA1→CA3 model is shown in Fig. 3. Monte Carlo style simulations were performed for every estimated model in order to establish significance (see methods). Fig. 4A shows the results of these simulations for the model shown in Fig. 3, which was deemed significant. Fig. 4B shows an example of a model deemed insignificant. To see whether the Pearson correlation coefficient was a valid metric to use to compare continuous signals and spike trains, the absolute ρ values were plotted against their estimated significance level (p-value) in Fig. 4C. The green line shows the chance that a model of a given ρ value or higher will be deemed significant. It is clear that higher ρ values mean that a model is more likely to be deemed significant. Furthermore, if the model’s ρ value is greater than 0.2, there is a >95% chance it will be deemed significant; thus, although low ρ values are inconclusive, a ρ value >0.2, can be used to deem the model significant without undergoing full Monte Carlo simulations. These facts justify the use of ρ to assess the quality of our models. The feedforward and feedback kernels of all the significant models are shown in Fig. 5.
Fig. 3.
Representative CA1→CA3 model with 4 inputs and a single output. (a) Rasterplots of input and output activity over 4 minutes. MFR is abbreviation for mean firing rate. (b) Estimated input (feedforward) and feedback kernels. Notice that many kernels have both excitatory (positive area) and inhibitory (negative area) effects. Furthermore, input kernels #1 and #4 display strong theta oscillations. (c) ROC plot showing model predictive power. The light blue line (TPR=FPR) indicates a model with no predictive power. AUC=668.001. For this model, ρ=0.11
Fig. 4.
(A,B) Examples of Monte Carlo simulations: For each model, 40 surrogate models with random Poisson inputs of the same mean firing rate were generated. The Fischer z-scores of these models, which are derived from ρ, were plotted as a histogram, while the true ρ value is the plotted dashed red line. The P value for the hypothesis that the true ρ value is greater than the simulated ρ values is printed above the graphs. Models were deemed significant if P<.05. (A) shows the results for the model in Fig. 3, which was deemed significant. (B) shows an insignificant model (C) Scatterplot of absolute values of ρ and their associated significance values. The green line shows the probability that a model with a given ρ value or greater will be deemed significant
Fig. 5.
All significant feedforward (top) and feedback (bottom) kernels from CA3→CA1 (left) and CA1→CA3 (right)
3.2 General Trends
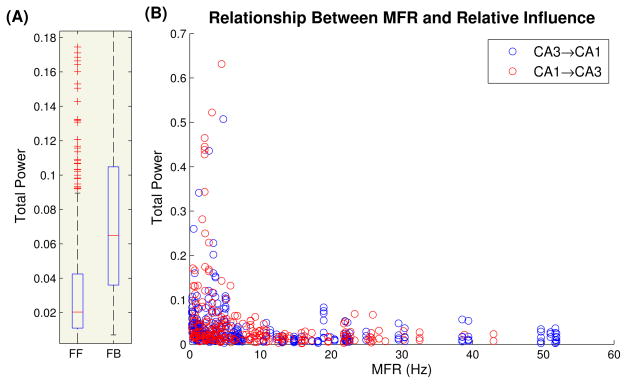
The predictive power of feedforward and feedback kernels was compared (Fig. 6A). Feedback kernels were found to have significantly more predictive power than feed-forward kernels. This is not surprising given that hippocampal principal cells have an estimated 380,000 synapses (wes), thus severely limiting the ability of any single input cell to determine the output cell’s behavior. The ability of a cell’s past activity to influence its current behavior, however, is well known. Pyramidal cells not only have absolute refractory periods lasting a few milliseconds but afterhyperpolarization lasting upto several seconds (Spruston and McBain, 2007). Furthermore, the feedback kernels incorporate the well-known intraregional recurrent connections between pyramidal cells and interneurons within the hippocampal CA3 and CA1 regions (Li et al., 1994; Goutagny et al., 2009).
Fig. 6.
(A) Boxplots of total power of all feedforward kernels (FF, N=659) and all feedback kernels (FB, N=203). The average feedback kernels had 2.82 times the area of the average feedforward kernel (MW test, P<.001. CI=[2.5,3.2]). (B) Scatterplot of input MFR vs kernel total area. Notice there was little to no difference between CA3→CA1 and CA1→CA3 models
In Fig. 6B, the total area of each kernel was plotted against the MFR of its associated inputs to see whether there was any relationship between input MFR and predictive power. It was found that the most predictive cells were those with a MFR below 6 Hz. It is reasonable to assume that these cells correspond to principal cells. This is not surprising given that the primary output of both regions is provided by principal cells. In fact, the set of highly predictive principal cells may correspond to the so-called functional cell types which selectively fire in response to a specific type of stimulus in the DNMS task (ie left-nonmatch) (Hampson et al., 1999, 2012a,b; Goonawardena et al., 2010). Given that these cells are found both in CA3 and CA1 it is clear that these cells would have predictive power over each other.
3.3 Bidirectional Predictive Power & Dynamics
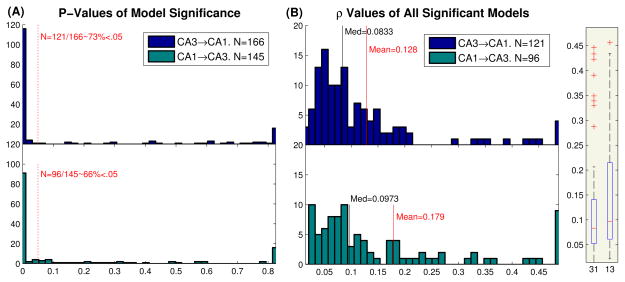
The predictive power, as measured by ρ values, between CA3→CA1 and CA1→CA3 models was compared (Fig. 7). As shown in Fig. 7A, 121/166 (73%) CA3→CA1 and 96/145 (66%) CA1→CA3 models were found to be significant. Although a higher proportion of CA3→CA1 models were significant, this difference was not itself deemed significant (2-sample z test, P=.2). The ρ values of all the significant models in both directions were then compared (Fig. 7B). Once again, no significant differences were found in the predictive power of the models (P=.27).
Fig. 7.
Comparison of CA3→CA1 and CA1→CA3 predictive power. (A) Histogram of CA3→CA1 (top) and CA1→CA3 (bottom) P-values, acquired from Monte Carlo simulations (see Fig. 4). Dashed red line is the 5% significance level. (B) Boxplot (right) and histogram (left) of the ρ values of all significant models. The black line shows the median, while the red line shows the mean
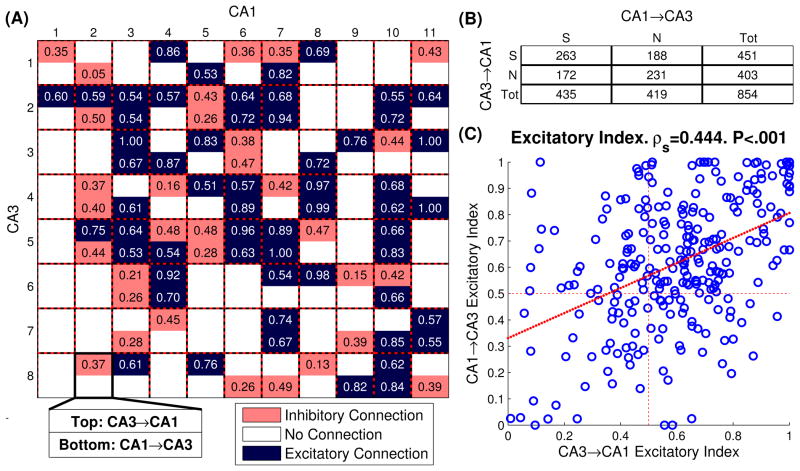
To better visualize these results in a single animal, bidirectional connectivity grids were constructed between CA3 and CA1 cells recorded in the same session (Fig. 8A) (Kim et al., 2011). Each square in the connectivity grid shows the bidirectional connectivity between two cells. As can be seen, many pairs of cells have bidirectional connectivity (ie between CA3 cell #2 and CA1 cell #3), while other pairs of cells only have unidirectional connectivity (ie CA3 cell #2 influences CA1 cell #4, but not vice-versa). Other pairs of cells had no influence on each other (ie CA3 cell #2 and CA1 cell #9). It was found that cells which had a causal connection in one direction were 16% more likely to have a connection in the other direction (Fig. 8B. 2 proportion z-test, p<.001, CI=5%). This suggests that not only are the CA3 and CA1 regions bidirectionally connected, but specific cells within those regions are bidirectionally connected. Such topographical preservation of connectivity between individual CA3 and CA1 cells has been previously shown in physiological and labeling studies (Buzsáki, 1989; Tamamaki and Nojyo, 1995).
Fig. 8.
(A) Representative bidirectional connectivity grid. In each square there are two values representing the excitatory indices from CA3→CA1 (top) and from CA1→CA3 (bottom). Blue shading corresponds to net excitatory connections, while salmon shading corresponds to net inhibitory connections (i.e. excitatory index < 0.5) Blank values indicate no significant causal connection. (B) Table of significant connections. S=significant, N=not significant, Tot=total. (C) Scatter plot of bidirectional excitatory levels and fitted linear regression.
Finally, the relationship between excitatory levels from CA3→CA1 and CA1→CA3 in bidirectionally connected cells was examined. A positive trend was found between the excitatory levels in both directions (Fig. 8C. Spearman’s ρ=.44. p<.001). From a control theory standpoint, this suggests that CA3 and CA1 cells are prone to be wired in a positive feedback loop. Such a structure is particularly prone to the unstable oscillations which characterize epilepsy. Indeed, in-vitro experiments have shown such uncontrolled oscillations in hippocampal-entorhinal epilepsy slices (Pare et al., 1992; Barbarosie and Avoli, 1997).
Although the predictive power of both pathways was found to be roughly equal, the dynamics of the two pathways were, as to be expected, asymmetrical. In particular, a difference in the timecourse of the dynamics was seen in the estimated kernels. The mean normalized RMS power of each set of feedforward kernels can be seen in Fig. 9. It was found that the CA3→CA1 kernels had significantly more power in the first 10ms (Δ=+13.5%, P=.026, see Fig. 9), while the CA1→CA3 kernels had more power from 20–40ms (Δ=+14.5%, P=.005). The slower timecourse of the CA1→CA3 pathway is to be expected giver the much longer anatomical path that information from CA1 takes through the EC to reenter CA3 (although as noted, information from CA1 may reenter CA3 directly through backprojecting interneurons, this pathway is presumed to be more sparse than the EC pathway).
Fig. 9.
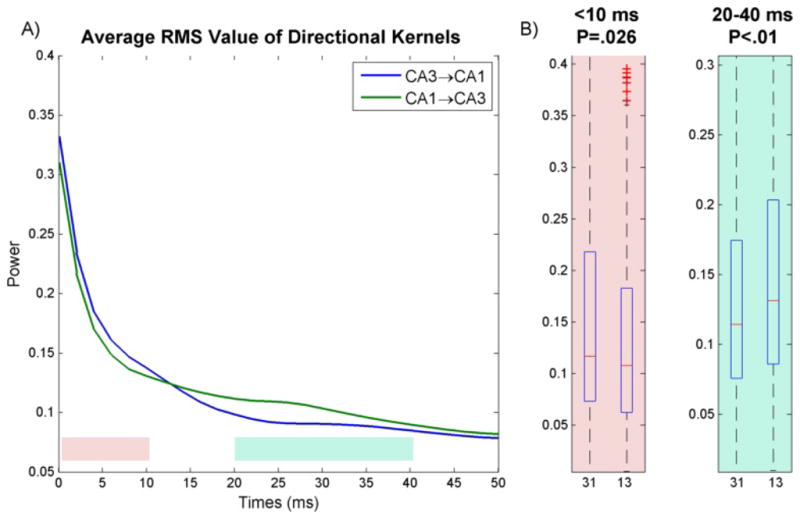
(A) mean normalized RMS power of CA3→CA1 and CA1→CA3 pathways. (B) The ratios of power of early dynamics (1st 10ms, pink plot) and late dynamics (20–40ms, blue plot) vs total power were compared between both pathways using a two-sample Mann-Whitney test. It was found that the CA3→CA1 pathway has more power in 1st 10ms (Δ=+13.5%, P=.026) whereas CA1→CA3 has more power later on from 20–40ms (Δ=+14.5%, P=.005). Here 31 and 13 refer to CA3→CA1 and CA1→CA3 kernels respectively.
3.4 Bidirectional PDM Analysis
The global PDMs for each pathway were calculated as discussed in methods and are shown in Fig. 10. The PDMs can be seen as a system-specific basis of functions which efficiently describe the linear dynamics of each pathway. The 1st PDM of both pathways is almost identical and has its peak in the 0th time bin, indicating concurrent firing in both populations. Such concurrent firing presumably arises through common inputs such as those from the EC and has the effect of coding common representations of the environment in both regions. The 2nd and 3rd PDMs are different in both pathways and presumably represent direct causal influences from one region onto the next, The 2nd PDM in both pathways has a delayed excitatory effect, which peaks at 10ms in the CA3→CA1 pathway and at 20ms in the CA1→CA3 pathway. The slower timecouse of the 2nd PDM from CA1→CA3 corroborates what was seen in the RMS power timecourse analysis in Fig. 9. It should be noted that several groups have shown that electrical volleys induced by stimulation in CA1 take roughly 20ms to reach CA3 (Deadwyler et al., 1975; Buzsáki, 1989; Wu et al., 1998). The 3rd PDM in both pathways oscillated in the theta range at 5Hz. However, although both PDMs oscillated at the same frequency, they were 180° out of phase, with the CA3→CA1 PDM having an initial excitatory component and the CA1→CA3 PDM having an initial inhibitory component. This PDM phase difference may provide a mechanism for the finding that CA3 and CA1 principal cells fire 180° out of phase during the theta cycle (Mizuseki et al., 2009). Namely, the theta phase difference in cell firing may emerge through a theta phase difference in the dynamical transformations between the regions, which can be observed in the 3rd PDM.
Fig. 10.
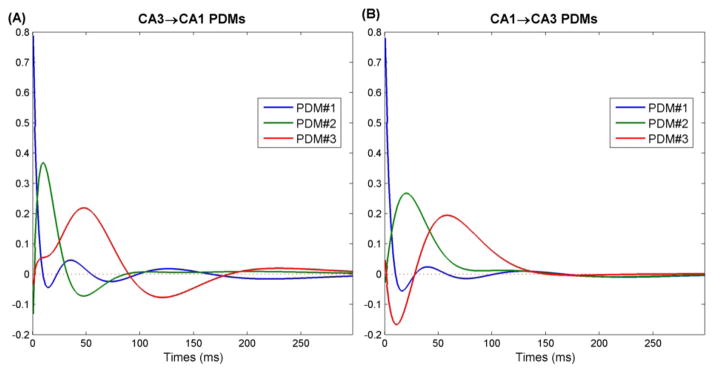
Global PDMs for (A) CA3→CA1 pathway and (B) CA1→CA3 pathway.
3.5 Theta and Gamma Power
Hippocampal theta and gamma rhythms have long been shown to be relevant for normal animal behavior (Winson, 1978; Chrobak et al., 1989; Axmacher et al., 2006), and pathological phenomena such as epilepsy (Pacia and Ebersole, 1997; Doose and Baier, 1988; Medvedev, 2001). However the mechanism by which brain rhythms emerge is still not fully understood. Several mechanisms have been suggested to contribute to rhythmogenesis in the hippocampus, including intrinsic neuronal resonance properties (Leung and Yu, 1998; Hutcheon and Yarom, 2000), intraregional recurrent networks of interneurons and pyramidal cells (Goutagny et al., 2009; Buzsáki and Wang, 2012), and external inputs (Buzsáki, 2002; Colom, 2006). In our model, feedback kernels incorporate both intrinsic neuronal resonant properties and intraregional recurrent connections (Kim et al., 2011). The feedforward kernels, on the other hand, represent the ability of the input region to elicit rhythms in the output region.
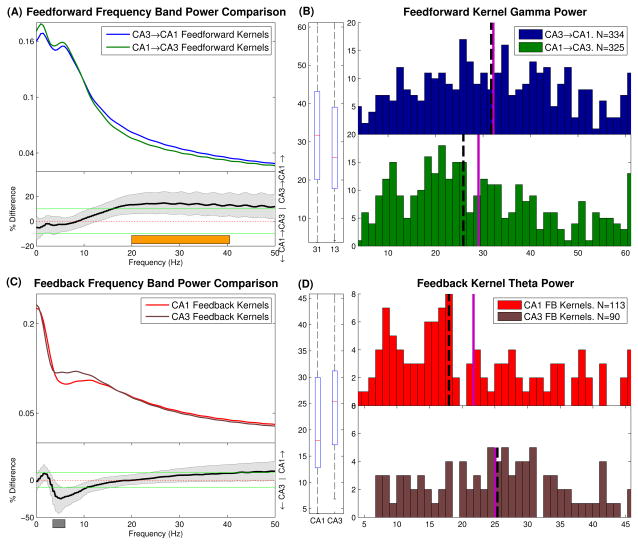
The mean band power of CA3→CA1 and CA1→CA3 feedforward and feedback kernels was calculated and compared (Fig. 11A,C). These mean band powers were found to be surprisingly similar in both directions. This may be because of common inputs to both regions which modulate the rhythmic properties of the region. For every frequency, a two sample Mann-Whitney test was used to check for significant differences. Amongst the feedforward kernels, the CA3→CA1 direction was found to have a stronger beta/low gamma rhythm (20–40Hz, +13.9%, P<.01. CI=[5.7,22]%; Fig. 11B). Amongst the feedback kernels, the CA3 cells were found to have stronger feedback theta components (4–6Hz, +23.5%, P<.01. CI=[6.4,39]%; Fig. 11D). No other significant differences were found.
Fig. 11.
Frequency power band di3erences between CA3→CA1 and CA1→CA3 models. (A) Feedforward kernels. Top: mean band power per frequency for both classes. Bottom: Mann-Whitney scale estimate and confidence bounds for every frequency in the 0–50Hz range. Positive values reflect CA3→CA1 model is greater. Differences are significant whenever confidence bounds do not include 0. Notice CA3→CA1 models have significantly greater beta/low gamma band power (20–40 Hz, indicated by orange bar). (B) Histograms and boxplot of band power values for the beta/low gamma range which are shown in A. Solid violet line and dashed black line show the mean and median of the data, respectively. The boxplot labels of 31 and 13 refer to CA3→CA1 and CA1→CA3 respectively. (C,D) Same as A,B for Feedback kernels. Notice CA3 neurons have significantly greater feedback theta components (4-6 Hz, indicated by grey bar)
4 Discussion
4.1 CA1→CA3 Influence
In this report we have shown that the model predictive power in the in-vivo rodent hippocampus from CA1 cells to CA3 cells is just as significant as the model predictive power from CA3 cells to CA1 cells. Although the predictive power of the connections was not shown to be significantly different, our analysis revealed several differences in the dynamical nature of the two pathways. On the simplest level, the CA1→CA3 pathway had slower dynamics than the CA3→CA1 pathway, which is to be expected given the longer anatomical route information takes to return from CA1 to CA3 (see Fig. 9). Further differences were revealed with PDM and frequency analysis (Fig. 10 & 11). PDM analysis in particular proved useful in seperating concurrent firing presumably caused by common inputs (PDM #1) and slower dynamics presumably caused by direct causal connections (PDMs #2 & 3).
The finding that both pathways had no significant difference in predictive power is very surprising given the tenuous anatomical connections from CA1 to CA3. This predictive capability presumably arises from the combination of direct anatomical connections from CA1 to CA3 and from common inputs into both regions (Fig. 1,12). What is clear, however, is that the classical view of hippocampal information processing, in the form of the trisynaptic pathway, may have to be revised to include return pathways that allow the possibility of CA1 having predictive power on CA3.
Fig. 12.
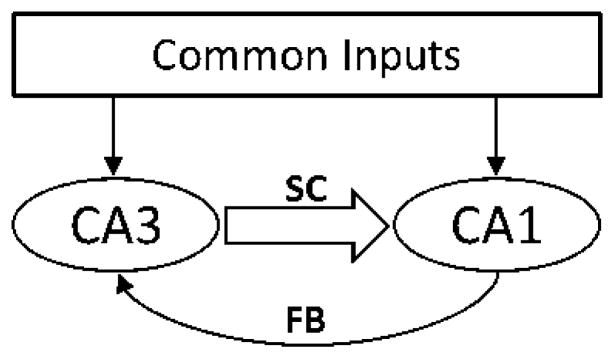
Abstract schematic of CA3 and CA1. Notice CA1 can have predictive power over CA3 via anatomical connections (labeled FB) and through common inputs which project to both regions
There exist several direct anatomical pathways by which CA1 may casually influence CA3. These connections are summarized in Fig. 1B. Interneurons which backproject directly from CA1 to CA3 have been reported (Sik et al., 1994). Furthermore, there are several routes through the entorhinal Cortex (EC) which connect CA1 to CA3. Information from CA1 may reach the EC either directly, or through the subiculum (Finch et al., 1986). From the EC, information may go back to CA3 either through the Dentate Gyrus, as in the classical trisynaptic pathway (Naylor, 2002), or directly via the temporoammonic pathway (Jones, 1993; Kloosterman et al., 2004; Ahmed and Mehta, 2009). There is evidence that multiple paths operate simultaneously (Finch et al., 1986). It should be noted that the hippocampal-entorhinal loop has been shown be fundamental for seizures in in-vitro epilepsy models (Pare et al., 1992; Stringer and Lothman, 1992; Barbarosie and Avoli, 1997; Avoli et al., 2002). In particular, ictal activity has been shown to continually oscillate through this loop, thus maintaining seizures (Pare et al., 1992). The exact role this loop plays in the in-vivo nonepileptic brain, however, remains unclear (Bragin et al., 1997).
Furthermore unobserved variables may contribute to the predictive relationship between two regions. In our case, these would take the form of common inputs to both CA3 and CA1 (although there are other possibilities, such as physical perturbation or temperature). Candidates for common inputs include the EC and the medial septum. In the case of the EC, it should be noted that EC layer II projects to CA3 while EC layer III projects to CA1. There is strong evidence to believe that there is a predictive relationship between these two layers (Kloosterman et al., 2004), which is enough to insure a predictive relationship between CA1 and CA3. The medial septum may have a particularly important role in contributing to the CA1, CA3 predictive relationship given its purported role as the ‘hippocampal pacemaker’ (Colom, 2006). It has been shown that hippocampal regions have distinct phase preferences with regards to the theta rhythm (Mizuseki et al., 2009). Although there is evidence that hippocampal subregions can generate theta rhythms in isolation (Kocsis et al., 1999; Goutagny et al., 2009), an external pacemaker input, such as the septum, may be responsible for maintaining the distinct theta phase preferences. These phase preferences can lead to a bidirectional predictive relationship between the regions.
It is likely that both direct anatomical connections and common inputs contribute to the CA1→CA3 predictive relationship; however the relative influence of each remains unknown and cannot, in principle, be inferred by simply observing (recording) the regions. The advantage of the data-driven/nonparametric modeling approach used in this study is that the kernels express the dynamics between two regions even when the underlying mechanisms responsible for the dynamics are unknown. This is because the kernels are derived directly from the data without any a priori assumptions about the dynamics. Furthermore, the kernels will not change with future discoveries (Marmarelis, 2004; Song et al., 2009b,c). It should also be noted that the 300ms memory of the kernels allows the kernels to capture much more complicated dynamics than simple synaptic transmission, which takes 2–3ms from CA3→CA1 via the Schaffer-Collateral pathway and takes anywhere from 18–45ms from CA1→CA3 via the entorhinal Cortex Deadwyler et al. (1975); Buzsáki (1989). These more complicated dynamics encapsulate the time-course of NMDA and GABA synaptic transmission (100ms, and 200–500ms, respectively; Wang (2001)), intraregional recurrent connectivity, and the afterhyperpolarization (>1s; Spruston and McBain (2007)).
4.2 Modeling Methodology
In this paper, a linear (1st order Volterra) Laguerre autoregressive model was used to describe hippocampal dynamics (Marmarelis, 2004). This linear model is differentiated from an ARMAX model by the use of the Laguerre basis expansion which reduces model parameters and the amount of data needed to estimate the model. In the past it has been demonstrated that the CA3→CA1 relationship is nonlinear, and that at least a 2nd order Volterra model is needed to describe these nonlinearities (Song et al., 2007; Zanos et al., 2008). Here, we confined ourselves to a linear model for two reasons. First, our goal was not to make the best predictive model, but only to identify predictive relationships amongst the recorded neurons. Second, linear models lend themselves more easily to interpretation via intuitive metrics such as total power and excitatory index. However, there may be nonlinear causal relationships between neurons which the linear model will not detect. For example, an input neuron may not influence the output neuron directly, but only through cross-interactions with another input neuron. This causal influence would be detected in a second order Volterra model in the form of cross-terms, but will not show up in a linear model. Thus, the number of causal connections which were found in this study serve only as a lower bound for the true number of causal connections.
4.3 Rhythms
Feedforward and feedback kernels were analyzed in the frequency domain to see whether they could shed light on how oscillations emerge within regions (via the feedback kernels) and how these oscillations spread to other regions (via the feed-forward kernels). Before discussing the results, the relationship between the kernels and rhythmogenesis should be clarified. The feedback kernels reflect the casual effects cells have on themselves. Minimally, these effects would include the after-hyperpolarization (AHP) induced in cells after action potentials. The AHP can last upto several seconds and results from the various ionic currents which restore a cell back to equilibrium potential (Spruston and McBain, 2007). It has been shown that the AHP in CA1 pyramidal cells has a theta resonance brought about by Ih channels (Leung and Yu, 1998; Pike et al., 2000). Additionally, the feedback kernels would incorporate intraregional recurrent connections between cells such as the extensive recurrent principal cell networks in CA3 (Kim et al., 2011; Li et al., 1994). The feedback kernels may also reflect interregional recurrent connections between cells, such as the connections between CA3 and the Dentate hilar region which have been suggested to give rise to theta oscillations (Buzsáki, 2002; Scharfman, 2007; Gonzalez-Sulser et al., 2011). The feedforward kernels on the other hand reflect all the physiological processes which occur between a spike in the input cell and a spike in the output cell. These minimally include axonal conductance in the input cell and synaptic integration mechanisms in the output cell. They could also include propagation via intermediate cells, such as the multisynaptic route from CA1 to CA3 via the EC. On a functional level, however, the feedforward kernels should be seen as a filter for information flow from one region to the other. Thus, the theta and delta peaks found in the feedforward kernels indicate that information packaged within theta and delta oscillations will be preferentially transferred to the adjacent region (Gloveli et al., 1997).
In our analysis it was found that CA3 feedback kernels had more theta power than CA1 feedback kernels. This supports previous experimental studies which have shown that CA3 is able to independently generate strong theta rhythms and that it projects these rhythms to CA1 (Kocsis et al., 1999; Buzsáki, 2002). Furthermore it has been shown that individual pyramidal cells and interneurons cyclically fire in a consistent phase with the theta field potential (Mizuseki et al., 2009). This is ideal for our analysis which deals exclusively with spike data from individual cells. The CA3 region has also been shown to be an independent gamma rhythm generator and to project these rhythms to CA1 (Csicsvari et al., 2003; Colgin et al., 2009). Gamma field potentials, however, are generated by the coordinated activity of interneurons and pyramidal cell ensembles and not individual pyramidal cells. Thus, while pyramidal cells may have subthreshold gamma oscillations, these are not reflected in their spiking activity since their mean firing rate is well below the gamma range (Mann and Paulsen, 2005; Buzsáki and Wang, 2012). This is presumably why there was no gamma difference in the feedback kernels, even though it is known that CA3 is a gamma generator. There was however more power in the CA3→CA1 feedforward kernels in the beta/low gamma range. This is in accordance with reports showing that gamma rhythms in CA3 may entrain beta rhythms in CA1 (Bibbig et al., 2007). The agreement of our results with previous physiological studies shows that our method can be used to detect intraregional rhythmogenesis and to probe frequency selective information flow between regions.
4.4 Potential Applications
In the past, our group has done work to implement a hippocampal cognitive prosthetic between CA3 and CA1 (Berger et al., 2005, 2012; Hampson et al., 2012a). The principal behind the prosthetic is that the predictive relationship from CA3→CA1 can be identified and CA1 neurons can be artificially stimulated to evoke their natural response, even if the direct Schaffer-Collateral connection is damaged. This essentially creates an electronic ‘neural bypass’ for the Schaffer-Collateral connection. The prosthetic was successfully developed and used to restore a rat’s performance ability during a behavioral task (Marmarelis et al., 2012; Berger et al., 2012). Given the finding that the CA1→CA3 predictive relationship is just as strong as the CA3→CA1 predictive relationship, we suggest the prosthetic idea can be extended to a CA1→CA3 prosthetic, and help restore some of the function of CA3 even when CA3 afferents are damaged.
Recurrent connections between brain regions have long been thought to be a critical component for sustaining seizures. Several studies have shown that these recurrent connections can amplify ictal activity and lead to the synchronized oscillations which characterize seizures (Wendling et al., 2002; Wendling, 2008; Bertram, 2013). In particular, several studies have directly explored the role recurrent connections between the hippocampus and entorhinal Cortex play in epilepsy (Barbarosie and Avoli, 1997; Boido et al., 2014). So far, however, there has been no attempt to create a data-based closed-loop model of this phenomenon. Such a model can potentially be used to rigorously study how ictal activity arises from recurrent connections between these regions. Furthermore, one can use such an ‘in-silico’ epilepsy model to study what effect external perturbations will have on the seizure and its associated oscillations. This is particularly relevant for deep-brain stimulation (DBS) which aims to abort seizures by perturbing the in-vivo epileptic brain. In this study we have shown that there is a recurrent connection between CA3 and CA1 and several distinctive features of these dynamics have been identified. Currently, work is underway to use our identified CA3→CA1 and CA1→CA3 dynamics as subsystems in precisely this type of closed-loop model (Sandler et al., 2013).
Supplementary Material
Acknowledgments
This work was supported by NIH grant P41-EB001978 to the Biomedical Simulations Resource at the University of Southern California and DARPA contract N66601-09-C-2081.
Contributor Information
Roman A. Sandler, Email: rsandler@usc.edu, Dept. of Biomedical Engineering, University of Southern California, DRB 367, 1042 Downey Way, Los Angeles, CA 90089, Phone: (213) 740-0342, Fax: (213) 740-0343
Dong Song, Dept. of Biomedical Engineering, University of Southern California, DRB 367, 1042 Downey Way, Los Angeles, CA 90089, Phone: (213) 740-0342, Fax: (213) 740-0343.
Robert E. Hampson, Dept. of Physiology and Pharmacology, Wake Forest School of Medicine, Winston-Salem, NC, USA
Sam A. Deadwyler, Dept. of Physiology and Pharmacology, Wake Forest School of Medicine, Winston-Salem, NC, USA
Theodore W. Berger, Dept. of Biomedical Engineering, University of Southern California, DRB 367, 1042 Downey Way, Los Angeles, CA 90089, Phone: (213) 740-0342, Fax: (213) 740-0343
Vasilis Z. Marmarelis, Dept. of Biomedical Engineering, University of Southern California, DRB 367, 1042 Downey Way, Los Angeles, CA 90089, Phone: (213) 740-0342, Fax: (213) 740-0343
References
- Ahmed Omar J, Mehta Mayank R. The hippocampal rate code: anatomy, physiology and theory. Trends in neurosciences. 2009;32(6):329–338. doi: 10.1016/j.tins.2009.01.009. [DOI] [PMC free article] [PubMed] [Google Scholar]
- Avoli Massimo, DAntuono Margherita, Louvel Jacques, Köhling Rüdiger, Biagini Giuseppe, Pumain René, DArcangelo Giovanna, Tancredi Virginia. Network and pharmacological mechanisms leading to epileptiform synchronization in the limbic system in vitro. Progress in neurobiology. 2002;68(3):167–207. doi: 10.1016/s0301-0082(02)00077-1. [DOI] [PubMed] [Google Scholar]
- Axmacher Nikolai, Mormann Florian, Fernández Guillen, Elger Christian E, Fell Juergen. Memory formation by neuronal synchronization. Brain research reviews. 2006;52(1):170–182. doi: 10.1016/j.brainresrev.2006.01.007. [DOI] [PubMed] [Google Scholar]
- Barbarosie Michaela, Avoli Massimo. Ca3-driven hippocampal-entorhinal loop controls rather than sustains in vitro limbic seizures. The Journal of neuroscience. 1997;17(23):9308–9314. doi: 10.1523/JNEUROSCI.17-23-09308.1997. [DOI] [PMC free article] [PubMed] [Google Scholar]
- Berger Theodore W, Ahuja Ashish, Courellis Spiros H, Deadwyler Samuel A, Erinjippurath Gopal, Gerhardt Gregory A, Gholmieh Ghassan, Granacki John J, Hampson Robert, Hsaio Min Chi, et al. Restoring lost cognitive function. Engineering in Medicine and Biology Magazine, IEEE. 2005;24(5):30–44. doi: 10.1109/memb.2005.1511498. [DOI] [PubMed] [Google Scholar]
- Berger Theodore W, Song Dong, Chan Rosa HM, Marmarelis Vasilis Z, LaCoss Jeff, Wills Jack, Hampson Robert E, Deadwyler Sam A, Granacki John J. A hippocampal cognitive prosthesis: multi-input, multi-output nonlinear modeling and vlsi implementation. Neural Systems and Rehabilitation Engineering, IEEE Transactions on. 2012;20(2):198–211. doi: 10.1109/TNSRE.2012.2189133. [DOI] [PMC free article] [PubMed] [Google Scholar]
- Berry Stephen D, Thompson Richard F. Prediction of learning rate from the hippocampal electroencephalogram. Science. 1978;200(4347):1298–1300. doi: 10.1126/science.663612. [DOI] [PubMed] [Google Scholar]
- Bertram Edward H. Neuronal circuits in epilepsy: Do they matter? Experimental neurology. 2013;244:67–74. doi: 10.1016/j.expneurol.2012.01.028. [DOI] [PMC free article] [PubMed] [Google Scholar]
- Bibbig Andrea, Middleton Steven, Racca Claudia, Gillies Martin J, Garner Helen, LeBeau Fiona EN, Davies Ceri H, Whittington Miles A. Beta rhythms (15–20 hz) generated by nonreciprocal communication in hippocampus. Journal of neurophysiology. 2007;97(4):2812–2823. doi: 10.1152/jn.01105.2006. [DOI] [PubMed] [Google Scholar]
- Boido Davide, Jesuthasan Nithiya, de Curtis Marco, Uva Laura. Network dynamics during the progression of seizure-like events in the hippocampal– parahippocampal regions. Cerebral Cortex. 2014;24(1):163–173. doi: 10.1093/cercor/bhs298. [DOI] [PubMed] [Google Scholar]
- Bragin A, Csicsvari J, Penttonen M, Buzsaki G. Epileptic afterdischarge in the hippocampal–entorhinal system: current source density and unit studies. Neuroscience. 1997;76(4):1187–1203. doi: 10.1016/s0306-4522(96)00446-0. [DOI] [PubMed] [Google Scholar]
- Buzsáki Gy. Two-stage model of memory trace formation: a role for noisy brain states. Neuroscience. 1989;31(3):551–570. doi: 10.1016/0306-4522(89)90423-5. [DOI] [PubMed] [Google Scholar]
- Buzsáki György. Theta oscillations in the hippocampus. Neuron. 2002;33(3):325–340. doi: 10.1016/s0896-6273(02)00586-x. [DOI] [PubMed] [Google Scholar]
- Buzsáki György, Wang Xiao-Jing. Mechanisms of gamma oscillations. Annual review of neuroscience. 2012;35:203–225. doi: 10.1146/annurev-neuro-062111-150444. [DOI] [PMC free article] [PubMed] [Google Scholar]
- Chrobak James J, Stackman Robert W, Walsh Thomas J. Intraseptal administration of muscimol produces dose-dependent memory impairments in the rat. Behavioral and neural biology. 1989;52(3):357–369. doi: 10.1016/s0163-1047(89)90472-x. [DOI] [PubMed] [Google Scholar]
- Colgin Laura Lee, Denninger Tobias, Fyhn Marianne, Hafting Torkel, Bonnevie Tora, Jensen Ole, Moser May-Britt, Moser Edvard I. Frequency of gamma oscillations routes flow of information in the hippocampus. Nature. 2009;462(7271):353–357. doi: 10.1038/nature08573. [DOI] [PubMed] [Google Scholar]
- Colom Luis V. Septal networks: relevance to theta rhythm, epilepsy and alzheimer’s disease. Journal of neurochemistry. 2006;96(3):609–623. doi: 10.1111/j.1471-4159.2005.03630.x. [DOI] [PubMed] [Google Scholar]
- Craig Sarah, Commins Sean. Interaction between paired-pulse facilitation and long-term potentiation in the projection from hippocampal area ca1 to the entorhinal cortex. Neuroscience research. 2005;53(2):140–146. doi: 10.1016/j.neures.2005.06.009. [DOI] [PubMed] [Google Scholar]
- Csicsvari Jozsef, Jamieson Brian, Wise Kensall D, Buzsáki György. Mechanisms of gamma oscillations in the hippocampus of the behaving rat. Neuron. 2003;37(2):311–322. doi: 10.1016/s0896-6273(02)01169-8. [DOI] [PubMed] [Google Scholar]
- Deadwyler Sam A, West James R, Cotman Carl W, Lynch Gary. Physiological studies of the reciprocal connections between the hippocampus and entorhinal cortex. Experimental neurology. 1975;49(1):35–57. doi: 10.1016/0014-4886(75)90194-6. [DOI] [PubMed] [Google Scholar]
- Doose Hermann, Baier Wolfgang K. Theta rhythms in the eeg: a genetic trait in childhood epilepsy. Brain and Development. 1988;10(6):347–354. doi: 10.1016/s0387-7604(88)80091-3. [DOI] [PubMed] [Google Scholar]
- Finch David M, Wong Ernest E, Derian Edie L, Babb Thomas L. Neurophysiology of limbic system pathways in the rat: projections from the subicular complex and hippocampus to the entorhinal cortex. Brain research. 1986;397(2):205–213. doi: 10.1016/0006-8993(86)90621-9. [DOI] [PubMed] [Google Scholar]
- Fuster Joaquin M. Cortical dynamics of memory. International Journal of Psychophysiology. 2000;35(2):155–164. doi: 10.1016/s0167-8760(99)00050-1. [DOI] [PubMed] [Google Scholar]
- Gloveli Tengis, Schmitz Dietmar, Empson Ruth M, Heinemann Uwe. Frequency-dependent information flow from the entorhinal cortex to the hippocampus. Journal of neurophysiology. 1997;78(6):3444–3449. doi: 10.1152/jn.1997.78.6.3444. [DOI] [PubMed] [Google Scholar]
- Gonzalez-Sulser Alfredo, Wang Jing, Motamedi Gholam K, Avoli Massimo, Vicini Stefano, Dzakpasu Rhonda. The 4-aminopyridine< i> in vitro</i> epilepsy model analyzed with a perforated multi-electrode array. Neuropharmacology. 2011;60(7):1142–1153. doi: 10.1016/j.neuropharm.2010.10.007. [DOI] [PMC free article] [PubMed] [Google Scholar]
- Goonawardena Anushka V, Robinson Lianne, Hampson Robert E, Riedel Gernot. Cannabinoid and cholinergic systems interact during performance of a short-term memory task in the rat. Learning & Memory. 2010;17(10):502–511. doi: 10.1101/lm.1893710. [DOI] [PMC free article] [PubMed] [Google Scholar]
- Goutagny Romain, Jackson Jesse, Williams Sylvain. Self-generated theta oscillations in the hippocampus. Nature neuroscience. 2009;12(12) doi: 10.1038/nn.2440. [DOI] [PubMed] [Google Scholar]
- Hampson Robert E, Simeral John D, Deadwyler Sam A. Distribution of spatial and nonspatial information in dorsal hippocampus. Nature. 1999;402(6762):610–614. doi: 10.1038/45154. [DOI] [PubMed] [Google Scholar]
- Hampson Robert E, Gerhardt Greg A, Marmarelis Vasilis, Song Dong, Opris Ioan, Santos Lucas, Berger Theodore W, Deadwyler Sam A. Facilitation and restoration of cognitive function in primate prefrontal cortex by a neuroprosthesis that utilizes minicolumn-specific neural firing. Journal of neural engineering. 2012a;9(5):056012. doi: 10.1088/1741-2560/9/5/056012. [DOI] [PMC free article] [PubMed] [Google Scholar]
- Hampson Robert E, Song Dong, Chan Rosa HM, Sweatt Andrew J, Riley Mitchell R, Goonawardena Anushka V, Marmarelis Vasilis Z, Gerhardt Greg A, Berger Theodore W, Deadwyler Sam A. Closing the loop for memory prosthesis: Detecting the role of hippocampal neural ensembles using nonlinear models. Neural Systems and Rehabilitation Engineering, IEEE Transactions on. 2012b;20(4):510–525. doi: 10.1109/TNSRE.2012.2190942. [DOI] [PMC free article] [PubMed] [Google Scholar]
- Hanley James A, McNeil Barbara J. The meaning and use of the area under a receiver operating characteristic (roc) curve. Radiology. 1982:29–36. doi: 10.1148/radiology.143.1.7063747. [DOI] [PubMed] [Google Scholar]
- Higgins James J. Intoruction to Modern Nonparametric Statistics. 2003 [Google Scholar]
- Hutcheon Bruce, Yarom Yosef. Resonance, oscillation and the intrinsic frequency preferences of neurons. Trends in neurosciences. 2000;23(5):216–222. doi: 10.1016/s0166-2236(00)01547-2. [DOI] [PubMed] [Google Scholar]
- Jones Roland SG. Entorhinal-hippocampal connections: a speculative view of their function. Trends in neurosciences. 1993;16(2):58–64. doi: 10.1016/0166-2236(93)90018-h. [DOI] [PubMed] [Google Scholar]
- Kim Sanggyun, Putrino David, Ghosh Soumya, Brown Emery N. A granger causality measure for point process models of ensemble neural spiking activity. PLoS computational biology. 2011;7(3):e1001110. doi: 10.1371/journal.pcbi.1001110. [DOI] [PMC free article] [PubMed] [Google Scholar]
- Kloosterman Fabian, van Haeften Theo, Lopes da Silva Fernando H. Two reentrant pathways in the hippocampal-entorhinal system. Hippocampus. 2004;14(8):1026–1039. doi: 10.1002/hipo.20022. [DOI] [PubMed] [Google Scholar]
- Kocsis Bernat, Bragin Anatol, Buzsáki György. Interdependence of multiple theta generators in the hippocampus: a partial coherence analysis. The Journal of neuroscience. 1999;19(14):6200–6212. doi: 10.1523/JNEUROSCI.19-14-06200.1999. [DOI] [PMC free article] [PubMed] [Google Scholar]
- Leung L Stan, Yu Hui-Wen. Theta-frequency resonance in hippocampal ca1 neurons in vitro demonstrated by sinusoidal current injection. Journal of neurophysiology. 1998;79(3):1592–1596. doi: 10.1152/jn.1998.79.3.1592. [DOI] [PubMed] [Google Scholar]
- Li X-G, Somogyi P, Ylinen A, Buzsaki G. The hippocampal ca3 network: an in vivo intracellular labeling study. Journal of Comparative Neurology. 1994;339(2):181–208. doi: 10.1002/cne.903390204. [DOI] [PubMed] [Google Scholar]
- Lu Ude, Song Dong, Berger Theodore W. Nonlinear dynamic modeling of synaptically driven single hippocampal neuron intracellular activity. Biomedical Engineering, IEEE Transactions on. 2011;58(5):1303–1313. doi: 10.1109/TBME.2011.2105870. [DOI] [PMC free article] [PubMed] [Google Scholar]
- Mann Edward O, Paulsen Ole. Mechanisms underlying gamma (40hz) network oscillations in the hippocampusa mini-review. Progress in biophysics and molecular biology. 2005;87(1):67–76. doi: 10.1016/j.pbiomolbio.2004.06.004. [DOI] [PubMed] [Google Scholar]
- Marmarelis Vasilis Z. Nonlinear dynamic modeling of physiological systems. Wiley-Interscience; 2004. [Google Scholar]
- Marmarelis Vasilis Z, Shin Dae C, Song Dong, Hampson Robert E, Deadwyler Sam A, Berger Theodore W. Nonlinear modeling of dynamic interactions within neuronal ensembles using principal dynamic modes. Journal of computational neuroscience. 2013;34(1):73–87. doi: 10.1007/s10827-012-0407-7. [DOI] [PMC free article] [PubMed] [Google Scholar]
- Marmarelis Vasilis Z, Shin Dae C, Song Dong, Hampson Robert E, Deadwyler Sam A, Berger Theodore W. On parsing the neural code in the prefrontal cortex of primates using principal dynamic modes. Journal of computational neuroscience. 2014;36(3):321–337. doi: 10.1007/s10827-013-0475-3. [DOI] [PMC free article] [PubMed] [Google Scholar]
- Marmarelis VZ, Orme ME. Modeling of neural systems by use of neuronal modes. Biomedical Engineering, IEEE Transactions on. 1993;40(11):1149–1158. doi: 10.1109/10.245633. [DOI] [PubMed] [Google Scholar]
- Marmarelis VZ, Shin DC, Hampson RE, Deadwyler SA, Song D, Berger TW. Design of optimal stimulation patterns for neuronal ensembles based on volterra-type hierarchical modeling. Journal of neural engineering. 2012;9(6):066003. doi: 10.1088/1741-2560/9/6/066003. [DOI] [PMC free article] [PubMed] [Google Scholar]
- Medvedev AV. Temporal binding at gamma frequencies in the brain: paving the way to epilepsy? Australasian Physics & Engineering Sciences in Medicine. 2001;24(1):37–48. doi: 10.1007/BF03178284. [DOI] [PubMed] [Google Scholar]
- Mizuseki Kenji, Sirota Anton, Pastalkova Eva, Buzsáki György. Theta oscillations provide temporal windows for local circuit computation in the entorhinal-hippocampal loop. Neuron. 2009;64(2):267–280. doi: 10.1016/j.neuron.2009.08.037. [DOI] [PMC free article] [PubMed] [Google Scholar]
- Nagao T, Alonso A, Avoli M. Epileptiform activity induced by pilocarpine in the rat hippocampal-entorhinal slice preparation. Neuroscience. 1996;72(2):399–408. doi: 10.1016/0306-4522(95)00534-x. [DOI] [PubMed] [Google Scholar]
- Naylor David. Changes in nonlinear signal processing in rat hippocampus associated with loss of paired-pulse inhibition or epileptogenesis. Epilepsia. 2002;43(s5):188–193. doi: 10.1046/j.1528-1157.43.s.5.37.x. [DOI] [PubMed] [Google Scholar]
- Pacia Steven V, Ebersole John S. Intracranial eeg substrates of scalp ictal patterns from temporal lobe foci. Epilepsia. 1997;38(6):642–654. doi: 10.1111/j.1528-1157.1997.tb01233.x. [DOI] [PubMed] [Google Scholar]
- Pare D, Llinas R, et al. Role of the hippocampal-entorhinal loop in temporal lobe epilepsy: extra-and intracellular study in the isolated guinea pig brain in vitro. The Journal of neuroscience. 1992;12(5):1867–1881. doi: 10.1523/JNEUROSCI.12-05-01867.1992. [DOI] [PMC free article] [PubMed] [Google Scholar]
- Pike Fenella G, Goddard Ruth S, Suckling Jillian M, Ganter Paul, Kasthuri Narayanan, Paulsen Ole. Distinct frequency preferences of different types of rat hippocampal neurones in response to oscillatory input currents. The Journal of Physiology. 2000;529(1):205–213. doi: 10.1111/j.1469-7793.2000.00205.x. [DOI] [PMC free article] [PubMed] [Google Scholar]
- Sandler R, Shin DC, Song D, Hampson RE, Deadwyler SA, Berger TW, Marmarelis VZ. Closed-loop modeling of the hippocampus and design of neurostimulation patterns for suppressing seizures. Neural Engineering (NER), 2013 6th International IEEE/EMBS Conference on; IEEE; 2013. pp. 1143–1146. [Google Scholar]
- Sandler Roman, Song Dong, Hampson Robert E, Deadwyler Sam A, Berger Theodore, Marmarelis Vasilis. Probability-based nonlinear modeling of neural dynamical systems with point-process inputs and outputs. BMC Neuroscience. 2014;15(Suppl 1):P102. [Google Scholar]
- Scharfman Helen E. The ca3 backprojection to the dentate gyrus. Progress in brain research. 2007;163:627–637. doi: 10.1016/S0079-6123(07)63034-9. [DOI] [PMC free article] [PubMed] [Google Scholar]
- Sik Attila, Ylinen Aarne, Penttonen Markku, Buzsaki Gyorgy. Inhibitory ca1-ca3-hilar region feedback in the hippocampus. Science. 1994;265(5179):1722–1724. doi: 10.1126/science.8085161. [DOI] [PubMed] [Google Scholar]
- Song Dong, Chan Rosa HM, Marmarelis Vasilis Z, Hampson Robert E, Deadwyler Sam A, Berger Theodore W. Nonlinear dynamic modeling of spike train transformations for hippocampal-cortical prostheses. Biomedical Engineering, IEEE Transactions on. 2007;54(6):1053–1066. doi: 10.1109/TBME.2007.891948. [DOI] [PubMed] [Google Scholar]
- Song Dong, Chan Rosa HM, Marmarelis Vasilis Z, Hampson Robert E, Deadwyler Sam A, Berger Theodore W. Nonlinear modeling of neural population dynamics for hippocampal prostheses. Neural Networks. 2009a;22(9):1340–1351. doi: 10.1016/j.neunet.2009.05.004. [DOI] [PMC free article] [PubMed] [Google Scholar]
- Song Dong, Marmarelis Vasilis Z, Berger Theodore W. Parametric and non-parametric modeling of short-term synaptic plasticity. part i: Computational study. Journal of computational neuroscience. 2009b;26(1):1–19. doi: 10.1007/s10827-008-0097-3. [DOI] [PMC free article] [PubMed] [Google Scholar]
- Song Dong, Wang Zhuo, Marmarelis Vasilis Z, Berger Theodore W. Parametric and non-parametric modeling of short-term synaptic plasticity. part ii: Experimental study. Journal of computational neuroscience. 2009c;26(1):21–37. doi: 10.1007/s10827-008-0098-2. [DOI] [PMC free article] [PubMed] [Google Scholar]
- Spruston N, McBain C. Structural and functional properties of hippocampal neurons. The hippocampus book. 2007:133–201. [Google Scholar]
- Staubli U, Xu Fang Bo. Effects of 5-ht3 receptor antagonism on hippocampal theta rhythm, memory, and ltp induction in the freely moving rat. The Journal of neuroscience. 1995;15(3):2445–2452. doi: 10.1523/JNEUROSCI.15-03-02445.1995. [DOI] [PMC free article] [PubMed] [Google Scholar]
- Stringer Janet L, Lothman Eric W. Reverberatory seizure discharges in hippocampal-parahippocampal circuits. Experimental neurology. 1992;116(2):198–203. doi: 10.1016/0014-4886(92)90168-p. [DOI] [PubMed] [Google Scholar]
- Tamamaki Nobuaki, Nojyo Yoshiaki. Preservation of topography in the connections between the subiculum, field ca1, and the entorhinal cortex in rats. Journal of Comparative Neurology. 1995;353(3):379–390. doi: 10.1002/cne.903530306. [DOI] [PubMed] [Google Scholar]
- van Rossum Mark CW. A novel spike distance. Neural Computation. 2001;13(4):751–763. doi: 10.1162/089976601300014321. [DOI] [PubMed] [Google Scholar]
- Victor Jonathan D, Purpura Keith P. Metric-space analysis of spike trains: theory, algorithms and application. Network: computation in neural systems. 1997;8(2):127–164. [Google Scholar]
- Wang Xiao-Jing. Synaptic reverberation underlying mnemonic persistent activity. Trends in neurosciences. 2001;24(8):455–463. doi: 10.1016/s0166-2236(00)01868-3. [DOI] [PubMed] [Google Scholar]
- Wendling F, Bartolomei F, Bellanger JJ, Chauvel P. Epileptic fast activity can be explained by a model of impaired gabaergic dendritic inhibition. European Journal of Neuroscience. 2002;15(9):1499–1508. doi: 10.1046/j.1460-9568.2002.01985.x. [DOI] [PubMed] [Google Scholar]
- Wendling Fabrice. Computational models of epileptic activity: a bridge between observation and pathophysiological interpretation. 2008 doi: 10.1586/14737175.8.6.889. [DOI] [PMC free article] [PubMed] [Google Scholar]
- Wiebe Sherman P, Stäubli Ursula V. Recognition memory correlates of hippocampal theta cells. The Journal of Neuroscience. 2001;21(11):3955–3967. doi: 10.1523/JNEUROSCI.21-11-03955.2001. [DOI] [PMC free article] [PubMed] [Google Scholar]
- Winson Jonathan. Loss of hippocampal theta rhythm results in spatial memory deficit in the rat. Science. 1978;201(4351):160–163. doi: 10.1126/science.663646. [DOI] [PubMed] [Google Scholar]
- Wu Kun, Canning Kevin J, Leung L Stan. Functional interconnections between ca3 and the dentate gyrus revealed by current source density analysis. Hippocampus. 1998;8(3):217–230. doi: 10.1002/(SICI)1098-1063(1998)8:3<217::AID-HIPO5>3.0.CO;2-G. [DOI] [PubMed] [Google Scholar]
- Zanos Theodoros P, Courellis Spiros H, Berger Theodore W, Hampson Robert E, Deadwyler Sam A, Marmarelis Vasilis Z. Nonlinear modeling of causal interrelationships in neuronal ensembles. Neural Systems and Rehabilitation Engineering, IEEE Transactions on. 2008;16(4):336–352. doi: 10.1109/TNSRE.2008.926716. [DOI] [PMC free article] [PubMed] [Google Scholar]
Associated Data
This section collects any data citations, data availability statements, or supplementary materials included in this article.


