

Abstract
Obesity-linked insulin resistance is a major precursor to the development of type 2 diabetes. Previous work has shown that phosphorylation of PPARγ at serine 273 by Cdk5 stimulates diabetogenic gene expression in adipose tissues1. Inhibition of this modification is a key therapeutic mechanism for anti-diabetic PPARγ ligand drugs, such as the thiazolidinediones and PPARγ partial/non-agonists2. To better understand the importance of this obesity-linked PPARγ phosphorylation, we created mice that ablated Cdk5 specifically in adipose tissues. Surprisingly, these mice have both a paradoxical increase in PPARγ phosphorylation at S273 and worsened insulin resistance. Unbiased proteomic studies show that ERK kinases are activated in these KO animals. We show here that ERK directly phosphorylates S273 of PPARγ in a robust manner and that Cdk5 suppresses ERKs through direct action on a novel site in MEK, the ERK kinase. Importantly, pharmacological MEK and ERK inhibition markedly improves insulin resistance in both obese wild type and ob/ob mice, and also completely reverses the deleterious effects of the Cdk5 ablation. These data show that an ERK/Cdk5 axis controls PPARγ function and suggest that MEK/ERK inhibitors may hold promise for the treatment of type 2 diabetes.
Obesity is characterized by dysfunctional adipose tissues in which failure to appropriately store excess energy leads to ectopic lipid deposition, progressive insulin resistance and heightened risk for type 2 diabetes. Disordered secretion of certain fat-derived hormones, called adipokines, also contributes to the metabolic dysfunction in obesity and diabetes. Adipose tissue-directed insulin-sensitizing drugs, including the thiazolidinediones, potently improve whole body insulin sensitivity3. The thiazolidinedione drugs have two distinct functions as ligands for PPARγ: they promote the differentiation of preadipocytes4,5 and they block phosphorylation of PPARγ at serine 2731. We recently demonstrated that non-agonist PPARγ ligands capable of blocking PPARγ S273 phosphorylation retain potent anti-diabetic effects despite the inability to promote adipogenesis2. These findings strongly suggested that obesity-mediated phosphorylation of PPARγ S273 may not only correlate positively with the development of insulin resistance but may be causal to this state as well.
A variety of protein kinases participate in insulin action and insulin resistance. Insulin signaling activates the Akt/PI3K and the Grb2/Ras/MEK/ERK kinase cascades6,7. While much is known about the role of the former in promoting the canonical anabolic actions of insulin, studies in vitro had suggested that the latter cascade downstream of insulin signaling could contribute to insulin resistance8,9, although controversy exists on this point10. Obese rodents were shown to have elevated ERK activity while mice lacking ERK1 were shown to be more sensitive to the effects of insulin9,11,12
Cyclin-dependent kinase 5 (Cdk5) function is both necessary and sufficient in cultured adipocytes to phosphorylate PPARγ at serine 2731. Mice with global or brain-restricted deletion of Cdk5 exhibit increased perinatal mortality due to either a defect in neurogenesis. We thus set out to test whether modulation of PPARγ phosphorylation at S273 in adipose tissues would lead to altered insulin sensitivity in vivo by creating adipose-selective Cdk5-deficient mice (Cdk5-FKO)13,14. In contrast to global knockouts15,16, Cdk5-FKO mice are grossly normal in appearance with no apparent differences in body weight or fasting glucose levels when maintained on a standard diet (ED 1). Deletion of Cdk5 in whole white adipose tissue was confirmed by both western blot analysis (Fig 1a) and quantitative real-time PCR (Fig. 1b). To determine whether the residual Cdk5 expression in the KOs was emanating from non-adipocytes or from incomplete recombination, tissue fractionation was performed; no detectable Cdk5 protein was observed in the floating adipocyte fraction, while residual signal was observed in the stromal vascular fraction (Fig 1c). On a standard chow diet, FKO mice were normal, healthy and indistinguishable from Cdk5Flox/Flox controls (ED 1).
Figure 1.

Insulin resistance following Cdk5 deletion in adipocytes. (a) Deletion of Cdk5 in epididymal white adipose tissue from Control (Cdk5Flox/Flox) or adipocyte-specific knockout, KO (Cdk5Flox/Flox::adiponectin-Cre) was confirmed by western blotting or (b) q-RTPCR. n = 5. (c) Fractionated adipose tissue confirmed deletion was confined to the adipocyte fraction of adipose tissue. (d) Body weight of control or KO mice when maintained on a high fat diet (HFD). n = 20 Ctl, 25 KO. (e) Fasting glucose (f) and fasting insulin in mice maintained on a HFD. n = 10 Ctl, 12 KO. (g) Glucose tolerance test and (h) insulin tolerance tests are consistent with impaired insulin sensitivity. n = 15 Ctl, 17 KO. (i) Western blots of white adipose tissue for pS273 PPARγ in control and KO mice quantified in (j). Error bars ± SEM. * p < 0.05, ** p < 0.01, *** p < 0.001.
Both PPARγ S273 phosphorylation and insulin resistance are strongly promoted by obesity and inflammatory cytokines1. When maintained on a high fat diet to induce obesity, no differences were observed between WT and FKO groups in food intake, energy expenditure or body weight (Fig. 1d and ED 2). Paradoxically, metabolic analyses of these Cdk5-FKO mice demonstrated that they had impaired glucose homeostasis compared to control animals. Cdk5-FKO mice exhibited elevated fasting insulin levels, as well as impairment in insulin tolerance, with a trend towards impaired glucose tolerance (Fig. 1e–h, Fig. 4a). Most unexpectedly, we also observed a paradoxical increase in S273 PPARγ phosphorylation in obese Cdk5-FKO mice, strongly suggesting compensation from an alternate protein kinase (Fig. 1i, j).
Figure 4.

Metabolic consequences of MEK inhibition in vivo, HFD mice. (a) Glucose tolerance tests of HFD fed adipose-specific Cdk5-FKO mice or controls following treatment with vehicle or (b) MEK inhibitor PD0325901 (c) area under the curve. n = 10 for WT vehicle, KO vehicle, and KO PD groups. n = 9 for the WT PD group. (d) Insulin tolerance tests (n = 12 Ctl, 11 KO) or (e–j) hyperinsulinemic euglycemic clamps in HFD fed wild-type C57Bl/6 mice following treatment with PD0325901. (e) Glucose infusion rate (GIR) (f) whole-body glucose uptake/disposal (g) 3H-2-deoxy-glucose (2DG) tracer uptake into epididymal white adipose tissue (h) or gastrocnemius. (i) Percent suppression of endogenous glucose production (EGP). (j) Percent suppression of free fatty acids (FFA). n = 9 vehicle, 11 PD. (k) ERK phosphorylation in white adipose tissue from WT C57Bl6/J or ob/ob mice. (l) Glucose tolerance test in ob/ob mice following treatment with MEK inhibitor GSK1120212 or vehicle. (m) Fasting insulin values. (n) Plasma adiponectin levels and (o) body weight. (n = 8). (p–r) Gene expression in ob/ob white epididymal WAT following treatment with vehicle or either of two MEK inhibitors, PD0325901 or GSK1120212 (n = 7, 7, 8 respectively). (p) Genes responsive to PPARγ S273 phosphorylation, (q) genes responsive to PPARγ agonism, and (r) genes controlling “browning” of white adipose tissue and thermogenesis. (s) Phosphorylation of PPARγ in epididymal WAT in ob/ob mice after treatment with MEK inhibitors. Error bars ± SEM. * p < 0.05, ** p < 0.01, *** p < 0.001.
To understand how PPARγ S273 phosphorylation is increased in the absence of Cdk5, unbiased quantitative proteomic kinase profiling was performed on white adipose tissue (Fig. 2a). The most enriched protein kinase-derived peptide in knockouts, (VADPDHDHTGFLTEpY185VATR), corresponded to the activation loop of MAP kinase, ERK2/Mapk1 (Fig. 2b). We independently confirmed that ERK2 was activated in adipose tissue extracts from the FKO mice by examining phosphorylation of ERK2 at T183/Y185 using phospho-specific antibodies against ERKs (Fig. 2c). We found no significant differences in activation of alternative obesity-linked kinases (ED 3). In addition, elevated T183/Y185 ERK phosphorylation was observed in adipocytes from Cdk5-FKO mice that were differentiated for 8 days in vitro, suggesting that this phenomenon is cell-autonomous (Fig. 2d). A small molecule inhibitor of Cdk5, roscovitine17, also promotes ERK phosphorylation in cultured adipocytes, although here the competing inhibition of Cdk5 and activation of ERK had a net effect of leaving PPARγ S273 phosphorylation unchanged (Fig. 2e).
Figure 2.

Identification and characterization of ERK as a S273 PPARγ kinase. (a) ATP probe enriched phosphoproteomic analysis of kinases in control or Cdk5-FKO adipose tissue from mice on a HFD. Heat map indicating the most highly regulated phosphopeptide between control and Cdk5 KO (n = 3 per group, p=0.08) corresponds to the activation loop of ERK2 Mapk1/ERK2. (b) Normalized quantification of the abundance of the phosphopeptide and total abundance corresponding to the activation loop of ERK2 by mass spectrometry. (c) Western blot of ERK1 and 2 phosphorylation in brown adipose tissue from mice on a HFD. (d) Western blot of phospho-ERK1/2 in primary adipocytes differentiated in vitro for 8 days and serum starved for 18 hrs. (e) Inhibition of Cdk5 by 6 hr treatment of roscovitine in cultured F442A adipocytes at the indicated dose. (f) HEK 293 cells expressing wild type or an analogue sensitive (AS) mutant of Cdk5 were treated with the AS-specific inhibitor 1NMPP1 at 0, 0.1, 1.0 or 10 μM for 2 hr. (g) Cultured adipocytes stably expressing Cdk5-AS treated with the indicated dose of 1NMPP1. (h) PPARγ co-transfected with increasing doses of constitutively active ERK2 kinase (ERK-CA) or active Cdk5 (Cdk5 with p35). Western blotting was performed for both pS273 PPARγ and total PPARγ. (i) Phosphorylated residues identified by LC-MS/MS following in vitro kinase assay of recombinant Cdk5, ERK2, or MEK2 incubated with full length recombinant PPARγ. (j) In vitro ERK kinase assay with incubated with full length recombinant PPARγ and increasing doses of pioglitazone before western blotting for pS273 and total PPARγ. Error bars ± SEM.
Since even the best available inhibitors of Cdk5, like roscovitine, are not completely specific for Cdk517,18, we also utilized a more precise means of regulating this kinase: an allele of Cdk5 specifically designed to be inhibited by the “bulky” small molecule, 1NMPP1. Using this previously validated approach19,20, a dose-dependent increase of ERK phosphorylation was observed following Cdk5 inhibition with 1NMPP1, in both fibroblasts and cultured adipocytes (Fig. 2f–g). Thus, we observed elevated levels of an activating ERK phosphorylation as a consequence of Cdk5 loss in vivo or ex vivo.
We next investigated whether ERK kinase might be capable of directly compensating for Cdk5 deficiency in the phosphorylation of PPARγ. ERK and Cdk5 are structurally similar Ser/Thr kinases with a propensity for phosphorylating sites with proline in the +1 position21. In cultured cells, both constitutively active ERK (ERK-CA) and active Cdk5 (Cdk5 and its activating subunit, p35) phosphorylated PPARγ at S273 (Fig. 2h). We confirmed that this was a direct effect by performing in vitro protein kinase assays on recombinant full length PPARγ. Both ERK2 and Cdk5 resulted in the direct phosphorylation of S273 PPARγ but a third kinase, MEK2 failed to phosphorylate this site (Fig. 2i). Notably, Cdk5 and ERK both phosphorylated the Ser-Pro sites S273 and S112 (Fig 2i). ERK action on S112 has been reported previously by us and others22–24. A novel Cdk5-specific target site at T296 was also identified. In contrast, both ERK and MEK phosphorylated PPARγ at only one common site, S133. As TZDs can block the ability of CDK5 to phosphorylate S273 PPARγ1, we sought to determine whether TZDs would similarly block the action of ERKs. ERK phosphorylates both S112 and S273, but increasing concentrations of pioglitazone block phosphorylation only at S273 (Fig. 2j).
To determine how Cdk5 might be regulating ERK, we again turned to ATP probes and quantitative proteomics to identify Cdk5 substrates. Cdk5-deficient adipose tissue extracts were spiked with increasing doses of recombinant active Cdk5 kinase, plus p35 (Fig. 3a). MEK2, the kinase upstream of ERK, was identified as the protein with the single greatest dose-dependent increase in phosphorylation (Fig. 3b). The phosphopeptide identified contained two closely spaced potential phospho-threonine sites at T395 and T397 of murine MEK2. Although Cdk5 has been reported to regulate MEK1 at T286, this site is not conserved in MEK2 (ED 4)25. The function of these two MEK2 sites (T395 and T397), has not been previously reported, yet they are the most frequently found MEK2 modifications in the proteomic databases outside of the canonical activation loop26.
Figure 3.

Regulation of MEK2 by Cdk5. (a) ATP probe phosphoproteomic analysis of activated kinases in Cdk5-FKO adipose tissue lysates following addition of recombinant active Cdk5 and p35 protein at the indicated dose. (b) The most highly regulated peptide includes MEK2 residues T395 and T397. (c) HEK 293 cells expressing AS mutant of Cdk5 were treated with the AS-specific inhibitor 1NMPP1 at 0, 0.1 1.0 or 10 μM for 2 hr before western blotting for MEK2 phospho-T395. (d) IP in vitro Kinase assay of MEK2-WT or T395A T397 (MEK2-AA) mutant. Flag-tagged WT-MEK2 or constitutively active CA-MEK2 (S222D S226D) were immunoprecipitated from HEK293 cells and incubated with ATP and recombinant ERK protein.
Using a phospho-specific antibody, we were able to demonstrate that acute Cdk5 inhibition abrogates phosphorylation of MEK2 at T395 (Fig. 3c). Importantly, mutation of both of these neighboring sites rendered MEK more active than WT in a protein kinase assay using recombinant ERK protein as a substrate (Fig. 3d). Together, these findings strongly suggest that Cdk5 deletion results in the activation of ERK kinase via de-repression of MEK kinase activity.
We next asked a critical question: does inhibition of the MEK/ERK pathway correct the metabolic defect evident in the Cdk5-FKO mice? Mice of both WT and FKO genotypes maintained on a HFD were treated with the well-characterized MEK inhibitor PD0325901 for 5 days prior to a glucose tolerance test. Remarkably, inhibition of MEK was able to completely normalize glucose tolerance in these two groups, consistent with the role of ERK as a key compensating kinase in Cdk5-deficient adipose tissue (Fig. 4a–c). This occurred with no effect on adiposity (ED 5).
To better understand the role of ERK in the pathophysiology of diabetes we examined insulin sensitivity by performing insulin tolerance tests and hyperinsulinemic-euglycemic clamp experiments on diet-induced obese wild-type C57Bl/6 mice. Mice treated with PD0325901 demonstrate a late divergence in glycemia at 90 minutes following insulin administration suggesting an exaggerated response to insulin action (Fig. 4d). Similarly, clamp studies reveal a two-fold increase in the glucose infusion rate (Fig. 4e). This dramatically improved sensitivity to insulin infusion was due to increased whole body glucose utilization and improved insulin-mediated suppression of both endogenous glucose production and lipolysis (Fig. 4f,i–j). Importantly, tracer analysis indicates that insulin sensitivity was increased more strongly in adipose tissue compared to skeletal muscle; however, both tissues contribute to the effects of ERK inhibition on glucose disposal (Fig. 4g,h).
To further examine the efficacy of targeting MEK and ERK pharmacologically, we studied severely insulin resistant leptin-deficient obese (ob/ob) mice. We found elevated pERK levels in white adipose tissue from unchallenged ob/ob mice compared to lean wild type controls (Fig. 5a). We next treated ob/ob mice with either PD0325901 or a distinct FDA-approved MEK inhibitor, Trametinib/GSK1120212. Compared to control animals, mice receiving either GSK1120212 or PD0325901 showed an improvement in glucose tolerance (Fig 5b, ED 6a). This was accompanied by decreased insulin levels and increased levels of the insulin sensitizing hormone adiponectin (Fig. 5c–d, ED 6b) without affecting body weight (Fig. 5e and Fig. 4o).
Figure 5.

Metabolic consequences of MEK inhibition in ob/ob mice. (a) ERK phosphorylation in WAT from WT C57Bl6/J or ob/ob mice. (b) Glucose tolerance test in ob/ob mice following treatment with MEK inhibitor GSK1120212 or vehicle. (c) Fasting insulin values, (d) plasma adiponectin levels, and (e) body weights (n = 8). (f–h) Gene expression in ob/ob epididymal WAT following treatment with vehicle or either of two MEK inhibitors, PD0325901 or GSK1120212 (n = 7, 7, 8 respectively). (f) Genes responsive to PPARγ S273 phosphorylation, (g) genes responsive to PPARγ agonism, and (h) genes controlling “browning” of WAT and thermogenesis. (i) Phosphorylation of PPARγ in epididymal WAT in ob/ob mice after treatment with MEK inhibitors. AUC and gene expression were analyzed by ANOVA. Error bars ± SEM. * p < 0.05, ** p < 0.01, *** p < 0.001.
We performed gene expression analysis to better understand the transcriptional basis of the improved glucose homeostasis following MEK inhibition. We have previously defined a set of 17 genes that are sensitive to PPARγ S273 phosphorylation in cultured adipose cells and then further refined that gene set to 10 genes that were also regulated by obesity in mice and responded to treatment with non-agonist PPARγ ligands1. Although treatment with MEK inhibitors did not affect the degree of obesity, expression of 10/10 of these genes was significantly regulated by treatment with one or both of the MEK inhibitors used in this study (Fig. 5f). This includes circulating insulin sensitivity factors adiponectin and adipsin, among the genes previously shown to be most sensitive to phosphorylation of PPARγ at serine 273. Importantly, the direction of all of these changes is consistent with that predicted by the reversal of S273 phosphorylation. Conversely, the MEK inhibitors had a minimal effect on expression of genes linked to PPARγ agonism and adipogenesis including aP2 and Cebpa (Fig. 5g). Somewhat surprisingly, we found an elevation in genes participating in the induction of thermogenesis and “browning” of white adipose tissue (Fig. 5h). This thermogenic program does not include the PPARγ coactivators Pgc1α or Prdm16, although post-translational modifications of these proteins cannot be excluded as contributing to this phenotype27,28. Lastly, we observed decreased expression of the pro-inflammatory cytokine Tnfα and an altered adipose tissue macrophage expression profile (ED 7). Both MEK inhibitors caused a decrease in PPARγ phosphorylation at S112 and S273, confirming the established role of ERKs in regulating S112 and strongly suggesting a new role at regulating S27322–24 (Fig. 5i). Together these data identify an insulin sensitizing role for MEK inhibitors in adipose tissue—strikingly consistent with the effects of non-agonist PPARγ ligands that specifically block PPARγ phosphorylation at S273 (ED 8).
The MEK inhibitory compounds that we have used here are now safe and effective enough to be used in patients with metastatic melanoma29 and tolerated well enough to allow for the studies of metabolism in rodents and perhaps humans. We find anti-diabetic effects when these MEK inhibitors are given at doses 3-fold lower than were used in rodent tumor xenograft models30. This suggests that there may be a therapeutic window for improving insulin sensitivity via PPARγ, using either a safe, low dose treatment of a MEK inhibitor, a non-agonist ligand which blocks kinase accessibility to PPARγ S273, or both together. These data offer hope for resurrecting PPARγ targeted therapeutics to improve whole body insulin sensitivity.
Methods
Animal Experiments
Animal experiments were performed with approval from the Institutional Animal Care and Use Committees of both Beth Israel Deaconess Medical Center and The Harvard Center for Comparative Medicine. Glucose and insulin tolerance tests were performed as previously described by researchers blinded to the genotype and treatment group to which each mouse belonged31. Glucose doses utilized were as follows: for mice maintained on a standard-diet, 2 g/kg; high-fat diet, 1.5 g/kg; ob/ob mice 1 g/kg. Male C57Bl6/J ob/ob mice were purchased from Jackson Labs at 5–6 wk of age and allowed to acclimate for 1–2 wk before treatment. Cdk5Flox/Flox mice were generously provided by P. Greengard, Rockefeller University. Cdk5Flox/Flox control, adiponectin-Cre and the CDK5-FKO (Cdk5Flox/Flox ::adiponectin-Cre) mice were healthy and viable, in contrast to mice with whole body deletion of CDK5. Adiponectin-Cre mice were kindly provided by E. Rosen, Beth Israel Deaconess Medical Center. Both strains were previously backcrossed to a C57Bl/6 background. For diet-induced obesity, male animals were fed a high-fat (60%) diet (Research Diets, Cat# D12492i). For in vivo therapeutic assays, GSK1120212 (3 mg/kg) or PD032590132–34 (10 mg/kg) (Selleckchem) was administered by daily oral gavage for 5 days unless otherwise specified. Compounds were dissolved in DMSO and diluted into an aqueous 250 μl dose containing 0.5% hypromellose and 2% Tween-80. High-fat diet mice were switched to and maintained on a standard chow diet 48 hr before the first dose of MEK inhibitors. Sample sizes were based not on power calculations but on the maximum number of mice that could be bred to within 2–3 wk in age to maintain well matched controls. For randomization of groups, mice were ranked according to body weight and alternated between vehicle and drug treatment groups. Mice were excluded from randomization if body weight was more than 2 standard deviations from the mean. Hyperinsulinemic eugycemic clamp studies were performed as previously described2.
Cell Culture
Cell culture of HEK293 and F442A pre-adipocytes were performed as described, protein and RNA preparation, western blotting, qRTPCR with expression normalized to levels of TATA binding protein (TBP)2. Cell lines were found free of mycoplasma before initiation of studies. Inhibition of analogue sensitive CDK5 kinase (F80G) was performed by treating cells with 1NMPP1 (1-(1,1-dimethylethyl)-3-(1-NaphthalenylMethyl)-1H-Pyrazolo[3,4-d]Pyrimidin-4-amine) (Cayman Chemical) at the indicated dose for 2 hr.
Plasmids
The constitutively active ERK kinase, ERK-CA is the product of a fusion of MEK1 with ERK2 (ERK2-MEK1-LA) was generously provided by M. Cobb35. The inserts encoding human WT-MEK2 and CA-MEK2 (S222D and S226D) from Addgene (Cat# 40776, 29580) were cloned into Flag-pCDNA3.1. The F80G mutation of HA-Cdk5 was introduced using the Quikchange XL Site Directed Mutagenesis Kit (Agilent). This insert was cloned into the pMSCV backbone retrovirus for stable infection of F442A pre-adipocytes.
Antibodies
Antibodies were obtained from Cell Signaling Technology (anti-phospho-ERK1/2 (#9101), anti-ERK (#4695), anti-phospho p38 (#4511), anti-p38 (#9212), anti-phospho JNK (#4671), anti-JNK (#9252), anti-phospho AKT (#13038, and total AKT(#9272)), Millipore (anti-phospho-S112 PPARγ (#04-816), and Santa Cruz Biotechnology (anti-PPARγ (#sc-7273) and anti-phospho-394-MEK2 (#sc-101734)). Antibodies against anti-phospho-S273 PPARγ were previously generated as described1.
Indirect Calorimetry
Energy expenditure, O2 consumption, CO2 production, respiratory exchange ratio (RER), total locomotor activity, and food intake measurements were made with a 16 cage Columbus Instruments Oxymax Comprehensive Lab Animal Monitoring System at ambient room temperature (21–23 °C). Whole body composition was assessed with an EchoMRI 3-in-1 on conscious mice both before and after calorimetry. As body weight and body composition were unchanged between WT and CDK5-FKO mice, data were analyzed by ANOVA.
Mass Spectrometry
Enrichment using ActivX ATP probes (Thermo) combined with phosphopeptide enrichment were used to profile kinases36. Briefly, tissue extracts were incubated in the presence of non-hydrolyzable ATP analogues coupled to a desthiobiotinylated tag. These small molecule probes are designed to covalently attach to ATPases, including protein kinases. Peptides were then labeled with TMT isobaric tags and the resulting mass spectra were analyzed quantitatively. The method was recently adapted to include an additional phosphopeptide enrichment step, thereby improving the identification and quantitation of protein kinase activities37. The methods are similar to those described in McAllister et al. Mouse tissue homogenate from 3 WT and 3 Cdk5-FKO mice was subjected to gel filtration in spin columns (Zeba, Pierce) according to manufacturer’s instructions to remove endogenous ATP, ADP and small molecules and then diluted with reaction buffer (25 mM Tris-HCl pH 7.4, 150 mM NaCl, 1 mM EDTA, 1% NP-40, 5% glycerol) to a final protein concentration of 2 mg/mL. Protease inhibitors (1x “complete”, Roche 04693132001) and phosphatase inhibitors (final concentration 2 mM imidazole, 1 mM sodium fluoride, 1.15 mM sodium molybdate, 4 mM sodium tartrate dehydrate, 1 mM β-glycerophosphate, 50 μM phenylarsine) were added along with MnCl2 to a final concentration 10 μM. Lysates were incubated with ActivX ATP probes for 10 min at room temperature at a concentration of 20 μM. The reaction was quenched with 8 M urea, reduced with DTT (5 mM final concentration) and then alkylated with iodoacetamide (15 mM final concentration). The solution was then subjected again to gel filtration (Zeba, Pierce). Streptavidin was then added to the lysate to capture the undigested, desthiobiotinylated proteins/kinases. Following extensive washing (lysis buffer containing 6 M urea (5 × 100 μL), 50 mM HEPES (5 × 100 μL)), the captured proteins were subjected to on-bead digestion with trypsin (5 ng/uL) for 4 hr at 37 °C in a TMT compatible buffer (50 mM HEPES, pH 7.4, 0.5 M Gu-HCl). Following digestion, the resulting peptides were extracted and the beads were washed with 50 mM HEPES (2 × 50 μL) and these washes were added to the peptide mixture. Acetonitrile was added to the peptide mixture to a final concentration of 30%, and the peptides were subjected to Tandem mass tags (TMT, Thermo Scientific, Rockford, IL) labeling. For labeling, 0.8 mg of each TMT reagent (126, 127, 128, 129, 130, 131) were resuspended in 40 μL of anhydrous acetonitrile (ACN). Peptides were resuspended in 17.5 μL 50 mM HEPES pH 8.5 and 5 μL of acetonitrile (ACN) to which 2.5 μL TMT reagent were added. The TMT labeling reaction was performed at room temperature for one hour and individual labeling reactions were quenched by the addition of 3 μl of 5% hydroxylamine and the six samples were then combined and desalted using StageTips38.
For phospopeptide enrichment, peptides were resuspended in 100 μL binding buffer (2 M lactic acid, 50% ACN). Phosphopeptides were enriched using TiO2 as described39. 600 μg TiO2 resin (GL Sciences, Tokyo, Japan) were prepared by washing with 2 × 200 μL binding buffer and then added to the peptides in binding buffer and incubated for 1 hr at room temperature. Following incubation, beads were recovered by centrifugation (4 min, 200 × g) and washed with binding buffer (5 × 200 μL). Bound phosphopeptides were then eluted with 50 mM KPO4 pH 10 (3 × 20 μL) and further purified by StageTip. The purified phosphopeptides were resuspended in 8 μL 5% formic acid (FA) and 4 μL was injected and analyzed by LC-MS3. In the Cdk5 experiment, tissue homogenate was pretreated with Cdk5/p35 (Millipore) for 10 min with the indicated amounts before being processed using the above protocol. ActivX ATP probes, high capacity binding streptavidin and TMT (tandem mass tags) were obtained from Thermo Scientific (Rockford, IL), modified trypsin was obtained from Promega (Madison, WI), and TiO2 beads were obtained from GL Sciences (Tokyo, Japan). SepPak C18 solid-phase extraction cartridges were purchased from Waters Corporation (Milford, MA).
Liquid Chromatography (LC) and Mass Spectrometry (MS) analysis
LC-MS/MS analysis was performed on an LTQ Orbitrap Velos or an LTQ Orbitrap Elite mass spectrometer (Thermo-Fisher Scientific, San Jose, CA) linked to an Accela 600 quaternary LC pump (Thermo) and a Famos autosampler (LC Packings). Flow rates of 300 nL/min over the column were achieved using a flow-split method. A hand-pulled fused silica microcapillary column (125 μm × 18 cm) was used for peptide separation. The column was first packed with approximately 0.5 cm of Magic C4 resin (5 μm, 100 Å, Michrom Bioresources) and then with 18 cm of Maccel C18 AQ resin (3 μm, 200 Å, Nest Group). The total LC-MS run length for each sample was 180 min and this consisted of a 150 min gradient from 3% to 33% acetonitrile in 0.125% formic acid. A recently developed MS3 method was used to overcome the interference problem in acquisition of TMT data40. Briefly, a high resolution MS1 scan in the Orbitrap (300–1500 m/z, 60k resolution, AGC 1 × 10⁶) was collected from which the top ten precursors were selected for MS2 analysis followed by MS3 analysis. The MS2 scan was performed in the quadrupole ion trap (CID, AGC 2 × 10³, normalized collision energy 35, max injection time 100 ms) and the MS3 scan was analyzed in the Orbitrap (HCD, 30k resolution, max AGC 1.5 × 10⁵, max injection time 250 ms, normalized collision energy 50). Multiple fragment ions from each MS2 spectrum were selected for MS3 analysis using isolation waveforms with multiple frequency notches41.
Data analysis
Statistical Data Analysis was performed with GraphPad Prism and Microsoft Excel including Daniel’s XL Toolbox Add-In. Unless otherwise specified, analyses were by one tailed Student’s t-test. Sequence alignment was performed with a modified Clustal W algorithm using Vector NTI AlignX. Mass spectrometry data were processed using an in-house software pipeline42. Raw files were converted to mzXML files and searched using the Sequest algorithm43 against a composite database containing sequences from the mouse uniprot database in forward and reverse orientations as well as the sequences of common contaminating proteins (e.g. trypsin). Database searching matched MS/MS spectra with fully tryptic peptides from this composite database with a 20 ppm precursor ion and a product ion tolerance of 1 Da. Carbamidomethylation of cysteine residues (+57.02146 Da) and TMT tags on peptide N termini and lysines (+229.162932 Da) were set as static modifications. Variable modifications of oxidation of methionine residues (+15.99492) and phosphorylation (+79.966330) on serine, threonine and tyrosine residues were used. The data were filtered to a false discovery rate of less than 1% based on the target-decoy database approach at both the peptide and protein level44. Linear discriminant analysis was performed to generate a classifier to distinguish between correct and incorrect MS2 spectra assignments based on the following parameters: XCorr, ΔCn, peptide ion mass accuracy, charge state and peptide length, as described42. Peptides were then assembled into proteins which were scored probabilistically and further filtered to a protein-level FDR of ~1%. Peptide quantification using TMT reporter ion intensity was performed using in-house software, as described42. Briefly, a 0.06 m/z window around the theoretical m/z value of each reporter ion was scanned for ions, and the intensity of the signal nearest to the theoretical m/z value was recorded. The intensities of the reporter ions were adjusted to account for isotopic impurities in each TMT variant (as provided by the manufacturer). For comparisons, the whole datasets were filtered to a 1% FDR and proteins and phosphosites were then quantified by summing reporter ion counts for all the peptide-spectral matches. Filtering was performed to remove poor quality MS3 spectra similar to as described previously41). Protein quantitation values were exported for further analysis in Excel or Matlab. Hierarchical clustering was performed using Matlab.
In vitro, MS-based kinase activity assay
PPARγ (1 μg, Active Motif) was incubated with 50 ng recombinant kinases MEK2, ERK2 (SignalChem) and Cdk5/p35 (Millipore) and kinase reaction buffer containing 25 mM Tris-Cl, pH 7.5, 5 mM ATP, 7.5 mM MgCl2, 0.2 mM EGTA, 7.5 mM β-glycerophosphate, 0.1 mM Na3VO4 and 0.1 mM DTT in a final reaction volume of 50 μL. All proteins were corresponding to the human sequences. After incubation for 45 min at room temperature, the reaction mixture was subjected to both LysC and trypsin digestion (individual reactions). Following purification, the samples were then analyzed by LC-MS/MS similar to as described above but without the additional MS3 dimension.
Extended Data
Extended Data 1.
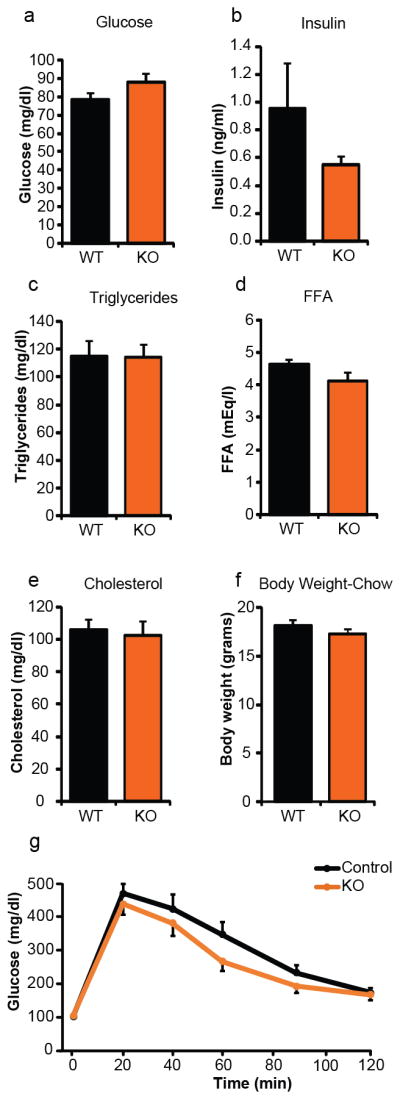
Metabolic profiling of adipose-specific Cdk5 knockout mice on a standard chow diet. Fasting plasma levels of (a) glucose, (b) insulin, (c) total triglycerides, (d) free fatty acids (FFA), and (e) total cholesterol (n = 16 Ctl, 17 KO). (f) Body weights and (g) intraperitoneal glucose tolerance test. Mice were 12 wk of age (n = 14 Ctl, 11 KO). No significant differences were observed. Error bars ± SEM.
Extended Data 2.

Energy homeostasis of adipose-specific Cdk5 knockout mice maintained on a high fat diet. Following a 48 hr acclimatization period, singly housed mice were monitored for (a) oxygen consumption (VO2), (b) carbon dioxide production (VCO2), (c) respiratory exchange ratio (RER), (d) ambulatory locomotor activity, (e) cumulative food intake, and (f) body weights (n = 8 per group). Shaded areas signify the dark phase of the light cycle. No significant differences were observed. Error bars ± SEM.
Extended Data 3.
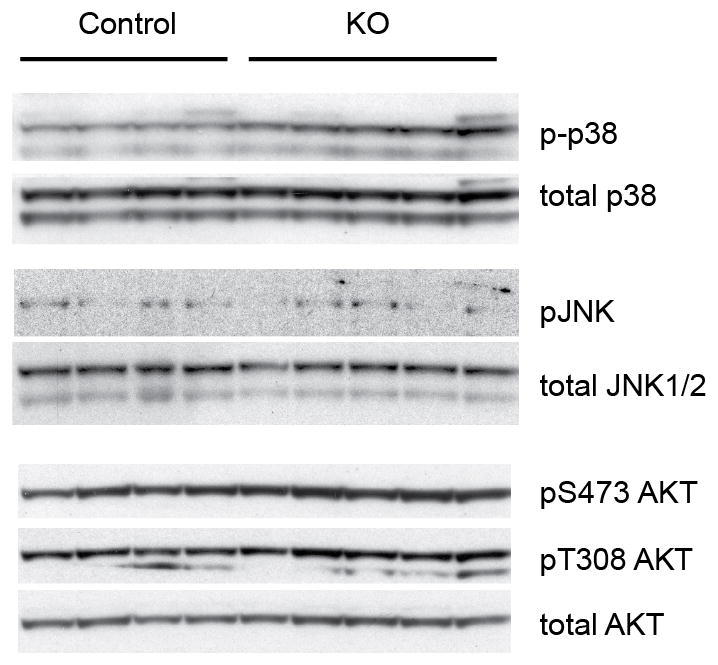
Activity of alternative kinases in adipose tissue from CDK5 FKO mice. Brown adipose tissue protein lysates from mice maintained on a HFD for 12 wk. Blotting for phospho-p38, phospho-JNK, and phospho-S473 and pT308 AKT was performed before loading for total protein amounts.
Extended Data 4.

Conservation of the sites on MEK2 phosphorylated by Cdk5. Mouse MEK2 T395/T397 corresponds to human MEK2 T394/T396. These sites share identity to MEK1 T386/T388 in both humans and mouse. Cdk5 has previously been shown to phosphorylate MEK1 at T286, a site not shared with MEK2. ERK has been shown to phosphorylate MEK1 T386 and contribute to regulation of kinase activity31. Homo, Homo sapiens; trog, Pan troglodytes; mus, Mus musculus; rat, Rattus norvegicus; bos, Bos taurus; canis, Canis lupus familiaris.
Extended Data 5.
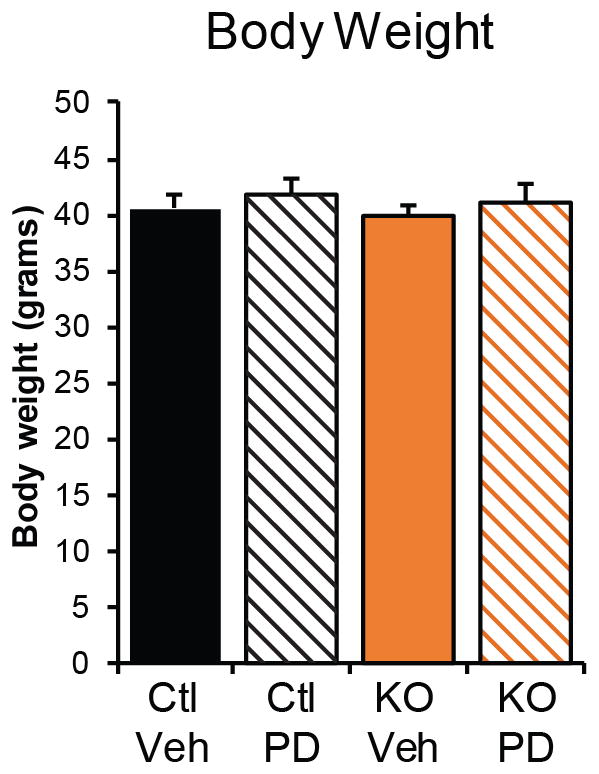
Body weight of control and of adipose-specific Cdk5 knockout mice maintained on a high fat diet following treatment with PD0325901 as in Fig. 4a–c. The body weights are not significantly different by ANOVA. Error bars ± SEM.
Extended Data 6.
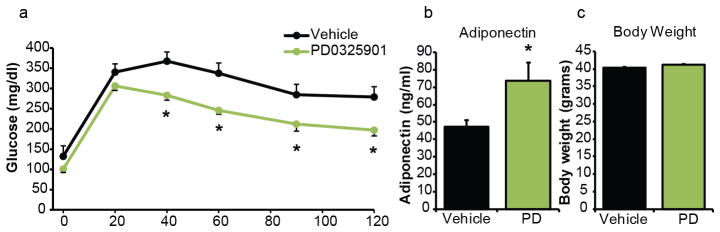
Effects of PD0325901 treatment on ob/ob mice. (a) Glucose tolerance test, (b) adiponectin levels, and (c) body weights of ob/ob mice treated with PD0325901 (n = 7 vehicle, 8 PD). * p = < 0.05 by Student’s t-test. Error bars ± SEM.
Extended Data 7.
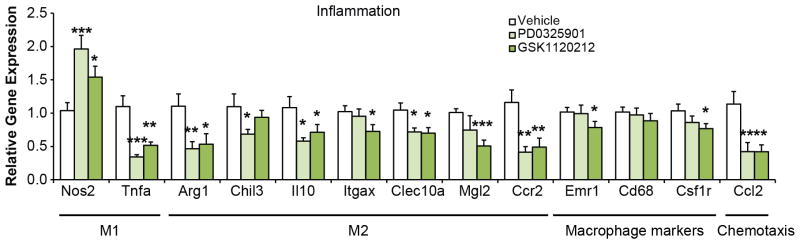
Inflammatory markers in epididymal WAT from ob/ob mice treated with MEK inhibitors. Gene expression analysis was performed on M1 macrophage markers Nos2 and TNFα; M2 macrophage markers Arg1, Chil3, Il10, Itgax, Clec10a/Mgl1 and Mgl2; chemotactic ligand Ccl2 and receptor Ccr2; and macrophage surface markers Emr1, Cd68, and Csf1r (n = 7–8 mice per group as in Fig. 4p–r). Gene expression was analyzed by ANOVA. Error bars ± SEM. * p < 0.05, ** p < 0.01, *** p < 0.001.
Extended Data 8.

Schematic model of PPARγ regulation at S273. (a) In the lean state PPARγ is not phosphorylated. (b) In the obese state S273 phosphorylation is driven by both Cdk5 and ERK with CDK5 repressing MEK and ERK activity. (c) CDK5 knockout results in derepression of MEK and ERK kinases and increased phosphorylation of S273 PPARγ. (d) MEK inhibition dramatically reduces S273 PPARγ phosphorylation. (e) PPARγ ligands including the TZDs, block the accessibility of S273 PPARγ by either ERK or CDK5 kinases.
Acknowledgments
We gratefully acknowledge E. Rosen for providing us with the adiponectin Cre mice before their initial publication. We would like to thank members of the Spiegelman Lab (DFCI) and D. Cohen (BWH) for fruitful discussions. We also acknowledge the help of C. Palmer and K. LeClair for helpful reading of the manuscript. B.M.S. acknowledges NIH grant DK31405. A.B. acknowledges NIH grant DK93638, the Harvard University Milton Fund, and the Harvard Digestive Disease Center, Core D.
Footnotes
Supplementary Information is available in the online version of the paper.
Author Contributions Manuscript was written by A.B., B.M.S. and F.E. Experiments were designed by A.B., B.M.S., F.E., S.G., J.P.C., M.J. and G.S. Experiments were performed by A.B., D.B., F.E., J.C.P. and P.Z.
Author Information Reprints and permissions information is available at www.nature.com/reprints. B.M.S. is a consultant to and shareholder in Ember Therapeutics. Readers are welcome to comment on the online version of the paper.
References
- 1.Choi JH, et al. Anti-diabetic drugs inhibit obesity-linked phosphorylation of PPARγ by Cdk5. Nature. 2010;466:451–456. doi: 10.1038/nature09291. [DOI] [PMC free article] [PubMed] [Google Scholar]
- 2.Choi JH, et al. Antidiabetic actions of a non-agonist PPARγ ligand blocking Cdk5-mediated phosphorylation. Nature. 2011;477:477–481. doi: 10.1038/nature10383. [DOI] [PMC free article] [PubMed] [Google Scholar]
- 3.Yu JG, et al. The effect of thiazolidinediones on plasma adiponectin levels in normal, obese, and type 2 diabetic subjects. Diabetes. 2002;51:2968–2974. doi: 10.2337/diabetes.51.10.2968. [DOI] [PubMed] [Google Scholar]
- 4.Tontonoz P, Hu E, Spiegelman BM. Stimulation of adipogenesis in fibroblasts by PPARγ2, a lipid-activated transcription factor. Cell. 1994;79:1147–1156. doi: 10.1016/0092-8674(94)90006-x. [DOI] [PubMed] [Google Scholar]
- 5.Chawla A, Schwarz EJ, Dimaculangan DD, Lazar MA. Peroxisome proliferator-activated receptor (PPAR) gamma: adipose-predominant expression and induction early in adipocyte differentiation. Endocrinology. 1994;135:798–800. doi: 10.1210/endo.135.2.8033830. [DOI] [PubMed] [Google Scholar]
- 6.Saltiel AR, Kahn CR. Insulin signalling and the regulation of glucose and lipid metabolism. Nature. 2001;414:799–806. doi: 10.1038/414799a. [DOI] [PubMed] [Google Scholar]
- 7.Krüger M, et al. Dissection of the insulin signaling pathway via quantitative phosphoproteomics. Proc Natl Acad Sci USA. 2008;105:2451–2456. doi: 10.1073/pnas.0711713105. [DOI] [PMC free article] [PubMed] [Google Scholar]
- 8.De Fea K, Roth RA. Modulation of insulin receptor substrate-1 tyrosine phosphorylation and function by mitogen-activated protein kinase. J Biol Chem. 1997;272:31400–31406. doi: 10.1074/jbc.272.50.31400. [DOI] [PubMed] [Google Scholar]
- 9.Zheng Y, et al. Improved insulin sensitivity by calorie restriction is associated with reduction of ERK and p70S6K activities in the liver of obese Zucker rats. J Endocrinol. 2009;203:337–347. doi: 10.1677/JOE-09-0181. [DOI] [PMC free article] [PubMed] [Google Scholar]
- 10.Lazar DF, et al. Mitogen-activated protein kinase kinase inhibition does not block the stimulation of glucose utilization by insulin. J Biol Chem. 1995;270:20801–20807. doi: 10.1074/jbc.270.35.20801. [DOI] [PubMed] [Google Scholar]
- 11.Jiang ZY, et al. Characterization of selective resistance to insulin signaling in the vasculature of obese Zucker (fa/fa) rats. J Clin Invest. 1999;104:447–457. doi: 10.1172/JCI5971. [DOI] [PMC free article] [PubMed] [Google Scholar]
- 12.Jager J, et al. Deficiency in the extracellular signal-regulated kinase 1 (ERK1) protects leptin-deficient mice from insulin resistance without affecting obesity. Diabetologia. 2011;54:180–189. doi: 10.1007/s00125-010-1944-0. [DOI] [PubMed] [Google Scholar]
- 13.Hawasli AH, et al. Cyclin-dependent kinase 5 governs learning and synaptic plasticity via control of NMDAR degradation. Nat Neurosci. 2007;10:880–886. doi: 10.1038/nn1914. [DOI] [PMC free article] [PubMed] [Google Scholar]
- 14.Eguchi J, et al. Transcriptional control of adipose lipid handling by IRF4. Cell Metab. 2011;13:249–259. doi: 10.1016/j.cmet.2011.02.005. [DOI] [PMC free article] [PubMed] [Google Scholar]
- 15.Ohshima T, et al. Targeted disruption of the cyclin-dependent kinase 5 gene results in abnormal corticogenesis, neuronal pathology and perinatal death. Proc Natl Acad Sci USA. 1996;93:11173–11178. doi: 10.1073/pnas.93.20.11173. [DOI] [PMC free article] [PubMed] [Google Scholar]
- 16.Hawasli AH, et al. Regulation of hippocampal and behavioral excitability by cyclin-dependent kinase 5. PLoS One. 2009;4:e5808. doi: 10.1371/journal.pone.0005808. [DOI] [PMC free article] [PubMed] [Google Scholar]
- 17.Meijer L, et al. Biochemical and cellular effects of roscovitine, a potent and selective inhibitor of the cyclin-dependent kinases cdc2, cdk2 and cdk5. Eur J Biochem /FEBS. 1997;243:527–536. doi: 10.1111/j.1432-1033.1997.t01-2-00527.x. [DOI] [PubMed] [Google Scholar]
- 18.Bach S, et al. Roscovitine Targets, Protein Kinases and Pyridoxal Kinase. J Biol Chem. 2005;280:31208–31219. doi: 10.1074/jbc.M500806200. [DOI] [PubMed] [Google Scholar]
- 19.Shah K, Liu Y, Deirmengian C, Shokat KM. Engineering unnatural nucleotide specificity for Rous sarcoma virus tyrosine kinase to uniquely label its direct substrates. Proc Natl Acad Sci USA. 1997;94:3565–3570. doi: 10.1073/pnas.94.8.3565. [DOI] [PMC free article] [PubMed] [Google Scholar]
- 20.Sun KH, De Pablo Y, Vincent F, Shah K. Deregulated Cdk5 promotes oxidative stress and mitochondrial dysfunction. J Neurochem. 2008;107:265–278. doi: 10.1111/j.1471-4159.2008.05616.x. [DOI] [PubMed] [Google Scholar]
- 21.Tarricone C, et al. Structure and regulation of the CDK5-p25(nck5a) complex. Mol Cell. 2001;8:657–669. doi: 10.1016/s1097-2765(01)00343-4. [DOI] [PubMed] [Google Scholar]
- 22.Hu E, Kim JB, Sarraf P, Spiegelman BM. Inhibition of adipogenesis through MAP kinase-mediated phosphorylation of PPARgamma. Science. 1996;274:2100–2103. doi: 10.1126/science.274.5295.2100. [DOI] [PubMed] [Google Scholar]
- 23.Shao D, et al. Interdomain communication regulating ligand binding by PPAR-γ. Nature. 1998;396:377–380. doi: 10.1038/24634. [DOI] [PubMed] [Google Scholar]
- 24.Rangwala SM, et al. Genetic modulation of PPARgamma phosphorylation regulates insulin sensitivity. Dev Cell. 2003;5:657–663. doi: 10.1016/s1534-5807(03)00274-0. [DOI] [PubMed] [Google Scholar]
- 25.Sharma P, et al. Phosphorylation of MEK1 by cdk5/p35 down-regulates the mitogen-activated protein kinase pathway. J Biol Chem. 2002;277:528–534. doi: 10.1074/jbc.M109324200. [DOI] [PubMed] [Google Scholar]
- 26.Hornbeck PV, et al. PhosphoSitePlus: a comprehensive resource for investigating the structure and function of experimentally determined post-translational modifications in man and mouse. Nucleic Acids Res. 2012;40:D261–270. doi: 10.1093/nar/gkr1122. [DOI] [PMC free article] [PubMed] [Google Scholar]
- 27.Puigserver P, et al. A cold-inducible coactivator of nuclear receptors linked to adaptive thermogenesis. Cell. 1998;92:829–839. doi: 10.1016/s0092-8674(00)81410-5. [DOI] [PubMed] [Google Scholar]
- 28.Ohno H, Shinoda K, Spiegelman BM, Kajimura S. PPARγ agonists induce a white-to-brown fat conversion through stabilization of PRDM16 protein. Cell Metab. 2012;15:395–404. doi: 10.1016/j.cmet.2012.01.019. [DOI] [PMC free article] [PubMed] [Google Scholar]
- 29.Flaherty KT, et al. Combined BRAF and MEK Inhibition in Melanoma with BRAF V600 Mutations. New Engl J Med. 2012;367:1694–1703. doi: 10.1056/NEJMoa1210093. [DOI] [PMC free article] [PubMed] [Google Scholar]
- 30.Solit DB, et al. BRAF mutation predicts sensitivity to MEK inhibition. Nature. 2006;439:358–362. doi: 10.1038/nature04304. [DOI] [PMC free article] [PubMed] [Google Scholar]
- 31.Banks AS, et al. Dissociation of the glucose and lipid regulatory functions of FoxO1 by targeted knockin of acetylation-defective alleles in mice. Cell Metab. 2011;14:587–597. doi: 10.1016/j.cmet.2011.09.012. [DOI] [PMC free article] [PubMed] [Google Scholar]
- 32.Barrett SD, et al. The discovery of the benzhydroxamate MEK inhibitors CI-1040 and PD 0325901. Bioorg Med Chem Lett. 2008;18:6501–6504. doi: 10.1016/j.bmcl.2008.10.054. [DOI] [PubMed] [Google Scholar]
- 33.Albeck JG, Mills GB, Brugge JS. Frequency-modulated pulses of ERK activity transmit quantitative proliferation signals. Mol Cell. 2013;49:249–261. doi: 10.1016/j.molcel.2012.11.002. [DOI] [PMC free article] [PubMed] [Google Scholar]
- 34.Lau KS, et al. In vivo systems analysis identifies spatial and temporal aspects of the modulation of TNF-α-induced apoptosis and proliferation by MAPKs. Science Signaling. 2011;4:ra16. doi: 10.1126/scisignal.2001338. [DOI] [PMC free article] [PubMed] [Google Scholar]
- 35.Robinson MJ, Stippec SA, Goldsmith E, White MA, Cobb MH. A constitutively active and nuclear form of the MAP kinase ERK2 is sufficient for neurite outgrowth and cell transformation. Curr Biol. 1998;8:1141–1150. doi: 10.1016/s0960-9822(07)00485-x. [DOI] [PubMed] [Google Scholar]
- 36.Patricelli, Matthew P, et al. In Situ Kinase Profiling Reveals Functionally Relevant Properties of Native Kinases. Chem Biol. 2011;18:699–710. doi: 10.1016/j.chembiol.2011.04.011. [DOI] [PMC free article] [PubMed] [Google Scholar]
- 37.McAllister FE, et al. Mass spectrometry based method to increase throughput for kinome analyses using ATP probes. Anal Chem. 2013;85:4666–4674. doi: 10.1021/ac303478g. [DOI] [PMC free article] [PubMed] [Google Scholar]
- 38.Rappsilber J, Mann M, Ishihama Y. Protocol for micro-purification, enrichment, pre-fractionation and storage of peptides for proteomics using StageTips. Nat Protocols. 2007;2:1896–1906. doi: 10.1038/nprot.2007.261. [DOI] [PubMed] [Google Scholar]
- 39.Kettenbach AN, Gerber SA. Rapid and reproducible single-stage phosphopeptide enrichment of complex peptide mixtures: application to general and phosphotyrosine-specific phosphoproteomics experiments. Anal Chem. 2011;83:7635–7644. doi: 10.1021/ac201894j. [DOI] [PMC free article] [PubMed] [Google Scholar]
- 40.Ting L, Rad R, Gygi SP, Haas W. MS3 eliminates ratio distortion in isobaric multiplexed quantitative proteomics. Nat Meth. 2011;8:937–940. doi: 10.1038/nmeth.1714. [DOI] [PMC free article] [PubMed] [Google Scholar]
- 41.McAlister GC, et al. Increasing the multiplexing capacity of TMTs using reporter ion isotopologues with isobaric masses. Anal Chem. 2012;84:7469–7478. doi: 10.1021/ac301572t. [DOI] [PMC free article] [PubMed] [Google Scholar]
- 42.Huttlin EL, et al. A tissue-specific atlas of mouse protein phosphorylation and expression. Cell. 2010;143:1174–1189. doi: 10.1016/j.cell.2010.12.001. [DOI] [PMC free article] [PubMed] [Google Scholar]
- 43.Eng JK, McCormack AL, Yates JR., III An approach to correlate tandem mass spectral data of peptides with amino acid sequences in a protein database. J Am Soc Mass Spect. 1994;5:976–989. doi: 10.1016/1044-0305(94)80016-2. [DOI] [PubMed] [Google Scholar]
- 44.Elias JE, Gygi SP. Target-decoy search strategy for increased confidence in large-scale protein identifications by mass spectrometry. Nat Meth. 2007;4:207–214. doi: 10.1038/nmeth1019. [DOI] [PubMed] [Google Scholar]