

Abstract
Ribavirin (RBV) is a nucleoside analog used to treat a variety of DNA and RNA viruses. RBV undergoes intracellular phosphorylation to a mono- (MP), di- (DP), and triphosphate (TP). The phosphorylated forms have been associated with the mechanisms of antiviral effect observed in vitro, but the intracellular pharmacology of the drug has not been well characterized in vivo. A highly sensitive LC-MS/MS method was developed and validated for the determination of intracellular RBV MP, DP, and TP in multiple cell matrix types. For this method, the individual MP, DP, and TP fractions were isolated from lysed intracellular matrix using strong anion exchange solid phase extraction, dephosphorylated to parent RBV, desalted and concentrated and quantified using LC-MS/MS. The method utilized a stable labeled internal standard (RBV-13C5) which facilitated accuracy (% deviation within ±15%) and precision (coefficient of variation of ≤15%). The quantifiable linear range for the assay was 0.50 to 200 pmol/sample. The method was applied to the measurement of RBV MP, DP, and TP in human peripheral blood mononuclear cells (PBMC), red blood cells (RBC), and dried blood spot (DBS) samples obtained from patients taking RBV for the treatment of chronic Hepatitis C virus infection.
Keywords: Ribavirin triphosphate, Intracellular Pharmacology, Analytical Methods, LC-MS/MS, Dried Blood Spots, Clinical Pharmacology
1. Introduction1
Ribavirin (RBV) is one of the only broad spectrum antiviral drugs available in the world [1]. Though RBV has been a fundamental component of the treatment of chronic Hepatitis C virus (HCV) infection for decades, its mechanism of antiviral activity has not been established in vivo. It is also associated with a major dose-limiting toxicity, hemolytic anemia. Our lack of understanding of the clinical pharmacology of RBV is a critical barrier to the optimal use of this drug in the treatment of HCV and other viruses.
RBV is a nucleoside analog that most closely resembles guanosine and adenosine [2]. RBV undergoes intracellular phosphorylation to a mono- (MP), di- (DP), and triphosphate (TP). It is the phosphorylated forms of the drug that have been associated with the antiviral effects observed in vitro [2–5]. RBV is a substrate for concentrative nucleoside uptake transporter 2 [6] and is widely taken up into many cell types in the body. Red blood cells (RBC) lack dephosphorylation enzymes, thus the TP moiety is thought to accumulate in RBC leading to hemolytic anemia [5].
Characterizing the intracellular pharmacology of RBV and determining concentration-effect relationships for the drug would inform dosing decisions and improve treatment outcomes [7,8]. We have developed a novel method for measuring the individual phosphate moieties of RBV in human peripheral blood mononuclear cells (hPBMC), red blood cells (RBC), RBC lysate derived from dried blood spots (DBS) and other types of cells including hepatocytes. While prior methods with similar solid phase extractions have quantitated parent RBV concentrations in whole blood [9] and RBV-MP and RBV-TP in vitro [10], this paper describes the development and validation of a highly sensitive and unique method for the separation and quantitation of intracellular phosphorylated RBV MP, DP, and TP. in vivo using samples obtained from patients being treated with RBV for chronic HCV infection. It is the first method to describe measurement of RBV and its phosphorylated metabolites in multiple cell matrices from human subjects.
2. Materials and Methods
2.1 Chemicals and Materials
The following chemicals were acquired from the stated manufacturers: Ribavirin (RBV, MW=244.2), Sigma Aldrich, St. Louis, MO; Ribavirin Monophosphate (RBV-MP, MW= 324.2) and Ribavirin triphosphate, (RBV-TP, MW=484.1), Moravek Biochemicals, Inc, Brea, CA; Ribavirin isotopic internal standard, (RBV 13C5, MW= 249.2), Toronto Research Chemicals, North York, ON.
Analytical grade reagents were purchased from Fisher Scientific, Fairlawn, NJ, (acetonitrile, methanol, formic acid, potassium chloride, phosphoric acid, and ammonium acetate) as well as Whatman 903 DBS cards, bags and desiccant for DBS preparation and storage. Sodium acetate and acid phosphatase were purchased from Sigma Aldrich, St. Louis. Ultrapure (UP) water was prepared in house from deionized water with a Barnstead Nanopure System (Thermo Fisher Scientific, Waltham, MA). Consumables included Waters Sep-Pak Accell Plus QMA Cartridge, 3cc (500mg) (Waters Corporation, Milford, MA) and Varian Bond-Elut LRC Phenylboronic Acid (PBA) Cartridge 100mg/10mL (Agilent, Santa Clara, CA); and blood products for lysed cellular matrix (Bonfils, Denver CO).
2.2 Preparation of hPBMC and RBC Cellular Matrices
Methods for sample collection, separation of hPBMC and RBC from whole blood, QMA separation of phosphorylated moieties and dephosphorylation have been previously published [11]. Briefly, RBV MP, DP, and TP concentrations were measured from hPBMCs and RBCs using isolation procedures developed specifically for the type of cells to be analyzed. The isolation procedure for hPBMCs included RBC removal with RBC lysis media (Gibco, Invitrogen) which is essential since RBV MP, DP, and TP are found at high levels in RBCs [8,11,12]. Once cell samples were isolated, purified, and counted, the cells were lysed with 500 µL cold 70:30 methanol: ultrapure water (v: v) and stored at −80°C. For DBS, 30 µL of whole blood was spotted and dried for at least two hours and up to overnight on Whatman 903 cards [13,14]. A 3 mm punch was lysed in 500 µL 70:30 solution via a 10 minute sonication prior to storage at −80°C [13]. It is this lysed cellular matrix (70:30) that was subjected to QMA separation to obtain the MP, DP and TP moieties using a potassium chloride gradient followed by desalting, concentrating and analysis with LC-MS/MS.
2.3 Preparation of Standard, Quality Control, and Internal Standard Solution
The RBV standard (STD) preparation stocks were prepared with 1 mg/mL (4095 pmol/µL) concentrations in UP water from reference powder. Preparation stocks of parent RBV were prepared at concentrations of 500, 50, and 5 pmol/µL, which were further diluted in UP water to create the final working standard solutions. The working standard concentrations range from 0.5 to 200 pmol/sample. Sample was defined as 20 µL working stock added to the 2 mL 1 M KCL eluate (for triphosphate) resulting from blank lysed cellular matrix carried through the QMA and dephosphorylation process [11]. A RBV isotopic internal standard (13C5) stock was prepared in UP water at a concentration of 40 pmol/µL. This stock was diluted to a working concentration of approximately 10 pmol/sample for use in the assay. Standard and internal standard solutions were stored at 4°C.
Individual Quality Control (QC) Preparation Stocks were prepared from RBV-triphosphate (RBV-TP) reference standard. Quality assurance procedures were performed on the RBV-TP stocks received from the manufacturers to assess both purity and potency, as described previously [15]. A potency determination of 99.9% and a purity determination of 92.6% were multiplied to arrive at a correction factor of 0.925 for the RBV-TP stock used in this validation. Applying this correction factor gave an initial RBV-TP QC preparation stock concentration of 1851 pmol/µL which was stored at −80°C. QCs were prepared by appropriate dilution with blank lysed cellular matrix (10 × 106 cells/mL) in 25 mL volumetric flasks. Four sets of QCs were prepared from the RBV-TP QC preparation stock for validation: 1.5 pmol/sample (QC Low); 15 pmol/sample (QC Med); 150 pmol/sample (QC High) and 0.5 pmol/sample (QC LLOQ). The QC LLOQ was prepared by dilution of 40 µL of QC Med in 1.2 mL total volume blank lysed cellular matrix freshly prepared each day of analysis. The volume extracted for each QC above was 0.2mL. This volume was defined as sample. QCs were stored at −80°C.
2.4 SPE: Desalting and Concentration of Parent RBV
Once separated by QMA [11], the isolated MP, DP, and TP RBV fractions, in 5 mL 75 mM KCL, 7 mL 90 mM KCL, and 2 mL 1 M KCL, respectively, were dephosphorylated to parent RBV. Working standard solutions (20 µL) were added to blank hPBMC samples obtained from the QMA and internal standard working stock solution (20 µL) was added to all tubes except the blank. 1.5 mL of 250 mM ammonium acetate, pH 8.5, was added to all the tubes followed by vortex mixing. Varian Bond-Elut LRC phenylboronic acid (PBA) SPE (Varian/Agilent) cartridges were used to de-salt and concentrate the samples. First, the PBA SPE cartridges were prepared with three washes: 1×1.0mL 0.25% phosphoric acid in methanol, 2×1.0mL 250mM ammonium acetate pH 8.5. After sample application, cartridges were washed with 2×1.0mL of 250mM ammonium acetate pH 8.5, 1×3.0 mL H2O, then 2×1.0mL methanol [16]. The analytes were eluted with one application of 1.0 mL 20% formic acid in methanol. Samples were dried for 25 minutes under nitrogen at 40°C in a Zymark TurboVap (Zymark Corp., Hopkinton, MA). Final reconstitution was with 100 µL UP water. The sample was vortex mixed, centrifuged to maximize collection (100g × 2min) and transferred to a 150 µL low volume insert (Waters Corporation, Milford, MA) followed by a 10 µL injection onto the LC-MS/MS system.
2.5 LC-MS-MS Instrumentation and Analytical Conditions
Both a TSQ Quantum® and TSQ Vantage® triple quadrupole mass spectrometer were used for clinical sample analysis. Validation runs were completed on the TSQ Quantum® triple quadrupole mass spectrometer (Thermo Fisher, San Jose, CA) HPLC system coupled with a Surveyor HPLC pump and autosampler. The assay was moved to the Vantage to achieve greater sensitivity at the lower end concentrations as well as the advantage of having a heated source. A cross validation showing comparable sample results between the instruments is displayed in Figure 1. The Vantage was coupled with an Accela® pump and a PAL® Autosampler from CTC Analytics and operated in positive ESI mode for this analytical method. A 20 µL PEEK loop was used for sampling and data were acquired with Xcalibur™2.0.7 software from ThermoScientific. Chromatography was achieved on a Develosil C30 Reversed-Phase-Aqueous, 140Å, 150-2.0mm, 3µm particle size column purchased from Phenomenex (Torrance, CA). The mobile phase consisted of 2% acetonitrile and 0.1% formic acid in UP water at an isocratic flow of 200 µl/min. The column temperature was approximately 40°C, sample temperature approximately 20°C and the run time was 4 minutes. Each injection was followed by a strong (50% acetonitrile:50% UP water with 0.1% formic acid) and weak (10% Methanol: 90% UP water) needle wash. The spray voltage was 4000 V, sheath gas (nitrogen) 35 arbitrary units, aux gas (nitrogen) 5 arbitrary units, vaporizer temperature 250°C, chrom filter peak width 10.0 s, collision gas (argon) pressure 1.0 m Torr, declustering voltage 5V, SRM, scan width 0.002 m/z, scan time 0.200 s, peak width Q1:0.7 FWHM, Q3: 0.7 FWHM. The SRM parameters are shown in Table 1.
Figure 1.

Cross-Validation Data: 240 samples (6 runs) total were extracted then run on both the Quantum and Vantage. Vantage results are on the Y-axis and Quantum results are on the X-axis in pmol/sample
Table 1.
SRM Parameters
| Vantage | |||||||
|---|---|---|---|---|---|---|---|
| Parent(m/z) | Product(m/z) | CE (V) | S Lens | Start | Stop | Pol | |
| 245.110 | 113.100 | 13 | 45 | 0.0 | 7.00 | + | RBV |
| 250.110 | 113.100 | 13 | 45 | 0.0 | 7.00 | + | RBV-IS |
3 Validation and Results
3.1 Preparation of Phosphate Moieties from Intracellular Matrices
Details of the development of the QMA separation method followed by dephosphorylation are available in Bushman, et. al [11]. Endogenous nucleotides and available nucleos(t)ide analogs (NAs) were utilized to validate the isolation of MP, DP, and TP fractions from the QMA strong anion exchange cartridges. These conditions were optimal for the endogenous compounds adenosine (A), 2’deoxyadenosine (dA), guanosine (G), 2’deoxyguanosine (dG), cytidine (C), 2’deoxycytidine (dC), uridine (U) and thymidine (T). The fact that G and A (the two endogenous compounds which RBV most closely resembles [2]) both performed well under these conditions indicated that RBV would perform as expected under these elution conditions. Dephosphorylation was performed by incubation at 37°C with excess acid phosphatase enzyme for 1 hour [11].
3.2 Matrix effect, Recovery, and Process Efficiency
The matrix effect (ME), recovery (RE), and process efficiency (PE) of parent RBV from isolated hPBMC matrix on the PBA SPE optimized procedure were determined at three concentrations: 2.50, 25.0 and 100 pmol per sample. Three different lots of hPBMC were processed in triplicate through the QMA extraction, dephosphorylation process, and PBA extraction for preparation of each concentration level. Peak response from extracted (Set 3) sample (both QMA and PBA SPE) was compared to neat (UP water) samples (Set 1) and post extraction spiked (Set 2) blank sample. ME was determined by comparing the RBV response from Sets 1 and 2. RE was determined by comparing the response from Sets 2 and 3, and PE was determined by comparing the response from Sets 1 and 3. Slopes were generated for each of the three different lots of hPBMC extracted based upon the three concentrations tested and peak area ratio. The ME was 83% / 80%, RE 47% / 44%, and PE 39% / 35% for the analyte and the isotopic internal standard, respectively. The CV of the three accuracy and precision run slopes was well within the acceptance criteria (CV<5%) at 0.94% among the lots indicating a lack of significant matrix effect.
3.3 Accuracy and Precision
Accuracy and precision were determined by replicate analysis (n=5) of each of the 4 QC levels described above in five or more separate analytical runs. Acceptance criteria were ±15% for both accuracy (compared to nominal) and precision determinations at all concentrations except at the lower limits of quantitation where ±20% was allowed as outlined in the FDA guidelines [17].
Standard curves for RBV were found to be best fit by linear regression with 1/concentration weighting. The curve for RBV was linear between 0.5 and 200 pmol/sample. Details of standard performance are outlined in Table 2. Inter-assay accuracy was within ±2.5% and precision within 9.7% for back-calculated standards over seven analytical runs. The CV for slopes and the mean of the R2 were 1.4% and 0.9996, respectively. One calibrator at 5.00pmol/sample from validation run 3 and one calibrator at 0.5 pmol/sample from validation run 4 were excluded from their respective curves as they were both outside the assay acceptance criteria. All other calibrators met acceptance criteria.
Table 2.
Standard and QC Performance
| Back Calculated Calibration Standards | RBV |
|---|---|
| Calibration Standard Range | 0.5–200 pmol/spl |
| Interassay Accuracy (% Dev ) (n=7) | −2.5 to 2.5 |
| Interassay Precision (%CV ) (n=7) | 1.1 to 9.7 |
| Slope Mean (n=7) | 0.0995 |
| Slope Precision (%CV) (n=7) | 1.4 |
| Coefficient of Determination (r2) Mean (n=7) | 0.9996 |
| Quality Control Accuracy and Precision | RBV |
| Quality Control Level 1 (LLOQ) | 0.5 pmol/spl |
| Interassay Accuracy (%Dev) (n=15) | 4.5 |
| Interassay Precision (%CV) (n=15) | 7.8 |
| Intraassay Accuracy (%Dev)(n=5) | −1.7 to 10.0 |
| Intraassay Precision (%CV) (n=5) | 2.5 to 8.7 |
| Quality Control (Low) | 1.5 pmol/spl |
| Interassay Accuracy (%Dev) (n=25) | 6.2 |
| Interassay Precision (%CV) (n=25) | 5.5 |
| Intraassay Accuracy (%Dev)(n=5) | 1.7 to 11.0 |
| Intraassay Precision (%CV) (n=5) | 3.0 to 6.2 |
| Quality Control (Medium) | 15 pmol/spl |
| Interassay Accuracy (%Dev) (n=25) | 7.7 |
| Interassay Precision (%CV) (n=25) | 2.6 |
| Intraassay Accuracy (%Dev)(n=5) | 6.3 o 9.0 |
| Intraassay Precision (%CV) (n=5) | 1.0 to 3.6 |
| Quality Control (High) | 150 pmol/spl |
| Interassay Accuracy (%Dev) (n=25) | 6.6 |
| Interassay Precision (%CV) (n=25) | 2.8 |
| Intraassay Accuracy (%Dev)(n=5) | 5.7 to 8.3 |
| Intraassay Precision (%CV) (n=5) | 1.7 to 4.2 |
The intra-assay and inter-assay accuracy and precision based upon the QCs are also shown in Table 2. The greatest mean inter-assay percent deviation was 7.7%. The greatest mean inter-assay %CV was 7.8%. The greatest mean intra-assay percent deviation was 11.0%. The greatest mean intra-assay %CV was 8.7%. Based upon assay performance the LLOQ was defined as 0.5 pmol/sample with greatest %CV at 7.8% and accuracy within ±10.0% of nominal. Typical chromatograms at the reported LLOQ are shown in Figure 2.
Figure 2.
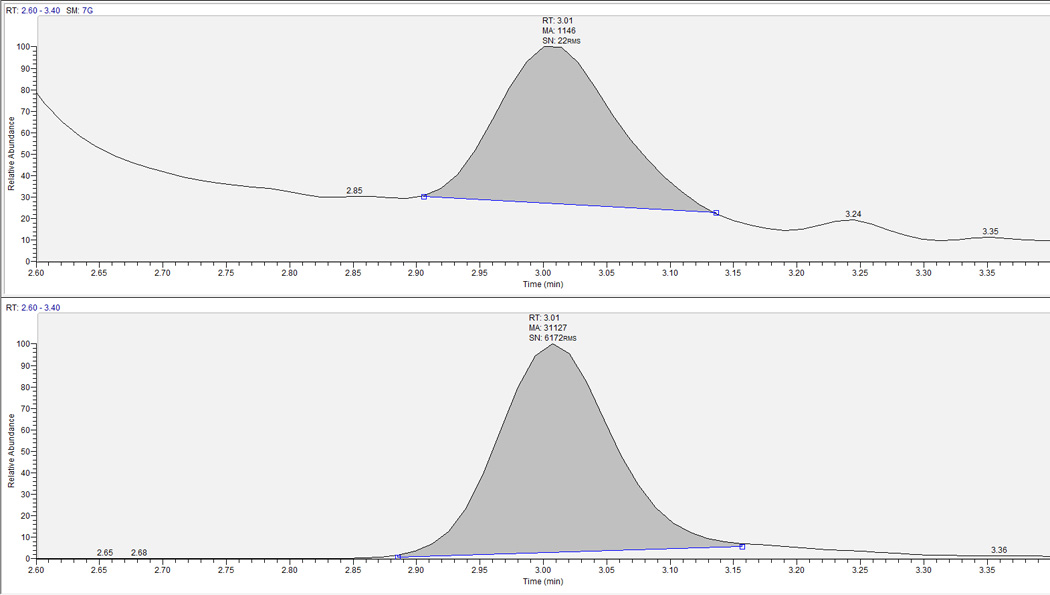
LLOQ chromatograph for RBV. Top panel is analyte, bottom the corresponding internal standard. Y-axis is relative abundance to 100%. Retention time was ∼3.0 for both RBV and RBV-IS.
3.4 Method Suitability; Alternative matrices
Several different cellular matrices for this method were evaluated. These were considered hPBMC and RBC MP, DP, TP fractions as well as RBC lysate derived from DBS. Non-RBV treated hPBMCs were lysed and utilized for blanks and for spiking calibration standards. The accuracy and precision for the alternative matrix testing was generated from three different lots each of hPBMC and RBC using two concentrations (2.50 pmol/sample and 100 pmol/sample). Acceptance criteria were ±15% for both accuracy (compared to nominal) and precision determinations. DBS matrix was compared to RBC lysate as described in section 4.5.
The alternative matrices results are presented in Table 3. The accuracy across all matrices for RBV ranged from −6.1% to 9.5%. The precision (%CV) for these determinations was within 9.3% for all matrices. These data support the method’s ability to accurately and precisely determine parent RBV from alternative matrices.
Table 3.
Alternative Matrices Accuracy and Precision
| Low Concentration Tested |
2.5 pmol/sample | |
|---|---|---|
| Accuracy | Precision | |
| hPBMC MP Fraction | 3.40% | 4.00% |
| hPBMC DP Fraction | 9.50% | 4.40% |
| RBC MP Fraction | 6.60% | 5.60% |
| RBC DP Fraction | −0.50% | 3.50% |
| RBC TP Fraction | 3.50% | 4.10% |
|
High Concentration Tested |
100 pmol/sample | |
| Accuracy | Precision | |
| hPBMC MP Fraction | 5.30% | 2.60% |
| hPBMC DP Fraction | 2.90% | 4.90% |
| RBC MP Fraction | 5.30% | 1.50% |
| RBC DP Fraction | −6.10% | 2.60% |
| RBC TP Fraction | 0.30% | 9.30% |
3.5 Specificity and Cross-talk Evaluation
Specificity was determined by injecting n=6 lots each of blank hPBMC and RBC MP, DP, and TP and monitoring for analytes. The 200 pmol/sample standard with no IS and blank with IS only were used to evaluate cross-talk between RBV and RBV-IS. To evaluate carry over, blank water was injected after the high concentration samples to check for signal in the blank injection. A blank sample as well as a blank sample with IS were added to each analytical run in order to observe specific response within each run. No detectable response was observed in the RBV analyte window for the 6 lots of hPBMC or RBC MP, DP, or TP. A typical blank with IS chromatogram is shown in Figure 3. No significant (>20% of LLOQ) cross-talk or carry over was observed between or among RBV and RBV-IS.
Figure 3.
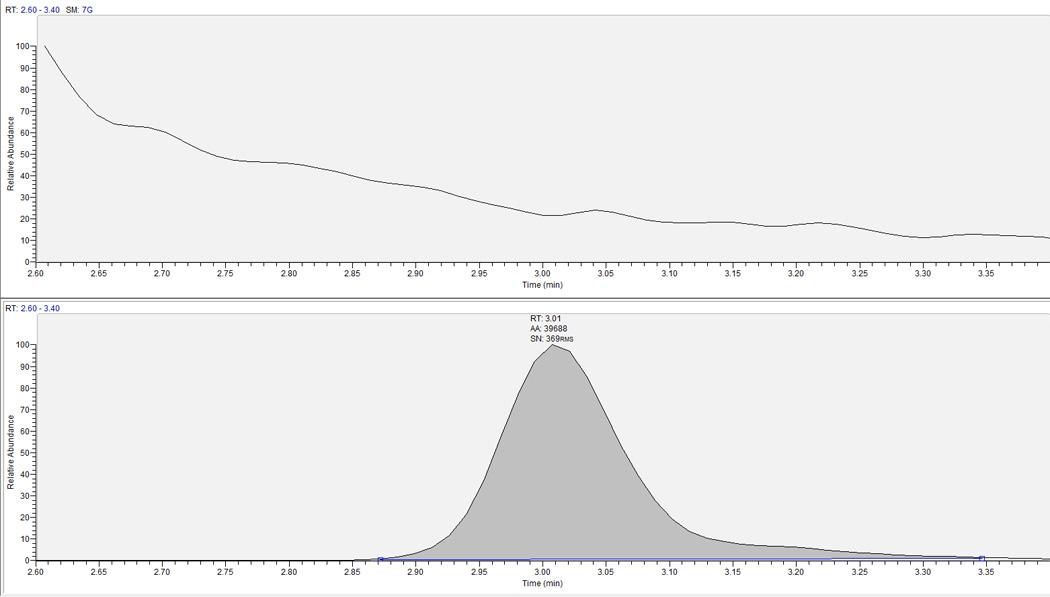
Blank-IS chromatograph for RBV. Top panel is analyte, bottom panel is the corresponding internal standard. Y-axis is relative abundance scaled to LLOQ response. Expected retention time for RBV/RBV-IS is ∼3.0 minutes.
3.6 Effect of cell number
The ability to quantitate RBV in low cell numbers or high cell numbers is an important consideration for this method because the number of cells assayed can be altered to allow for results to fall within the acceptable reportable range. Additionally, because RBV accumulates extensively in RBC, the amount of cells to be assayed at first dose is much higher than the number assayed at steady state in order to observe reportable concentrations. The accuracy and precision for RBV (10 pmol/sample) was determined from lysed intracellular matrix containing 0.1, 1.0, and 10 million cells. Acceptance criteria were ±15% for both accuracy (compared to nominal) and precision determinations. The results are shown in Table 4. The mean accuracy for all cell number experiments ranged from −6.0% to −8.6%. The precision was within 10.2%.
Table 4.
hPBMC Cell Number Accuracy and Precision
| Concentration tested (n=3,10 pmol/sample) | ||
|---|---|---|
| Accuracy | Precision | |
| 0.1 million cells extracted | ||
| −6.00% | 3.20% | |
| 1.0 million cells extracted | ||
| −8.60% | 1.30% | |
| 10 million cells extracted | ||
| −7.60% | 10.20% | |
3.7 Stability of RBV and RBV-TP
Conditional RBV-TP and parent RBV stabilities were determined by assessing freeze/thaw stability, room temperature stability, and extracted sample stability. QC Low and QC High were used to assess the effects of four freeze/thaw cycles followed by QMA and PBA extraction in triplicate. To assess room temperature stability, QC Low and QC High were exposed to ambient conditions for 120 hours prior to extraction in triplicate. The mean response was compared to control for QC Low and QC High that did not undergo treatment conditions. Extracted sample stability was determined by preserving three replicate QC Low and QC High samples from one of the accuracy/precision validation runs in the autosampler for 1 week which was maintained at 15–20°C. These samples were injected with a separate run that occurred 1 week later. Mean response was compared to both nominal and mean response from freshly prepared QC Low and QC High that were not subjected to the test condition. Table 5 shows results from these conditional stability experiments with the greatest deviation from control in all three experiments ranging from −2.5% to 2.0%.
Table 5.
Conditional Stability
| Freeze/Thaw Cycles (n=4 cycles) | %Diff vs Control |
|---|---|
| QC Low | −2.00% |
| QC High | 2.00% |
| 120 Hour Room Temperature | |
| QC Low | 1.20% |
| QC High | 0.10% |
|
1 Week Extracted Sample-Autosampler (15°C) |
|
| QC Low | −0.80% |
| QC High | −2.50% |
Long term stability of parent RBV preparation stocks and working stocks in water stored at 4°C was assessed by comparing the peak responses of current stock solutions to the peak responses from stock solutions that had been in storage for various lengths of time. RBV preparation stock solutions in water at −20°C were shown to be stable for up to 3.58 years. RBV stock solutions of all concentrations in water at 4°C were shown to be stable for up to 4 years.
Long term stability of RBV-TP preparation and working stocks (at −80°C in water) was determined from purity/potency experiments showing stability up to 3.3 years. Long term stability data for RBV-TP in lysed intracellular matrix (−80°C) compiled from quality controls has shown stability for up to 1.5 years. Additional long term stability data will continue to be generated. These experiments support stability of analytes in storage, and under various conditions commonly encountered in laboratories.
3.8 Clinical application; Analysis of in vivo samples
The method was used to analyze samples containing RBV, RBV-MP, RBV-DP and RBV-TP in hPBMCs and RBCs collected from HCV infected subjects undergoing RBV therapy in a controlled clinical trial. The samples were collected in accordance with protocols that were approved by the Colorado Multiple Institutional Review Board (COMIRB), and all subjects gave written informed consent. Subjects received standard RBV doses and provided blood samples on one or more study visits. Collection consisted of eight mL of blood drawn into a heparin Cell Preparation Tube at specific time points following the dose. Both hPBMC and RBC were harvested from these samples as described previously [11].
The method has been applied to >317 hPBMC samples and >317 RBC samples to quantify RBV-MP, DP and TP. 1.0–5.0 million cells were typically assayed for RBC samples; 1.0- 2.0 million cells were typically assayed for hPBMC samples. As few as 0.5 million cells have been successfully assayed. Ranges for RBV values for one completed study with 36 subjects and 634 combined RBC and hPBMC samples are as follows; 0.108 to 60.5 pmol/106 cells for RBV-MP, 0.101 pmol/106 cells to 60.0 pmol/106 cells for RBV-DP and 0.303 to 359 pmol/106 cells for RBV-TP in RBCs. In hPBMCs, the range was 0.267 to 84.7 pmol/106 cells for RBV-MP, 0.252 pmol/106 cells to 32.2 pmol/106 cells for RBV-DP and 0.333 to 79.9 pmol/106 cells for RBV-TP. Typical patient chromatographs for hPBMC-TP and RBC-TP are shown in Figure 4 and Figure 5.
Figure 4.
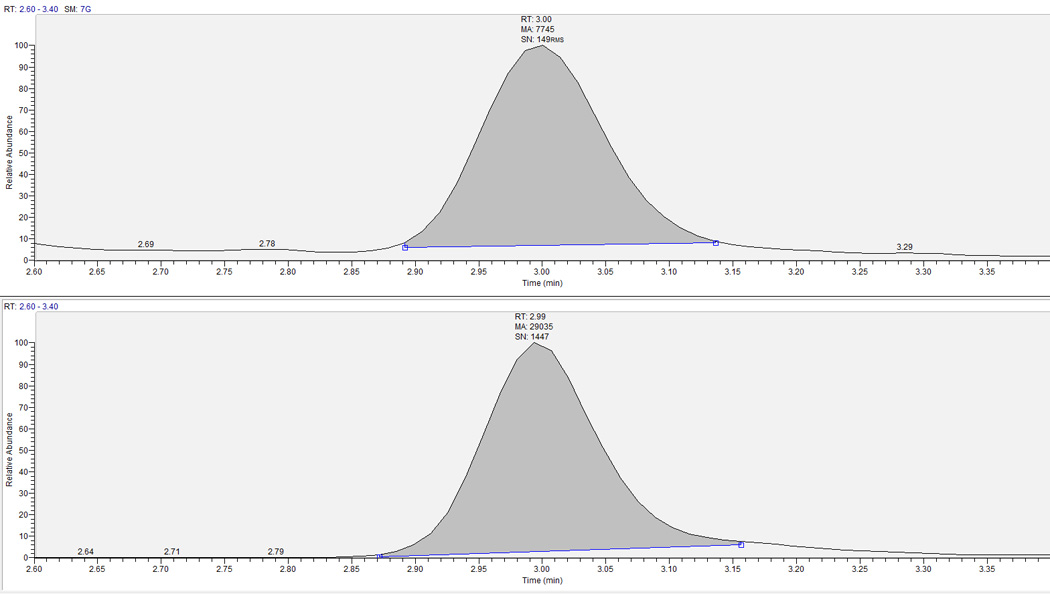
Extracted clinical research sample chromatograph for RBV in hPBMC. Top panel is the analyte and bottom is corresponding IS. RBV-TP retention time is ∼3.0 minutes. This sample had a RBV-TP concentration of 3.14 pmol/106 cells.
Figure 5.
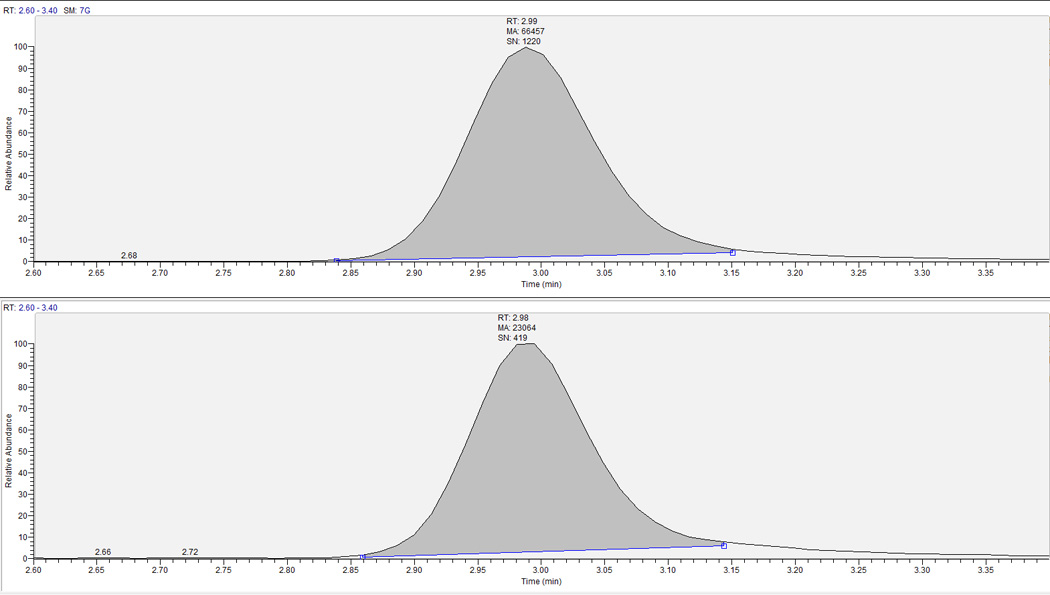
Extracted clinical research sample chromatograph for RBV-TP in RBC. Top panel is the analyte and bottom is corresponding IS. RBV-TP retention time is ∼3.0 minutes. This sample had a RBV-TP concentration of 34.2 pmol/106 cells.
4 Application to RBC Lysate Derived from DBS [13]
DBS are useful for pharmacokinetic/dynamic studies because of their low cost, quick processing time, less invasive collection procedure and low blood volume requirement [18,19]. The latter is especially desirable for those on RBV treatment because of the unfortunate side effect of hemolytic anemia. Therefore, a validation of intracellular RBV-TP quantification from DBS was performed. Because QCs cannot be accurately created to mimic clinical specimens, the validation utilizes clinical patient samples obtained from approved IRB protocols. Because of this, only inter-assay and intra-assay precision data were generated with clinical samples in a wide range of RBV-TP concentrations. Storage stability, long term stability, whole blood stability, effect of spot volume, punch location and paired RBC analysis were assessed by comparison to controls (% difference) to determine the ability to quantitate RBV-TP from DBS lysate. The SPE steps were identical to hPBMC and RBC lysate.
4.1 Precision
Precision data for DBS study samples (n=3 subjects) obtained at four, 24, and 35 weeks after initiating RBV-based HCV treatment are shown in Tables 6a and 6b. Samples were extracted at n=6 per subject in three separate analytical runs. Intra-assay precision ranged from 3.3% to 9.4% and inter-extraction precision ranged from 6.2% to 7.8%. Both measurements are well within the ±15% acceptance criteria. Mean concentrations for each subject were 793,152 and 1046 pmol/punch for the week 4, week 24 and week 35 samples, respectively. The subject sampled at week 24 had medication adherence problems which explained the lower than expected concentrations compared to the week 4 and week 35 data which are consistent with daily weight based RBV dosing. A representative chromatogram of a sample extracted from DBS is shown in Figure 6. Multiple cards were spotted per sample in order to test various conditions such as storage at different temperatures. It is therefore important to assess whether different cards have an effect on precision and accuracy of analyzed samples. Samples (n=3 per card) from two of the above precision runs were utilized to evaluate inter-card precision. The difference between card responses was within acceptance criteria at ±6.5% difference.
Table 6.
Precision of DBS patient samples: inter-assay statistics
| RBV-TP | |||
|---|---|---|---|
| Inter-assay | CAVP #345, W35 −20°C | CAVP #380, W4 −20°C | CAVP #391, W24 −20°C |
| Statistics (Inter-Extraction #) |
RBV pmol/punch |
RBV pmol/punch |
RBV pmol/punch |
| Mean | 1046 | 793 | 152 |
| STDEV | 64.7 | 61.9 | 11.6 |
| %CV | 6.2 | 7.8 | 7.6 |
| n | 6 | 6 | 6 |
|
Intra-Assay Statistics |
RBV pmol/punch |
RBV pmol/punch |
RBV pmol/punch |
| Val 1 | |||
| Mean | 1059 | 756 | 162 |
| STDEV | 67.2 | 71.0 | 10.9 |
| %CV | 6.3 | 9.4 | 6.8 |
| n | 6 | 6 | 6 |
| Val 2 | |||
| Mean | 1017 | 832 | 146 |
| STDEV | 72.35 | 52.74 | 11.33 |
| %CV | 7.1 | 6.3 | 7.8 |
| n | 6 | 6 | 6 |
| %dif to val 1 | −3.88 | 10.1 | −10.0 |
| Val 3 | |||
| Mean | 1062 | 790 | 148 |
| STDEV | 54.76 | 41.40 | 4.82 |
| %CV | 5.2 | 5.2 | 3.3 |
| n | 6 | 6 | 6 |
| %dif to val 1 | 0.304 | 4.44 | −8.67 |
Figure 6.
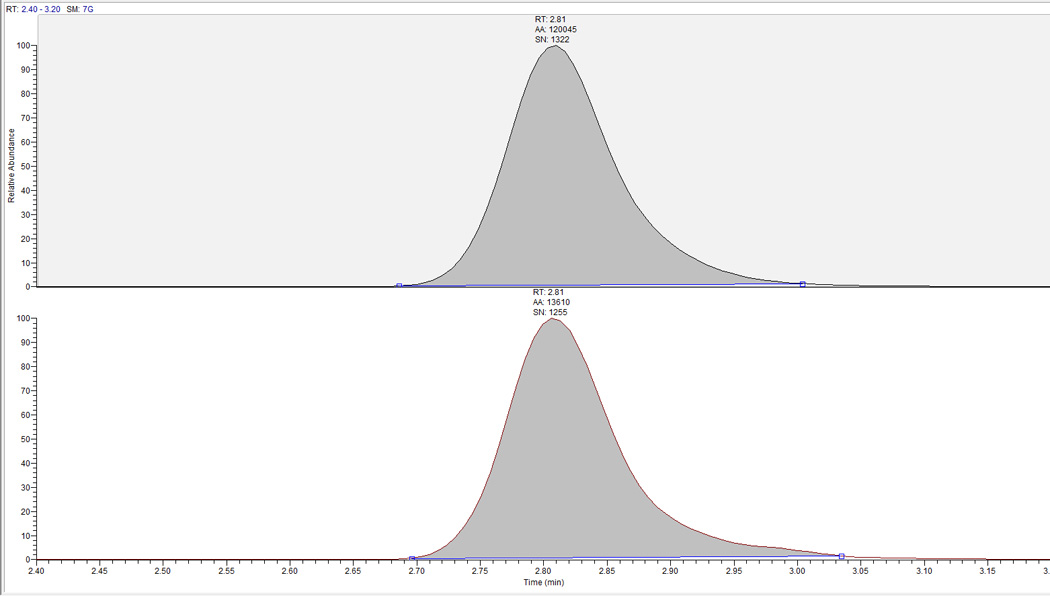
Extracted clinical research sample chromatograph for RBV-TP from DBS RBC lysate at week 35 post initial RBV dose. RBV-TP retention time is at ∼2.8 minutes and the sample was quantified at 1044 pmol/punch.
4.2 Conditional and Long Term Stability of DBS
Two of the clinical samples from section 4.1 (week 4 and week 24) were subjected to three freeze/thaw cycles (−20°C to room temperature) to test stability for multiple extractions. Extraction was performed in triplicate sets for each freeze/thaw cycle. Precision was within the 15% acceptance range for all samples after freeze/thaw cycle three (within 5.5%) with the percent difference to control (cycle zero) within ±14.1%.
Long term storage stability was tested with samples stored at room temperature, 4°C, −20°C and −80°C. Samples stored for 196 to 310 days at −20°C were comparable to paired samples stored at −80°C but trended towards decreased RBV-TP levels when stored at 4°C for this time period with the greatest decrease at −20.1%. Paired room temperature samples decreased in concentration up to −83.4% for this time frame (Figure 7). To further test room temperature stability, two additional patient samples were spotted. Compared to immediate extraction in 70:30 lysate, samples were stable for up to 28 days without desiccant or storage bag for higher concentrations (±10.2% of control) and slightly out of acceptance for lower concentrations at −15.9% compared to control at 28 days. These results suggest storage at −80°C or −20°C is ideal although samples may remain at room temperature for 28 days or less prior to −20°C or −80°C storage.
Figure 7.
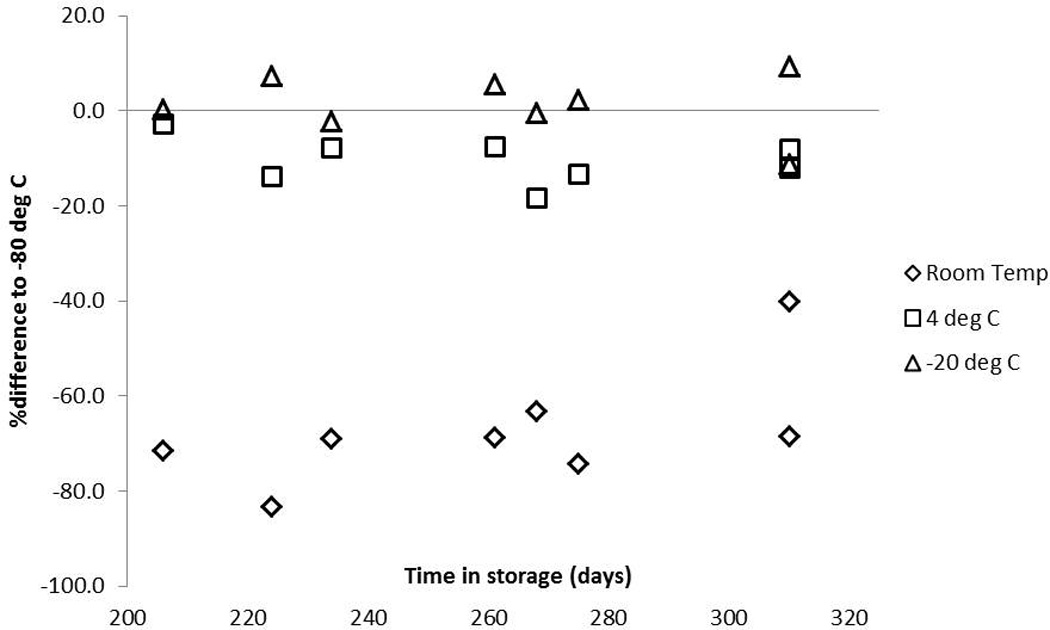
Effect of different storage conditions on RBV-TP from DBS lysate when stored for 196 to 310 days. The Y-axis represents the percent difference from storage at −80°C and the X-axis is storage time in days. Triangles=-20°C storage, squares=4°C storage and diamonds=room temperature storage.
4.3 Stability in Whole Blood Prior to Spotting
Since RBV is trapped in the RBC component of whole blood after phosphorylation, it is important to consider how long it will remain stable in whole blood at room temperature prior to processing/spotting on DBS paper. To evaluate this issue, 4 subject samples with n=3 K2EDTA 4 mL blood draw tubes were obtained. The first tube was processed as quickly as possible post collection and considered to be T=0 hours at room temperature (control). The second tube remained at room temperature for 24 hours (T=24) and the third remained at room temperature for 48 hours (T=48) prior to spotting on DBS cards. Compared to control, both the T=24 and T=48 hour samples for all four subjects failed with up to 92.3% and 95.0% decreased RBV-TP levels, respectively. This is most likely due to lysing of the RBC as samples sat in ambient conditions. This result suggests that immediate processing of samples is ideal, but further testing should be performed with this intracellular method. Tests performed with a validated RBV parent DBS assay [14] in our lab show that RBV may continue to be transported into RBCs as samples sit in ambient conditions prior to spontaneous cell lysis. Samples collected from 30 min, 1, 2, 3, 4, 5, 7, 17, and 24 hours were analyzed to evaluate a more definitive amount of time advisable at room temperature prior to spotting. Variable data were seen after samples sat at room temperature for longer than 2 hours with 4 hours being the maximum time before RBV parent decreased beyond −15%. Samples spotted at five hours post collection deviated by −21.1% compared to control, but parent concentrations rose considerably (370%-470%) at 17 and 24 hours at room temperature prior to spotting. We suspect this increase is from lysis of RBCs and subsequent dephosphorylation of RBV-MP, DP and TP. This result suggests that spotting cards from collected blood tubes should be performed within two hours of receiving the sample to obtain the most accurate results.
4.4 Effect of Spot Volume and Punch Location
Because the entire spot is not extracted for this method, it is important to assess DBS specific criteria that may have an effect on the quantitation of RBV-TP [18]. Three patient samples with spot volumes from 10 to 60 µL (10, 15, 30, 45 and 60) were prepared for this assessment giving low and high concentrations of RBV-TP from week 4 to week 35 of treatment. Punches were taken from the center of the spot because the 10 and 15 µL spots are too small to punch from the edge. The 30 µL spot was used as a control. All volumes tested within ±13.7% of control except for the 10 µL spot (−15.1%). The 60 µL spot was also utilized to assess the effects of punching from the edge (control) of a spot vs. the center. All samples were within acceptance criteria at ±14.3%. These data show that volumes from 15 to 60 µL and punches from the edge of a spot will produce data within acceptable criteria. These evaluations are important for a clinical setting where capillary blood may be spotted from a finger stick instead of obtaining a blood draw tube for spotting. The finger stick spots are smaller than 30 µL on average and less symmetrical than pipetted venous blood, but both vary depending on the specimen. When this method was applied to DBS from capillary blood (i.e. finger stick instead of pipetted from blood tube) results were typically lower than the paired pipetted sample. Regression analysis of 10 paired samples yielded an r2=0.89 and y=0.902X showing that capillary blood is comparable to venous blood samples, but the variability of the finger stick spots should be taken into consideration when analyzing data (Figure 8). Further data for this comparison will continue to be generated to better characterize capillary vs. venous blood as more samples are obtained.
Figure 8.
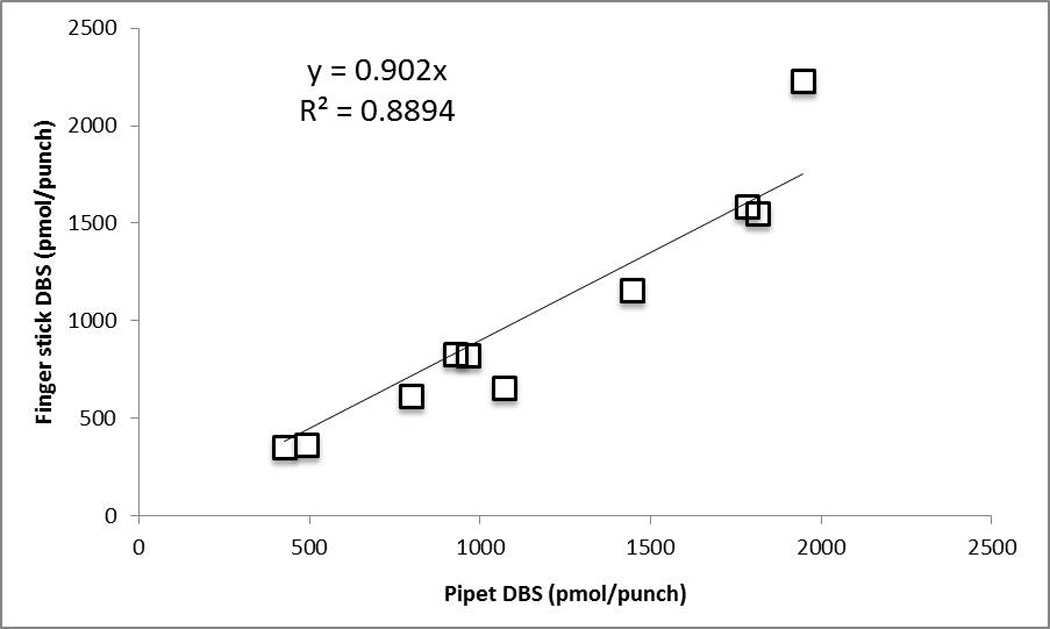
Paired finger stick and pipetted blood samples. Y-axis represents finger stick and X-axis is pipetted venous blood in pmol/punch. R2 =0.89 and Y=0.902x after performing regression analysis.
4.5 Paired Analysis of DBS and RBC Lysate
To show that DBS is a viable alternative matrix for analyzing RBV-TP in RBCs, 27 paired DBS/RBC samples from 13 patients at first RBV dose to week 48 of RBV treatment were chosen for analysis. Linear regression yielded an r2 of 0.95 and y=8.6646x (Figure 9). The paired samples also allowed a way to calculate the approximate amount of cells present per punch DBS by dividing the pmol/punch result by the pmol/106 cells result. This procedure yielded an average of 9.19 ± 2.13 million cells per 3 mm punch. Overall, this method validation with DBS shows that it is a suitable alternative for the RBC matrix and should be considered for future pharmacokinetic/dynamic analyses of RBV-TP.
Figure 9.
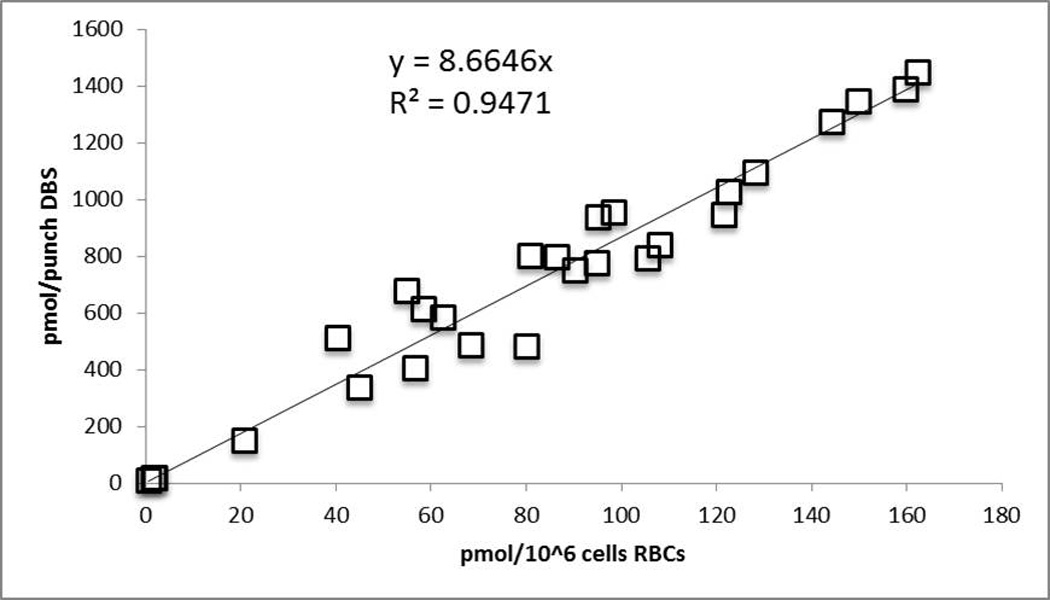
Paired RBC to DBS analysis. DBS in pmol/punch is on the Y-axis and RBC in pmol/million cells is shown on the X-axis. R2=0.95 and y=8.66x after performing regression analysis.
5 Discussion
We have developed and validated an LC-MS/MS method for the study of the intracellular pharmacology of RBV. This method is capable of measuring the individual MP, DP and TP moieties in 70:30 lysate from RBC, hPBMC and DBS. The QMA extraction procedure was optimized during our laboratory’s validation process for a multi-analyte nucleotide analog quantitation assay [11]. For the desalting and concentration segment of the RBV assay, SPEs from different manufactures and with different sorbents and barrel sizes were evaluated, with initial focus on the Phenomenex Strata-X. This is the cartridge we used for other NAs and the hope was to incorporate RBV into the existing multi-analyte assay, since the same QMA procedure is used for all NA phosphate moiety separations. Unfortunately, due the comparatively more polar nature of RBV compared to other nucleoside analogs, the retention on the Strata-X was poor. The Strata-X contains a reverse phase packing with similar principles of separation to that of the liquid chromatography portion of the assay. Because RBV is more polar than the other analytes described in Bushman et al, this SPE type was not ideal for the desalting step. The Varian Bond-Elut LRC PBA was the next logical choice to evaluate for sufficient retention of RBV based on the PBA cartridge’s successful use in retaining RBV in other publications [9,10,16]. Instead of reverse phase separation, PBA uses reversible covalent bonding with sufficient affinity for aromatic o-hydroxy compounds; the two hydroxyl groups on the immobilized phenylboronic acid molecule bond covalently to diols such as RBV under alkaline conditions [16]. Many other nucleotide analogues are deoxyribonucleotides and so lack the correct structure to covalently bind to the PBA packing. Due to this covalent bonding, Bond-Elut LRC PBA ultimately displayed the necessary retention and specificity for this assay. Since the samples yielded by QMA extraction are 2–7mL in volume, the Bond-Elut LRC PBA proved especially useful as it is available with a 10 mL barrel. This cartridge has performed very satisfactorily for this assay.
While the issue of RBV retention on an SPE column was settled, the issue of removing the concentrated salt necessary to the QMA separation of TP moieties while maintaining adequate RBV retention remained. During development on the TSQ Quantum® triple quadrupole mass spectrometer, salt accumulation in the source was observed which caused critical decreases in signal due to clogging of the ion transfer tube. This was exhibited by fore pump pressure drops of as much as 0.5 Torr through the course of an average 50-injection run. Cartridge drying between washes and addition of 3.0 mL UP water somewhat mitigated the salting observed in the Quantum source. Additional washes of the cartridges with the aqueous wash solution (250mM ammonium acetate, pH 8.5) alleviated the salting further but caused asymmetrical peaks. The water wash was observed to nullify the salting effect and the resulting drop in fore pressure without this peak distortion, enabling completion of analytical runs without significant intra-assay drops in signal and fore pump pressure. Methanol washes (100%) further desalted and purified the sample, and final RBV elution was performed with 20% formic acid in methanol to release the covalent bond by acidifying the boronate complex [16]. A material overall decrease in analyte retention was observed after the introduction of the water wash, resulting in decreased analytical signal and a process efficiency of 13%. However, the signal remained uniform within the run and the analyte/internal standard ratio was satisfactorily preserved, along with favorable linearity of the standard curve and acceptable performance of the QC samples. Addition of 1.5 mL of 250 mM ammonium acetate, pH 8.5 to the sample before loading onto the cartridge boosted retention on the sorbent through the vigorous wash schedule and increased overall process efficiency from 13% to 39%. The sensitivity and precision of this assay was maintained through the use of the isotopic internal standard which greatly reduces assay instability due to procedural variation, matrix effect, and other factors that can alter the analytical performance or outcome [11].
Suitable chromatography was the final step for this method validation. Once RBV was separated from the endogenous NAs procedurally, it was determined that it would need to be separated analytically as well. To do this a Develosil C30 Reversed-Phase-Aqueous, 140Ǻ, 150-2.0mm, 3µm particle size column was used to produce uniformly Gaussian peak shape and to resolve RBV’s one major chromatographic issue of having parent and product masses shared with the endogenous compound, uridine. Unlike other procedures published, an isotope of RBV itself (13C5) was used in this assay to mimic extraction and analytical conditions instead of uridine analogous IS [10]. However, uridine remained present in the analytical window. Formulating a mobile phase to achieve ideal separation from uridine eliminated interference with RBV or RBV-IS. The mobile phase that best suited these conditions proved to be 0.1% formic acid and 2% acetonitrile in UP water at an isocratic flow rate of 0.2 mL/min. Uridine typically elutes off the column 1.5 to 2 minutes later than RBV when applying these conditions.
Finally, the method was successfully applied to clinical research samples of hPBMCs, RBCs, DBS and for the isolation and quantification of RBV- MP, -DP, and -TP. The recovered concentrations were illustrative of the higher sensitivity of this method compared to previous methodologies [9,10,20]. This demonstrates the value of this method in developing pharmacokinetic profiles unique to in vivo cell type and with respect to the amount of RBV used in clinical dosing as opposed to the higher doses used in cell culture or incubation.
In conclusion, a new methodology was developed and validated that provides the sensitivity required to detect RBV at intracellular levels in a range that is clinically relevant. This method also demonstrates the ability to quantify the individual RBV-MP, -DP and -TP moieties as well as accurately and precisely measure drug in hPBMC, RBC and DBS of varying cell numbers.
Highlights.
Novel approach for separating phosphate moieties for analysis with LC-MS/MS
Precise, accurate and highly sensitive method for measuring all intracellular ribavirin forms
Valid method for quantitation of multiple cellular matrices including dried blood spots
Stable for freeze/thaw and multiple storage conditions in all matrices
Acknowledgments
Funding Source: This work was supported by the National Institute of Diabetes and Digestive and Kidney Diseases at the National Institutes of Health (K23 DK082621 to J.J.K), the International Maternal Pediatric Adolescent AIDS Clinical Trials Network (UM1AI068632 to J.J.K.), and the NIH/NCATS Colorado CTSI (UL1 TR001082). The content is solely the responsibility of the authors and does not necessarily represent the official views of the National Institutes of Health.
Footnotes
Publisher's Disclaimer: This is a PDF file of an unedited manuscript that has been accepted for publication. As a service to our customers we are providing this early version of the manuscript. The manuscript will undergo copyediting, typesetting, and review of the resulting proof before it is published in its final citable form. Please note that during the production process errors may be discovered which could affect the content, and all legal disclaimers that apply to the journal pertain.
Abbreviations: RBV, ribavirin; NA, nucleoside analog; MP, monophosphate; DP, diphosphate; TP, triphosphate; IS, internal standard; hPBMC, human peripheral blood mononuclear cells; SPE, Solid Phase Extraction; RBC, red blood cells; DBS, dried blood spots; UP, ultrapure; LC-MS/MS, liquid chromatography-tandem mass spectrometry; LLOQ, lower limit of quantitation; CV, coefficient of variation; A, adenosine; dA, 2’deoxyadenosine; G, guanosine; dG, 2’deoxyguanosine; C, cytidine; dC, 2’deoxycytidine; T, thymidine; U, uridine; QC, quality control; ME, matrix effect; RE, recovery; PE, process efficiency; STD, standard; ULOQ, upper limit of quantification; pmol, picomole; HPLC, high pressure liquid chromatography; HCV, hepatitis C virus
Conflict of Interest: None to declare.
Contributor Information
Leah C. Jimmerson, Email: leah.jimmerson@ucdenver.edu.
Michelle L. Ray, Email: michelle.ray@ucdenver.edu.
Lane R. Bushman, Email: lane.bushman@ucdenver.edu.
Peter L. Anderson, Email: peter.anderson@ucdenver.edu.
Brandon Klein, Email: brandon.klein@ucdenver.edu.
Joseph E. Rower, Email: joseph.rower@ucdenver.edu.
Jia-Hua Zheng, Email: jia-hua.zheng@ucdenver.edu.
Jennifer J. Kiser, Email: jennifer.kiser@ucdenver.edu.
References
- 1.Sidwell RW, Huffman JH, Khare GP, Allen LB, Witkowski JT, Robins RK. Science. 1972;177:705. doi: 10.1126/science.177.4050.705. [DOI] [PubMed] [Google Scholar]
- 2.Crotty S, Cameron C, Andino R. J Mol Med (Berl) 2002;80:86. doi: 10.1007/s00109-001-0308-0. [DOI] [PubMed] [Google Scholar]
- 3.Maag D, Castro C, Hong Z, Cameron CE. J Biol Chem. 2001;276:46094. doi: 10.1074/jbc.C100349200. [DOI] [PubMed] [Google Scholar]
- 4.Feld JJ, Hoofnagle JH. Nature. 2005;436:967. doi: 10.1038/nature04082. [DOI] [PubMed] [Google Scholar]
- 5.Lau JY, Tam RC, Liang TJ, Hong Z. Hepatology. 2002;35:1002. doi: 10.1053/jhep.2002.32672. [DOI] [PubMed] [Google Scholar]
- 6.Patil SD, Ngo LY, Glue P, Unadkat JD. Pharm Res. 1998;15:950. doi: 10.1023/a:1011945103455. [DOI] [PubMed] [Google Scholar]
- 7.Kiser JJ, Bushman LR, Anderson PL, Tise S, Klein B, Rower JE, Zheng J, Everson GT. 5th International Workshop on Clinical Pharmacology of Hepatitis Therapy. Boston, MA: 2010. [Google Scholar]
- 8.Loustaud-Ratti V, Carrier P, Rousseau A, Maynard M, Babany G, Alain S, Trepo C, De Ledinghen V, Bourliere M, Pol S, Di Martino V, Zarski JP, Pinta A, Sautereau D, Marquet P, group O. Dig Liver Dis. 2011;43:850. doi: 10.1016/j.dld.2011.04.002. [DOI] [PubMed] [Google Scholar]
- 9.Homma M, Jayewardene AL, Gambertoglio J, Aweeka F. Antimicrob Agents Chemother. 1999;43:2716. doi: 10.1128/aac.43.11.2716. [DOI] [PMC free article] [PubMed] [Google Scholar]
- 10.Melendez M, Rosario O, Zayas B, Rodriguez JF. J Pharm Biomed Anal. 2009;49:1233. doi: 10.1016/j.jpba.2009.02.006. [DOI] [PMC free article] [PubMed] [Google Scholar]
- 11.Bushman LR, Kiser JJ, Rower JE, Klein B, Zheng JH, Ray ML, Anderson PL. J Pharm Biomed Anal. 2011;56:390. doi: 10.1016/j.jpba.2011.05.039. [DOI] [PMC free article] [PubMed] [Google Scholar]
- 12.Canonico PG, Kastello MD, Spears CT, Brown JR, Jackson EA, Jenkins DE. Toxicol Appl Pharmacol. 1984;74:155. doi: 10.1016/0041-008x(84)90138-8. [DOI] [PubMed] [Google Scholar]
- 13.Zheng J, McAllister K, Castillo-Mancilla JR, Klein B, Rower C, Meditz A, Guida LA, Kiser JJ, Bushman LR, Anderson PL. 2014 doi: 10.1016/j.jpba.2016.01.038. [submitted] [DOI] [PMC free article] [PubMed] [Google Scholar]
- 14.Jimmerson LC, Zheng JH, Bushman LR, MacBrayne CE, Anderson PL, Kiser JJ. J Chromatogr B Analyt Technol Biomed Life Sci. 2014;944:18. doi: 10.1016/j.jchromb.2013.10.035. [DOI] [PMC free article] [PubMed] [Google Scholar]
- 15.King T, Bushman L, Kiser J, Anderson PL, Ray M, Delahunty T, Fletcher CV. J Chromatogr B Analyt Technol Biomed Life Sci. 2006;843:147. doi: 10.1016/j.jchromb.2006.05.043. [DOI] [PubMed] [Google Scholar]
- 16.Technologies VIA. Technical Note. 2010 [Google Scholar]
- 17.Viswanathan CT, Bansal S, Booth B, DeStefano AJ, Rose MJ, Sailstad J, Shah VP, Skelly JP, Swann PG, Weiner R. Pharm Res. 2007;24:1962. doi: 10.1007/s11095-007-9291-7. [DOI] [PubMed] [Google Scholar]
- 18.Li W, Tse FL. Biomed Chromatogr. 2010;24:49. doi: 10.1002/bmc.1367. [DOI] [PubMed] [Google Scholar]
- 19.Ji QC, Liu G, D'Arienzo CJ, Olah TV, Arnold ME. Bioanalysis. 2012;4:2059. doi: 10.4155/bio.12.168. [DOI] [PubMed] [Google Scholar]
- 20.Yeh LT, Nguyen M, Dadgostari S, Bu W, Lin CC. J Pharm Biomed Anal. 2007;43:1057. doi: 10.1016/j.jpba.2006.09.001. [DOI] [PubMed] [Google Scholar]