

Abstract
Down syndrome (DS) is caused by the triplication of human chromosome 21 (HSA21) and is the most common genetic cause of intellectual disability (ID), with individuals having deficits in cognitive function including hippocampal learning and memory and neurodegeneration of cholinergic basal forebrain neurons, a pathological hallmark of Alzheimer’s disease (AD). To date, the molecular underpinnings driving this pathology have not been elucidated. The Ts65Dn mouse is a segmental trisomy model of DS and like DS/AD pathology, displays age-related cognitive dysfunction and basal forebrain cholinergic neuron (BFCN) degeneration. To determine molecular and cellular changes important for elucidating mechanisms of neurodegeneration in DS/AD pathology, expression profiling studies were performed. Molecular fingerprinting of homogeneous populations of Cornu Ammonis 1 (CA1) pyramidal neurons was performed via laser capture microdissection (LCM) followed by terminal continuation (TC) RNA amplification combined with custom-designed microarray analysis and subsequent validation of individual transcripts by qPCR and protein analysis via immunoblotting. Significant alterations were observed within CA1 pyramidal neurons of aged Ts65Dn mice compared to normal disomic (2N) littermates, notably in excitatory and inhibitory neurotransmission receptor families and neurotrophins, including brain-derived neurotrophic factor (BDNF) as well as several cognate neurotrophin receptors. Examining gene and protein expression levels after the onset of BFCN degeneration elucidated transcriptional and translational changes in neurons within a vulnerable circuit that may cause the AD-like pathology seen in DS as these individuals age, and provide rational targets for therapeutic interventions.
Keywords: Alzheimer’s disease, BDNF, Down syndrome, glutamatergic neurotransmission, hippocampus, laser capture microdissection, murine model, neurotrophin
Introduction
The clinical entity of Down syndrome (DS) is the most frequent genetic cause of mental retardation with an increasing prevalence in the United States, with current estimates of 1 in 691 live births (Jacobs and Hassold 1995; Parker et al. 2010). The prevalence of this phenotype has risen dramatically within the last 40 years (31% increase from 1979 to 2003, http://www.cdc.gov/features/dsdownsyndrome/; CDC MMWR, 2006) and continues to rise. The triplication of human chromosome 21 (HSA21) engenders multi-modal impairments and deficits in DS individuals, notably decreased cognitive function and deficits in normal brain function, with abnormalities in hippocampal learning, memory, language, and communication skills (Chapman and Hesketh 2000; Esbensen 2010). The phenotype is presumed to be caused by overexpression of a proportion of the genes triplicated on the HSA21 chromosome, in which current estimates contains >550 genes and putative protein encoding gene transcripts, including >160 known protein encoding transcripts (Sturgeon and Gardiner 2011). In addition to impaired central nervous system (CNS) function during development and adult life, individuals with DS develop Alzheimer’s disease (AD) pathology in early middle age, including amyloid plaques, neurofibrillary tangles (NFTs), degeneration of cholinergic basal forebrain (CBF) neurons, and early endosomal abnormalities (Wisniewski et al. 1985; Mann et al. 1986; Leverenz and Raskind 1998; Cataldo et al. 2000; Nixon and Cataldo 2006). While there has been linkage of some triplicated genes to AD pathogenesis, including amyloid-beta protein precursor (APP; Cataldo et al. 2003; Salehi et al. 2006), the genetic underpinnings and mechanism of this early onset AD pathology remain unclear.
To study links between DS and AD, a variety of mouse models have been engineered that recapitulate aspects of neurodegenerative pathology (Das and Reeves 2011; Rueda et al. 2012). The Ts65Dn mouse model is one of the most widely utilized models of both DS and AD pathology. Ts65Dn are trisomic for a segment of mouse chromosome 16 (MMU16) and mouse chromosome 17 (MMU17) orthologous to HSA21. Specifically, the distal end of MMU16 is translocated to <10% of the centromeric end of MMU17, creating a small translocation chromosome (Davisson and Schmidt 1993; Reeves et al. 1995; Holtzman et al. 1996; Akeson and Lambert 2001; Chen et al. 2008). This segmental region includes genomic information proximal to App extending to Mx and exhibits ~55% gene conservation of known protein coding genes between MMU16 and HSA21 (Davisson and Schmidt 1993; Reeves et al. 1995; Gardiner et al. 2003; Sturgeon and Gardiner 2011). Importantly, these mice survive into adulthood and they recapitulate the behavioral and cellular phenotype characteristic of human DS. Briefly, behavioral studies demonstrate that Ts65Dn mice have learning and memory deficits on a myriad of tasks (Escorihuela et al. 1995; Reeves et al. 1995; Holtzman et al. 1996; Hyde and Crnic 2001). Ts65Dn mice also display hyperactivity and neurochemical perturbations (Reeves et al. 1995; Cooper and Salehi 2001; Hunter et al. 2003). In addition, morphological studies demonstrate abnormalities in specific brain regions of Ts65Dn mice. Specifically, age-related degeneration of basal forebrain cholinergic neurons (BFCNs; analogous to CBF neurons in human), volume reduction in the hippocampus and cerebellum, synapse loss, and deficits in synaptic plasticity have been reported (Holtzman et al. 1996; Insausti et al. 1998; Kurt et al. 2000; Granholm et al. 2003; Saran et al. 2003; Belichenko et al. 2004; Belichenko et al. 2009; Kelley et al. 2014a). The septohippocampal circuit is particularly vulnerable in both DS and AD, which shows degeneration in both BFCNs and hippocampal CA1 pyramidal neurons (Cataldo et al. 2000; Granholm et al. 2000; Kelley et al. 2014a). Current FDA approved treatments for AD involve delaying the cholinergic degeneration in AD and protection against excitotoxicity through the delivery of memantine, which has not been proven to be effective in to date DS patients (Rueda et al. 2012; Hanney et al. 2012), making it imperative to further understand the molecular underpinnings of degeneration of this circuit in relevant DS models.
Technical, experimental, and bioinformatic developments in functional genomics technologies, including microarray platforms, have enabled the coordinated assessment of gene alterations that occur within the CNS. However, the brain contains a multiplicity of both neuronal and non-neuronal populations of cells, unlike an organ comprised of a homogenous cell type. Not surprisingly, experimental variability is a notorious problem when assaying brain regions, as the admixing of cell types can mask changes within vulnerable neuronal subtypes.
We hypothesize that significant gene expression changes exist within vulnerable CA1 pyramidal neurons in the aged Ts65Dn mouse model compared to age-matched normal disomic (2N) littermates that will elucidate novel genetic targets for therapeutic intervention in DS/AD. To test this, we first circumvented the problem of inadvertently assessing admixed cell types by performing single population analysis of CA1 pyramidal neurons via laser capture microdissection (LCM). LCM is coupled with terminal continuation (TC) RNA amplification, and subsequent custom-designed microarray analysis on aged Ts65Dn mice compared to 2N littermates for hypothesis-driven and interrogative analyses (Ginsberg et al. 2010a, 2012; Alldred et al. 2012). Specifically, the custom-designed array platform enables simultaneous quantitative analysis of multiple classes of transcripts relevant to AD pathology, DS, and neurodegeneration (Ginsberg et al. 2006, 2010a; Alldred et al. 2008, 2009, 2012). Validation studies are examined by real-time quantitative PCR (qPCR) and immunoblot assays performed for selected targets that are demonstrated to be differentially expressed via microarray analysis. This multidisciplinary approach allows us to probe for novel targets for therapeutic intervention at a timepoint where cholinergic degeneration has already begun that mimics the progressive cognitive decline seen in AD and DS patients.
Materials and Methods
Tissue preparation
Animal protocols were approved by the Institutional Animal Care and Use Committee (IACUC) of the Nathan Kline Institute/NYU Langone Medical Center and were in full accordance with NIH guidelines. A cohort of Ts65Dn (n = 13) and 2N disomic littermates (n = 12) mice 10-24 months of age (mixed sex) were given an overdose of ketamine and xylazine and perfused transcardially with ice-cold 4% paraformaldehyde buffered in 0.15 M phosphate buffer. Tissue blocks containing the dorsal hippocampus were paraffin embedded and 6 μm-thick tissue sections were cut in the coronal plane on a rotary microtome for immunocytochemistry as described previously (Ginsberg 2005a; Ginsberg et al. 2010a; Alldred et al. 2012). RNase-free precautions were employed, and solutions were made with 18.2 mega Ohm RNase-free water (Nanopure Diamond, Barnstead, Dubuque, IA). A second independent, mixed sex cohort of animals was cervically dislocated and brains were prepared for CA1 region microdissections or regional hippocampal dissections. Samples were flash frozen for either RNA (Ts65Dn n=9; 2N n=9 10-24 months of age) for qPCR or protein extraction (Ts65Dn n=16; 2N n=12, 16-24 months of age) for immunoblot validation studies. Immunocytochemistry to identify CA1 neurons for subsequent microdissection was performed as described previously (Ginsberg 2005a; Alldred et al. 2008, 2012 Ginsberg et al. 2010b) (Supplemental Text).
Single cell microaspiration and TC RNA amplification
LCM and TC RNA amplification procedures have been described in detail previously by our group (Che and Ginsberg 2004; Alldred et al. 2008, 2009, 2012; Ginsberg et al. 2010a). Individual CA1 pyramidal neurons were microaspirated via LCM (Arcturus PixCell IIe, Life Technologies, Carlsbad, CA). Fifty cells were captured per reaction for population cell analysis (Alldred et al. 2008; Ginsberg et al. 2010a). Microarrays (containing 50 LCM-captured CA1 neurons each) were performed per mouse brain (range 2-6 times per mouse). The full TC RNA amplification protocol is available at http://cdr.rfmh.org/pages/ginsberglabpage.html and in Supplement 1. This method entails synthesizing first strand cDNA complementary to the RNA template, re-annealing the primers to the cDNA, and finally in vitro transcription using the synthesized cDNA as a template. Briefly, microaspirated CA1 neurons were homogenized in Trizol reagent (Life Technologies), chloroform extracted, and precipitated (Alldred et al. 2009, 2012). RNAs were reverse transcribed and single-stranded cDNAs were then subjected to RNase H digestion and re-annealing of the primers to generate cDNAs with double-stranded regions at the primer interfaces. Single stranded cDNAs were digested and samples were purified by Vivaspin 500 columns (Sartorius Stedim Biotech, Goettingen, Germany). Hybridization probes were synthesized by in vitro transcription using 33P and radiolabeled TC RNA probes were hybridized to custom-designed cDNA arrays without further purification.
Microarray platforms and hybridization
Array platforms consist of 1 μg of linearized cDNA purified from plasmid preparations adhered to high-density nitrocellulose (Hybond XL, GE Healthcare, Piscataway, NJ) using an arrayer robot (VersArray, Bio-Rad, Hercules, CA) (Ginsberg 2005b; Ginsberg 2008). Each cDNA and/or expressed sequence-tagged cDNA (EST) was verified by sequence analysis and restriction digestion. Mouse and human clones were employed on the custom-designed array. Approximately 576 cDNAs/ESTs were utilized on the current array platform, organized into 19 gene ontology groups (Table I). The majority of genes are represented by one transcript on the array platform, although the neurotrophin receptors TrkA, TrkB, and TrkC are represented by ESTs that contain the extracellular domain (ECD) as well as the tyrosine kinase domain (TK) (Ginsberg and Mirnics 2006; Ginsberg et al. 2010a). Array hybridization is presented in Supplemental Methods (Supplement 1).
Table I.
Classes of transcripts with total number of genes represented for each category on the custom-designed microarray platform.
| Gene Category | # of genes |
Gene Category | # of genes |
|---|---|---|---|
| AD-related genes | 34 | GluRs, transporters, & interacting | 37 |
| Calcium, potassium, & sodium channels |
25 | Immediate early genes | 11 |
| Catecholamine synthesis, receptors, & transporters (MONO) |
45 | Neuropeptides | 18 |
| Cell death-related genes | 32 | Neurotrophins & neurotrophin receptors |
14 |
| Cytoskeletal elements | 29 | Protease-related markers | 34 |
| Development-related markers | 22 | Protein phosphatases & kinases | 46 |
| Endosomal, autosomal, lysosomal system |
51 | Steroid synthesis & receptors | 25 |
| GABA synthesis, receptors, & transporters |
20 | Synaptic-related markers | 32 |
| G-proteins and associated proteins | 33 | Transcription factors & regulators | 25 |
| Glial-associated markers | 17 | Others | 14 |
| Glucose utilization | 12 | TOTAL | 576 |
Statistical procedures for custom-designed microarray analysis have been described in detail previously (Ginsberg and Mirnics 2006; Ginsberg 2007; Ginsberg 2009). The two mouse genotypes were compared with respect to the hybridization signal intensity ratio of 576 genes. For each gene the signal intensity ratio was modeled as a function of mouse genotype, using mixed effects models with random mouse effect to account for the correlation between repeated assays on the same mouse (McCulloch et al. 2008). Significance was judged at the level (α=0.01), two-sided; false discovery rate (FDR) based on an empirical null distribution due to strong correlation between genes (Benjamini and Hochberg 1995; Efron 2007) was controlled at level 0.1. Expression levels were graphed using a bioinformatics software package (GeneLinker Gold, Predictive Patterns, Kingston, ON).
qPCR
qPCR was performed on microdissected CA1 sections from an independent second cohort of animals (Alldred et al. 2008; Ginsberg 2008; Alldred et al. 2012) containing the hippocampal CA1 region from 10-24 month old Ts65Dn and 2N mice. Taqman qPCR primers (Life Technologies) were utilized for qPCR (Table II). Samples were assayed on a real-time qPCR cycler (7900HT, Life Technologies) in 96-well optical plates with coverfilm as described previously (Ginsberg et al. 2006, 2010a; Alldred et al. 2008, 2012; Jiang et al. 2010). Standard curves and cycle threshold (Ct) were generated using standards obtained from total mouse brain RNA. The ddCT method was employed to determine relative gene level differences between Ts65Dn and 2N mice. (Alldred et al. 2008; Applied Biosystems 2008; Jiang et al. 2010; Glyceraldehyde-3-phosphate dehydrogenase (Gapdh) qPCR products were used as a control, as microarray results show no change in gene expression for this housekeeping gene (data not shown). Negative controls consisted of the reaction mixture without input RNA. The two mouse genotypes were compared with respect to the PCR product synthesis of 12 genes. For each gene, the PCR product synthesis was modeled as a function of mouse genotype, using mixed effects models with random mouse effect to account for the correlation between repeated assays on the same mouse (McCulloch et al. 2008). Significance was judged at the level (α=0.05), two-sided.
Table II.
qPCR TaqMan Gene Probes utilized for CA1 region gene expression.
| Gene name | Life Technologies ID |
|---|---|
| ADRA1B | Mm00431685 m1 |
| BDNF | Mm04230607 s1 |
| CAPNS1 | Mm00501568 m1 |
| DLG4 | Mm00492207 mH |
| GAPDH | Mm99999915 g1 |
| GRIA1 | Mm01342711 m1 |
| GRIA2 | Mm01220174 m1 |
| GRIA3 | Mm01322409 m1 |
| GRIA4 | Mm01241277 m1 |
| GRIN1 | Mm00433799 m1 |
| NTF3 | Mm00435413 s1 |
| TrkA (NTRK1) | Mm01219406 m1 |
| TrkB (NTRK2) | Mm01341760 m1 |
| TrkC (NTRK3) | Mm01317842 m1 |
| TUBB2C | Mm00847804 gH |
Immunoblot analysis
Frozen microdissected hippocampal tissue samples obtained from Ts65Dn and 2N mice aged 16-24 months (Ts65Dn; n = 16) (2N; n = 12) were homogenized (Supplemental Text) and identical amounts of homogenates were processed. Nitrocellulose membranes were blocked and incubated with primary antibodies directed against GRIA1 (06-306; Millipore), GRIA2/3 (06-307; Millipore), TrkB (#610102; BD Transduction Laboratory), TrkC (#3376S; Cell Signalling), NTF3 (PA514861; Thermo Scientific), BDNF (SC-546; rabbit polyclonal; Santa Cruz, 1:1000 dilution), APP (gift of Paul Mathews, NKI) or β-tubulin (TUBB; T-5293; Sigma) (detailed protocol in Supplement 1). Immunoblots were quantified by densitometric software supplied with the instrument. Signal intensity of immunoreactive bands was normalized to TUBB immunoreactivity for each assay.
Each protein measure was modeled as a function of mouse genotype, using mixed effects models with random mouse effect to account for the correlation between repeated assays on the same mouse (McCulloch et al. 2008). All inferences were based on models with only main effects for genotype, age and gender (Supplemental Text), by modeling the outcome (gene expression of proteins) as a function of mouse genotype controlling for gender and age.
Results
Microarray analysis shows gene expression alterations within CA1 neurons in aged Ts65Dn mice
Ts65Dn mice were compared to 2N littermates to evaluate gene expression changes in CA1 pyramidal neurons. Expression profiling was performed on a total 115 custom-designed microarrays for Ts65Dn and 2N mice aged 10-24 months of age (50 cells analyzed per array). Quantitative analysis showed differential expression of 81 genes out of 576 total genes examined with a cut-off of p<0.01 (14%; Table III), with 54 passing FDR (q>0.05) and 73 of them passing FDR level (q>0.1; an additional 48 genes displayed trend-level alteration between 0.02<p<0.05; Table S1). Microarray results of APP, which is triplicated in Ts65Dn, showed an 86% increase in gene expression level in Ts65Dn mice compared to 2N littermates (p<0.001; Fig. 2A & Table III), but did not show significant changes in any APP binding proteins, including APP-binding protein 1 (APPBP1), amyloid precursor-like protein 1 (APLP1), amyloid precursor-like protein 2 (APLP2), β-site APP-cleaving enzyme 1 (BACE1), APP-binding family A, member 1 (APBA1), APP-binding family B, member 1 (APBB1), islet amyloid polypeptide (IAPP), serum amyloid P component (APCS) or serum amyloid A4 (SAA4) (Fig. 2A). Prion protein (PRNP) showed a trend for decreased expression in the Ts65Dn mouse (p<0.03, Fig. 2A & Table S1).
Table III.
Specific changes in CA1 pyramidal neuron gene expression on the custom-designed microarray platform.
| Gene specifically | altered Direction of Change | |
|---|---|---|
| APP* | amyloid precursor protein (APP695) | + |
| ADCY3* | adenylate cyclase 3 | + |
| ADCY5* | adenylate cyclase 5 | + |
| ADRA1B | adrenergic, alpha 1B, receptor | − |
| AKR1C3 | aldo-keto reductase family 1, member C3 | − |
| AP1S1* | adaptor-related protein complex 1, sigma 1 subunit | − |
| ATG4C* | ATG4 autophagy related 4 homolog C | + |
| BDNF* | brain-derived neurotrophic factor | − |
| CART** | cocaine- and amphetamine-regulated transcript | − |
| CASP8* | caspase 8 | + |
| CCNG1 | cyclin G1 | − |
| CDK5* | cyclin-dependent kinase 5 | − |
| CHRNA6* | nicotinic acetylcholine receptor alpha 6 | − |
| CREB** | cAMP responsive element binding protein | − |
| CREBBP* | CREB binding protein | + |
| CREM* | cAMP responsive element modulator | − |
| CSF1** | colony stimulating factor 1 (macrophage) | − |
| CTSH** | cathepsin H | − |
| CTSZ* | cathepsin Z | − |
| DAO | D-amino-acid oxidase | + |
| Discs, large homolog 4 (Drosophila) postsynaptic density | ||
| DLG4* | protein 95 (PSD-95) | − |
| EGR2 | early growth response 2 (Krox-20 homolog) | − |
| ESR2* | estrogen receptor 2 (ER beta) | − |
| GABRB1* | gamma-aminobutyric acid (GABA) A receptor, beta 1 | + |
| GLUD1** | glutamate dehydrogenase 1 | − |
| GRIA1* | GluR1 (GluA1) AMPA1 | − |
| GRIA2* | GluR2 (GluA2) AMPA2 | − |
| GRIA4* | GluR4 (GluA4) AMPA4 | − |
| GRIN1* | NR1 (GluN1) N-methyl D-aspartate 1 | − |
| GRIN2B* | NR2B (GluN2A) N-methyl D-aspartate 2B | − |
| GRIN2C** | NR2C (Glun2C) N-methyl D-aspartate 2C | − |
| GRIP1* | GluR-interacting protein 1 | − |
| GRIP2* | GluR-interacting protein 2 | − |
| GRM3** | glutamate receptor, metabotropic 3 | − |
| GRM5* | glutamate receptor, metabotropic 5 | − |
| HSPG2* | perlecan (heparan sulfate proteoglycan 2) | − |
| HTR2C* | 5-hydroxytryptamine (serotonin) receptor 2C | − |
| HTR7* | 5-hydroxytryptamine (serotonin) receptor 7 | − |
| IDE** | insulin degrading enzyme | − |
| IGF2R* | insulin-like growth factor receptor tyrosine kinase 2 | − |
| Kv1.2 potassium voltage-gated channel, shaker-related | ||
| KCNA2* | subfamily, member 2 | − |
| Kv1.6 RCK2 potassium voltage gated channel, shaker related | ||
| KCNA6** | subfamily, member 6 | − |
| KCNB1* | Kv2.1 potassium voltage-gated channel, Shab-related | |
| subfamily, member 1 | − | |
| LAMA2 | laminin, alpha 2 (merosin) | − |
| LIPA* | lipase A, lysosomal acid, cholesterol esterase | − |
| MAOA* | monoamine oxidase A | − |
| MBP | myelin basic protein | + |
| MLH1** | mutL homolog, mismatch repair protein | + |
| MYO5B | myosin Vb | − |
| NAB1* | zinc finger binding protein 268 (ZIF268) (EGR-1) | − |
| NGFB* | nerve growth factor β | − |
| NRP** | neuropilin | − |
| NTF3* | neurotrophin 3 (NT-3) | − |
| NTF5 | neurotrophin 4/5 (NT-4/5) | − |
| NTRK1ECD* | NGF receptor TrkA extracellular domain | − |
| NTRK1TK* | NGF receptor TrkA tyrosine kinase domain | − |
| NTRK2ECD* | BDNF receptor TrkB extracellular domain | − |
| NTRK2TK* | BDNF receptor TrkB tyrosine kinase domain | − |
| NTRK3ECD* | NT-3 receptor TrkC extracellular domain | − |
| NTRK3TK* | NT-3 receptor TrkC tyrosine kinase domain | − |
| PFKL** | phosphofructokinase, liver, B-type | + |
| PPT1** | palmitoyl-protein thioesterase 1 | − |
| PRKCA** | protein kinase C, alpha | − |
| PTK2B* | protein tyrosine kinase 2 beta (focal adhesion kinase) | + |
| RAB9** | RAS-related protein, member RAS oncogene family 9 | − |
| RASSF2* | Ras association domain family | − |
| RBL2** | p130 | − |
| RED1* | dsRNA-specific editase 1 (dsRNA adenosine deaminase) | − |
| RELN* | reelin | + |
| RGS2* | regulator of G-protein signalling 2 | − |
| RGS4* | regulator of G-protein signalling 4 | + |
| RGS5* | regulator of G-protein signalling 5 | − |
| RGS7* | regulator of G-protein signalling 7 | + |
| SLC2A5* | solute carrier family 2 (glucose transporter), member 5 | − |
| SLC6A11* | solute carrier family 6 member 11 GABA transporter GABT4 | + |
| solute carrier family 6 member 2 noradrenergic transporter | ||
| SLC6A2** | NET | − |
| SYN1* | synapsin 1 | − |
| TSC1** | tuberous sclerosis 1 | + |
| TUBB2C* | tubulin, beta 2C | − |
| UBE2E1* | ubiquitin-conjugating enzyme E2E 1 | − |
| USP8* | ubiquitin specific protease 8 | + |
| VLDLR** | very low density lipoprotein receptor | − |
Unadjusted p-values are p<0.01. Genes that pass FDR at (q>0.05) are indicated with an asterisk. Genes that pass FDR at (q>0.1) are indicated with a double asterisk.
Figure 2. Microarray observations from Ts65Dn CA1 pyramidal neurons.
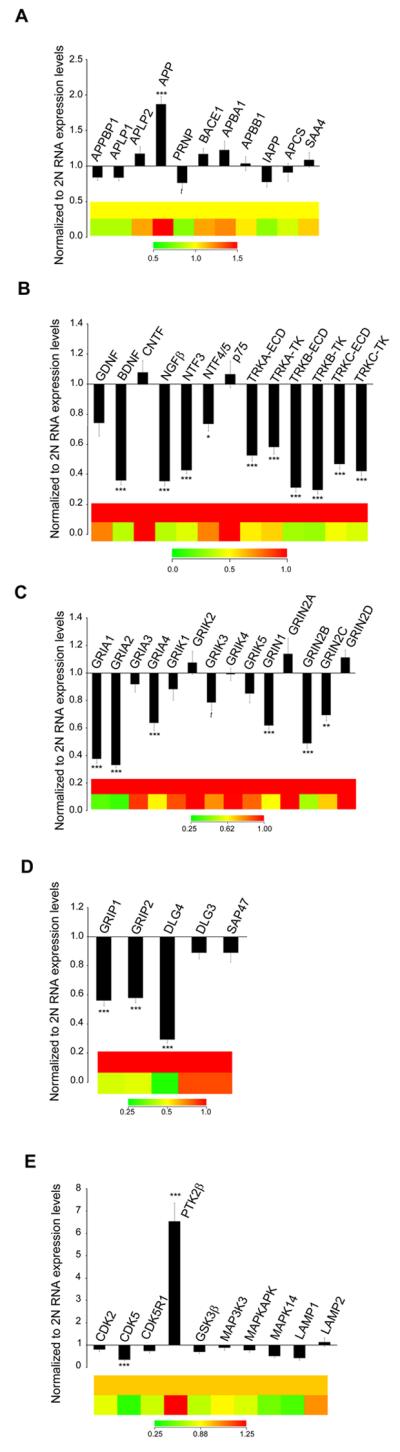
Bar graphs and color coded heatmaps illustrating transcript levels in Ts65Dn (n = 13) and 2N (n = 12) mice at 10-24 months of age in CA1 neurons. (A) APP (but not other AD-related genes) showed upregulation in aged Ts65Dn mice, while PRNP showed a trend toward downregulation compared to 2N controls. (B) The majority of neurotrophins and their cognate neurotrophin receptors showed significant downregulation including BDNF, NGFβ, NTF3, and NTF4/5 and the TrkA, TrkB and TrkC receptors (both the ECD and TK domains were examined) while the p75NTR(TNFR) receptor was unchanged. (C) Downregulation of select GluR subunits included AMPA receptor subunits GRIA1, GRIA2, and GRIA4, kainite receptor subunit GRIK3 (trend) and NMDA receptor subunits GRIN1, GRIN2B and GRIN2C is demonstrated. (D) GluR-interacting proteins also showed downregulation including GRIP1, GRIP2, and DLG4 (PSD-95). (E) Cyclin dependant kinase (CDK5) gene showed downregulation along with the small subunit of calpain while the protein tyrosine kinase 2B gene (PTK2B) showed significant upregulation.(*p < 0.01), (**p < 0.005), and (*** p < 0.001) (t= trend p < 0.07). Error bars indicate standard error of the mean (SEM).
Several classes of transcripts were selectively downregulated including neurotrophins and neurotrophin receptors, glutamate receptors (GluRs) and transporters, potassium channels and monoamine receptors, indicating deficits in the neuroprotective pathways as well as deficiencies in multiple pathways of excitatory neurotransmission (Table III). Specifically, the majority of the neurotrophins and neurotrophin receptors represented on the microarray showed significantly decreased RNA expression levels in Ts65Dn CA1 pyramidal neurons compared to 2N littermates. Decreases were seen in brain-derived neurotrophic factor (BDNF; 64% decrease; p<0.001), nerve growth factor β (NGFβ; 64% decrease; p<0.001), neurotrophin-3 (NTF3; 57% decrease; p<0.001), and neurotrophin 4/5 (NTF5; 26% decrease; p<0.01). Additionally, for the neurotrophin receptors both the ECD and the TK domains displayed significant gene expression decreases in the three neurotrophin receptors interrogated, with TrkA-ECD having a 47% decrease (NTRK1ECD; p<0.001) and the TrkA-TK domain a 42% decrease (NTRK1TK; p<0.001). Both TrkB and TrkC showed even larger deficits, TrkB (NTRK2ECD; 69% decrease; p<0.001; NTRK2TK; 70% decrease; p<0.001) and TrkC (NTRK3ECD; 53% decrease; p<0.001; NTRK3TK; 58% decrease; p<0.001), respectively. In contrast, no significant alterations were found in the pan-neurotrophin receptor p75NTR gene expression, nor in the glial-cell derived neurotrophic factor (GDNF) or ciliary neurotrophic factor (CNTF) (Fig. 2B & Table III).
Gene expression levels for excitatory neurotransmission were also significantly repressed in the Ts65Dn neurons compared to 2N littermates. Significant decreases (11/42; ~26%) of genes representing glutamatergic neurotransmission were seen (p<0.01), with an additional four genes decreased at the trend level (0.02<p<0.05). Significant decreases were seen in several ionotropic and metabotropic GluR subunits, with lowered RNA expression levels of specific α-amino-3-hydroxy-5-methyl-4-isoxazole propionic acid (AMPA), N-methyl-D-aspartate (NMDA) and metabotropic glutamate receptor subunits, as well as several interacting proteins. Downregulated GluRs included AMPA receptor subunits GRIA1 (62% decrease; p<0.001), GRIA2 (67% decrease; p<0.001), GRIA4 (36% decrease; p<0.001) and NMDA receptor subunits GRIN1 (38% decrease; p<0.001), GRIN2B (51% decrease; p<0.001) and GRIN2C (30% decrease; p<0.005) (Fig. 2C). Metabotropic glutamate receptor subunits that were downregulated included GRM3 (37% decrease; p<0.005) and GRM5 (55% decrease; p<0.001) (Table III). In addition, DLG4 {discs large homolog 4 (PSD-95)} was downregulated 71% (p<0.001), along with other GluR-interacting proteins GluR-interacting protein 1 (GRIP1; 44% decrease; p<0.001), and GluR-interacting protein 2 (GRIP2; 42% decrease; p<0.001) (Fig. 2D). The glutamate synthetic enzyme including glutamate dehydrogenase 1 (GLUD1) was also downregulated (58% decrease; p<0.001, Table III). In addition, select protein phosphatases showed increased gene expression and select protein kinases displayed lower expression (Table III). Specifically, protein tyrosine kinase 2β (PTK2β) was significantly upregulated in Ts65Dn CA1 pyramidal neurons (85% increase; p<0.005, Fig. 2E). In contrast, expression levels for cyclin dependent kinase 5 (CDK5; 65% decrease; p<0.001; Fig. 2E) was significantly decreased, but the receptor CDK5R1 was unchanged. The alpha-adrenergic receptor (ADRA1B) also showed significant downregulation (24% decrease; Table III). In contrast, several gene classes displayed individual genes with increased expression, including several regulators of G-protein signaling, GABA receptor subunits and associated proteins, and adenylate cyclases (Table III and Table S1).
qPCR validation
Select microarray-identified expression level changes were assessed via qPCR analysis on an independent cohort of Ts65Dn and 2N mice using microdissected hippocampal CA1 tissue. qPCR confirmed significant downregulation of neurotrophins BDNF (92% decrease; p<0.001), and NTF3 (50% decrease; p<0.03, as described previously; Ginsberg et al., 2012), and the neurotrophin receptors TrkA (72% decrease; p<0.01) and TrkB (38% decrease; p=0.05) (Fig. 3A). TrkC also showed a nonsignificant 28% decrease (Fig. 3A). Microarray results were also validated by qPCR for 3 out of 4 AMPA receptors in regional CA1 dissections (Fig. 3B). Specifically, GRIA1 showed significant downregulation (46% decrease; p=0.02), GRIA2 showed a 35% decrease in RNA expression (p<0.01), whereas GRIA3 expression was not significantly changed in either the microarray or in qPCR results. In contrast, GRIA4 showed no difference in qPCR expression levels, although downregulation was seen via microarray analysis. Consistent with microarray findings, DLG4 was downregulated by qPCR (34% decrease; p<0.01), and GRIN1 showed a near-trend toward alteration towards downregulation (p=0.1; Fig. 3B). Other genes of interest validated by qPCR included calpain, small subunit 1 (CAPNS1), which only showed a trend towards downregulation in the microarray using homogeneous CA1 pyramidal neurons (Table S1; p<0.04) but did not show downregulation by qPCR (Fig. 3C), with admixed cell populations. Microarray results also showed a significant decrease in ADRA1B, which was also confirmed via qPCR (65% decrease; p<0.001, Fig. 3C).
Figure 3. Validation of select microarray findings via qPCR.

(A) Significant downregulation of the GluR subunits GRIA1 and GRIA2, but not GRIA3 or GRIA4 is shown. The NMDA receptor GRIN1 subunit displayed a near-trend toward downregulation. DLG4 (PSD-95) also was downregulated. (B) BDNF and the NGF receptor TrkA (NTRK1) and the BDNF receptor TrkB (NTRK2) showed significant downregulation, in accordance with the microarray results. The NTF3 receptor TrkC (NTRK3) was not differentially regulated. (C) The small subunit of calpain (CAPNS1) was unchanged, whereas the alpha-adrenergic 1B receptor (ADRA1B) was downregulated. Key, (* p < 0.05), (** p < 0.02), and (*** p < 0.001). Error bars indicate SEM.
Immunoblot validation
Western blot analysis of pro-BDNF and mature BDNF both showed tandem significantly decreased protein levels in hippocampal dissections in aged Ts65Dn mice as compared to 2N littermates (pro-BDNF, 45% decrease; p<0.0001; BDNF, 44% decrease; p<0.0001; Fig. 4A, B). NTF3 expression did not show a deficit in protein expression levels (Fig. 4A, B). Immunoblot assessment also revealed concomitant downregulation of TrkB full length (TrkB-FL; 36% decrease; p<0.0001) and truncated TrkB (TrkB-T1; 37% decrease; p<0.0001) in regional hippocampal homogenates from Ts65Dn mice compared to 2N littermates (Fig. 4A, B) consistent with microarray and qPCR evaluations. TrkC showed no changes in expression levels for either the full length (TrkC-FL) or truncated isoform (TrkC-T1) (Fig. 4A, B). GluR subunits GRIA1 and GRIA2/3 showed significantly lower protein expression levels in the hippocampus of Ts65Dn mice compared to 2N littermates (GRIA1, 22% decrease; p<0.01, Fig. 4C) and GluR2/3 (19% decrease; p<0.05, Fig. 4C). Additionally, APP holoprotein expression was significantly upregulated in Ts65Dn mice (74% increase; p<0.0001, Fig 4A, C) as expected.
Figure 4. Immunoblotting of hippocampal dissections showed changes in protein levels consistent with mRNA expression level changes.
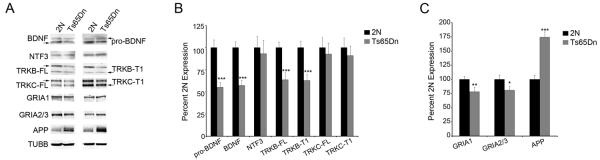
Immunoblot analysis using regional hippocampal dissections was performed to assess whether selected transcriptional alterations resulted in commensurate protein level changes in Ts65Dn mice compared to 2N littermates at 18-24 months of age. (A) Representative immunoblots were obtained from 18-24 month old 2N and Ts65Dn mice for GRIA1, GRIA2/3, NTF3, pro-BDNF, mature BDNF, TrkB full length (TrkB-FL), truncated TrkB (TrkB-T1), TrkC full length TrkC-FL), truncated TrkC (TrkC-T1) and APP. β-tubulin (TUBB) expression was used as a loading control. (B) Normalized expression levels compared to TUBB expression show significant downregulation of TrkB-FL (p<0.0001), TrkB-T1 (p<0.0001), pro-BDNF (p<0.0001) and BDNF (p<0.0001). NTF3, TrkC and TrkC-T1 showed no difference in protein expression levels. (C) GluR subunits GRIA1 (p<0.0015) and GRIA2/3 (p<0.02) showed significant downregulation, while APP (p<0.0001) was upregulated compared to controls. Expression level data was normalized to TUBB expression ± SD.
Discussion
DS is a multifaceted condition marked by ID and early manifestation of AD pathology including septohippocampal degeneration. Currently there are no effective treatment strategies for ID, DS, or AD neuropathology and dementia. To explore potential targets for therapeutic intervention in the vulnerable septohippocampal circuit, we used the Ts65Dn mouse model of DS and AD to investigate gene expression profiles in adult aged Ts65Dn mice relative to 2N littermates to identify individual genes and pathways that are differentially regulated. Prior to the present findings, there was little coordinated gene expression and encoded protein data available within vulnerable septohippocampal neuronal populations in aged Ts65Dn mice. The present results demonstrate that in CA1 pyramidal neurons of aged Ts65Dn mice there are significant deficits in multiple systems necessary for normal synaptic and neuronal function. Microarray results suggest that a multiplicity of alterations occur in CA1 pyramidal neurons during the aging process in trisomic mice (Fig. 5). Some of the most significant pathway perturbations appear to be the downregulation of neurotrophins and their cognate receptors as well as select AMPA and NMDA receptor subunits and GluR-interacting proteins. Notably, significant gene expression changes of most of the neurotrophin and neurotrophin receptor family was observed via microarray in CA1 pyramidal neurons and validated by independent qPCR and immunoblot preparations of regional CA1 and hippocampal dissections. These results suggest broad dampening of pro-survival pathways within this vulnerable hippocampal neuronal population, and have significant translational relevance, as therapeutic interventions that ameliorate and/or restore proper neurotrophin signaling are posited to be of high practical value for the treatment of both AD and DS. Since both neurotrophin expression and cognate neurotrophin receptor expression levels are downregulated, modifications in target-derived neurotrophic support (Cooper et al. 2001; Howe and Mobley 2004; Salehi et al. 2006), receptor transactivation (Rajagopal et al. 2004; Skaper 2008; Huang and McNamara 2012), and/or gene therapy (Tuszynski 2002; Tuszynski 2007; Maeder et al. 2013) approaches may be viable alternatives to pursuing monotherapy attempts to decrease amyloid or tau pathology in AD and DS.
Figure 5.

Schematic representation of gene expression level changes as observed within CA1 pyramidal neurons in aged Ts65Dn mice compared to 2N littermates
At the cellular and molecular level, neurotrophin and neurotrophin receptor gene dysregulation likely affects survival and maintenance of various forebrain neuronal systems including septohippocampal circuitry, which rely upon retrograde trafficking of neurotrophins such as NGF, BDNF, and NTF3, all of which are implicated in the progression of AD and DS (Chao 2003; Mufson et al. 2007; Ginsberg et al. 2010a). Without proper expression and maintenance of functional neurotrophin receptors, forebrain circuits are at risk for neurodegeneration. Previous single cell research in human postmortem brain tissue by our group has demonstrated early downregulation of NGF, BDNF, and NTF3 cognate receptors TrkA, TrkB, TrkC, but not the pan-neurotrophin receptor p75NTR within CA1 pyramidal neurons as well as CBF neurons during the progression of AD, indicating the vulnerability of the septohippocampal circuit (Ginsberg et al. 2006, 2010a, 2012; Counts et al. 2011). Based upon the present results in Ts65Dn CA1 neurons, assessment of neurotrophin and neurotrophin receptors within septohippocampal neurons is warranted during the progression of dementia in DS subjects as well.
In addition to deficits in neurotrophin signaling pathways, alterations in several receptors for glutamatergic neurotransmission suggest impairments in excitatory signaling in the CA1 region of the hippocampus in trisomic mice. Notably GluR subunits GRIA1 (GluA1) and GRIA2 (GluA2) are significantly downregulated by microarray, qPCR, and protein expression assays. The post-synaptic GluR-interacting protein DLG4 (PSD-95) shows significant downregulation by microarray and qPCR. Moreover, NMDA receptors GRIN1 (GluN1), GRIN2B (GluN2B), and GRIN2C (GluN2C), metabotropic GluRs GRM3 and GRM5, and the GluR-interacting proteins GRIP1 and GRIP2 are downregulated by microarray analysis, demonstrating significant decrements in both ionotropic and metabotropic GluRs and associated GluR-interacting molecules. Deficits in specific GluRs are consistent with previous observations demonstrating alterations in glutamatergic signaling within the Ts65Dn hippocampus (Belichenko et al. 2004; Lorenzi and Reeves 2006; Pollonini et al. 2008; Kaur et al. 2014). It is interesting to note, however, that several previous studies in Ts65Dn mice have failed to identify downregulation of individual GluR subunits. One mitigating factor is that many of these studies used younger mice (below 6 months of age) (Granholm et al. 2003; Belichenko et al. 2004; Lorenzi and Reeves 2006; Pollonini et al. 2008; Lockrow and Prakasam 2009). In contrast, deficits in specific GluR subunits have been extensively shown in AD (Ikonomovic et al. 1995, 1997; Carter et al. 2004; Proctor et al. 2010; Danysz and Parsons 2012; Wang et al. 2013), including several of the AMPA and NMDA subunits identified in the current report. The relationship between Aβ, decrements in NMDA receptor subunit expression and excitatory neurotransmission dysfunction, specifically changes in long-term potentiation (LTP) in the hippocampus has been investigated (Rammes et al. 2011; Kervern et al. 2012; Talantova et al. 2013; Kaur et al. 2014). For example, a link may exist between Aβ oligomers, extrasynaptic GRIN2B expression levels and alteration of LTP in hippocampus of wild type and NR2B knockout mice (Rammes et al. 2011; Kervern et al. 2012), which also support similar LTP decrements in AD mouse models (Middei et al. 2010; Chong et al. 2011) and in human AD brains (Koch et al. 2012). Moreover, changes in metabotropic glutamate receptor subunits may also affect synaptic long-term depression (LTD) by premature internalization of AMPA receptors and subsequent synaptic collapse (Danysz and Parsons 2012).
The present observations within a vulnerable cell type indicate there are significant changes in gene expression of select GluRs in the Ts65Dn hippocampus. These data provide both basic molecular and cellular evidence for glutamatergic dysfunction in this model of DS and AD in combination with our collaborative group’s neuroimaging and physiological studies (Chen et al., 2009; Kaur et al. 2014), as well as point to translational therapies that may be envisioned to correct glutamatergic neurotransmission deficits. Current research efforts to tease out how glutamate receptor changes affect AD pathology have been elusive, although use of the NMDA antagonist memantine has been approved by the FDA for moderate to severe AD, and has had some moderate success in symptomatic alterations in several independent studies (Reisberg et al. 2003, 2006; Wang et al. 2013). To date, memantine has not shown primary benefits in terms of cognitive improvement in older (40 years or greater) DS subjects (Hanney et al. 2012) or in a pilot study of younger DS patients (Boada et al. 2012), but has been effective in the Ts65Dn model (Costa et al. 2008; Rueda et al. 2010; Lockrow et al. 2011b). Further translational research is required to determine whether memantine or related compounds {e.g., nitro-memantine (Nakamura and Lipton 2010)} will ultimately be effective in remediating some of the cognitive deficit symptoms in DS and AD associated with GluR dysfunction and/or excitotoxicity.
Although scope and space constraints preclude a description of each expression level change seen in this study, other classes of transcripts clearly display aberrant expression in aged Ts65Dn mice, including individual genes involved in GABA biosynthesis and transmission, cytoskeletal elements, and protein phosphatases and kinases, among others (Tables III and S1). We also confirmed significant upregulation of APP mRNA and holoprotein levels in the Ts65Dn hippocampus compared to 2N littermates, which serves as a positive control for brain expression of the triplicated MMU16 chromosome.
Potential pitfalls include technical limitations of this single population microarray study. We have made every attempt to verify microarray observations via qPCR and by select immunoblot detection of encoded proteins that are posited to be altered in multiple hippocampal neuronal populations. This custom-designed array format has the advantage being hypothesis-driven, but a limiting factor is that the current platform does not fully represent the genome, which will require future high-density microarray and/or next-generation sequencing for better coverage of the mouse brain transcriptome. These studies are planned, as the ability to accrue RNA from single populations of identified neurons has become more feasible with advanced microdissection and RNA amplification technology (Ginsberg, 2009). Although there is consistently a strong degree of concordance between mRNA and corresponding protein levels, this correspondence is not absolute (Gygi et al., 1999; Williams et al., 2010). With the possible exception of lower organisms (Shaulsky and Loomis, 2002), expression profiling in whole tissues is complex and likely reflect the diversity of admixed cell types. Due to cellular specificity of neurodegeneration in DS and AD, expression profiles obtained from homogeneous populations of cells is likely to be more informative than regional and/or global expression mosaics with an admixture of cells (Alldred et al. 2012; Ginsberg et al. 2012; Stempler and Ruppin 2012). Future studies will include assessing different ages of trisomic mice (e.g., prior to BFCN degeneration), aged mice with a smaller age range (e.g., 20-24 months), separate male and female cohorts of Ts65Dn mice and their sex-specific 2N littermates, and additional cell types, such as vulnerable BFCNs and entorhinal cortex stellate cells.
A caveat to this work concerns the use of the Ts65Dn mouse model, which is trisomic for approximately 88/161 orthologs on HSA21 and also includes approximately 50 encoded genes triplicated in Ts65Dn that are not triplicated in HSA21 (Sturgeon and Gardiner 2011). Thus, caution has to be used when interpreting expression level changes in the context of what is occurring in human trisomy, although many cognitive and morphological changes are similar in this model and bona fide DS. In addition to the cholinergic innervation of the hippocampus by BFCNs, another population of basal forebrain neurons in the medial septum/diagonal band nuclei supply GABAergic afferents to the hippocampus (Köhler et al. 1984). GABAergic basal forebrain neurons lose their phenotypic expression following fimbria-fornix transections, similar to BFCNs (Peterson et al. 1987, 1990). Whether these GABAergic basal forebrain neurons degenerate in DS or AD models as well as in human DS and AD and their impact on GABAergic input to the hippocampal formation remains to be determined.
In conclusion, single population molecular fingerprinting of CA1 pyramidal neurons in aged trisomic mice displays a striking downregulation of several neurotrophins and their cognate receptors as well as select GluR subunits and GluR-interacting protein genes. Taken together, these findings suggest a dampening of pro-survival pathways and excitatory neurotransmission that likely underlies ID as well as cognitive decline seen in this established mouse model of DS and AD. Parallel studies have shown similar changes within CA1 pyramidal neurons in AD and mild cognitive impairment (MCI) obtained postmortem (Ginsberg et al. 2010a, 2012; Alldred et al. 2012; Counts et al. 2014), indicating the Ts65Dn model faithfully represents several of the key molecular and cellular alterations that are occurring in this vulnerable cell type. Additional expression profiling in CA1 neurons obtained postmortem from DS brains (ideally across the lifespan) is warranted. Translational studies are envisioned where CA1 pyramidal neuron expression profiles serve as a readout for potential ameliorative approaches, including β-adrenergic therapies (Lockrow et al. 2011b; Dang et al. 2014), glutamatergic modulators (Costa et al. 2008; Rueda et al. 2010; Lockrow et al. 2011a), as well as noninvasive, dietary treatments in neurodevelopment such as maternal choline supplementation that have shown promise in improving cognitive status as well as potentially providing neurotrophic support for vulnerable septohippocampal neurons (Moon et al. 2010; Velazquez et al. 2013; Kelley et al. 2014a, 2014b).
Supplementary Material
Figure 1. Representation of LCM, microdissection, and regional dissections for microarray, qPCR, and immunoblotting, respectively.

(A) Paraffin-embedded brain tissue is depicted with CA1 pyramidal neurons isolated by LCM and purification for microarray studies. (B) qPCR was performed on RNA purified from CA1 enriched microdissected fresh tissue. (C) Immunoblotting was performed on whole hippocampi dissected from individual mouse hemibrains.
Acknowledgements
Support for this project comes from NIH grants AG043375, AG014449, AG017617, and the Alzheimer’s Association (IIRG-12-237253). We thank Irina Elarova, M.S., Krisztina Kovacs, B.S., and Arthur Saltzman, M.S. for expert technical assistance.
References
- Akeson E, Lambert J. Ts65Dn-localization of the translocation breakpoint and trisomic gene content in a mouse model for Down syndrome. Cytogenet Cell Genet. 2001;276:270–276. doi: 10.1159/000056997. [DOI] [PubMed] [Google Scholar]
- Alldred MJ, Che S, Ginsberg SD. Terminal Continuation (TC) RNA amplification enables expression profiling using minute RNA input obtained from mouse brain. Int J Mol Sci. 2008;9:2091–2104. doi: 10.3390/ijms9112091. [DOI] [PMC free article] [PubMed] [Google Scholar]
- Alldred MJ, Che S, Ginsberg SD. Terminal continuation (TC) RNA amplification without second strand synthesis. J Neurosci Methods. 2009;177:381–385. doi: 10.1016/j.jneumeth.2008.10.027. [DOI] [PMC free article] [PubMed] [Google Scholar]
- Alldred MJ, Duff KE, Ginsberg SD. Microarray analysis of CA1 pyramidal neurons in a mouse model of tauopathy reveals progressive synaptic dysfunction. Neurobiol Dis. 2012;45:751–762. doi: 10.1016/j.nbd.2011.10.022. [DOI] [PMC free article] [PubMed] [Google Scholar]
- Applied Biosystems Guide to Performing Relative Quantitation of Gene Expression Using Real-Time Quantitative PCR. Gene Expr. 2008;2009:1–60. [Google Scholar]
- Belichenko NP, Belichenko PV, Kleschevnikov AM, et al. The “Down syndrome critical region” is sufficient in the mouse model to confer behavioral, neurophysiological, and synaptic phenotypes characteristic of Down syndrome. J Neurosci. 2009;29:5938–5948. doi: 10.1523/JNEUROSCI.1547-09.2009. [DOI] [PMC free article] [PubMed] [Google Scholar]
- Belichenko PV, Masliah E, Kleschevnikov AM, et al. Synaptic structural abnormalities in the Ts65Dn mouse model of Down Syndrome. J Comp Neurol. 2004;480:281–298. doi: 10.1002/cne.20337. [DOI] [PubMed] [Google Scholar]
- Benjamini Y, Hochberg Y. Controlling the false discovery rate: A practical and powerful approach to multiple testing. J R Stat Soc Ser B. 1995;57:289–300. [Google Scholar]
- Boada R, Hutaff-Lee C, Schrader A, et al. Antagonism of NMDA receptors as a potential treatment for Down syndrome: a pilot randomized controlled trial. Transl Psychiatry. 2012;2:e141. doi: 10.1038/tp.2012.66. [DOI] [PMC free article] [PubMed] [Google Scholar]
- Carter TL, Rissman RA, Mishizen-Eberz AJ, et al. Differential preservation of AMPA receptor subunits in the hippocampi of Alzheimer’s disease patients according to Braak stage. Exp Neurol. 2004;187:299–309. doi: 10.1016/j.expneurol.2003.12.010. [DOI] [PubMed] [Google Scholar]
- Cataldo AM, Petanceska S, Peterhoff CM, et al. App gene dosage modulates endosomal abnormalities of Alzheimer’s disease in a segmental trisomy 16 mouse model of down syndrome. J Neurosci. 2003;23:6788–6792. doi: 10.1523/JNEUROSCI.23-17-06788.2003. [DOI] [PMC free article] [PubMed] [Google Scholar]
- Cataldo AM, Peterhoff CM, Troncoso JC, et al. Endocytic pathway abnormalities Precede amyloid β deposition in sporadic Alzheimer’s disease and Down syndrome. Am J Pathol. 2000;157:277–286. doi: 10.1016/s0002-9440(10)64538-5. [DOI] [PMC free article] [PubMed] [Google Scholar]
- Chao MV. Retrograde transport redux. Neuron. 2003;39:1–2. doi: 10.1016/s0896-6273(03)00401-x. [DOI] [PubMed] [Google Scholar]
- Chapman R, Hesketh L. Behavioral phenotype of individuals with Down syndrome. Ment Retard Dev Disabil Res Rev. 2000;95:84–95. doi: 10.1002/1098-2779(2000)6:2<84::AID-MRDD2>3.0.CO;2-P. [DOI] [PubMed] [Google Scholar]
- Che S, Ginsberg SD. Amplification of RNA transcripts using terminal continuation. Lab Invest. 2004;84:131–137. doi: 10.1038/labinvest.3700005. [DOI] [PubMed] [Google Scholar]
- Chen Y, Dyakin VV, Branch CA, et al. In vivo MRI identifies cholinergic circuitry deficits in a Down syndrome model. Neurobiol Aging. 2009;30:1453–1465. doi: 10.1016/j.neurobiolaging.2007.11.026. [DOI] [PMC free article] [PubMed] [Google Scholar]
- Chen Z, Simmons MS, Perry RT, et al. Genetic association of neurotrophic tyrosine kinase receptor type 2 (NTRK2) With Alzheimer’s disease. Am J Med Genet B Neuropsychiatr Genet. 2008;147:363–369. doi: 10.1002/ajmg.b.30607. [DOI] [PubMed] [Google Scholar]
- Chong S-A, Benilova I, Shaban H, et al. Synaptic dysfunction in hippocampus of transgenic mouse models of Alzheimer’s disease: a multi-electrode array study. Neurobiol Dis. 2011;44:284–291. doi: 10.1016/j.nbd.2011.07.006. [DOI] [PubMed] [Google Scholar]
- Cooper JD, Salehi A, Delcroix JD, et al. Failed retrograde transport of NGF in a mouse model of Down’s syndrome: reversal of cholinergic neurodegenerative phenotypes following NGF infusion. Proc Natl Acad Sci USA. 2001;98:10439–10444. doi: 10.1073/pnas.181219298. [DOI] [PMC free article] [PubMed] [Google Scholar]
- Costa ACS, Scott-McKean JJ, Stasko MR. Acute injections of the NMDA receptor antagonist memantine rescue performance deficits of the Ts65Dn mouse model of Down syndrome on a fear conditioning test. Neuropsychopharmacology. 2008;33:1624–1632. doi: 10.1038/sj.npp.1301535. [DOI] [PubMed] [Google Scholar]
- Counts SE, Alldred MJ, Che S, et al. Synaptic gene dysregulation within hippocampal CA1 pyramidal neurons in mild cognitive impairment. Neuropharmacology. 2014;79:172–179. doi: 10.1016/j.neuropharm.2013.10.018. [DOI] [PMC free article] [PubMed] [Google Scholar]
- Counts SE, Che S, Ginsberg SD, Mufson EJ. Gender differences in neurotrophin and glutamate receptor expression in cholinergic nucleus basalis neurons during the progression of Alzheimer’s disease. J Chem Neuroanat. 2011;42:111–117. doi: 10.1016/j.jchemneu.2011.02.004. [DOI] [PMC free article] [PubMed] [Google Scholar]
- Dang V, Medina B, Das D, et al. Formoterol, a long-acting β2 adrenergic agonist, improves cognitive function and promotes dendritic complexity in a mouse model of Down syndrome. Biol Psychiatry. 2014;75:179–188. doi: 10.1016/j.biopsych.2013.05.024. [DOI] [PubMed] [Google Scholar]
- Danysz W, Parsons CG. Alzheimer’s disease, β-amyloid, glutamate, NMDA receptors and memantine--searching for the connections. Br J Pharmacol. 2012;167:324–352. doi: 10.1111/j.1476-5381.2012.02057.x. [DOI] [PMC free article] [PubMed] [Google Scholar]
- Das I, Reeves RH. The use of mouse models to understand and improve cognitive deficits in Down syndrome. Dis Model Mech. 2011;4:596–606. doi: 10.1242/dmm.007716. [DOI] [PMC free article] [PubMed] [Google Scholar]
- Davisson M, Schmidt C. Segmental trisomy as a mouse model for Down syndrome. Prog Clin Biol Res. 1993:117–133. [PubMed] [Google Scholar]
- Efron B. Correlation and large-scale simultaneous significance testing. J Am Stat Assoc. 2007;102:93–103. [Google Scholar]
- Esbensen AJ. Health conditions associated with aging and end of life of adults with Down syndrome. Int Rev Res Ment Retard. 2010;39:107–126. doi: 10.1016/S0074-7750(10)39004-5. [DOI] [PMC free article] [PubMed] [Google Scholar]
- Escorihuela RM, Fernández-Teruel A, Vallina IF, et al. A behavioral assessment of Ts65Dn mice: a putative Down syndrome model. Neurosci Lett. 1995;199:143–146. doi: 10.1016/0304-3940(95)12052-6. [DOI] [PubMed] [Google Scholar]
- Gardiner K, Fortna A, Bechtel L, Davisson MT. Mouse models of Down syndrome: how useful can they be? Comparison of the gene content of human chromosome 21 with orthologous mouse genomic regions. Gene. 2003;318:137–147. doi: 10.1016/s0378-1119(03)00769-8. [DOI] [PubMed] [Google Scholar]
- Ginsberg SD. Glutamatergic neurotransmission expression profiling in the mouse hippocampus after perforant-path transection. Am J Geriatr Pyschiatry. 2005a;13:1052–1061. doi: 10.1176/appi.ajgp.13.12.1052. [DOI] [PubMed] [Google Scholar]
- Ginsberg SD. RNA amplification strategies for small sample populations. Methods. 2005b;37:229–237. doi: 10.1016/j.ymeth.2005.09.003. [DOI] [PubMed] [Google Scholar]
- Ginsberg SD. Transcriptional profiling of small samples in the central nervous system. Methods Mol Biol. 2008;439:147–158. doi: 10.1007/978-1-59745-188-8_10. [DOI] [PMC free article] [PubMed] [Google Scholar]
- Ginsberg SD. Microarray use for the analysis of the CNS. In: Squire LR, editor. Encyclopedia of Neuroscience. Vol. 5. Academic Press; Oxford: 2009. pp. 835–841. [Google Scholar]
- Ginsberg SD. Expression profile analysis of brain aging. In: Riddle DR, editor. Brain Aging: Models, Methods and Mechanisms. CRC Press; New York: 2007. pp. 159–185. [Google Scholar]
- Ginsberg SD, Alldred MJ, Che S. Gene expression levels assessed by CA1 pyramidal neuron and regional hippocampal dissections in Alzheimer’s disease. Neurobiol Dis. 2012;45:99–107. doi: 10.1016/j.nbd.2011.07.013. [DOI] [PMC free article] [PubMed] [Google Scholar]
- Ginsberg SD, Alldred MJ, Counts SE, et al. Microarray analysis of hippocampal CA1 neurons implicates early endosomal dysfunction during Alzheimer’s disease progression. Biol Psychiatry. 2010a;68:885–893. doi: 10.1016/j.biopsych.2010.05.030. [DOI] [PMC free article] [PubMed] [Google Scholar]
- Ginsberg SD, Che S, Wuu J, et al. Down regulation of trk but not p75NTR gene expression in single cholinergic basal forebrain neurons mark the progression of Alzheimer’s disease. J Neurochem. 2006;97:475–487. doi: 10.1111/j.1471-4159.2006.03764.x. [DOI] [PubMed] [Google Scholar]
- Ginsberg SD, Mirnics K. Functional genomic methodologies. Prog Brain Res. 2006;158:15–40. doi: 10.1016/S0079-6123(06)58002-1. [DOI] [PubMed] [Google Scholar]
- Ginsberg SD, Mufson EJ, Counts SE, et al. Regional selectivity of rab5 and rab7 protein upregulation in mild cognitive impairment and Alzheimer’s disease. J Alzheimers Dis. 2010b;22:631–639. doi: 10.3233/JAD-2010-101080. [DOI] [PMC free article] [PubMed] [Google Scholar]
- Granholm A-C, Sanders L, Seo H, et al. Estrogen alters amyloid precursor protein as well as dendritic and cholinergic markers in a mouse model of Down syndrome. Hippocampus. 2003;13:905–914. doi: 10.1002/hipo.10130. [DOI] [PubMed] [Google Scholar]
- Granholm AC, Sanders LA, Crnic LS. Loss of cholinergic phenotype in basal forebrain coincides with cognitive decline in a mouse model of Down’s syndrome. Exp Neurol. 2000;161:647–663. doi: 10.1006/exnr.1999.7289. [DOI] [PubMed] [Google Scholar]
- Gygi SP, Rochon Y, Franza BR, Aebersold R. Correlation between protein and mRNA abundance in yeast. Mol Cell Biol. 1999;19:1720–1730. doi: 10.1128/mcb.19.3.1720. [DOI] [PMC free article] [PubMed] [Google Scholar]
- Hanney M, Prasher V, Williams N, et al. Memantine for dementia in adults older than 40 years with Down’s syndrome (MEADOWS): a randomised, double-blind, placebo-controlled trial. Lancet. 2012;379:528–536. doi: 10.1016/S0140-6736(11)61676-0. [DOI] [PubMed] [Google Scholar]
- Holtzman DM, Santucci D, Kilbridge J, et al. Developmental abnormalities and age-related neurodegeneration in a mouse model of Down syndrome. Proc Natl Acad Sci USA. 1996;93:13333–13338. doi: 10.1073/pnas.93.23.13333. [DOI] [PMC free article] [PubMed] [Google Scholar]
- Howe CL, Mobley WC. Signaling endosome hypothesis: A cellular mechanism for long distance communication. J Neurobiol. 2004;58:207–216. doi: 10.1002/neu.10323. [DOI] [PubMed] [Google Scholar]
- Huang YZ, McNamara JO. Neuroprotective effects of reactive oxygen species mediated by BDNF-independent activation of TrkB. J Neurosci. 2012;32:15521–15532. doi: 10.1523/JNEUROSCI.0755-12.2012. [DOI] [PMC free article] [PubMed] [Google Scholar]
- Hunter CL, Isacson O, Nelson M, et al. Regional alterations in amyloid precursor protein and nerve growth factor across age in a mouse model of Down’s syndrome. Neurosci Res. 2003;45:437–445. doi: 10.1016/s0168-0102(03)00005-1. [DOI] [PubMed] [Google Scholar]
- Hyde LA, Crnic LS. Age-related deficits in context discrimination learning in Ts65Dn mice that model Down syndrome and Alzheimer’s disease. Behav Neurosci. 2001;115:1239–1246. [PubMed] [Google Scholar]
- Ikonomovic MD, Mizukami K, Davies P, et al. The loss of GluR2 (3) immunoreactivity precedes neurofibrillary tangle formation in the entorhinal cortex and hippocampus of Alzheimer brain. J Neuropathol Exp Neurol. 1997;56:1018–1027. doi: 10.1097/00005072-199709000-00007. [DOI] [PubMed] [Google Scholar]
- Ikonomovic MD, Sheffield R, Armstrong DM. AMPA-selective glutamate receptor subtype immunoreactivity in the hippocampal formation of patients with Alzheimer’s disease. Hippocampus. 1995;5:469–486. doi: 10.1002/hipo.450050509. [DOI] [PubMed] [Google Scholar]
- Insausti AM, Megías M, Crespo D, et al. Hippocampal volume and neuronal number in Ts65Dn mice: a murine model of Down syndrome. Neurosci Lett. 1998;253:175–178. doi: 10.1016/s0304-3940(98)00641-7. [DOI] [PubMed] [Google Scholar]
- Jacobs PA, Hassold TJ. The origin of numerical chromosome abnormalities. Adv Genet. 1995;33:101–133. doi: 10.1016/s0065-2660(08)60332-6. [DOI] [PubMed] [Google Scholar]
- Jiang Y, Mullaney KA, Peterhoff CM, et al. Alzheimer’s-related endosome dysfunction in Down syndrome is Abeta-independent but requires APP and is reversed by BACE-1 inhibition. Proc Natl Acad Sci USA. 2010;107:1630–1635. doi: 10.1073/pnas.0908953107. [DOI] [PMC free article] [PubMed] [Google Scholar]
- Kaur G, Sharma a, Xu W, et al. Glutamatergic transmission aberration: a major cause of behavioral deficits in a murine model of Down’s syndrome. J Neurosci. 2014;34:5099–5106. doi: 10.1523/JNEUROSCI.5338-13.2014. [DOI] [PMC free article] [PubMed] [Google Scholar]
- Kelley C, Powers B, Velazquez R. Sex differences in the cholinergic basal forebrain in the Ts65Dn mouse model of Down syndrome and Alzheimer’s disease. Brain Pathol. 2014a;24:33–44. doi: 10.1111/bpa.12073. [DOI] [PMC free article] [PubMed] [Google Scholar]
- Kelley CM, Powers BE, Velazquez R, et al. Maternal choline supplementation differentially alters the basal forebrain cholinergic system of young-adult Ts65Dn and disomic mice. J Comp Neurol. 2014b;522:1390–1410. doi: 10.1002/cne.23492. [DOI] [PMC free article] [PubMed] [Google Scholar]
- Kervern M, Angeli A, Nicole O, et al. Selective impairment of some forms of synaptic plasticity by oligomeric amyloid-β peptide in the mouse hippocampus: implication of extrasynaptic NMDA receptors. J Alzheimers Dis. 2012;32:183–196. doi: 10.3233/JAD-2012-120394. [DOI] [PubMed] [Google Scholar]
- Koch G, Di Lorenzo F, Bonnì S, et al. Impaired LTP-but not LTD-like cortical plasticity in Alzheimer’s disease patients. J Alzheimers Dis. 2012;31:593–599. doi: 10.3233/JAD-2012-120532. [DOI] [PubMed] [Google Scholar]
- Köhler C, Chan-Palay V, Wu JY. Septal neurons containing glutamic acid decarboxylase immunoreactivity project to the hippocampal region in the rat brain. Anat Embryol (Berl) 1984;169:41–44. doi: 10.1007/BF00300585. [DOI] [PubMed] [Google Scholar]
- Kurt MA, Davies DC, Kidd M, et al. Synaptic deficit in the temporal cortex of partial trisomy 16 (Ts65Dn) mice. Brain Res. 2000;858:191–197. doi: 10.1016/s0006-8993(00)01984-3. [DOI] [PubMed] [Google Scholar]
- Leverenz JB, Raskind MA. Early amyloid deposition in the medial temporal lobe of young Down syndrome patients: a regional quantitative analysis. Exp Neurol. 1998;150:296–304. doi: 10.1006/exnr.1997.6777. [DOI] [PubMed] [Google Scholar]
- Lockrow J, Boger H, Bimonte-Nelson H, Granholm A-C. Effects of long-term memantine on memory and neuropathology in Ts65Dn mice, a model for Down syndrome. Behav Brain Res. 2011a;221:610–622. doi: 10.1016/j.bbr.2010.03.036. [DOI] [PMC free article] [PubMed] [Google Scholar]
- Lockrow J, Boger H, Gerhardt G, et al. A noradrenergic lesion exacerbates neurodegeneration in a Down syndrome mouse model. J Alzheimers Dis. 2011b;23:471–489. doi: 10.3233/JAD-2010-101218. [DOI] [PMC free article] [PubMed] [Google Scholar]
- Lockrow J, Prakasam A, et al. Cholinergic degeneration and memory loss delayed by vitamin E in a Down syndrome mouse model. Exp Neurol. 2009;216:278–289. doi: 10.1016/j.expneurol.2008.11.021. [DOI] [PMC free article] [PubMed] [Google Scholar]
- Lorenzi HA, Reeves RH. Hippocampal hypocellularity in the Ts65Dn mouse originates early in development. Brain Res. 2006;1104:153–159. doi: 10.1016/j.brainres.2006.05.022. [DOI] [PubMed] [Google Scholar]
- Maeder ML, Linder SJ, Cascio VM, et al. CRISPR RNA-guided activation of endogenous human genes. Nat Methods. 2013;10:977–979. doi: 10.1038/nmeth.2598. [DOI] [PMC free article] [PubMed] [Google Scholar]
- Mann DM, Yates PO, Marcyniuk B, Ravindra CR. The topography of plaques and tangles in Down’s syndrome patients of different ages. Neuropathol Appl Neurobiol. 1986;12:447–457. doi: 10.1111/j.1365-2990.1986.tb00053.x. [DOI] [PubMed] [Google Scholar]
- McCulloch CE, Searle SR, Neuhaus JM. Generalized, Linear, and Mixed Models. Second Edition John Wiley; New York: 2008. [Google Scholar]
- Middei S, Roberto A, Berretta N, et al. Learning discloses abnormal structural and functional plasticity at hippocampal synapses in the APP23 mouse model of Alzheimer’s disease. Learn Mem. 2010;17:236–240. doi: 10.1101/lm.1748310. [DOI] [PubMed] [Google Scholar]
- Moon J, Chen M, Gandhy SU, et al. Perinatal choline supplementation improves cognitive functioning and emotion regulation in the Ts65Dn mouse model of Down syndrome. Behav Neurosci. 2010;124:346–361. doi: 10.1037/a0019590. [DOI] [PMC free article] [PubMed] [Google Scholar]
- Mufson EJ, Counts SE, Fahnestock M, Ginsberg SD. Cholinotrophic molecular substrates of mild cognitive impairment in the elderly. Curr Alzheimer Res. 2007;4:340–350. doi: 10.2174/156720507781788855. [DOI] [PubMed] [Google Scholar]
- Nakamura T, Lipton SA. Preventing Ca2+-mediated nitrosative stress in neurodegenerative diseases: possible pharmacological strategies. Cell Calcium. 2010;47:190–197. doi: 10.1016/j.ceca.2009.12.009. [DOI] [PMC free article] [PubMed] [Google Scholar]
- Nixon RA, Cataldo AM. Lysosomal system pathways: genes to neurodegeneration in Alzheimer’s disease. J Alzheimers Dis. 2006;9:277–289. doi: 10.3233/jad-2006-9s331. [DOI] [PubMed] [Google Scholar]
- Parker SE, Mai CT, Canfield MA, et al. Updated national birth prevalence estimates for selected birth defects in the United States, 2004-2006. Birth Defects Res A Clin Mol Teratol. 2010;88:1008–1016. doi: 10.1002/bdra.20735. [DOI] [PubMed] [Google Scholar]
- Peterson GM, Lanford GW, Powell EW. Fate of septohippocampal neurons following fimbria-fornix transection: A time course analysis. Brain Res Bull. 1990;25:129–137. doi: 10.1016/0361-9230(90)90263-y. [DOI] [PubMed] [Google Scholar]
- Peterson GM, Williams LR, Varon S, Gage FH. Loss of GABAergic neurons in medial septum after fimbria-fornix transection. Neurosci Lett. 1987;76:140–144. doi: 10.1016/0304-3940(87)90705-1. [DOI] [PubMed] [Google Scholar]
- Pollonini G, Gao V, Rabe A, Palminiello S. Abnormal expression of synaptic proteins and neurotrophin-3 in the Down syndrome mouse model Ts65Dn. Neuroscience. 2008;156:99–106. doi: 10.1016/j.neuroscience.2008.07.025. [DOI] [PMC free article] [PubMed] [Google Scholar]
- Proctor DT, Coulson EJ, Dodd PR. Reduction in post-synaptic scaffolding PSD-95 and SAP-102 protein levels in the Alzheimer inferior temporal cortex is correlated with disease pathology. J Alzheimers Dis. 2010;21:795–811. doi: 10.3233/JAD-2010-100090. [DOI] [PubMed] [Google Scholar]
- Rajagopal R, Chen Z-Y, Lee FS, Chao MV. Transactivation of Trk neurotrophin receptors by G-protein-coupled receptor ligands occurs on intracellular membranes. J Neurosci. 2004;24:6650–6658. doi: 10.1523/JNEUROSCI.0010-04.2004. [DOI] [PMC free article] [PubMed] [Google Scholar]
- Rammes G, Hasenjäger A, Sroka-Saidi K, et al. Therapeutic significance of NR2B-containing NMDA receptors and mGluR5 metabotropic glutamate receptors in mediating the synaptotoxic effects of β-amyloid oligomers on long-term potentiation (LTP) in murine hippocampal slices. Neuropharmacology. 2011;60:982–990. doi: 10.1016/j.neuropharm.2011.01.051. [DOI] [PubMed] [Google Scholar]
- Reeves RH, Irving NG, Moran TH, et al. A mouse model for Down syndrome exhibits learning and behaviour deficits. Nat Genet. 1995;11:177–184. doi: 10.1038/ng1095-177. [DOI] [PubMed] [Google Scholar]
- Reisberg B, Doody R, Stoffler A. A 24-week open-label extension study of memantine in moderate to severe Alzheimer disease. Arch Neurol. 2006;63:49–54. doi: 10.1001/archneur.63.1.49. [DOI] [PubMed] [Google Scholar]
- Reisberg B, Doody R, Stöffler A. Memantine in moderate-to-severe Alzheimer’s disease. N Engl J Med. 2003;348:1333–1341. doi: 10.1056/NEJMoa013128. [DOI] [PubMed] [Google Scholar]
- Rueda N, Flórez J, Martínez-Cué C. Mouse models of Down syndrome as a tool to unravel the causes of mental disabilities. Neural Plast. 2012;2012:584071. doi: 10.1155/2012/584071. [DOI] [PMC free article] [PubMed] [Google Scholar]
- Rueda N, Llorens-Martín M, Flórez J, et al. Memantine normalizes several phenotypic features in the Ts65Dn mouse model of Down syndrome. J Alzheimers Dis. 2010;21:277–290. doi: 10.3233/JAD-2010-100240. [DOI] [PubMed] [Google Scholar]
- Salehi A, Delcroix J-D, Belichenko PV, et al. Increased App expression in a mouse model of Down’s syndrome disrupts NGF transport and causes cholinergic neuron degeneration. Neuron. 2006;51:29–42. doi: 10.1016/j.neuron.2006.05.022. [DOI] [PubMed] [Google Scholar]
- Saran NG, Pletcher MT, Natale JE, et al. Global disruption of the cerebellar transcriptome in a Down syndrome mouse model. Hum Mol Genet. 2003;12:2013–2019. doi: 10.1093/hmg/ddg217. [DOI] [PubMed] [Google Scholar]
- Shaulsky G, Loomis WF. Gene expression patterns in Dictyostelium using microarrays. Protist. 2002;153:93–98. doi: 10.1078/1434-4610-00087. [DOI] [PubMed] [Google Scholar]
- Skaper SD. The biology of neurotrophins, signalling pathways, and functional peptide mimetics of neurotrophins and their receptors. CNS Neurol Disord Drug Targets. 2008;7:46–62. doi: 10.2174/187152708783885174. [DOI] [PubMed] [Google Scholar]
- Stempler S, Ruppin E. Analyzing gene expression from whole tissue vs. different cell types reveals the central role of neurons in predicting severity of Alzheimer’s disease. PLoS ONE. 2012;7:e45879. doi: 10.1371/journal.pone.0045879. [DOI] [PMC free article] [PubMed] [Google Scholar]
- Sturgeon X, Gardiner KJ. Transcript catalogs of human chromosome 21 and orthologous chimpanzee and mouse regions. Mamm Genome. 2011;22:261–271. doi: 10.1007/s00335-011-9321-y. [DOI] [PubMed] [Google Scholar]
- Talantova M, Sanz-Blasco S, Zhang X, et al. Aβ induces astrocytic glutamate release, extrasynaptic NMDA receptor activation, and synaptic loss. Proc Natl Acad Sci USA. 2013;110:E2518–E2527. doi: 10.1073/pnas.1306832110. [DOI] [PMC free article] [PubMed] [Google Scholar]
- Tuszynski M. Growth-factor gene therapy for neurodegenerative disorders. Lancet Neurol. 2002;1:51–57. doi: 10.1016/s1474-4422(02)00006-6. [DOI] [PubMed] [Google Scholar]
- Tuszynski MH. Nerve growth factor gene therapy in Alzheimer disease. Alzheimer Dis Assoc Disord. 2007;21:179–189. doi: 10.1097/WAD.0b013e318068d6d2. [DOI] [PubMed] [Google Scholar]
- Velazquez R, Ash JA, Powers BE, et al. Maternal choline supplementation improves spatial learning and adult hippocampal neurogenesis in the Ts65Dn mouse model of Down syndrome. Neurobiol Dis. 2013;58:92–101. doi: 10.1016/j.nbd.2013.04.016. [DOI] [PMC free article] [PubMed] [Google Scholar]
- Wang T, Huang Q, Reiman EM, et al. Effect of memantine on clinical ratings, fluorodeoxyglucose positron emission tomography measurements, and cerebrospinal fluid assays in patients with moderate to severe Alzheimer dementia. J Clin Pyschopharmacology. 2013;33:636–642. doi: 10.1097/JCP.0b013e31829a876a. [DOI] [PubMed] [Google Scholar]
- Williams R, Chung JY, Ylaya K, et al. Characterizations and validations of novel antibodies toward translational research. Proteomics Clin Appl. 2010;4:618–625. doi: 10.1002/prca.200900186. [DOI] [PMC free article] [PubMed] [Google Scholar]
- Wisniewski K, Wisniewski H, Wen G. Occurrence of neuropathological changes and dementia of Alzheimer’s disease in Down’s syndrome. Ann Neurol. 1985;17:278–282. doi: 10.1002/ana.410170310. [DOI] [PubMed] [Google Scholar]
Associated Data
This section collects any data citations, data availability statements, or supplementary materials included in this article.