

Abstract
PURPOSE
To assess lesion detection and artifact size reduction of a MAVRIC-SEMAC hybrid sequence (MAVRIC-SL) compared to standard sequences at 1.5T and 3T in porcine knee specimens with metal hardware.
METHODS
Artificial cartilage and bone lesions of defined size were created in the proximity of titanium and steel screws with 2.5 mm diameter in 12 porcine knee specimens and were imaged at 1.5T and 3T MRI with MAVRIC-SL PD and STIR, standard FSE T2 PD and STIR and fat-saturated T2 FSE sequences. Three radiologists blinded to the lesion locations assessed lesion detection rates on randomized images for each sequence using ROC. Artifact length and width were measured.
RESULTS
Metal artifact sizes were largest in the presence of steel screws at 3T (FSE T2 FS: 28.7cm2) and 1.5T (16.03cm2). MAVRIC-SL PD and STIR reduced artifact sizes at both 3T (1.43cm2; 2.46cm2) and 1.5T (1.16cm2; 1.59cm2) compared to FS T2 FSE sequences (27.57cm2; 13.20cm2). At 3T, ROC derived AUC values using MAVRIC-SL sequences were significantly higher compared to standard sequences (MAVRIC-PD: 0.87, versus FSE-T2-FS: 0.73 (p=0.025); MAVRIC- STIR: 0.9 versus T2-STIR: 0.78 (p=0.001) and versus FSE-T2-FS: 0.73 (p=0.026)). Similar values were observed at 1.5T. Comparison of 3T and 1.5T showed no significant differences (MAVRIC-SL PD: p=0.382; MAVRIC-SL STIR: p=0.071.
CONCLUSION
MAVRIC-SL sequences provided superior lesion detection and reduced metal artifact size at both 1.5T and 3T compared to conventionally used FSE sequences. No significant disadvantage was found comparing MAVRIC-SL at 3T and 1.5T, though metal artifacts at 3T were larger.
Keywords: Magnetic resonance imaging (MRI), artifact reduction, periprosthetic imaging, MAVRIC-SL
INTRODUCTION
Despite advances in implant engineering, operation technique and postoperative care, mechanical issues such as fracture, loosening or mal-positioning as well as complications such as infection, wound healing deficiency or particle disease remain common challenges associated with orthopedic implants (1–3). Medical imaging is essential in assessing orthopedic hardware complications after surgery, or the implant site prior to revision interventions. Radiography has played an important role in diagnosing fractures and loosening, but provides very limited soft tissue information. Magnetic resonance imaging (MRI) provides excellent soft tissue and bony visualization, however, imaging near metal hardware coincides with large image degradation, signal loss as well as signal pile-up (hyperintensity), preventing conventional MRI methods from providing adequate and diagnostically conclusive images of adjacent structures (4).
Recently, new pulse sequences such as the multi-acquisition variable-resonance image combination (MAVRIC) and the slice encoding for metal artifact correction (SEMAC) (5–7) have been proposed to reduce metal artifacts in the presence of metallic orthopedic implants and thus potentially improve image quality (8, 9). More recently, a hybrid technique combining both methods was introduced, potentially allowing for feasible application of a 3D artifact reduction technique at both 1.5T and 3T field strength (4, 10). Artifact size is expected to increase at 3T compared to 1.5T due to increased field inhomogeneities and is known to differ depending on hardware composition (11, 12). Therefore in this study we investigated the performance of the MAVRIC-SEMAC hybrid (MAVRIC-SL, or MAVRIC “SeLective”) hypothesizing feasible application and effective metal artifact reduction at both 1.5 and 3T MRI. Diagnostic accuracy, artifact size and image quality were evaluated depending on the field strength, sequence and hardware material used by means of an experimental animal cadaver model.
Thus, the goals of this study were (i) to assess the performance of MAVRIC-SL at 1.5T and 3T field strengths in detecting lesions compared to standard clinical 2D fast spin echo (2D-FSE) MRI sequences in the presence of metallic hardware and (ii) to compare MAVRIC-SL at 1.5T and at 3T in terms of image quality and artifact size reduction for different hardware alloy composition (titanium and steel) in an animal cadaver model.
MATERIALS AND METHODS
Specimen Preparation
Given that animal specimens were used, this study was exempt from institutional review board approval. Twelve porcine knees with intact joint capsule and intact cartilage were purchased from a local abattoir (pigs were 6–10 months old) and stored at 4° Celsius. Designated hardware was implanted, lesions were created and MRI scanning at two field strengths (1.5T and 3T) was performed within two days.
Titanium and stainless steel fixation screws with 2.5 mm diameter and 20 to 40 mm length from orthopedic hardware sets (Synthes, West Chester, PA) were inserted in each knee before imaging. Parallel holes for hardware placement were drilled at defined locations at a 90-degree angle to the sagittal plane using a handheld drill (Dewalt, Baltimore, MA) with a guided 2.5 mm drill head. One screw was each inserted into a drill hole through the femoral condyles distal to the growth plate and at the tibia plateau proximal to the growth plate with defined distance (4–10 mm) to the articular surface. Additional screws were placed at each tibia shaft and if possible at the femoral shaft. A total number of 42 screws (4 knee specimens with titanium and 8 with steel screws) were positioned as illustrated in Figure 1.
Figure 1.
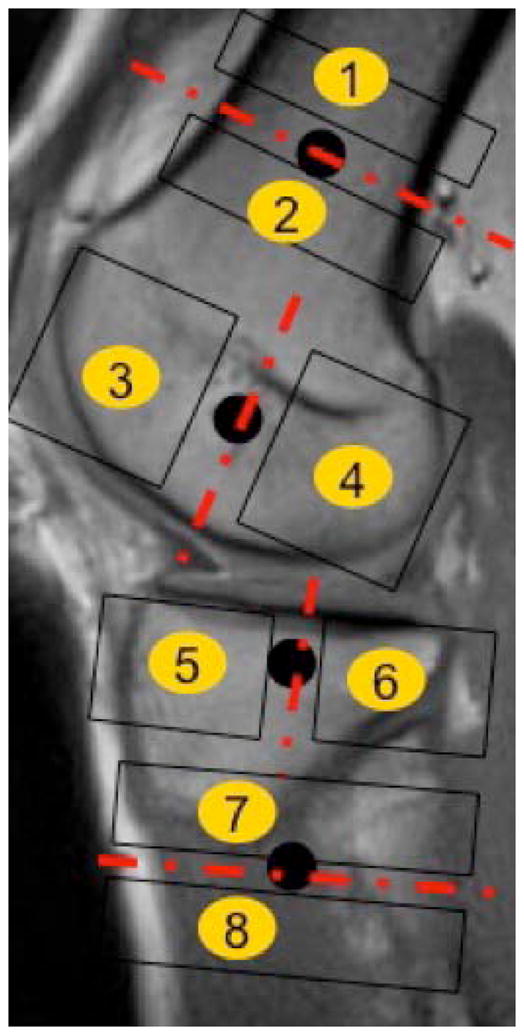
Chart illustrating the hardware placement scheme and the eight compartments defined surrounding the hardware placed. Compartments were defined as proximal/distal to the shaft screws and anterior/posterior to the screws placed at the femur condyles/tibia epiphysis. Black circles mark screw positions.
A total of 37 bone lesions was drilled at defined distances (4, 6 or 10mm) to the screw axis using a custom made polyethylene drill guide, imitating osteolytic lesions and lucencies as found in vivo (13–15). Lesions were distributed over two defined observation areas around each screw as outlined in Figure 1 resulting in a total of 6 observation areas per knee (8 areas respectively if 4 screws were placed).
Cartilage defects were created similar to those found in arthroscopy (16–18): After lateral and medial arthrotomy using porcelain scalpel blades (Fine Science Tools, San Francisco, CA) to avoid susceptibility artifacts, the cartilage was carefully excised to create oval shaped full-thickness and partial-thickness defects (approximately 3mm width; 5mm length). The underlying subchondral bone and bone marrow, as well as the adjacent cruciate ligaments, menisci and tendons were carefully preserved in all procedures. A total of 14 cartilage lesions were created at 4 defined cartilage observation areas (medial and lateral femoral condyle, medial and lateral tibia plateau).
A maximum of one lesion was created per bone or cartilage observation area and for accurate scoring we allowed for more than 50% of the observation areas to be controls without any lesions, resulting in a total of 51 lesions distributed over 132 observation areas. Figure 2 shows a specimen with representative lesions. The joints were reassembled with attention to the proper physiologic alignment and filled with a mix of water and ultrasonographic gel (Parker Laboratories, Fairfield, NJ) as a synovial fluid substitute (18, 19). After repeated flexion and extension movements in a water bath to minimize air enclosure, joints were sealed without sutures using wrapping foil and scanned in sealed and labeled 2.5-gallon plastic bags.
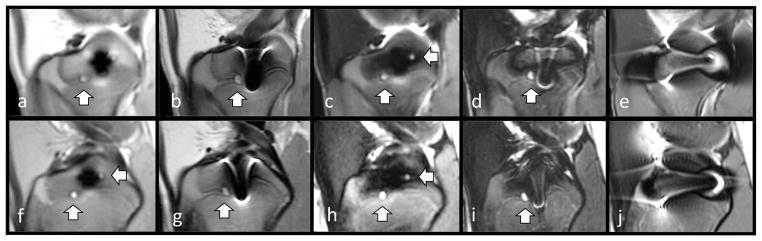
Figure 2.

Pig knee specimen prepared with a titanium screw placed at the tibia epiphysis showing an artificially created cartilage lesion (short arrows) at the medial femoral condyle and a drill hole simulating a lytic bone lesion (long arrow) in the medial tibia plateau at two field strengths: 3T (top row) and 1.5T (bottom row). Sequences: 3T MAVRIC-SL PD (a), 3T FSE PD (b), 3T MAVRIC-SL STIR (c), 3T FSE STIR (d), 3T FSE T2 fs.(e) 1.5T MAVRIC-SL PD (f), 1.5T FSE PD (g), 1.5T MAVRIC-SL STIR (h), 1.5T FSE STIR (i), 1.5T FSE T2 fs (j)
MR Imaging
For each specimen, imaging was performed at both 1.5T on a Signa HDxt scanner and a 3T Discovery MR 750 scanner (GE Healthcare, Waukesha, WI). using 8 channel transmit-receive knee coils (In-Vivo Coorporation, Gainesville, FL). We used MAVRIC-SL that combines the advantages of MAVRIC’s efficient spectral-spatial acquisition with SEMAC’s slab-selective properties.(5, 6, 20) and compared to conventional fast spin echo (FSE) sequences. The MRI protocol included a proton density (PD)-weighted 2D fast spin echo (FSE) sequence, a T2-weighted 2D FSE sequence, a short T1 inversion recovery (STIR) fat suppressed sequence, PD-weighted 3D MAVRIC-SL sequence, and 3D MAVRIC-SL with STIR fat suppression. For STIR fat suppression, the inversion time was 150 ms for 1.5T and 170 ms for 3T. For MAVRIC-SL, 24 spectral bins were acquired with 1kHz frequency offset per bin, and an echo train length of 24, a slice thickness of 3 mm, and field of view of 21 cm were used for imaging parameters. For FSE, large readout bandwidths (+/−62.5 or +/−125 kHz) were used in order to minimize the expected artifacts ensuring a fair comparison. Table 1 shows the detailed sequence parameters.
Table 1.
Pulse Sequence parameters of the sequences used at 1.5T and at 3T field strength.
| Field Strength | Pulse Sequence | TR [ms] | TE [ms] | rBW [kHz] | NEX | Matrix | FoV [cm] | Slice [mm] | ETL | Time |
|---|---|---|---|---|---|---|---|---|---|---|
| 3 T | FSE PD | 2500 | 30 | +/−125 | 4 | 384 x 256 | 21 | 3 | 12 | 2’05’’ |
| FSE T2 STIR | 7750 | 35 | +/−125 | 3 | 256 x 192 | 21 | 3 | 12 | 3’37’’ | |
| FSE T2 FS | 4168 | 42 | +/−62.5 | 3 | 352 x 224 | 21 | 3 | 10 | 4’02 | |
| MAVRIC-SL PD | 2467 | 25 | +/−125 | 0.5 | 320 x 192 | 21 | 3 | 24 | 3’48 | |
| MAVRIC-SL STIR | 4534 | 35 | +/−125 | 0.5 | 320 x 192 | 21 | 3 | 24 | 6’35 | |
| 1.5 T | FSE PD | 2500 | 22.4 | +/−62.5 | 4 | 320 x 192 | 21 | 3 | 12 | 2’45’’ |
| FSE T2 STIR | 6500 | 42 | +/−62.5 | 4 | 288 x 192 | 21 | 3 | 12 | 7’03’’ | |
| FSE T2 FS | 3300 | 44 | +/−62.5 | 1 | 256 x 224 | 21 | 3 | 10 | 5’17’’ | |
| MAVRIC-SL PD | 2400 | 35 | +/−125 | 0.5 | 320 x 192 | 21 | 3 | 24 | 3’25’’ | |
| MAVRIC-SL STIR | 4500 | 35 | +/−125 | 0.5 | 320 x 192 | 21 | 3 | 24 | 5’29’’ |
Image Analysis
Specimens were imaged with the same protocol acquiring 10 sequences per knee. Images were imported to a standard clinical picture archiving system (PACS, Agfa, Ridgefield Park, NJ) with randomly assigned numerical header information, to blind the clinical readers to field strength and sequence information as well as to the hardware material used. After an initial training session on a test specimen, three radiologists (one board certified radiologist and two musculoskeletal fellowship-trained radiologists: LN, SL,TL, with 3, 7 and >20 years of experience) graded the cartilage and bone lesions for each observation area according to three levels of confidence: (1) absence of a lesion; (2) query; (3) presence of a lesion (18).
Additionally one reader (SL) measured the artifact size in all sequences in the anterior-posterior (AP) and the cranio-caudal (CC) extension using the linear PACS measurement tool. To simplify estimation of the area covered by the clover-leaf shaped metal artifacts, these linear measurements were multiplied (AP x CC). Repeated measurements were performed in 15% of all cases to calculate reproducibility measurements.
To evaluate subjective image quality, the amount of noise and the delineation of cartilage from joint fluid and subchondral bone were graded using a four-level scale (score of 1: poor image quality; 2: satisfactory image quality; 3: good image quality; 4: excellent image quality) (18). Furthermore, the visualization of bones, growth plates and the cruciate ligaments were also graded (1: no evaluation possible; 2: partially covered by artifact, >1cm; 3: partially covered by artifact, <1cm; 4: fully demonstrated).
Statistical Analysis And Reproducibility
Measurements of artifact size and image quality scores were averaged across all 3 readers and compared for each sequence and field strength. In order to assess diagnostic performance for each individual reader, sequence and field strength, the areas under the receiver operating characteristics (ROC) curve (AUC) and the 95% confidence intervals (CI) were computed based on the three-point scale lesion detection ratings. Intra-procedural documentation about the presence and location of the lesions provided the gold standard for the ROC analysis. Repeated measurements within specimens were accounted for by the nonparametric method of Obuchowski (21) in computing the 95% confidence intervals and pairwise comparisons. All statistical tests were two-sided, with a significance level of 0.05.
Intra-observer reproducibility of the ROC analysis was calculated using unweighted Cohen’s Kappa based on a second evaluation of 10% of the specimens (22). Inter-reader reliability was assessed using Fleiss’ Kappa (23). Precision error for the artifact extensions was calculated using the root mean square (RMS) average (24).
RESULTS
Artifact Size Measurements And Image Quality
Intra-reader reliability was calculated with a Cohen’s Kappa value of 0.88 for diagnostic performance and inter-reader reliability with a Fleiss’ Kappa value of 0.53. The precision error was 0.37cm for artifact extension measurements (CV=16.45%). At both field strengths, MAVRIC-SL reduced the dimensions of susceptibility artifacts with the largest difference observed in specimens with steel hardware (at 3T: fat-saturated FSE T2: 28.7cm2 ± 2.34; MAVRIC-SL STIR: 3.69cm2 ± 2.39; MAVRIC-SL PD: 2.4cm2 ± 0.98; mean values and standard deviations shown in Table 2). MAVRIC-SL STIR and MAVRIC-SL PD showed reduced degradation compared to standard FSE T2 STIR, FSE PD and fat-saturated T2 FSE sequences at both field strengths. Figure 3 illustrates a cartilage lesion in the presence of metal artifacts caused by a steel screw in each of the different sequences used. MAVRIC-SL sequences also reduced artifact sizes in the presence of titanium hardware compared to the standard FSE sequences at both field strengths; however, artifact size and differences between sequences were smaller than in the proximity of steel screws (Table 2). Wilcoxon signed-rank tests found significantly larger artifact sizes at 3T than at 1.5T in the presence of steel hardware (p=0.02), but not the presence of titanium hardware (p=0.73).
Table 2.
Artifact dimensions and their standard deviations (SD) in specimens with different hardware materials (Titanium and Steel) and for all specimens combined. Area Under Curve (AUC) values with 95% Confidence Intervals (CI) and Standard Error (SE) of lesion detection ratings for the three clinical readers and all readers combined using MAVRIC-SL PD and MAVRIC-SL STIR sequences as well as conventional FSE sequences (T2 FS, PD, FSE T2 STIR) at both 1.5T and 3T field strength (all sagittal).
| Imaging parameters | Artifact dimensions [cm2]± SD for Different hardware materials | AUC for lesion detection Across all readers | AUC for lesion detection Individual readers | ||||||
|---|---|---|---|---|---|---|---|---|---|
| Field Strength | Sequence | All specimens (n=12) | Steel (n=8) | Titanium (n=4) | AUC -All readers | 95%-CI | AUC -Reader A | AUC -Reader B | AUC -Reader C |
| 1.5T | FSE T2 FS | 13.20 ± 16.35 | 16.03 ± 6.14 | 4.43 ± 1.1 | 0.74 | 0.621; 0.851 | 0.62 | 0.68 | 0.76 |
| 1.5T | FSE PD | 1.77 ± 1.39 | 3.59 ± 2.75 | 0.87 ± 0.4 | 0.75 | 0.653; 0.850 | 0.68 | 0.73 | 0.73 |
| 1.5T | MAVRIC-SL PD | 1.16 ± 0.78 | 1.92 ± 1.49 | 0.67 ± 0.54 | 0.90 | 0.837; 0.964 | 0.77 | 0.84 | 0.82 |
| 1.5T | FSE T2 STIR | 5.57 ± 2.94 | 9.25 ± 10.03 | 2.55 ± 1.61 | 0.86 | 0.778; 0.940 | 0.73 | 0.83 | 0.85 |
| 1.5T | MAVRIC-SL STIR | 1.59 ± 1.52 | 3.30 ± 2.5 | 0.53 ± 0.62 | 0.84 | 0.729; 0.955 | 0.77 | 0.82 | 0.82 |
| 3T | FSE T2 FS | 27.57 ± 31.74 | 28.70 ± 2.34 | 4.61 ± 0.61 | 0.73 | 0.597; 0.857 | 0.60 | 0.71 | 0.70 |
| 3T | FSE PD | 4.08 ± 2.01 | 6.32 ± 1.87 | 1.59 ± 1.94 | 0.82 | 0.739; 0.900 | 0.75 | 0.82 | 0.74 |
| 3T | MAVRIC-SL PD | 1.43 ± 0.85 | 2.40 ± 0.98 | 0.44 ±.29 | 0.87 | 0.806; 0.940 | 0.73 | 0.80 | 0.79 |
| 3T | FSE T2 STIR | 4.93 ± 3.06 | 8.14 ± 10.28 | 1.32 ± 1.28 | 0.78 | 0.697; 0.859 | 0.70 | 0.71 | 0.78 |
| 3T | MAVRIC-SL STIR | 2.46 ± 1.6 | 3.69 ± 2.39 | 1.41 ± 0.84 | 0.90 | 0.816; 0.979 | 0.83 | 0.86 | 0.86 |
Figure 3.
Pig knee specimen demonstrating a cartilage lesion in the presence of metal artifacts caused by two steel screws placed at the tibia epiphysis and the femoral condyle imaged at 3T (top row) and 1.5T (bottom row). Sequences: Sequences: 3T MAVRIC-SL PD (a), 3T FSE PD (b), 3T MAVRIC-SL STIR (c), 3T FSE STIR (d), 3T FSE T2 fs.(e) 1.5T MAVRIC-SL PD (f), 1.5T FSE PD (g), 1.5T MAVRIC-SL STIR (h), 1.5T FSE STIR (i), 1.5T FSE T2 fs (j). Metal artifact areas are noticeably smaller in size in the MAVRIC-SL sequences (a,c,f,h) and visualization of the cartilage lesion is improved.
Each reader performed subjective image quality grading for each sequence and field strength (Figure 4). At both field strengths the conventional FSE PD sequences performed best in terms of overall image quality (Figure 4) and performed slightly better than MAVRIC-SL PD. Conventional fat-saturated T2 FSE sequences performed worst for the visualization of bones and growth-plates. Considering the level of variation, image quality ratings ranging between 2.5 and 3 (indicating satisfactory/good image quality) showed no significant differences between sequences related to the field strength (MAVRIC-SL PD p=0.43; MAVRIC-SL STIR p=0.10).
Figure 4.

Average image quality grading for each individual sequence and field strength: subjective image quality parameters rated using a 4-level grading, where 1 is poor and 4 is excellent image quality/visualization of corresponding structure.
ROC Analysis
Diagnostic performance in detecting bone and cartilage lesions was evaluated using the area under the curve (AUC) from receiver operating curves. Sequence, reader and field strength specific AUC values are displayed in Table 2. Using MAVRIC-SL sequences, improvements in detection accuracy over conventional FSE sequences were found at both 1.5T and 3T field strength: each of the 3 readers performed better at accurately detecting the lesions created in the bone and cartilage compartments compared to the FSE fat-saturated T2 sequences. AUC values were averaged across readers to allow for comparison of each individual sequence. Figure 5 shows representative images of lesions imaged with the different sequences used and corresponding metal artifact dimensions. As demonstrated in Table 3, MAVRIC-SL PD showed significantly higher AUC values at 1.5T than the conventional 1.5T FSE PD (p=0.001) and FSE fat-saturated T2 f (p=0.002) sequences. Furthermore 1.5T MAVRIC-SL STIR (AUC: 0.84) showed better discrimination ability than the fat-saturated FSE T2 sequence (AUC: 0.74), but no statistically significant difference was observed (p=0.158) and it performed equivalent to the conventional T2 STIR sequence (Table 3). Results at 3T showed higher differences than at 1.5T: MAVRIC-SL PD showed significantly better lesion detection compared to fat-saturated FSE T2 (p=0.025) and a positive trend compared to the standard PD sequence (Table 3). 3T MAVRIC-SL STIR showed significantly increased detection ability compared to FSE T2 STIR (p<0.001) and fat-saturated FSE T2 (p=0.026).
Figure 5.

Pig knee specimen demonstrating bone drill hole lesions in the presence of steel screws placed at the tibia epiphysis and the femoral condyle imaged at 3T (top row) and at 1.5T (bottom row). Sequences: 3T MAVRIC-SL PD (a), 3T FSE PD (b), 3T MAVRIC-SL STIR (c), 3T FSE STIR (d), 3T FSE T2 fs.(e) 1.5T MAVRIC-SL PD (f), 1.5T FSE PD (g), 1.5T MAVRIC-SL STIR (h), 1.5T FSE STIR (i), 1.5T FSE T2 fs (j). Lesions are in part visualized in FSE STIR (d,i) and FSE PD (b,g) sequences (vertical arrows) and an additional lesion is only revealed with MAVRIC-SL (a,c,f,h) metal artifact suppression (horizontal arrows).
Table 3.
MAVRIC-SL (PD, STIR) sequences and corresponding lesion detection ratings (ROC Area Under Curve values) compared to conventional FSE sequences (PD, STIR, T2) as well as comparison of AUC values using MAVRIC-SL sequences depending on the field-strength (1.5T and 3T)
| Sequence 1 | AUC 1 (all readers) | Sequence 2 | AUC 2 (all readers) | AUC 1 –AUC 2 | 95% Confidence Interval of AUC difference | p-value |
|---|---|---|---|---|---|---|
| 1.5T MAVRIC-SL PD | 0.90 | 3T MAVRIC-SL PD | 0.87 | 0.03 | −0.036; 0.091 | 0.382 |
| 1.5T MAVRIC-SL STIR | 0.84 | 3T MAVRIC-SL STIR | 0.90 | -0.06 | −0.116; 0.004 | 0.071 |
| 1.5T MAVRIC-SL PD | 0.90 | 1.5T FSE PD | 0.75 | 0.15 | 0.065; 0.232 | 0.001 |
| 1.5T MAVRIC-SL PD | 0.90 | 1.5T FSE T2 FS | 0.74 | 0.16 | 0.063; 0.265 | 0.002 |
| 1.5T MAVRIC-SL STIR | 0.84 | 1.5T T2 STIR | 0.86 | −0.02 | −0.102; 0.067 | 0.693 |
| 1.5T MAVRIC-SL STIR | 0.84 | 1.5T FSE T2 FS | 0.74 | 0.11 | −0.041; 0.252 | 0.158 |
| 3T MAVRIC-SL PD | 0.87 | 3T FSE PD | 0.82 | 0.05 | −0.005; 0.113 | 0.072 |
| 3T MAVRIC-SL PD | 0.87 | 3T FSE T2 FS | 0.73 | 0.15 | 0.018; 0.274 | 0.025 |
| 3T MAVRIC-SL STIR | 0.90 | 3T T2 STIR | 0.78 | 0.12 | 0.053; 0.186 | 0.001 |
| 3T MAVRIC-SL STIR | 0.90 | 3T FSE T2 FS | 0.73 | 0.17 | 0.021; 0.321 | 0.026 |
When comparing MAVRIC-SL sequences between field strengths, discrimination ability did not differ significantly (p=0.38; p=0.07; Table 3) despite larger sized artifacts at 3T. A sub-analysis investigating differences between the cartilage and bone lesion compartments showed AUC values for cartilage compartments to be higher compared to bone AUC values (Table 4). Higher differences between lesion detection ability were observed in the bone compartments than in the cartilage compartments.
Table 4.
Area Under Curve (AUC) values for lesion detection ratings using MAVRIC-SL sequences (all SAG) and standard FSE sequences (PD, STIR, T2) at 1.5T and 3T separately analyzing bone and cartilage lesion compartments
| Field Strength | Sequence | AUC (all readers)- Bone Compartments | 95% Confidence Interval | AUC (all readers)- Cartilage Compartments | 95% Confidence Interval |
|---|---|---|---|---|---|
| 1.5T | FSE T2 FS | 0.71 | 0.577; 0.840 | 0.81 | 0.620; 0.992 |
| 1.5T | FSE PD | 0.76 | 0.651; 0.871 | 0.72 | 0.512; 0.920 |
| 1.5T | MAVRIC-SL PD | 0.89 | 0.814; 0.971 | 0.93 | 0.854; 1.010 |
| 1.5T | FSE T2 STIR | 0.83 | 0.724; 0.944 | 0.92 | 0.824; 1.020 |
| 1.5T | MAVRIC-SL STIR | 0.79 | 0.631; 0.947 | 0.98 | 0.953; 1.020 |
| 3T | FSE T2 FS | 0.73 | 0.593; 0.858 | 0.72 | 0.502; 0.941 |
| 3T | FSE PD | 0.76 | 0.638; 0.890 | 0.91 | 0.831; 0.996 |
| 3T | MAVRIC-SL PD | 0.84 | 0.754; 0.934 | 0.93 | 0.867; 0.991 |
| 3T | FSE T2 STIR | 0.74 | 0.586; 0.899 | 0.84 | 0.743; 0.934 |
| 3T | MAVRIC-SL STIR | 0.89 | 0.788; 0.994 | 0.93 | 0.822; 1.040 |
DISCUSSION
Our data evaluating artifacts in the presence of fixation screws demonstrates superior lesion detection of MAVRIC-SL sequences at both 1.5T and 3T field strength compared to standard clinical 2D-FSE MRI sequences. When comparing MAVRIC-SL sequences between field strengths, neither lesion detection ability nor image quality parameters differed significantly indicating good applicability of MAVRIC-SL at 3T.
Various hardware and software solutions have been proposed to mitigate metal artifacts in MRI, including prepolarized MRI (25), single-point imaging (26) and dual-reversed-gradient acquisitions (27). However, these techniques have failed to prove clinical feasibility mainly due to hardware issues, low spatial resolution or long acquisition times. More promising techniques such as SEMAC use view-angle-tilting (VAT), a 2D slice-selective imaging approach.(28) SEMAC corrects artifacts via encoding of each excited slice against metal-induced field inhomogeneities (6, 20, 29). The recently developed MAVRIC method is a 3D imaging approach using similar physical principles: multiple 3D-FSE images are acquired at incremented offsets of transmission and reception frequencies.(5) Multiple spectral MAVRIC images are then independently reconstructed to produce volumetric images. For our study we have used MAVRIC-SL, a hybrid method incorporating the benefits of SEMAC’s slab selectivity and MAVRIC’s spectral bin combination (10, 30).
Consistent with previous studies investigating SEMAC or MAVRIC, our data demonstrates significant reduction of metal artifact sizes compared to conventional sequences (8). Hayter et al. found in an in-vivo study in 2011, that MAVRIC significantly reduced periprosthetic artifacts at the shoulder, hip and knee at 1.5T (31). Sutter et al. demonstrated successful artifact reduction of WARP sequences (VAT and SEMAC) in patients with hip implants at 1.5T (32). Tao Ai et al. compared three different 2D techniques in 2012 (VAT, SEMAC) and one 3D technique similar to MAVRIC-SL (MSVAT-SPACE) at 1.5T and found all four to reduce metal artifact volume when compared to 2D conventional acquisitions (28). However, none of these studies investigated combined 2D and 3D MSI techniques, high field strengths (3T), or compared different field strengths.
In our study we also investigated metal artifact suppression with respect to different hardware materials (titanium and steel). Koff et al. placed different samples of orthopedic hardware in a phantom grid and investigated the magnitude of the surrounding susceptibility artifacts using MAVRIC at 1.5T depending on the material. Consistent with their findings our data showed steel to cause larger artifacts than titanium (33). However, they did not compare different field strengths and used an in vitro setting without simulated pathology.
Currently, 3T imaging is not recommended for imaging of peri-prosthetic soft tissue, because induced local static magnetic field offsets are expected to double when moving from 1.5T to 3T with resulting larger susceptibility artifacts at 3T. Few studies have compared metal artifact sizes depending on the field strength. Farrelly et al. compared performance of 1.5T and 3T, but did not investigate specific metal suppression sequences and only used titanium hardware, which causes comparatively small artifacts (34). More recently, studies have suggested the feasibility of metal artifact suppression at higher field strengths. Lee et al. showed improved periprosthetic delineation of the anatomical structures at the spine using SEMAC at 3T in vivo (30). Koch et al. also presented initial data optimizing MAVRIC sequences for high field MRI at 3T, but did not provide any quantitative data (35). Our study found artifacts to be larger at 3T than at 1.5T, particularly in the presence of steel hardware. However, when comparing AUC values, MAVRIC-SL showed increased lesion discrimination ability compared to conventional fat-saturated FSE T2 sequences at both field strengths. Furthermore lesion detection ability using MAVRIC-SL sequences was in many cases significantly higher compared to their conventional equivalents at both 1.5T and 3T.
Interestingly, when comparing MAVRIC-SL sequences between field strengths, both 3T MAVRIC-SL sequences showed similarly high lesion detection ability as MAVRIC-SL sequences at 1.5T. MAVRIC-SL STIR in fact showed a trend to perform better at 3T, suggesting effective mitigation of metal artifacts in both field strengths. The differences observed between cartilage and bone compartment AUC values most likely result from less artifact coverage of the cartilage due to the larger distance from the placed hardware.
We do not advocate replacement of conventional FSE imaging with MAVRIC-SL, which provides reliable depiction of areas not affected by metal hardware. However, MAVRIC-SL provides significantly improved depiction of the bone-prosthesis interface and the periprosthetic soft tissue without limitation of the subjectively assessed image quality compared to conventional FSE sequences, which are areas of crucial interest (10, 31, 36). In a clinical setting, imaging of periprosthetic tissue is crucial in evaluating potential component loosening, periprosthetic osteolysis, wear-induced bone loss and synovial complications. This may be particularly important in the context of recently increasing intracapsular disease induced by metal on metal prostheses. Continuous optimization is ongoing and currently additional contrast variations are being developed, e.g. using MAVRIC ultra short echo-times (UTE) (37).
This study has several strengths, particularly due to its comparison of metal artifact mitigation using a novel MAVRIC-SL technique at both 1.5T and 3T. Furthermore it combined direct metal artifact size measurements with a ROC analysis based on lesion detection by multiple clinical readers. However, some limitations result from this study design. In-vivo conditions are hard to simulate perfectly with an animal model, however, care was taken to create lesions as similar as possible to in vivo pathologies. Porcelain blades were used to avoid metal-rub off and air artifacts were minimized. No plates or joint replacement hardware were implanted, but only individual screws, to allow for a sufficient number of distinct observation areas. Therefore this data might not be fully transferable to larger hardware due to the relatively small size of the hardware used. Artifact size was measured in plane only, due to slight variations of the hardware length. However, considering the shape of the screws used with constant diameter, this is not expected to affect the amount of degradation. Image quality was only evaluated subjectively, as this study focused on the lesion detection ability rather than SNR. Lastly, to allow for field strength comparison, two different scanners from the same manufacturer and according coils had to be used, complicating direct image comparison.
In conclusion, our data demonstrates superior lesion detection and reduced metal artifact size using MAVRIC-SL (PD, STIR) at both 1.5 and 3 Tesla compared to conventionally used FSE sequences (PD, STIR, T2). With the experimental setup used, diagnostic performance of MAVRIC-SL at 3T showed no significant disadvantage compared to 1.5T. We believe that metal artifact reduction is feasible at 3T and similarly effective compared to lower field strengths, which is particularly important given today’s increasingly widespread use of 3T high-field MRI.
Acknowledgments
Funding information: This research project was funded by NIH; Grant numbers: R01AR057336, NIH 1P30AR058899. We would like to acknowledge General Electric healthcare for research funding and support.
References
- 1.Gallo J, Goodman SB, Konttinen YT, Raska M. Particle disease: biologic mechanisms of periprosthetic osteolysis in total hip arthroplasty. Innate immunity. 2013;19(2):213–24. doi: 10.1177/1753425912451779. [DOI] [PMC free article] [PubMed] [Google Scholar]
- 2.Le DH, Goodman SB, Maloney WJ, Huddleston JI. Current Modes of Failure in TKA: Infection, Instability, and Stiffness Predominate. Clin Orthop Relat Res. 2014 doi: 10.1007/s11999-014-3540-y. [DOI] [PMC free article] [PubMed] [Google Scholar]
- 3.Hayter CL, Koff MF, Potter HG. Magnetic resonance imaging of the postoperative hip. J Magn Reson Imaging. 2012;35(5):1013–25. doi: 10.1002/jmri.23523. [DOI] [PubMed] [Google Scholar]
- 4.Hargreaves BA, Worters PW, Pauly KB, Pauly JM, Koch KM, Gold GE. Metal-induced artifacts in MRI. AJR Am J Roentgenol. 2011;197(3):547–55. doi: 10.2214/AJR.11.7364. [DOI] [PMC free article] [PubMed] [Google Scholar]
- 5.Koch KM, Lorbiecki JE, Hinks RS, King KF. A multispectral three-dimensional acquisition technique for imaging near metal implants. Magn Reson Med. 2009;61(2):381–90. doi: 10.1002/mrm.21856. [DOI] [PubMed] [Google Scholar]
- 6.Lu W, Pauly KB, Gold GE, Pauly JM, Hargreaves BA. SEMAC: Slice Encoding for Metal Artifact Correction in MRI. Magn Reson Med. 2009;62(1):66–76. doi: 10.1002/mrm.21967. [DOI] [PMC free article] [PubMed] [Google Scholar]
- 7.den Harder JC, van Yperen GH, Blume UA, Bos C. Ripple artifact reduction using slice overlap in slice encoding for metal artifact correction. Magn Reson Med. 2014 doi: 10.1002/mrm.25127. [DOI] [PubMed]
- 8.Koff MF, Shah P, Koch KM, Potter HG. Quantifying image distortion of orthopedic materials in magnetic resonance imaging. J Magn Reson Imaging. 2013 doi: 10.1002/jmri.23991. [DOI] [PubMed] [Google Scholar]
- 9.den Harder JC, van Yperen GH, Blume UA, Bos C. Off-resonance suppression for multispectral MR imaging near metallic implants. Magn Reson Med. 2014 doi: 10.1002/mrm.25126. [DOI] [PubMed] [Google Scholar]
- 10.Koch KM, Brau AC, Chen W, Gold GE, Hargreaves BA, Koff M, McKinnon GC, Potter HG, King KF. Imaging near metal with a MAVRIC-SEMAC hybrid. Magn Reson Med. 2011;65(1):71–82. doi: 10.1002/mrm.22523. [DOI] [PubMed] [Google Scholar]
- 11.Koff MF, Shah P, Koch KM, Potter HG. Quantifying image distortion of orthopedic materials in magnetic resonance imaging. J Magn Reson Imaging. 2013;38(3):610–8. doi: 10.1002/jmri.23991. [DOI] [PubMed] [Google Scholar]
- 12.Ahmad FU, Sidani C, Fourzali R, Wang MY. Postoperative magnetic resonance imaging artifact with cobalt-chromium versus titanium spinal instrumentation: presented at the 2013 Joint Spine Section Meeting. Clinical article. J Neurosurg Spine. 2013;19(5):629–36. doi: 10.3171/2013.7.SPINE1359. [DOI] [PubMed] [Google Scholar]
- 13.Nadaud MC, Fehring TK, Fehring K. Underestimation of osteolysis in posterior stabilized total knee arthroplasty. J Arthroplasty. 2004;19(1):110–5. doi: 10.1016/j.arth.2003.08.005. [DOI] [PubMed] [Google Scholar]
- 14.Kurmis TP, Kurmis AP, Campbell DG, Slavotinek JP. Pre-surgical radiologic identification of peri-prosthetic osteolytic lesions around TKRs: a pre-clinical investigation of diagnostic accuracy. J Orthop Surg Res. 2008;3(47) doi: 10.1186/1749-799X-3-47. [DOI] [PMC free article] [PubMed] [Google Scholar]
- 15.Weiland DE, Walde TA, Leung SB, Sychterz CJ, Ho S, Engh CA, Potter HG. Magnetic resonance imaging in the evaluation of periprosthetic acetabular osteolysis: a cadaveric study. J Orthop Res. 2005;23(4):713–9. doi: 10.1016/j.orthres.2005.02.007. [DOI] [PubMed] [Google Scholar]
- 16.McGibbon CA, Trahan CA. Measurement accuracy of focal cartilage defects from MRI and correlation of MRI graded lesions with histology: a preliminary study. Osteoarthritis Cartilage. 2003;11(7):483–93. doi: 10.1016/s1063-4584(03)00078-5. [DOI] [PubMed] [Google Scholar]
- 17.Lee KY, Masi JN, Sell CA, Schier R, Link TM, Steinbach LS, Safran M, Ma B, Majumdar S. Computer-aided quantification of focal cartilage lesions using MRI: accuracy and initial arthroscopic comparison. Osteoarthritis Cartilage. 2005;13(8):728–37. doi: 10.1016/j.joca.2005.03.007. [DOI] [PubMed] [Google Scholar]
- 18.Masi JN, Sell CA, Phan C, Han E, Newitt D, Steinbach L, Majumdar S, Link TM. Cartilage MR imaging at 3.0 versus that at 1.5 T: preliminary results in a porcine model. Radiology. 2005;236(1):140–50. doi: 10.1148/radiol.2361040747. [DOI] [PubMed] [Google Scholar]
- 19.Link TM, Sell CA, Masi JN, Phan C, Newitt D, Lu Y, Steinbach L, Majumdar S. 3.0 vs 1.5 T MRI in the detection of focal cartilage pathology--ROC analysis in an experimental model. Osteoarthritis Cartilage. 2006;14(1):63–70. doi: 10.1016/j.joca.2005.08.002. [DOI] [PubMed] [Google Scholar]
- 20.Hargreaves BA, Chen W, Lu W, Alley MT, Gold GE, Brau AC, Pauly JM, Pauly KB. Accelerated slice encoding for metal artifact correction. J Magn Reson Imaging. 2010;31(4):987–96. doi: 10.1002/jmri.22112. [DOI] [PMC free article] [PubMed] [Google Scholar]
- 21.Obuchowski NA. Nonparametric analysis of clustered ROC curve data. Biometrics. 1997;53(2):567–78. [PubMed] [Google Scholar]
- 22.Fleiss JL, Cohen J. Equivalence of Weighted Kappa and Intraclass Correlation Coefficient as Measures of Reliability. Educ Psychol Meas. 1973;33(3):613–9. [Google Scholar]
- 23.Fleiss JL. Measuring Nominal Scale Agreement among Many Raters. Psychological bulletin. 1971;76(5):378. [Google Scholar]
- 24.Gluer CC, Blake G, Lu Y, Blunt BA, Jergas M, Genant HK. Accurate assessment of precision errors: how to measure the reproducibility of bone densitometry techniques. Osteoporos Int. 1995;5(4):262–70. doi: 10.1007/BF01774016. [DOI] [PubMed] [Google Scholar]
- 25.Venook RD, Matter NI, Ramachandran M, Ungersma SE, Gold GE, Giori NJ, Macovski A, Scott GC, Conolly SM. Prepolarized magnetic resonance imaging around metal orthopedic implants. Magn Reson Med. 2006;56(1):177–86. doi: 10.1002/mrm.20927. [DOI] [PubMed] [Google Scholar]
- 26.Ramos-Cabrer P, van Duynhoven JP, Van der Toorn A, Nicolay K. MRI of hip prostheses using single-point methods: in vitro studies towards the artifact-free imaging of individuals with metal implants. Magn Reson Imaging. 2004;22(8):1097–103. doi: 10.1016/j.mri.2004.01.061. [DOI] [PubMed] [Google Scholar]
- 27.Skare S, Andersson JL. Correction of MR image distortions induced by metallic objects using a 3D cubic B-spline basis set: application to stereotactic surgical planning. Magn Reson Med. 2005;54(1):169–81. doi: 10.1002/mrm.20528. [DOI] [PubMed] [Google Scholar]
- 28.Ai T, Padua A, Goerner F, Nittka M, Gugala Z, Jadhav S, Trelles M, Johnson RF, Lindsey RW, Li X, et al. SEMAC-VAT and MSVAT-SPACE sequence strategies for metal artifact reduction in 1.5T magnetic resonance imaging. Invest Radiol. 2012;47(5):267–76. doi: 10.1097/RLI.0b013e318240a919. [DOI] [PubMed] [Google Scholar]
- 29.Lu W, Pauly KB, Gold GE, Pauly JM, Hargreaves BA. Slice encoding for metal artifact correction with noise reduction. Magn Reson Med. 2011;65(5):1352–7. doi: 10.1002/mrm.22796. [DOI] [PMC free article] [PubMed] [Google Scholar]
- 30.Lee YH, Lim D, Kim E, Kim S, Song HT, Suh JS. Usefulness of slice encoding for metal artifact correction (SEMAC) for reducing metallic artifacts in 3-T MRI. Magn Reson Imaging. 2013;31(5):703–6. doi: 10.1016/j.mri.2012.11.004. [DOI] [PubMed] [Google Scholar]
- 31.Hayter CL, Koff MF, Shah P, Koch KM, Miller TT, Potter HG. MRI after arthroplasty: comparison of MAVRIC and conventional fast spin-echo techniques. AJR Am J Roentgenol. 2011;197(3):W405–11. doi: 10.2214/AJR.11.6659. [DOI] [PubMed] [Google Scholar]
- 32.Sutter R, Ulbrich EJ, Jellus V, Nittka M, Pfirrmann CW. Reduction of metal artifacts in patients with total hip arthroplasty with slice-encoding metal artifact correction and view-angle tilting MR imaging. Radiology. 2012;265(1):204–14. doi: 10.1148/radiol.12112408. [DOI] [PubMed] [Google Scholar]
- 33.Koff MSP, Koch K, Potter H. Quantification of Image Distortion of Orthopedic Materials in Magnetic Resonance Imaging. ISMRM 2012, Melbourne, Proc Intl Soc Mag Reson Med. 2012;20(2012) [Google Scholar]
- 34.Farrelly C, Davarpanah A, Brennan SA, Sampson M, Eustace SJ. Imaging of soft tissues adjacent to orthopedic hardware: comparison of 3-T and 1.5-T MRI. AJR Am J Roentgenol. 2010;194(1):W60–4. doi: 10.2214/AJR.08.1740. [DOI] [PubMed] [Google Scholar]
- 35.Koch KKM, Potter H. Multi-Spectral Imaging Near Metal: Understanding Performance Differences Between 1.5T and 3.0T. ISMRM 2012, Melbourne, Proc Intl Soc Mag Reson Med. 2012;20(2012) [Google Scholar]
- 36.Sutter R, Hodek R, Fucentese SF, Nittka M, Pfirrmann CW. Total knee arthroplasty MRI featuring slice-encoding for metal artifact correction: reduction of artifacts for STIR and proton density-weighted sequences. AJR Am J Roentgenol. 2013;201(6):1315–24. doi: 10.2214/AJR.13.10531. [DOI] [PubMed] [Google Scholar]
- 37.Carl M, Koch K, Du J. MR imaging near metal with undersampled 3D radial UTE-MAVRIC sequences. Magn Reson Med. 2013;69(1):27–36. doi: 10.1002/mrm.24219. [DOI] [PubMed] [Google Scholar]