

Abstract
The airway surface liquid (ASL) is a very thin mucus layer and covers the vocal fold (VF) surface. Adhesion mediated by the ASL occurs during phonation as the VFs separate after collision. Such adhesion is hypothesized to determine voice quality and health. However, biomechanical insights into the adhesive processes during VF oscillation are lacking. Here, a computational study is reported on self-sustained VF vibration involving contact and adhesion. The VF structural model and the glottal airflow are considered fully three-dimensional. The mechanical behavior of the ASL is described through a constitutive traction–separation law where mucosal cohesive strength, cohesive energy and rupture length enter. Cohesive energy values considered are bound below by the cohesive energy of water at standard temperature and pressure. Cohesive strength values considered are bound above by prior reported data on the adhesive strength of mucosal surface of rat small intestine. This model introduces a mechanical length scale into the analysis. The sensitivity of various aspects of VF dynamics such as flow-declination rate, VF separation under adhesive condition and formation of multiple local fluid bridges is determined in relation to specific ASL adhesive properties. It is found that for the ASL considered here, the characteristics of the VF separation process are of debond type. Instabilities lead to the breakup of the bond area into several smaller bond patches. Such finding is consistent with in-vivo observations.
Keywords: phonation, vocal fold, adhesion, airway surface liquid, computer model
1 Introduction
The superficial mucus layer present on the vocal fold (VF) surfaces, known as the airway surface liquid (ASL), is postulated to induce an adhesive behavior at the glottal surface (Nakagawa et al 1998; Ayache et al 2004). VF surface adhesion in turn can influence phonation (Chodara et al 2012) as well as voice health (Leydon et al 2009). Electrolytic composition of ASL (Kutta et al 2002) and characteristics of its spatial agglomeration (Bonilha et al 2008) have been studied but its mechanical characteristics remain difficult to measure.
The objective of the present study is to establish a computational framework for the analysis of VF vibration under the consideration of VF collision and subsequent ASL mediated adhesion. Our specific aims are
to understand what changes are induced into VF vibration by VF adhesion,
to investigate how characteristic parameters of the constitutive model describing adhesion affect the VF vibration process, and
to characterize the VF separation process in view of the multiple (biomechanical and geometrical) length scales of the problem.
Computational investigation of VF surface adhesion pose substantial challenges since the adhesive nature of the ASL is relevant only in the presence of VF collision, and because simulation of VF vibration including collision effects already poses many complexities. Key challenges in modeling VF collision arise from the need for the use of a three-dimensional (3D) VF geometry, the complex behavior of airflow associated with the substantial changes in Reynolds number during open and closed phases, and the requirement to both resolve local stresses in the contact well while also accounting for the large deformation of the VFs at high-amplitude vibration.
Numerical studies available in literature that use a Navier–Stokes model for the air flow and a continuum VF model to determine 3D VF collision due to high-amplitude self-sustained oscillation are few (Zheng et al 2009; Bhattacharya and Siegmund 2014). Problems involving FSI can be solved either by employing a monolithic strategy where the governing equations of the coupled system are solved by a single solver (Zheng et al 2009), or by following a segregated approach where bi-directional coupling is used to communicate between distinct solvers for the fluid and solid domains (Bhattacharya and Siegmund 2014). This study follows recent work by (Bhattacharya and Siegmund 2014) and the solution of the coupled fluid–structure interaction (FSI) model use an arbitrary Lagrangian–Eulerian approach. On the other hand, currently the only known quantitative study of glottal surface adhesion on VF dynamics was performed by Decker (2006), where lubrication theory based continuum model was used to determine tractions on the ASL–VF interface as a function of the separation velocity between the VFs. A 2D geometry of the VF was used and the flow model was 1D.
The present study substantially expands the modeling of contact and adhesion interactions (referred to as the collisional interaction problem) and connects the collisional interaction problem into a full scale 3D FSI framework.
The ASL mediated adhesion effects are explicitly accounted for in the model simulation by employing constitutive relations describing the relationship between VF adhesive tractions and VF separation distance, and by embedding the collisional interaction model into a fully 3D transient dynamic FSI computational model. The 3D geometry of the VFs used is based on a canonical model known as M5 that was introduced in Scherer et al (2001). M5 geometry-based models are relevant as these have been employed in several studies on phonation (Thomson et al 2005; Spencer et al 2006; Mihaescu et al 2010; Pickup and Thomson 2011; Bhattacharya and Siegmund 2012). Constitutive properties corresponding to air and VF tissue (Zhang et al 2006) are employed without any scaling of these quantities. A Navier–Stokes model is used for air flow, and the VF tissue is considered to be isotropic linear elastic with viscoelastic behavior. The values of the constitutive parameters of the traction–separation law are bound by data on surface-tension of water and by data on intestinal mucus. To solve the governing equations of the overall system, a segregated solution approach is used, with coupling between the solvers enforced between consecutive time increments.
A detailed analysis is conducted based on parametric variation of traction–separation law parameters. Biomechanical properties of ASL are thus linked to aspects of VF dynamics. Adhesion characteristics are found to influence both local and global VF dynamical behavior. Local aspects relate to the actual process of VF separation, and global aspects to the overall flow rate and frequency. Fundamental insights into separation characteristics are obtained using concepts from the field of non-linear fracture mechanics.
2 Method
2.1 Computational model
The present model of self-sustained VF vibration in the presence of adhesion comprises separate continuum region definitions for the glottal airflow and the pair of VFs, a collisional interaction model (comprising both contact and adhesion) and an FSI model. The collisional interaction model describes the details of the interaction between the VFs. The FSI model describes the interaction between each VF and the glottal airflow. Details of the model and model results in the absence of adhesion are given by the authors in Bhattacharya and Siegmund (2014).
Figure 1a shows the geometry of the airflow domain which is based on the M5 description (Scherer et al 2001). Its geometric dimensions are provided in table 1; governing equations (continuity and Navier–Stokes) are given in table 2a and Newtonian fluid constitutive behavior is prescribed in table 2b along with (constant) density and dynamic viscosity of air in table 1; boundary conditions in table 2c prescribe a time-varying pressure at the inlet
Fig. 1.

(a) Geometry of the glottal airflow domain: the inlet, outlet and glottal surfaces are shaded, the coordinate origin (at the intersection of the mid-coronal plane, the mid-saggital plane and the VF superior surface) is denoted by ⊗, and axes xis, xml and xap are in the inferior–superior, medial–lateral and anterior–posterior directions respectively; (b) geometry of the left half of the solid VF model: surface CL, line AB, and point XMC are reference regions expected to participate in contact and adhesion; (c) mid-coronal section showing both pairs of VFs and rigid planes: coordinate axes are offset from the origin for clarity
Table 1.
Model constants
| Geometric dimensions | |||
| Tentry | 10.0 mm | Texit | 20.0 mm |
| W | 17.4 mm | T | 10.7 mm |
| L | 20.0 mm | D | 8.40 mm |
| dg | 0.600 mm | dp | 0.200 mm |
| Constitutive properties of air and VF tissue | |||
| ρf | 1.23 kg/m3 | μ | 1.79 · 10−5 kg/m·s |
| E | 6.00 kPa | ν | 0.450 |
| ρs | 1070 kg/m3 | g1 | 0.100 |
| k1 | 0.100 | τ1 | 0.100 s |
Table 2.
Governing equations, boundary conditions and constitutive relations
Airflow domain
| ||
Vocal fold domain
|
| (1) |
where pmax = 400 Pa and tramp = 0.150 s, zero pressure at the outlet and no-slip and no-penetration at all bounding surfaces except the inlet and outlet. The motion of the moving–deforming glottal surface, specifically the grid velocity vg on the glottal surface, is determined by the FSI model (described later). The fluid volume is discretized using tetrahedral cells, with a minimum cell size of 0.050 mm near the glottis ensured throughout the computation. The fluid model is implemented in ANSYS/FLUENT 12.0 (ANSYS, Inc. Canonsburg, PA, USA). A fixed time increment of 50 μs is used throughout the solution process. The implicit PISO algorithm (with neighbor and skewness correction) was used to advance the solution in time.
The VF domain comprises identical and disjoint left and right solid parts. Considering only the left VF the geometry is shown in figure 1b; dimensions are given in table 1; the principle of virtual work (table 2d) governs the VF mechanics; homogeneous isotropic linear viscoelasticity defines the VF constitutive behavior (table 2e); constitutive property values for the tissue domain are given in table 1; boundary conditions listed in table 2f constrain all degrees of freedom on the lateral, anterior and posterior surfaces. Displacement and traction boundary conditions on the glottal surface are determined as a result of collisional interaction and FSI models (described later). The VF volumes are discretized using first-order hexahedral elements with minimum edge length 0.110 mm near the medial surface where contact and adhesion processes are relevant. A line AB oriented in the anterior–posterior direction and lying on the left VF surface and a nodal location XMC corresponding to the mid-point of AB are defined for further reference (figure 1b).
Surface definitions are indicated in figure 1c. The FSI model defines the interaction between the VF surfaces (left: SL, right: SR) and the glottal surface boundary of the airflow domain. Auxiliary static and rigid planes (left: PL, right PR) are positioned as mutually parallel (separation dp, table 1) and symmetrically between the VFs (figure 1c). A collisional interaction is defined between the contact-prone regions of the two VF surfaces (left: CL, right: CR) and the corresponding rigid planes (CL with left face of PL and CR with right face of PR). The rigid planes thus restrict the topology of the deformable airflow domain to its initial undeformed topology (genus 0) and thereby satisfy a limiting condition in the flow solver implementation. As a result of the above topology restriction a leakage flow is present between the surfaces of the opposing VFs that are in active collisional interaction with the rigid planes.
Since CL ⊂ SL and CR ⊂ SR, a determination needs to be made during the simulation regarding whether the collisional interaction model or the FSI model is to be used to compute surface tractions on CL and CR. This choice is based on the VF opening distance Δ ≡ |xml| − dp/2. Specifically, the variable
| (2) |
with initial condition χ(0) = 0 is defined in order to track the state of collisional interaction (χ= 1: active and χ= 0: inactive) at every location on CL and CR. Above Δt = 50 μs is the fixed solution time increment in the solid domain solver. Tractions on CL and CR are computed from the contact-adhesion model when χ= 1 and from the FSI model when χ= 0. A continuous line segment within AB (figure 1b) is referred to as a collisional interaction line segment (CILS) if χ= 1 for each nodal location on the segment. There may exist multiple CILSs within AB that are mutually disjoint, and any CILS may grow or shrink with time, as well as merge with adjacent segments. The total length of all CILSs on AB at a given time is henceforth denoted as length lc which is bound above by the VF length L.
Collisional interaction comprises both contact and adhesion. In contact a location on the VF surface is coincident with the corresponding rigid plane. Compressive tractions are computed such that the location does not penetrate the rigid plane (hard contact). During VF separation, adhesion of the VFs leads to tensile tractions. When the VF opening distance Δ is in the range (0, δf] the normal traction on the VF surface is given by a traction–separation law (Figure 2)
Fig. 2.
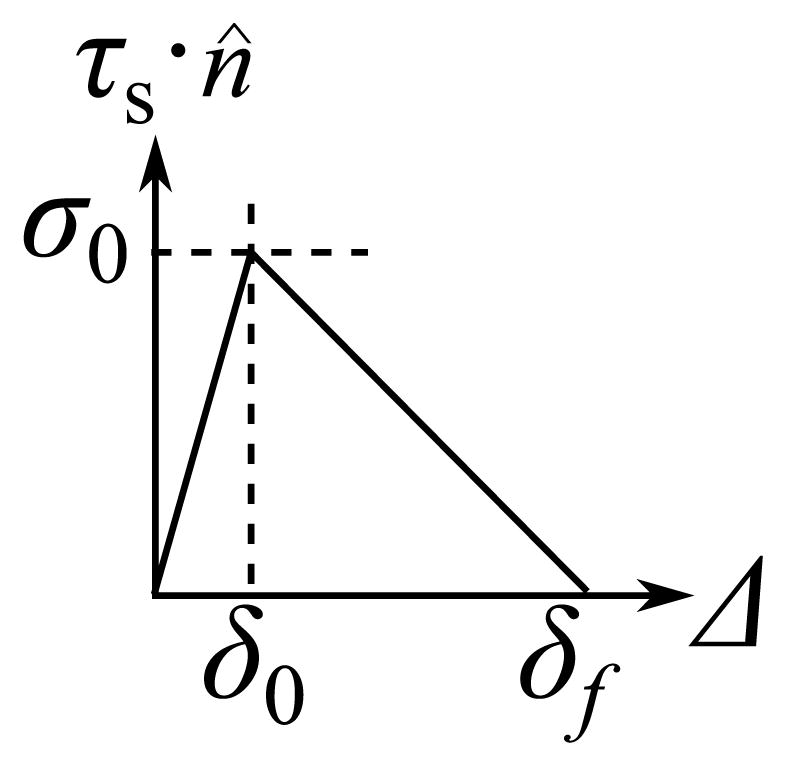
The VF adhesion model: cohesive strength σ0, the elastic separation limit δ0 and rupture length δf
| (3) |
where the parameters are the cohesive strength σ0, the elastic separation limit δ0 and rupture length δf. The cohesive energy ϕ = σ0δf/2 is the area under the traction–separation curve and represents the energy dissipated or work done against surface adhesion per unit surface area. Tangential tractions (τs·r̂) are assumed negligible because the relative tangential motion between the symmetrically deforming opposite VFs is expected to be negligible. The solid domain model including the collisional interaction model is implemented in Abaqus/Standard v6.11 (Dassault Systèmes Simulia Corp., Providence, RI, USA). The solution is integrated implicitly in time using the Hilber-Hughes-Taylor algorithm.
At locations within CL and CR where χ(t) = 0 (as determined from (2) at time t) the FSI model applies the traction boundary condition (also called the dynamic boundary condition)
| (4) |
This condition ensures that in both models the tractions acting on the glottal surfaces domains are equal and opposite to each other. Equation (4) is also applied unconditionally on SL \ CL and SR \ CR at all times. In (4) terms on the left and right sides of the equation are evaluated by interpolating between neighbouring nodes taken from the VF and airflow models respectively. The FSI model is used to determine the grid velocity of the glottal surfaces in the airflow model from the kinematic boundary condition vg = u̇ where the right hand side is evaluated on SL and SR. Thus the deformed glottal surface geometries in the airflow and VF models always remain coincident. Both the dynamic and the kinematic boundary conditions are applied at intervals of 50 μs, i.e. after every solution increment in the flow and solid domain solvers. The FSI model is implemented in MpCCI v4.1 (Fraunhofer SCAI, Sankt Augustin, Germany).
2.2 Glottal surface adhesion properties
Several experimental studies have focused on characterising mucosal surfaces in animals, and have been reviewed in Davidovich-Pinhas and Bianco-Peled (2010); das Neves et al (2011). Although it is well known that indices such as temperature, pH and underlying biochemistry can vary significantly across anatomical sites (e.g. nasal mucosa, intestinal mucosa, corneal mucosa), the role of these indices on mechanical characteristics is poorly understood. Adhesion on the rat small intestinal mucosal surface was studied in Mortazavi and Smart (1994) to suggest that the cohesive strength of mucosal surface is in the order of σ̂0 = 3 kPa (specifically an applied load of 10 g over a surface area of 30.2 mm2 could be sustained). With σ0/σ̂0 ∈ [0.18, 0.72] in the present study (table 3) the value reported in Mortazavi and Smart (1994) is considered as an upper bound for cohesive strength values. On the other hand liquid mediated VF adhesion is understood to have its primary source in surface tension (Ayache et al 2004). Since cohesive energy ϕ is identical to surface tension, at standard temperature and pressure the cohesive energy for a purely aqueous ASL is equal to its surface tension i.e. ϕaq = 0.072 J/m2 (Dean 1999). However in interpreting this value some care is needed because the model geometry detailed above allows for ASL bridges to form only between the VF surfaces and the rigid planes. Cohesive energy, being the work of adhesion done per unit area by a continuous ASL between the VFs, can be equally divided into works of adhesion done per unit area (or cohesive energies) by two separate ASLs forming between each of the two VFs and the corresponding rigid planes. An equivalent one-sided ASL possesses a cohesive strength identical to the original, but half the rupture length of the original ASL. The cohesive energy of an equivalent purely aqueous one-sided ASL is hence . This value denotes the lower bound of the ϕ values used in the present study (table 3). Rupture length values are determined as δf = 2ϕ/σ0. The parameter δ0 is held fixed for all models and its variation is not considered within the scope of the present study.
Table 3.
Adhesion parameters: adhesion is absent in model 1; model 3 is considered as baseline
| Model | σ0 [kPa] | δ0 [mm] | δf [mm] |
|
|
|---|---|---|---|---|---|
| 1 | 0.00 | 0.00 | 0.00 | 0.00 | |
| 2 | 0.540 | 0.100 | 0.267 | 2.00 | |
| 3 | 1.08 | 0.100 | 0.267 | 4.00 | |
| 4 | 1.08 | 0.100 | 0.400 | 6.00 | |
| 5 | 2.16 | 0.100 | 0.267 | 8.00 |
To increase the numerical stability of the computation, viscous contributions to surface tractions are considered as proportional to the approach velocity of the surfaces. Such contributions can also be interpreted to arise from the viscous contribution to liquid mediated adhesion. Here, the magnitudes of viscous tractions are negligible compared to tractions caused by contact and surface-tension based adhesion.
In computations with cohesive constitutive models, mesh convergence depends on the number of elements present in the zone of adhesive break-down i.e. the process zone lp. Process zone length depends on the traction–separation law parameters and the bulk constitutive properties. One fundamental estimate defines lp as . For the model considered herein the minimum lp is 0.815 mm (model 5). A comparison of element size in the contact-prone region (0.110 mm) and the minimum lp required indicates that the mesh used in the solid domain is sufficiently refined to obtain convergence since the process zone is spatially resolved by several elements.
3 Results
Results of the FSI computations are initially presented in terms of the temporal development of the glottal opening at the location XMC (figure 1b). Figure 3 depicts such data in already well-established and self-sustained VF vibration cycles for (a) a case without VF adhesion (model 1) and for (b) a case with VF adhesion (model 3). Henceforth, the time origin (t = 0) is reset to the start of the cycle. The instant at which the cycle ends relative to the time origin is referred to as tcycle and equals the reciprocal of the vibration frequency f.
Fig. 3.

VF opening distance at XMC in dependence of time in the (a) absence of adhesion (model 1) and (b) presence of adhesion (model 3)
Several characteristic time-instants within the cycle are identified below. In the absence of adhesion two time instants characterize VF contact. Instant tc(=3.3 ms) denotes the onset of VF contact at XMC. From tc to a subsequent instant to(= 4.6 ms) the VF is closed. During the interval [tc, to] compressive tractions develop on the VF surface due to VF contact. Starting at to VF opening starts at XMC, and VF tractions are due to the airflow until contact sets in again in the next cycle. In the presence of VF adhesion the process is more complex. Contact is initiated at tc(= 3.7 ms), and opening begins at to(= 4.5 ms). However, the development of the glottal opening is slowed by the tensile tractions on the VF surface. As the VF opening distance increases the tensile tractions increase correspondingly. The initial elastic response of the ASL at XMC lasts until te(= 5.9 ms). For larger values of VF opening distance the traction at XMC decreases but remains positive (tensile). This softening behavior is reflected in the time rate of change of the VF opening distance at instant te. At a subsequent instant tf (= 6.3 ms) the collisional (and specifically adhesive) interaction ceases, and for the remainder of the cycle the VF surfaces are free of adhesive tractions, but subjected to tractions from the air flow until contact is initiated in the next cycle.
For the adhesive case (model 3), normal tractions at XMC in the interval [tc, tf] are plotted in figure 4. The maximum compressive tractions (i.e. the impact stress) is found to be 574 Pa. This is within the range of values predicted or measured previously (Gunter et al 2005; Jiang and Titze 1994; Spencer et al 2006; Verdolini et al 1999). The maximum tensile traction is identical to the prescribed cohesive strength σ0 of the ASL. Even though the elastic characteristic length δ0 of the traction–separation law is smaller than the softening length (δf − δ0), the duration in which airflow pressure deforms the VF against the build up of adhesive tractions (te − to) is 3.5 times longer than the duration in which the VF is deformed against the softening ASL (tf − te). The subintervals [tc, to], [to, te] and [te, tf] correspond to compressive, tensile but increasing, and tensile but diminishing tractions at XMC, respectively. These subintervals are referred to as compression, tension build-up, and tension break-down, respectively.
Fig. 4.

Tractions due to VF contact and adhesion at XMC in dependence of time over one collision cycle each from model 1 (no-adhesion) and model 3 (baseline)
Next, tractions along line AB are considered. The distribution along AB of normal traction only due to contact at instants 3.70 ms through 6.35 ms is shown in figure 5. In the compression phase (figure 5a), which starts when at least one location on AB comes into contact, a single CILS grows until it reaches a maximum length. This maximum length is henceforth referred to as lc,max. The highest compressive traction recorded along AB is 686 Pa. This value is found to occur slightly offset from the mid-coronal plane (xap = 0). The subsequent tension build-up phase (figure 5b) begins with tractions on the CILS gradually changing from compressive to tensile. This change is not uniform along AB with tensile and compressive tractions present simultaneously, especially in the beginning of this phase. Towards the end of this phase the distribution of traction becomes more uniform compared to that during compression phase. Yet, non-uniformity in normal traction exists and is highest at the edges of the CILS. The length of the CILS remains constant in the tension build-up phase.
Fig. 5.
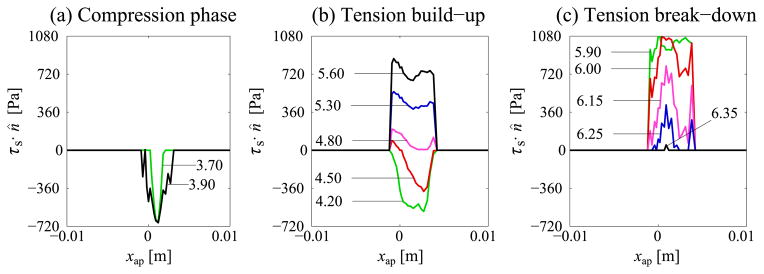
Variation of normal traction along AB at different instants: labels identify corresponding times instants (in milliseconds) with respect to cycle start time
The final tension break-down phase (figure 5b) begins once the glottal opening reaches a critical value δ0 at at least one point on the CILS. The softening behavior of the adhesive interaction initiates predominantly at the ends of the CILS (figure 5c). Furthermore, due to off-center contact the degradation development has an anterior–posterior asymmetry. At 6.25 ms the CILS disintegrates into three disjoint CILSs; each CILS subsequently shrinks to zero.
Table 4 summarizes data for models 1–5 with respect to various energy contributions. One representative vibration cycle from each model is selected such these cycles possess motion characteristics similar to the model 3 cycle as considered above. Note that for the selected cycles the vibration frequency f varies in the range 108–109 Hz. For the cycle corresponding to model 1 table 4 reports the following energy contributions averaged over the whole cycle: strain energy, kinetic energy and viscous damping. For cycles corresponding to models 2–5 energy contributions are reported at the instant at which the energy dissipated to surface adhesion peaks. The energy contributions reported are strain energy, kinetic energy, viscous damping and the energy dissipated to surface adhesion. These energy contributions along with the energy lost to numerical contact damping arise from the (external) work done by the flow pressure on the VF glottal surfaces. In all cases the majority (60 – 75%) of external work is converted to strain energy, approximately 20–30% is converted to kinetic energy and approximately 3–4% is dissipated in viscoelastic damping in the VF. The amount of energy dissipated in surface adhesion in models 2–5 is never more that 2.2% of the total external work. Energy lost to numerical contact damping is always < 0.001% for all models.
Table 4.
Magnitudes of different forms of energy during a representative vibration cycle: for model 1 the cycle average is reported; for models 2–5 values are reported at the instant at which energy dissipated to surface adhesion peaks
| Model | Strain energy [μJ] | Kinetic energy [μJ] | Viscous dissipation [μJ] | Surface adhesion [μJ] |
|---|---|---|---|---|
| 1 | 75.1 | 20.1 | 4.83 | - |
| 2 | 35.5 | 13.6 | 2.14 | 0.162 |
| 3 | 33.2 | 14.5 | 1.80 | 0.450 |
| 4 | 34.5 | 16.5 | 2.25 | 1.22 |
| 5 | 32.5 | 11.6 | 1.71 | 0.810 |
Table 5 summarizes cycle characteristic time variables for the five model conditions considered in terms of the computed quantities to, tc, te, tf and maximum compressive traction at XMC and the maximum values recorded for lc for the left VF. For the VF without adhesion (model 1) the time interval during which collisional interaction is active (to − tc) is found to be 1.6 ms. In the presence of adhesion (models 2–5) the active collisional interaction interval (tf − to) substantially increases (from 2.3 ms in model 2 to 3.6 ms in model 5) and this increase closely follows the increase in σ0 across these models. This extended interval of collisional interaction causes the glottal opening to be inhibited and glottal air flow to be restricted. To compare across models the glottal airflow rate in the cycles considered above is normalized with respect to the airflow rate at cycle start and the minimum airflow rate in the cycle. In figure 6 significant differences between models are evident in derivative of the normalized flow rate immediately following the contact event. Specifically, in the duration 4–7 ms (with respect to start of the cycle) the slope of the airflow rate decreases by nearly 50% going from the no-adhesion model 1 to the high cohesive energy models 4 and 5.
Table 5.
Cycle characteristics for different models of ASL cohesive properties: quantities to, tc, te, tf and maximum compressive traction determined at XMC, whereas remaining quantities are global measures
| Model | tc | to − tc | te − to | tf − te | max. impact stress | max lc | vc/cR | η |
|---|---|---|---|---|---|---|---|---|
| [s] | [s] | [s] | [s] | [kPa] | [mm] | - | - | |
| 1 | 0.0033 | 0.0016 | - | - | 1.03 | 3.04 | - | - |
| 2 | 0.0037 | 0.0011 | 0.0010 | 0.0002 | 0.679 | 1.77 | 10.8 | 0.523 |
| 3 | 0.0037 | 0.0008 | 0.0014 | 0.0004 | 0.574 | 1.32 | 15.6 | 0.289 |
| 4 | 0.0032 | 0.0017 | 0.0012 | 0.0006 | 1.11 | 3.62 | 7.58 | 0.318 |
| 5 | 0.0035 | 0.0015 | 0.0020 | 0.0001 | 0.949 | 3.26 | 4.59 | 0.102 |
Fig. 6.

Variation of normalized flow rate during corresponding collision cycles in models 1–5: time origin is set to cycle start time (maximum open state); flow rate is normalized with respect to the initial and minimum values
The first instant with respect to the cycle start time at which any location on AB first undergoes contact is referred to as tc,min. For the same VF vibration cycles analysed, consider the interval [tc,min, tcycle]. Figure 7a shows the combined length lc, of the CILSs that appear on AB, in dependence of time for the models 1–5. Time and collisional interaction line length are normalized as
Fig. 7.

(a) Variation of normalized collisional interaction line length lc/lc,max in dependence of normalized time (t − tc,min)/(tcycle − tc,min); (b) number of disjoint collisional interaction line segments in dependence of time
| (5) |
| (6) |
in order to remove the variations due to differences in severity of collision between models. The dependence of λ on t̂ is then expected to vary mostly due to the variation in adhesion. Here a clear order of adhesive strength on the development of lc emerges. The stronger the adhesion the further extended lc=1 becomes in time.
During the process of tension break-down the CILS on AB may disintegrate into multiple pieces. In contrast with lc which refers to the combined length of all segments figure 7b shows the number of disjoint CILSs that are contained in AB as a function of time in the interval [tc,min, tcycle].
4 Discussion
Before discussing the influence of ASL adhesive properties on the mechanics of VF vibration, some remarks are made about the present model. Stroboscopic images of oscillating VFs (Hsiung 2004) indicate that in severe cases of mucus aggregation, the ASL on the opposite VFs can form a connected fluidic bridge during phonation. For all the models studied here, VF vibration is found to be sufficiently high to cause total failure of the ASL in each cycle. Across all models medial–lateral displacement uml at XMC is found to be ~ −0.180 mm when averaged over the collision cycles. For this displacement level a continuous ASL connecting the two VFs is estimated to rupture at δf = 2 |xml(XMC)| = 2 |−dg/2 + 〈uml〉 (XMC)| = O(1 mm) where 〈·〉 denotes an average taken over the collision cycle. If such an ASL is purely aqueous in composition then it follows from (3) that it cohesive strength is σ0 = 144 Pa. The values of σ0 considered in this study (table 3) are then up to an order of magnitude higher than that in the purely aqueous ASL. The evidence that adhesive nature of the ASL varies significantly within subjects (Hsiung 2004) supports the range considered herein.
It was remarked earlier that due to computational modeling limitations a leakage flow occurs when the opposing VF surfaces are actively undergoing collisional interaction with the corresponding rigid planes. Since the state of collisional interaction is tracked by the variable χ, the instantaneous leakage flow is higher when the condition χ = 1 hold over a larger anterior–posterior extent of the VF surface. Hence an upper bound of the glottal area through which the leakage occurs can be estimated as (2δf + δp)lc,max. The effect of the leakage flow is expected to confound determination of absolute flow rate values, but not the normalized flow rate presented in this paper. The reduction in the derivative of the airflow rate (or glottal flow derivative GFD as referred to in voice literature) corresponding to an increase in cohesive energy perhaps provides an interesting biomechanical insight. Peterson-Falzone et al (1981) found that the absence of ASL on vocal fold surfaces led to breathy voice in patients of ectodermal dysplasia, whereas it is well known that a smooth and sinusoidal GFD (such as in the absence of ASL in case 1) is correlated with increased breathiness in speech (Epstein 1999). Thus the present results indicate that increased ASL activity can decrease the breathiness in speech by directly decreasing GFD. It is also interesting to note that GFD has been studied extensively in the field of speaker identification (Plumpe et al 1999). Modulation in GFD through ASL adhesive properties further suggests the possibility of variability in speech characteristics of the same speaker.
Implicit algorithms used in the fluid and solid solvers ensure that the effect of varying the time-step size is limited to the accuracy of the solution while the stability of the solution remains unaffected. The influence of the time-step used herein was evaluated separately for the flow solver. A 2D model of flow past rigid VF was constructed to possess geometry, mesh refinement and boundary conditions similar to the present model (identical to Suh and Frankel 2007). This 2D model was analyzed with time-step and time-integration algorithm identical to the present model. The computed flow pressures on the VF surface were found to agree with experimental measurements (Scherer et al 2001) within 8 % accuracy. In the solid domain part of the FSI model, the most rapidly varying quantity is the tensile traction due to adhesive ASL. The variation of tensile traction occurs within a duration that is orders of magnitude smaller than characteristic durations of VF vibration and of VF viscoelastic stress-relaxation. Thus accuracy of the solid model is established by ensuring only the accuracy of the tensile tractions. Considering model 3 during the collisional cycle, all nodes on line AB that went into contact were found to attain peak tensile stresses that were within 95 % of the imposed cohesive strength value. Thus the fixed solution time increment of 50 μs is found to accurately capture all relevant details in the flow and solid domain solutions, and is not expected to influence the results presented here.
In comparing across models 1–5 it is firstly noted that according to table 4 the strain energy, kinetic energy and viscous damping contributions always account for > 97 % of the external work (i.e. by the airflow) on the VF. Adhesion accounts for only a minor part (< 3 %). Despite the small amount of energy dissipated in adhesion, ASL adhesive properties significantly influence the VF vibration characteristics as detailed in table 5. The discussion below attempts to elucidate the underlying mechanics leading to the predicted differences in vibration characteristics.
A variable that captures VF mechanics just prior to adhesive interaction and yet due to contact interaction is the computed maximum impact stress. Both table 5 and figure 4 show significant differences in maximum compressive stress achieved at XMC between the models. The maximum impact stress is expected to be dependent strongly on the severity of collision. A measure of the severity of collision is the closed quotient (CQ) defined as the fraction of the vibration period during which the VF opening distance at XMC is zero (i.e. contact is closed). Since the vibration frequency does not differ significantly across the different models, the compressive interval duration to − tc in each model is proportional to its CQ. Therefore, the impact stress is expected to scale with to − tc. Indeed, the maximum impact stress is found to increase with increase in the to − tc (table 5).
Beyond the marginally open instant to, the surface normal stress increases from zero to σ0 over the tensile interval [to, te] (table 5). The interval length te − to is expected to decrease as to − tc increases, since for fixed f a smaller duration is available to return to the fully open state. Simultaneously, te − to is expected to increase as σ0 increases. However, it is difficult to determine a quantitative relationship explaining the variation of te − to in dependence of to − tc and σ0. Qualitatively, the effect of to − tc can be inferred by comparing models 3 and 4 (identical σ0). The smaller te − to in model 4 compared to model 3 is explained by the larger to − tc of model 4. The effect of σ0 is inferred by comparing model 2 with model 3 or comparing model 4 with model 5. In each model pair to − tc is of similar order. The increase in te − to from model 2 to model 3, and from models 4 and 5 is explained by corresponding increases in σ0.
The length of the degrading interval [te, tf] (table 5) expectedly increases from model 3 to model 4 because δf is relatively larger in the model 4. The significantly shorter degrading interval for model 5 compared to other models is attributed to σ0 being the largest in model 5 whereas δf in model 5 is identical or smaller than in other models. The net result is that in model 5 the (restitutive) stress state at te is higher than in other models at corresponding te instants. When the ASL degrades entirely, the higher stress-state produces a higher restitutive acceleration.
In the same manner as the ASL adhesive properties influence the vibration characteristics of point XMC, so also do ASL adhesive properties determine vibration characteristics of line AB as a whole. In this respect consider the normalized forms of time and total CILS length i.e. t̂ and λ. The variable t̂o defines the normalized time instant t̂ when λ increases to 1. It is expected that for t̂ ≤ t̂o, most points in AB are in compression phase (figure 5a) and the dynamics is not influenced by the ASL. This explains t̂o ~ 0.1 for all models in figure 7a.
For t̂ > t̂o the VF without ASL (model 1) loses contact on AB such that for t̂ ≥ 0.3, λ = 0 up to the end of the vibration cycle. For the models with ASL, the behavior after t̂c is significantly different from model 1. As the VF begins to move laterally, various locations on the collisional interaction line are in the compression phase, in the tensile phase, and in the degrading phase. The variable t̂d refers to earliest time instant when at least one point on the CILS is separated from PL by δf. Thus λ = 1 for all t̂ ∈ [t̂o, t̂d]. The duration t̂d − t̂o is a complex interplay between the airflow forces on the non-contacting surface of the VF and the cohesive tractions. Compared to model 3, the lower σ0 in model 2 slightly decreases t̂d − t̂o whereas the larger δf in model 4 causes t̂d − t̂o to increase. Compared to model 4, model 5 has larger σ0 but smaller δf, and these changes produce opposite effects. However, it can be remarked that between models 4 and 5 the effect of σ0 dominates the effect of δf resulting in a net increase of t̂d − t̂c in model 5.
Finally, the instant when degradation of the ASL is complete at all points of the CILS, is indicated by t̂f. Figure 7a indicates that the length of the interval [0, t̂f] increases with increase in cohesive surface energy ϕ of the ASL. The reciprocal of (t̂f − t̂d) is a measure of the average speed with which the collisional interaction line recedes. For models 2–5, this dimensionless speed was found to be 14.1, 22.9, 8.76 and 5.02 respectively. The average speed of reduction in lc is determined as
| (7) |
In figure 7a the significant changes in the slope of λ with respect to t̂ in model 5 suggests that the instantaneous speed of CILS reduction can deviate significantly from the average speed vc. For all models table 5 shows the ratio of vc to the Rayleigh wave speed in the VF tissue (Freund 1990)
| (8) |
which is always found to be O(101). Note that vc does not capture the propagation speed of an individual VF bond patch, and hence vc > cR does not imply a necessarily supersonic decohesion process. Specifically, lc remains constant even as the separation between the line AB and rigid plane increases until the ASL at at least one location fails completely. Moreover, due to the three-dimensionality of the ASL decohesion, decrease in lc is due to the propagation of multiple debonds. For e.g. figure 7b shows that the original CILS may disintegrate into several disjoint CILSs. The multiplicity of disjoint CILS suggests a fingering instability phenomenon.
In adhesive contact of soft elastic materials (similar to the ASL in tension) instabilities can occur in the debond process (Ghatak and Chaudhury 2003; Vilmin et al 2009). Such fingering instabilities are understood to occur with a characteristic wavelength that can be related to the constitutive properties of the ASL (i.e. elasticity and traction–separation law parameters). Given the present configuration, is expected that the range of ASL constitutive parameters considered lead to differences observed in CILS disintegration patterns between models in figure 7b.
For E/σ0 ≫ 1, referred to as adhesive regime, the failure process can be modeled by an interface of infinitesimal thickness. In the present study, E/σ0 was O(101) and hence the ASL has zero initial thickness. In Needleman (1990), failure of an adhesive interface under tension was analyzed considering E/σ0 fixed at 167. The interface failure mechanism was studied in dependence of a parameter that corresponds to the ratio lc,max/δf in the present study. Needleman (1990) found that for lc,max/df ≪ 103 the interface fails in a manner characteristic of a uniform separation process, as opposed to a progressive debond propagation process. The main feature of a uniform separation process is that cohesive tractions are distributed homogeneously along the interface length, and degradation proceeds uniformly. In figure 5b, c for model 3, and also for all models with ASL (models 2–5) considered in this study, the process of VF separation under adhesive condition demonstrated a uniform separation type behavior. This is consistent with the fact that lc,max/δf was found to be O(101) for all the models. Table 5, column 8, shows that the ratio
| (9) |
is indeed O(1) for models 2–5. It is interesting to note that a higher η corresponds to an increased number of segments of the original collisional interaction line during the degradation process (figure 7b).
It is perhaps biomechanically relevant to note that immediately outside the CILS the normal tractions (due to airflow) and are typically compressive and thus opposite in sense to the normal tractions inside the CILS due to adhesion. Hence large gradients in normal traction can result at the CILS boundary and possibly lead to tissue damage in the interior.
The formation of multiple ASL bridges has been reported previously in clinical visualization studies (Hsiao et al 2002; Bonilha et al 2008, 2012). Qualitative characterization undertaken in these studies has aided in distinguishing between voice disorders (Hsiao et al 2002; Hsiung 2004; Bonilha et al 2012). A typical ASL characteristic evaluated is referred to as pooling, and is defined as the portion of VF length over which ASL bridges form (Bonilha et al 2012). Thus ASL pooling is expected to be related closely to the quantity lc arising from the present definition of the CILS. This highlights the relevance of quantitative descriptors such as lc, vc and η detailed in this study.
In characterizing the surface interaction of the ASL, the present study used the measured properties of water in surface tension. It is expected that direct experimental characterization of the ASL will lead to a better understanding of the ASL mechanical behavior, and thus enable a more precise computation of its influence on VF dynamics. A major challenge in experimentally characterizing any surface interaction is to isolate the surface interaction from the background mechanical response of materials on either side of the interface. In the computational model the ASL is attached to the VF tissue (the mechanical response of which varies across samples) and on the other side the ASL interacts with a rigid surface. In Atomic Force Microscopy (AFM) a tip of a known shape (e.g. sphere) and mechanical properties is attached to a cantilever. Typically the tip material is significantly stiffer than the substrate (VF in this case) and hence the tip can be idealized as rigid. Using techniques developed for analyzing nano-scale contact in the presence of adhesion (Lin et al 2007a,b; Leite et al 2012) mechanical properties of the ASL and the underlying VF tissue can perhaps be better quantified.
5 Conclusion
The present study documents numerical simulations of VF vibration taking into account both collision as well as adhesion on the VF surface. Prior work on simulation on VF adhesion and phonation had been substantially more restrictive than the present study. The results presented highlight the important role ASL mediated adhesion can play in influencing both flow and tissue relevant characteristics, as well as collisional interaction on the VF surface. Specifically, it is found that an increase in cohesive energy of the ASL adhesion was found to lead to a reduction in GFD. It may be inferred that through its influence on GFD, the ASL influences characteristics of speech quality e.g. breathiness.
The effects of ASL adhesive properties on VF collisional interaction were high-lighted by focusing on an anterior-posterior oriented line AB situated on the medial plane. The following observations were found to hold in general
length of the tensile interval increases with increase in σ0,
for fixed σ0, the length of the degrading interval increases with increase in δf, and
for fixed δf, the length of the degrading interval decreases with increase in σ0.
In this study a CILS was defined as a continuous line segment within line AB such that at every point on it is active in collision or adhesion. With respect to the anterior-posterior line AB the variables lc, vc were defined to represent, respectively, the cumulative length of CILSs on AB and the average speed with which this cumulative length recedes to zero. It was found that cohesive surface energy ϕ strongly influenced the variation of lc with time. Specifically, a higher cohesive surface energy ϕ resulted in a delayed onset of degradation and a longer time spent in contact (figure 7a). For all the models vc was found to be larger than the Rayleigh wave speed of the VF tissue. This high speed of ASL failure agrees with the finding that ASL failure is of a rather uniform separation type than a progressive debonding event. The determination that the VF separates uniformly rather than by growth from a debond tip was also inferred from the typical computed values of the length scale ratio η using concepts from the field of non-linear fracture mechanics. Lastly, the number of smaller disjoint CILSs formed on AB during breaking of ASL adhesion was also considered in dependence of ASL adhesive properties. For models in which η was higher, the number of smaller disjoint CILSs was found to decrease. ASL kinematics has been well visualized in a clinical setting. Until now the kinematics was characterized by qualitative parameters such as ASL pooling. From the expected link between ASL pooling and CILS quantitative variables (lc, vc and η), ASL pooling is inferred to be ultimately controlled by its adhesive properties.
The effect of ASL adhesion on VF tissue is a direct result of the altered VF vibration characteristics outlined above. Specifically, it was noted that ASL adhesion can cause sharp gradients in normal tractions at the boundary of the CILSs but also in general on the boundary of the collisional interaction zone. The magnitude of the gradients will depend on all ASL adhesive traction–separation law parameters considered here i.e. σ0, ϕ and δf, since these parameters determine how long collisional interaction lasts and the nature of the collisional interaction (compressive, tensile or degrading) over time.
The present study advances the current knowledge of biomechanical aspects of VF dynamics under the influence of glottal surface adhesion. In this study, ASL adhesive behavior as parameterized by the cohesive strength, cohesive energy and rupture length was varied in a potentially physiologically representative range. The results of the study strongly suggest that ASL adhesive behavior might strongly influence VF tissue health and voice quality. Accurate experimental characterization of ASL adhesive behavior is thus imperative to assessing voice health, and further research in this direction is recommended.
Acknowledgments
This work was supported by NIDCD Grant 5R01DC008290-04.
Glossary
Roman symbols
- AB
Line oriented in anterior–posterior direction and situated on medial plane
- CL,CR
Collision-prone parts of SL and SR
- cR
Rayleigh wave-speed in VF tissue
- dg
Initial distance between VFs
- dp
Fixed separation between planes PL and PR
- D
VF medial-lateral extent (depth)
- δDv
Virtual strain tensor associated with δuv
- ε
Volumetric strain
- e
Deviatoric strain tensor
- E
Elastic modulus of VF tissue
- f
Vibration frequency
- g1
Viscoelastic shear-modulus relaxation factor
- G
VF tissue shear modulus
- I
Second-order identity tensor
- k1
Viscoelastic bulk-modulus relaxation factor
- K
VF tissue bulk modulus
- lc
Total length of all interaction line segments
- lcmax
Maximum value of lc over a cycle
- L
VF anterior-posterior extent (length)
- n̂
Unit vector directed normal to surface
- p
Flow pressure
- pin
Time-dependent flow pressure at glottal air tract inlet
- pmax
Maximum flow pressure at glottal air tract inlet
- PL,PR
Rigid planes
- r̂
Arbitrary unit vector parallel to surface
- SL, SR
Glottal surfaces; flow–structure interaction surfaces
- t
Time
- Δt
Time increment
- tc,to, te, tf
Dimensional times denoting local events related to ASL
- tc,min
Time instant corresponding to initiation of contact along line AB
- tcycle
Time instant corresponding to end of collision cycle
- tramp
Time duration for inlet pressure ramp
- t̂,t̃
Non-dimensional time variables
- t̂o,t̂d, t̂f
Non-dimensional times denoting global events related to ASL
- T
VF inferior-superior extent (thickness)
- Tentry
Subglottal channel length
- Texit
Supraglottal channel length
- δuv
Arbitrary virtual displacement
- u
VF displacement
- v
Airflow velocity
- vg
Airflow domain grid velocity
- vc
Average speed at which interaction line segment recedes
- Vf
Glottal air tract volume
- Vs
Volume of space occupied by VF pair
- ∂(Vf)
Glottal air tract boundary
- ∂(Vs)
Bounding surfaces of VF pair
- W
Glottal air tract width
- xis,xml, xap
Coordinate axes in inferior–superior, medial–lateral and anterior–posterior directions respectively
- XMC
Reference location on mid-coronal plane prone to collision
Operators
- (·)
Time derivative
- d
Differential operator
- ∇
Spatial gradient
- ()T
Transpose
- 〈·〉
Average taken over cycle time period
- :
Double contraction between two tensors
Greek symbols
- δ0
Linear-elastic length limit of VF mucus layer
- δf
Rupture length limit of VF mucus layer
- δn
Length of mucus layer
- ϕ
Cohesive energy or surface tension
- ϕaq
Surface tension of water
Cohesive energy of an equivalent one-sided aqueous ASL
- η
Non-dimensional ratio of VF bulk and ASL adhesive properties
- λ
Normalized interaction line segment length
- μ
Dynamic viscosity of air
- ν
Poisson’s ratio of VF tissue
- ρf
Density of air
- ρs
Density of VF tissue
- σ
Cauchy stress tensor in VF volume
- σ0
Cohesive strength of mucus layer
- σn
Cohesive traction due to mucus layer
- τ1
Viscoelastic relaxation rate
- τf
Stress tensor within air flow domain
- τs
Traction on VF surface
- χ
Collision state variable
References
- Ayache S, Ouaknine M, Dejonkere P, Prindere P, Giovanni A. Experimental study of the effects of surface mucus viscosity on the glottic cycle. J Voice. 2004;18(1):107–115. doi: 10.1016/j.jvoice.2003.07.004. [DOI] [PubMed] [Google Scholar]
- Bhattacharya P, Siegmund T. A canonical biomechanical vocal fold model. J Voice. 2012;26(5):535–547. doi: 10.1016/j.jvoice.2011.09.001. [DOI] [PMC free article] [PubMed] [Google Scholar]
- Bhattacharya P, Siegmund T. A computational study of systemic hydration in vocal fold collision. Comput Meth Biomech Biomed Eng. 2014 doi: 10.1080/10255842.2013.772591. [DOI] [PMC free article] [PubMed] [Google Scholar]
- Bonilha H, White L, Kuckhahn K, Gerlach T, Deliyski D. Vocal fold mucus aggregation in persons with voice disorders. J Commun Disord. 2012;45:304–311. doi: 10.1016/j.jcomdis.2012.03.001. [DOI] [PMC free article] [PubMed] [Google Scholar]
- Bonilha HS, Aikman A, Hines K, Deliyski DD. Vocal fold mucus aggregation in vocally normal speakers. Logoped Phoniatr Vocol. 2008;33(3):136–142. doi: 10.1080/14015430701875588. [DOI] [PubMed] [Google Scholar]
- Chodara AM, Krausert CR, Jiang JJ. Kymographic characterization of vibration in human vocal folds with nodules and polyps. Laryngoscope. 2012;122(1):58–65. doi: 10.1002/lary.22324. [DOI] [PMC free article] [PubMed] [Google Scholar]
- Davidovich-Pinhas M, Bianco-Peled H. Mucoadhesion: a review of characterization techniques. Expert Opin Drug Deliv. 2010;7(2):259–271. doi: 10.1517/17425240903473134. [DOI] [PubMed] [Google Scholar]
- Dean JA. Lange’s Handbook of Chemistry. 15. McGraw-Hill; New York: 1999. [Google Scholar]
- Decker GZ. Master’s thesis. Brigham Young University; 2006. Modeling the mechanical effects of liquid mediated adhesion between the human vocal folds. [Google Scholar]
- Epstein M. Master’s thesis. University of California; Los Angeles: 1999. A comparison of linguistic and pathological breathiness using the LF model. [Google Scholar]
- Freund L. Dynamic Fracture Mechanics. Cambridge University Press; 1990. [Google Scholar]
- Ghatak A, Chaudhury MK. Adhesion-induced instability patterns in thin confined elastic film. Langmuir. 2003;19:2621–2631. [Google Scholar]
- Gunter HE, Howe RD, Zeitels SM, Kobler JB, Hillman RE. Measurement of vocal fold collision during phonation: Methods and preliminary data. J Speech Lang Hear Res. 2005;48(3):567–576. doi: 10.1044/1092-4388(2005/039). [DOI] [PubMed] [Google Scholar]
- Hsiao TY, Liu CM, Lin KN. Videostrobolaryngoscopy of mucus layer during vocal fold vibration in patients with laryngeal tension-fatigue syndrome. Ann Oto Rhinol Laryn. 2002;111(6):537. doi: 10.1177/000348940211100610. [DOI] [PubMed] [Google Scholar]
- Hsiung MW. Videolaryngostroboscopic observation of mucus layer during vocal cord vibration in patients with vocal nodules before and after surgery. Acta Oto-laryngologica. 2004;124(2):186–191. doi: 10.1080/00016480310014859. [DOI] [PubMed] [Google Scholar]
- Jiang JJ, Titze IR. Measurement of vocal fold intraglottal pressure and impact stress. J Voice. 1994;8(2):132–144. doi: 10.1016/s0892-1997(05)80305-4. [DOI] [PubMed] [Google Scholar]
- Kutta H, Steven P, Kohla G, Tillmann B, Paulsen F. The human false vocal folds - an analysis of antimicrobial defense mechanisms. Anat Embryol. 2002;205:315–323. doi: 10.1007/s00429-002-0255-8. [DOI] [PubMed] [Google Scholar]
- Leite F, Bueno C, Da Róz A, Ziemath E, Oliveira O., Jr Theoretical models for surface forces and adhesion and their measurement using atomic force microscopy. Int J Mol Sci. 2012;13:12,773–12,856. doi: 10.3390/ijms131012773. [DOI] [PMC free article] [PubMed] [Google Scholar]
- Leydon C, Sivasankar M, Falciglia DL, Atkins C, Fisher KV. Vocal fold surface hydration: A review. J Voice. 2009;23(6):658–665. doi: 10.1016/j.jvoice.2008.03.010. [DOI] [PMC free article] [PubMed] [Google Scholar]
- Lin D, Dimitriadis E, Horkay F. Elasticity of rubber-like materials measured by AFM nanoindentation. Express Polym Lett. 2007a;1(9):576–584. [Google Scholar]
- Lin D, Dimitriadis E, Horkay F. Robust strategies for automated AFM force curve analysis- II: adhesion-influenced indentation of soft, elastic materials. J Biomech Eng. 2007b;129(6):904–912. doi: 10.1115/1.2800826. [DOI] [PubMed] [Google Scholar]
- Mihaescu M, Khosla SM, Murugappan S, Gutmark EJ. Unsteady laryngeal airflow simulations of the intra-glottal vortical structures. J Acoust Soc Am. 2010;127(1):435–444. doi: 10.1121/1.3271276. [DOI] [PMC free article] [PubMed] [Google Scholar]
- Mortazavi SA, Smart JD. An in-vitro method for assessing the duration of mucoadhesion. J Control Release. 1994;31(2):207–212. [Google Scholar]
- Nakagawa H, Fukuda H, Kawaida M, Shiotani A, Kanzaki J. Lubrication mechanism of the larynx during phonation: an experiment in excised canine larynges. Folia Phoniatr Logop. 1998;50(4):183–194. doi: 10.1159/000021460. [DOI] [PubMed] [Google Scholar]
- Needleman A. An analysis of tensile decohesion along an interface. J Mech Phys Solids. 1990;38(3):289– 324. [Google Scholar]
- das Neves J, Bahia MF, Amiji MM, Sarmento B. Mucoadhesive nanomedicines: characterization and modulation of mucoadhesion at the nanoscale. Expert Opin Drug Deliv. 2011;8(8):1085–1104. doi: 10.1517/17425247.2011.586334. [DOI] [PubMed] [Google Scholar]
- Peterson-Falzone S, Caldarelli D, Landahl K. Abnormal laryngeal vocal quality in ectodermal dysplasia. Arch Otolaryngol. 1981;107(5):300–304. doi: 10.1001/archotol.1981.00790410038010. [DOI] [PubMed] [Google Scholar]
- Pickup BA, Thomson SL. Identification of geometric parameters influencing the flow-induced vibration of a two-layer self-oscillating computational vocal fold model. J Acoust Soc Am. 2011;129(4):2121–2132. doi: 10.1121/1.3557046. [DOI] [PMC free article] [PubMed] [Google Scholar]
- Plumpe MD, Quatieri TF, Reynolds DA. Modeling of the glottal flow derivative waveform with application to speaker identification. IEEE Transactions on Speech and Audio Processing. 1999;7(5):569–586. doi: 10.1109/89.784109. [DOI] [Google Scholar]
- Scherer RC, Shinwari D, DeWitt KJ, Zhang C, Kucinschi BR, Afjeh AA. Intraglottal pressure profiles for a symmetric and oblique glottis with a divergence angle of 10 degrees. J Acoust Soc Am. 2001;109(4):1616–1630. doi: 10.1121/1.1333420. [DOI] [PubMed] [Google Scholar]
- Spencer M, Siegmund T, Mongeau L. Determination of superior-surface strains and stresses, and vocal fold contact pressure in a synthetic larynx model using digital image correlation. J Acoust Soc Am. 2006;123(2):1089–1103. doi: 10.1121/1.2821412. [DOI] [PubMed] [Google Scholar]
- Suh J, Frankel SH. Numerical simulation of turbulence transition and sound radiation for flow through a rigid glottal model. J Acoust Soc Am. 2007;121(6):3728–3739. doi: 10.1121/1.2723646. [DOI] [PubMed] [Google Scholar]
- Thomson SL, Mongeau L, Frankel SH. Aerodynamic transfer of energy to the vocal folds. J Acoust Soc Am. 2005;118(3):1689–1700. doi: 10.1121/1.2000787. [DOI] [PubMed] [Google Scholar]
- Verdolini K, Hess MM, Titze IR, Bierhals W, Gross M. Investigation of vocal fold impact stress in human subjects. J Voice. 1999;13(2):184–202. doi: 10.1016/s0892-1997(99)80022-8. [DOI] [PubMed] [Google Scholar]
- Vilmin T, Ziebert F, Raphaël E. Simple view on fingering instability of debonding soft elastic adhesives. Langmuir. 2009;26(5):3257–3260. doi: 10.1021/la903013z. [DOI] [PubMed] [Google Scholar]
- Zhang Z, Neubauer J, Berry DA. The influence of subglottal acoustics on laboratory models of phonation. J Acoust Soc Am. 2006;120(3):1558–1569. doi: 10.1121/1.2225682. [DOI] [PubMed] [Google Scholar]
- Zheng X, Bielamowicz S, Luo H, Mittal R. A computational study of the effect of false vocal folds on glottal flow and vocal fold vibration during phonation. Ann Biomed Engg. 2009;37(3):625–642. doi: 10.1007/s10439-008-9630-9. [DOI] [PMC free article] [PubMed] [Google Scholar]