Abstract
Current models of hierarchical processing in auditory cortex have been based principally on anatomical connectivity while functional interactions between individual regions have remained largely unexplored. Previous cortical deactivation studies in the cat have addressed functional reciprocal connectivity between primary auditory cortex (A1) and other hierarchically lower level fields. The present study sought to assess the functional contribution of inputs along multiple stages of the current hierarchical model to a higher order area, the dorsal zone (DZ) of auditory cortex, in the anaesthetized cat. Cryoloops were placed over A1 and posterior auditory field (PAF). Multiunit neuronal responses to noise burst and tonal stimuli were recorded in DZ during cortical deactivation of each field individually and in concert. Deactivation of A1 suppressed peak neuronal responses in DZ regardless of stimulus and resulted in increased minimum thresholds and reduced absolute bandwidths for tone frequency receptive fields in DZ. PAF deactivation had less robust effects on DZ firing rates and receptive fields compared with A1 deactivation, and combined A1/PAF cooling was largely driven by the effects of A1 deactivation at the population level. These results provide physiological support for the current anatomically based model of both serial and parallel processing schemes in auditory cortical hierarchical organization.
Keywords: auditory cortex, auditory pathways, hierarchy, reversible deactivation
the past two decades have witnessed a dramatic increase in brain connectivity studies with advancements in functional imaging analysis methodology giving rise to the ability to noninvasively assess dependency effects between individual brain regions (Friston 2011). While a thorough understanding of the structural connectivity of the brain is a necessary component for understanding network function (Sporns 2012), investigations regarding the degree to which one brain region can exert influence on another are critical, as anatomical connectivity alone “is neither a sufficient nor a complete description of connectivity” (Friston 2011). Hierarchical processing schemes for cat auditory cortex have been proposed based mainly on structural connectivity analyses between individual regions of auditory cortex (Fig. 1; Rouiller et al. 1991; Lee and Winer 2011), while the functional importance of these connections has remained largely unexplored. Using cortical cooling deactivation, previous studies have addressed functional reciprocal connectivity between primary auditory cortex (A1) and the anterior and posterior auditory fields (AAF and PAF), as well as second auditory cortex (A2; Carrasco and Lomber 2009a, 2010). However, functional interactions for higher order fields of the hierarchy have not been investigated to date.
Fig. 1.
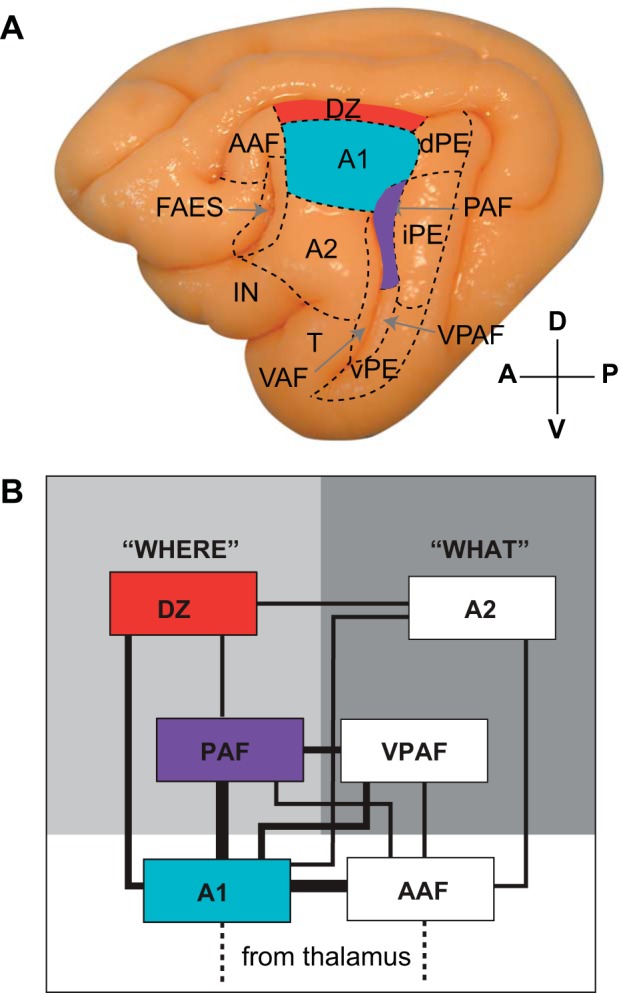
A: lateral view of the left hemisphere of the cat depicting the 13 regions of auditory cortex, bounded by dashed lines. The region highlighted in red corresponds to the location of the area targeted in the current study, the dorsal zone of auditory cortex (DZ). Primary auditory cortex (A1; cyan) and posterior auditory field (PAF; purple) were reversibly deactivated in the present study because they comprise 2 of the largest auditory cortical inputs to DZ. B: schematic view of the proposed hierarchical connections of auditory cortical areas, based on cortical and thalamic connectivity. Core regions A1 and anterior auditory field (AAF) occupy the lowest region in the hierarchy, with PAF and DZ streamed into the putative “where” pathway, and occupying higher positions. Line thickness is indicative of connectional strength: strong (thick), medium, and weak (thin). Figure adapted from Lee and Winer (2011) with permission. A2, second auditory cortex; fAES, auditory field of the anterior ectosylvian sulcus; IN, insular region; dPE, iPE, vPe, dorsal, intermediate, and ventral posterior ectosylvian gyrus; T, temporal region; VAF, ventral auditory field; VPAF, ventral posterior auditory field.
The present study expanded this functional assessment of inputs along multiple stations of the proposed hierarchical scheme to a higher order auditory area, the dorsal zone (DZ). Although a specific, unique role in auditory cortical processing has not been identified for DZ, both behavioral evidence (Malhotra and Lomber 2007) and electrophysiological (Stecker et al. 2005) evidence suggest that DZ is involved in auditory spatial perception and, as such, may be part of a “where” stream for auditory spatial processing in the cat. DZ has also been proposed to be involved in processing the more complex aspects of sound in the frequency and time domains based on the discovery of duration-tuned neurons in the area (He et al. 1997). Furthermore, DZ has been suggested to form part of a functional auditory belt region because responses in DZ exhibit more complex frequency tuning and nonmonotonicity and have longer response latencies and broader tuning curves (Middlebrooks and Zook 1983; He et al. 1997; Stecker et al. 2005) than core regions A1 and AAF, which are characterized by simple, linear responses with short response latencies and sharp tuning curves (Sutter and Schreiner 1991; Stecker et al. 2005; Carrasco and Lomber 2011). Thalamocortical connectivity analyses further support this designation (He and Hashikawa 1998), as thalamocortical projections to DZ in the cat (Lee and Winer 2008a) match those documented for belt regions of primate auditory cortex (Kaas et al. 1999).
Because A1 and PAF comprise two of the largest anatomical auditory cortical inputs to DZ (He and Hashikawa 1998; Lee and Winer 2008b; Barone et al. 2013; Kok et al. 2014) and because both cortical regions are known to be involved in auditory spatial processing (Fig. 1) (Stecker et al. 2005; Malhotra and Lomber 2007; Malhotra et al. 2008), we predicted that reversible deactivation of these areas would reduce neuronal response rates in DZ. Our results confirmed this hypothesis, providing physiological support for previously proposed anatomically based models of auditory cortical hierarchy involving both serial and parallel processing.
MATERIALS AND METHODS
Overview.
Neuronal responses to auditory stimuli were assessed in eight healthy adult (>6 mo old) cats of both sexes (Felis catus; Liberty Laboratories, Waverly, NY). All animals were housed in an enriched colony environment with unrestricted access to food and water. All experimental procedures were conducted in compliance with the National Research Council's Guidelines for the Care and Use of Mammals in Neuroscience and Behavioral Research (2003) and the Canadian Council on Animal Care's Guide to the Care and Use of Experimental Animals (Olfert et al. 1993) and were approved by the Animal Use Subcommittee of the University Council on Animal Care at the University of Western Ontario. Surgical procedures used in the present study have previously been described in the literature (Carrasco and Lomber 2009a). A brief synopsis of the methodology is presented below.
Surgical procedures.
Approximately 2 wk before electrophysiological recording, animals underwent surgery to perform a craniotomy, implant a cryoloop over PAF, and attach a head holder for use during electrophysiological procedures. Cryoloops were custom made for PAF according to previously published methods (Lomber et al. 1999; Malhotra et al. 2004). A heat-shielding compound was applied to the anterior surface of the loop before implantation to limit the spread of cooling to the dorsal aspect of the posterior bank of the posterior ectosylvian sulcus. This prevented any direct effect of PAF cooling on A1 (Lomber et al. 2007; see Data acquisition for more detailed information). The loops were then sterilized with ethylene oxide gas before implantation. On the day of surgery, animals were anesthetized using sodium pentobarbital (25 mg/kg to effect iv), followed by supplemental doses as required. Animals were intubated and respiration remained unassisted throughout the surgical procedure. Body temperature, respiration rate, heart rate, blood pressure, and end tidal CO2 were monitored continuously. A craniotomy was made over the left hemisphere between coordinates A2-A12 (Horsley and Clarke 1908) to expose auditory cortex. The dura was opened over the posterior ectosylvian sulcus, and an arachnoid hook was used to dissect the arachnoid mater over the sulcus. A custom-made cooling loop was inserted into the dorso-posterior aspect of the sulcus (corresponding to area PAF) and secured to the cranium using stainless steel bone screws and dental acrylic. The craniotomy was closed with dental cement and a head holder was attached to the frontal bone of the skull using dental acrylic and bone screws. The animal was then provided with standard postoperative care (see Malhotra et al. 2004). In all cases, recovery was uneventful.
Approximately 2 wk following surgery, electrophysiological recording procedures were initiated. Animals were administered atropine (0.02 mg/kg sc), dexamethasone (0.5 mg/kg sc), acepromazine (0.4 mg/kg im), and sodium pentobarbital (25 mg/kg to effect iv). The animal was then intubated and respiration remained unassisted for the duration of the experiment, although supplemental oxygen was supplied if blood oxygen saturation fell below 90%. Indwelling feline catheters were inserted into the saphenous vein bilaterally, as well as the left cephalic vein. The animal was secured to a stereotaxic frame using the head holder previously implanted. The dental acrylic over the craniotomy was removed and the dura was resected in preparation for recording. A layer of silicone oil was applied to the cortex to prevent desiccation. A warm water circulating pad (Gaymar, Orchard Park, NY) was used to maintain core body temperature. Animals were hydrated throughout the experiment using an infusion pump supplied with 2.5% dextrose/half-strength lactated Ringer's solution (4 ml/kg/h iv). Dexamethasone (1.0 mg/kg iv) and atropine (0.03 mg/kg sc) were administered on a 24-h schedule for the duration of the experiment. A digital image of the exposed cortex was taken with the aid of a surgical microscope to record the position of each electrode penetration relative to cerebral vasculature and cortical topography.
Stimulus generation and presentation.
Recordings took place within a double-walled sound chamber on an electrically shielded, vibration-free table (Technical Manufacturing, Peabody, MA). Acoustic signals were generated with a 24-bit digital-to-analog converter at an ∼156-kHz sampling rate (Tucker-Davis Technologies, Alachua, FL) and presented open-field 15 cm from the midline of the head contralateral to the craniotomy (FF1; Tucker-Davis Technologies). There were no obstacles situated between the ear contralateral to the craniotomy (right ear) and the speaker, which was in line with the ears (i.e., at an azimuth of −90° relative to the nose). All stimuli were 25 ms in duration, had 5-ms rise and fall times, were cosine squared gated, and were presented at a rate of 2 Hz. To determine the size and approximate boundaries of A1 and AAF based on cochleotopic organization (Merzenich et al. 1975; Knight 1977), pure tones of varying frequency (0.5 to 64 kHz in 1/16-octave steps) and intensity (0–80 dB in 5-dB steps) were presented during cortical mapping procedures. Each frequency-intensity combination was presented once in pseudorandomized fashion. Subsequently, sites in DZ were recorded while A1 and PAF were subjected to reversible deactivation, during which three sets of acoustic stimuli were presented: 1) noise bursts (65 dB SPL; 1- to 32-kHz bandwidth), 600 repetitions per cooling phase; 2) noise bursts of varying intensity [noise rate-intensity function (RIF); 0–80 dB SPL in 10-dB steps], 100 repetitions of each sound intensity (pseudorandomized) per cooling phase; and 3) pure tones of varying frequency (tones; 0.5–64 kHz in 1/16-octave steps) and intensity (0–80 dB SPL in 10-dB steps). Each frequency-intensity combination was presented in pseudorandomized fashion five times per cooling phase.
Data acquisition.
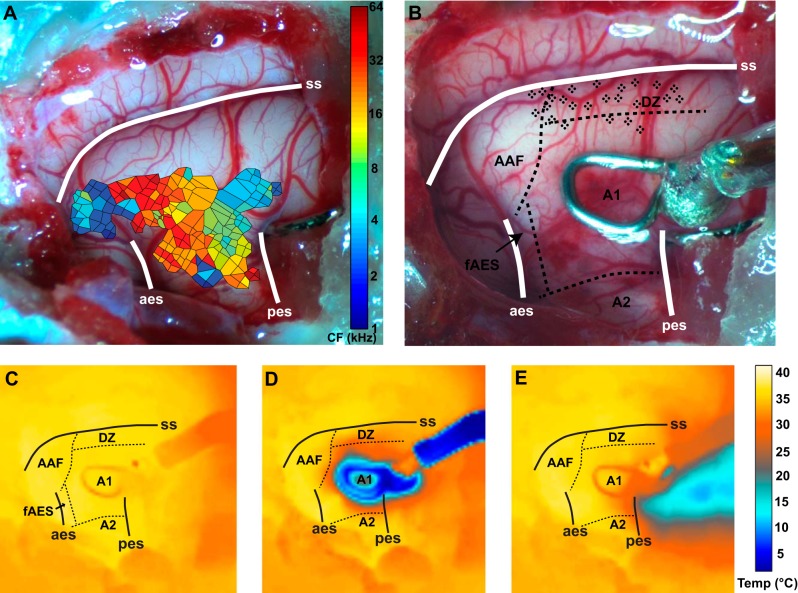
Neuronal responses to auditory stimuli were collected using parylene-coated tungsten microelectrodes positioned in a 2 × 2 configuration spaced 115 μm apart (FHC, Bowdoin, ME). Impedance measures ranged from 1 to 2 MΩ. Neuronal activity was band-pass filtered from 300 to 5,000 Hz. All activity was amplified (×10,000) and digitized at ∼25 kHz (RZ2; Tucker-Davis Technologies). In all animals, frequency-intensity receptive fields were generated for sites spanning A1, A2, and AAF to generate a map of tonotopic organization (Fig. 2A; Merzenich et al. 1975; Knight 1977; Reale and Imig 1980). This was used to determine the borders of A1 to guide accurate placement of the A1 cryoloop. No cortical deactivation was induced during cortical mapping procedures.
Fig. 2.
A: characteristic frequency (CF) map constructed using Voronoi tessellations of AAF and A1 tone responses superimposed onto a photomicrograph of the craniotomy. This map was used to guide placement of the A1 cryoloop. B: photomicrograph of the same craniotomy in A after placement the A1 cryoloop. The borders delimiting cortical field boundaries as determined by SMI-32 labeling are indicated by dashed black lines. Each black dot indicates a recording site at which reversible deactivation of A1 and PAF were induced. C–E: thermal images taken while cortex was warm (C), during A1 deactivation (D), and during PAF deactivation (E). Abbreviations as in Fig. 1; aes, anterior ectosylvian sulcus; pes, posterior ectosylvian sulcus; ss, suprasylvian sulcus.
Following this, an appropriately sized and shaped cooling loop was selected for placement within the boundaries of A1 (Fig. 2B). In general, A1 cryoloops were placed over the mid- to low-frequency representations (i.e., below ∼20-kHz isofrequency band) to ensure that cooling deactivation did not spread past the high-frequency reversal demarcating the A1/AAF border (Fig. 2B; see Carrasco and Lomber 2009a, 2009b, 2010). The A1/DZ border was not mapped to avoid damaging potential recording sites in or near DZ. However, the A1 loop was always placed as far ventral as the A1/A2 border demarcation would allow, so as to avoid any direct cooling of tissue in DZ. The previously implanted PAF cryoloop and the A1 cryoloop were then connected to Teflon tubing, and the cooling deactivation apparatus was tested by pumping chilled methanol through the lumen of the tubing and loops according to previously published methods (Lomber et al. 1999). Thermal images of cortex were recorded using an infrared camera (FLIR SC300, Portland, OR) during both A1 and PAF cooling to confirm that the spread of cooling did not exceed ∼1 mm from the cryoloop, in accordance with previously published work (Fig. 2, C–E; Lomber et al. 1999). Loop temperatures were continuously monitored throughout all phases of cooling deactivation using a wireless thermometer (UWTC-2; Omega, Stamford, CT) and were maintained at ∼2–3°C. Previous work has demonstrated that if the cryoloop is cooled to 3°C, the cortical temperature in layer VI falls below 20°C, which results in the silencing of efferent signals emanating from all layers of the cooled region (Lomber et al. 1999; Carrasco and Lomber 2009a, 2009b, 2010). Additionally, in two animals, minihypodermic probes (HYP-O; Omega, Laval, Canada) were used to corroborate temperature measures taken at the cortical surface using the infrared camera, as well as to ascertain that the tissue temperature recorded below the surface of cortex corresponded to previously published work, both within the vicinity of the cryoloop, as well as outside of it (Lomber et al. 1999; Carrasco and Lomber 2009a, 2009b, 2010). In all cases, temperature measures in the current study were in line with previously published work.
Following A1 loop placement and testing, electrodes were lowered ∼1,200 μm orthogonal to the exposed surface of DZ targeting granular layers. However, the depth of the penetration was adjusted to optimize the strength of the response across all four shanks. Multiunit neuronal responses were recorded across five phases of cortical deactivation: 1) while cortex was warm, 2) while A1 alone was cooled, 3) while A1 and PAF were cooled in concert, 4) while PAF alone was cooled, and 5) following rewarming of cortex. It should be noted that DZ straddles the ventral lip of the middle suprasylvian sulcus and is known to extend progressively further into the sulcus as one moves from posterior to anterior. Recordings in the current experiment were limited to the ∼1,200 μm directly below the gyral surface, and no recordings were made from any portion of DZ extending into the middle suprasylvian sulcus. Upon completion of a deactivation cycle, the electrodes were repositioned at a new cortical location and the same procedure was repeated. The temporal order in which loops were cooled varied between successive penetrations, so as to control for any effect of cooling order (i.e., A1 was cooled first in some penetrations, while PAF was cooled first in others). However, for ease of interpretation, the data in the current study are always presented in alphabetical cooling order, even though this was not necessarily the order in which cooling occurred for every penetration.
Histological procedures.
After 36–100 h of recording, animals were administered an anticoagulant (heparin, 10,000U; 1 ml) and a vasodilator (1% sodium nitrite, 1 ml) and deeply anesthetized using sodium pentobarbital (40 mg/kg iv). Animals were perfused intracardially through the ascending aorta at a rate of 100 ml/min with physiological saline (1 liter), followed by 4% paraformaldehyde (2 liters). In some animals, this was followed by 10% sucrose. The brain was stereotaxically blocked, removed, and placed in 30% sucrose for cryoprotection. Once sunk, the brain was frozen and cut in 60-μm coronal sections using a cryostat (Leica CM 3050S, Wetzlar, Germany). One series was processed with the monoclonal antibody SMI-32 (Covance; Princeton, NJ), while the other was kept as a spare or stained using Cresyl Violet and used to visualize electrode tracks. SMI-32 staining profiles have been shown to effectively parcellate individual auditory cortical regions (Mellott et al. 2010) and were used to delimit borders within auditory cortex in the present study. The location of the PAF cooling loop was also verified using SMI-32 staining patterns.
Data analysis.
Multiunit responses were de-noised and waveforms were manually inspected using Plexon Offline Sorter (Plexon, Dallas, TX). All data analysis was conducted using custom written scripts in Matlab (Mathworks, Natick, MA). For all stimuli, only neuronal responses in which the rewarm phase returned to at least 60% of the original firing rate during the warm phase were included in the analysis.
Peristimulus time histograms (PSTHs) for noise bursts and tones were constructed by binning neuronal responses with a time resolution of 1 ms. PSTHs were then smoothed using convolution of a 6-ms Gaussian window. Peak response rates were defined as the maximum number of spikes per second within a given PSTH. Peak response latency refers to the amount of time (in milliseconds) elapsed between stimulus onset and the peak response. Peak response onsets and offsets were defined as the first and last responses greater than the mean spontaneous rate plus 20% of the peak firing rate (Sutter and Schreiner 1991). These measures were manually inspected with respect to the histogram and in all cases appeared to result in correct detection of the onset and offset of the response as displayed on the PSTH. Response duration was calculated by subtracting the onset of the response from the offset of the response (i.e., the duration of the response at stimulus onset). It should be noted that in some cases a response was also present at the offset of the stimulus. The measures calculated above were restricted to the peak response after the onset of the stimulus and were not applied to the offset responses that were present in a minority of units. Noise RIFs were constructed by computing the average firing rate over the first 50 ms for each sound intensity level. Monotonicity ratios were calculated by dividing the peak response in spikes per second at the highest sound level (80 dB SPL) by the maximum observed response at any sound level (Sutter and Schreiner 1991; Stecker et al. 2005). Monotonicity ratios between 0.9 and 1 were classified as monotonic, as visual inspection of the data showed either a saturating response at the highest sound levels presented or a clear monotonic increase in response as sound level increased. Monotonicity ratios <0.9 were classified as nonmonotonic and always showed a clear peak at sound levels <80 dB SPL. Frequency receptive fields were generated by computing the mean firing rate during the first 50 ms poststimulus onset over five repetitions of each frequency-intensity combination. The receptive field matrix was then smoothed using a two-dimensional Savitzky-Golay filter. An evoked response was defined as any response exceeding one-third of the averaged maximum response of the warm and rewarm phases. The characteristic frequency (CF) was defined as the stimulus frequency that evoked a response at the lowest sound intensity level (minimum threshold). In some cases, there were multiple points that fit this definition (multipeaked responses), in which case the peak with the strongest response was used. Bandwidths for each sound intensity level above minimum threshold were calculated by subtracting the lowest frequency at which an evoked response occurred from the highest frequency at which a response occurred, expressed in octaves. Receptive field bandwidths were subsequently analyzed in one of two ways. Absolute bandwidth refers to bandwidths measured at each individual sound intensity level (e.g., 10 dB SPL). If no evoked responses were present at a particular sound intensity level, the bandwidth was given a value of zero. Relative bandwidths refer to measurements at sound intensity levels with respect to threshold (e.g., 10 dB above threshold). For this analysis, if no evoked responses were present at a particular sound intensity level above threshold, the unit was excluded from analysis. All receptive fields were individually examined after these analyses were performed, and in the vast majority of cases, the CFs, minimum thresholds, and bandwidths corresponded very well with visual inspection of the plotted receptive field. All data were subjected to Kolmogorov-Smirnov tests and in no cases were the data normally distributed. As a result, all statistical analyses were conducted using nonparametric Friedman tests (unless otherwise stated) and were followed by post hoc Wilcoxon tests adjusted using Bonferroni's inequality to account for multiple comparisons. All P values reported in the text are corrected for multiple comparisons. All statistical comparisons reported include the median followed by the interquartile range in square brackets. Where appropriate, the data in some figures are represented as means ± SE of the mean for ease of comparison with other studies, even though statistical calculations were done on ranked data.
RESULTS
The goal of the present investigation was to evaluate the functional contribution of inputs at multiple levels of the proposed model of auditory cortical hierarchy to DZ, a higher order region. We first compare mapping data obtained from A1 and AAF to data collected in DZ. We then go on to discuss the effects of reversible deactivation of A1 and PAF individually or in concert on neuronal responses in DZ for each of the stimuli presented.
Comparison of DZ responses to A1 and AAF responses.
Neuronal responses to tone presentations in A1 and AAF were recorded for the purpose of mapping the A1/AAF and A1/A2 border before placement of the A1 cooling loop. Responses that were well localized (i.e., not lying close to a border) to A1 (n = 205) and AAF (n = 147) were compared with responses collected during tone presentation for the warm condition in DZ (n = 92). Peak response rates differed significantly between the three areas (χ2 = 44.2; df = 2,441; P << 0.001; Kruskal-Wallis test). Peak response rates in DZ (26.1 [15.6 49.1] spikes/s) were significantly lower than those in A1 (58.0 [29.0 82.3] spikes/s; P << 0.001) and AAF (47.0 [27.3 67.0] spikes/s; P << 0.001). Peak response latencies also differed between areas (χ2 = 39.5; df = 2,441; P << 0.001; Kruskal-Wallis test). Peak response latencies in DZ (17.0 [16.0 21.0] ms) were significantly longer than both A1 (14.0 [13.0 17.0] ms; P << 0.001) and AAF (15.0 [13.0 16.0] ms; P << 0.001). This result agrees well with previously published work, in which latency values for DZ range from those comparable to A1 or AAF (∼10–20 ms) to much longer (>40 ms; Sutter and Schreiner 1991; He et al. 1997).
Noise burst responses during cooling deactivation.
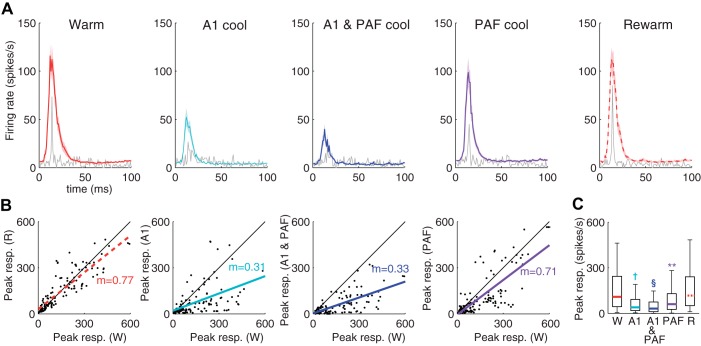
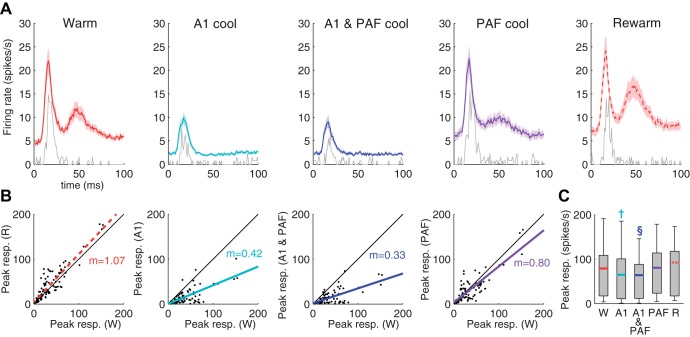
Peak response rates in DZ to 65 dB noise bursts differed significantly across the phases of the cooling cycle (Fig. 3; χ2 = 197; df = 4,476; P << 0.001; n = 123). Post hoc comparisons indicated that peak response rates in DZ were reduced from the warm condition (233 [83.3 353] spikes/s) when A1 was cooled alone (63.3 [26.7 133] spikes/s; P << 0.001), when both A1 and PAF were cooled in concert (58.3 [18.3 112] spikes/s; P << 0.001), and when PAF alone was cooled (98.3 [40.0 190] spikes/s; P < 0.01). No change from the warm condition was observed after cortex was rewarmed (225 [85.0 332] spikes/s; P = 1.00), and there was no difference between response rates when A1 was cooled alone compared with when it was cooled in concert with PAF (P = 0.84). No significant differences in noise burst peak latencies or response duration were found. In addition, 11/120 units recorded in DZ exhibited both onset and offset responses, consistent with previous reports (He et al. 1997). Where offset responses were present, all responses were strongly reduced during cortical deactivation of A1, PAF, or A1 and PAF together.
Fig. 3.
Population level effects of reversible deactivation on DZ responses to 65-dB noise bursts. A: representative example of a DZ recording site across deactivation phases is plotted in grey with the averaged [peristimulus time histograms (PSTHs)] for all DZ sites (n = 123) superimposed in color (±SE in light shading). B: peak responses in DZ (spikes/s) for the warm condition are plotted on the x-axis against peak responses for each of the other cooling conditions plotted on the y-axis. Least square regression lines for the y-axis responses are plotted in color. The slope of the regression line is also indicated in color. C: box plot indicating DZ peak response rates for each of the conditions. The limits of the box indicate the upper and lower quartile range of peak response values, with the colored line indicating the median. Whiskers extend to the most extreme data points. W: warm; A1: A1 alone cooled; A1 and PAF: both A1 and PAF cooled; PAF: PAF alone cooled; R: rewarm. **P < 0.01; †P < 1.00 × 10⁻⁵; §P < 1.00 × 10⁻¹⁰.
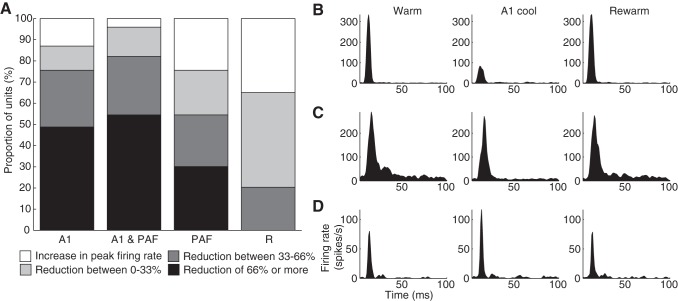
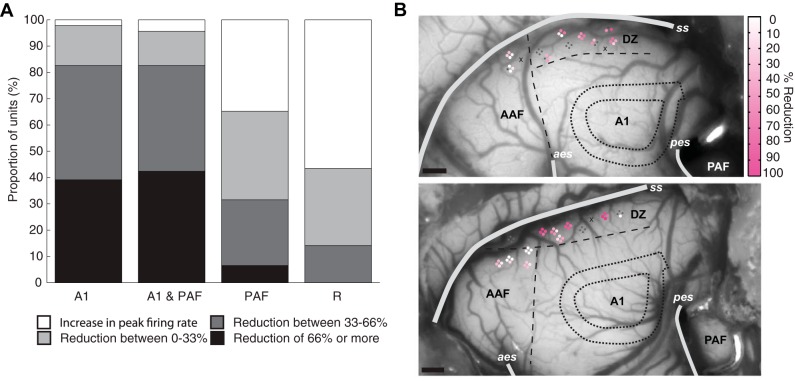
Analyses of the changes in firing rate at individual sites were also conducted to determine if a statistical difference at the group level was mediated by a subset of recording sites or across all units in the population (Fig. 4A). The same conventions used by Carrasco and Lomber (2010) were adopted in the present study: a reduction greater than two-thirds of the original firing rate was termed a large reduction, whereas a reduction of less than one-third of the original firing rate was classified as a small reduction. Anything in between (33–66% reduction) was regarded as moderate. When A1 was cooled either alone or in combination with PAF, the vast majority of sites (>75%) experienced either a strong or moderate reduction in firing rate (e.g., Fig. 4B). However, a small proportion of units either showed little reduction (e.g., Fig. 4C) or actually experienced an increase in firing rate while A1 was cooled (e.g., Fig. 4D). In contrast, when PAF alone was cooled, about half of DZ units experienced strong or moderate reductions in firing rate. When PAF was cooled in combination with A1, there was an increase in the proportion of units that showed a reduction in firing rate of any magnitude. Overall, deactivation of both A1 and PAF resulted in significant declines in neuronal activity in DZ in response to noise bursts at the population level, with A1 deactivation strongly suppressing responses in more DZ units than during PAF deactivation.
Fig. 4.
Effects of reversible deactivation during noise burst presentation on individual sites. A: proportion of sites showing strong (black), moderate (dark grey), or small (light grey) reductions in peak firing rate across deactivation phases. Increases in firing rate are shown in white. B–D: representative examples of the magnitude of change observed at individual sites in DZ. For simplicity, only responses during the deactivation of A1 alone are shown, however, similar changes were observed during other deactivation phases as well. Abbreviations as in Fig. 3.
Noise RIF responses during cortical cooling.
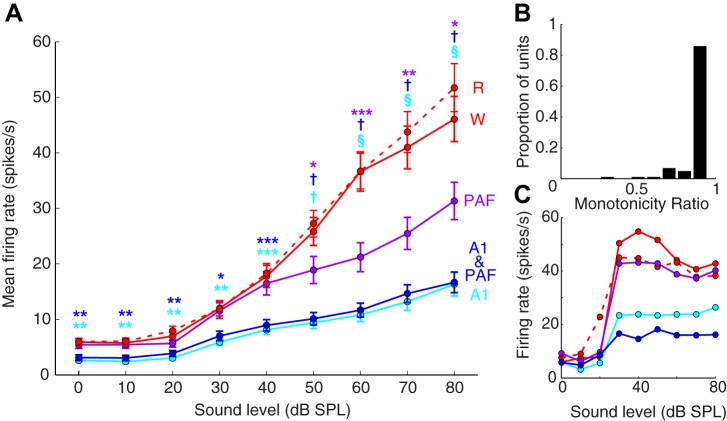
Response rates in DZ differed significantly across the phases of the cooling cycle during presentations of noise bursts at varying sound intensity levels (χ2 = 114; df = 4,2160; P << 0.001). Firing rates were significantly reduced in DZ across all sound levels when A1 was cooled either alone or in concert with PAF (Fig. 5A; P < 0.01 for all sound intensity levels measured). Conversely, when PAF alone was deactivated, firing rates were only suppressed at sound levels >50 dB SPL (P < 0.05 for all comparisons). In no case did the warm condition significantly differ from the rewarm condition (P = 1.00 for all comparisons), and there were no differences between response rates at any of the sound levels when A1 was cooled alone vs. in concert with PAF (P = 1.00 for all). Monotonicity was evaluated, and 90/105 (85.7%) of neurons in DZ were found to be monotonic (defined as having a monotonicity ratio >0.9; Fig. 5B). The remainder of units were classified as nonmonotonic (having monotonicity ratios of <0.9; Fig. 5C). These numbers correspond very closely to those reported in He et al. (1997) in which 84.7% of units were classified as monotonic (purely monotonic or saturating responses). Collectively, these results suggest that firing rates in DZ are only suppressed at high sound intensity levels during PAF deactivation, whereas A1 deactivation results in suppression at all sound intensity levels measured.
Fig. 5.
A: noise rate-intensity functions (RIFs) for DZ and the border region. RIF for DZ responses (n = 105). Each circle indicates the mean of the average firing rates of all recorded units over the first 50 ms of the response for each sound intensity level presented (±SE). B: bar graph showing the proportion of units according to monotonicity ratio. C: example of a site with a nonmonotonic RIF. Abbreviations as in Fig. 3. *P < 0.05, **P < 0.01, ***P < 0.001 statistically significant change from the warm condition; †P < 1.00 × 10⁻⁵; §P < 1.00 × 10⁻¹⁰.
Responses to tones during reversible deactivation.
Peak response rates to all tones presented differed significantly across the phases of the cooling cycle for sites in DZ (Fig. 6; χ2 = 233; df = 4,364; P << 0.001). Post hoc comparisons indicated that peak responses were significantly reduced compared with the warm condition (26.1 [15.6 49.1] spikes/s) when A1 was cooled alone (7.80 [4.68 18.7] spikes/s; P << 0.001) and when both A1 and PAF were cooled in concert (7.02 [3.90 18.7] spikes/s; P << 0.001). No change from the warm condition occurred when PAF was cooled alone (27.7 [9.36 42.9] spikes/s; P = 1.00), or when cortex was rewarmed (31.2 [14.8 60.8] spikes/s; P = 1.00). Peak responses when A1 was cooled alone were not different from those when A1 and PAF were cooled in concert (P = 1.00). No differences were observed for response latencies or response durations in DZ between deactivation phases. Both an onset response and an offset response were present in a minority of DZ units (7/92). Where an offset response was present, responses were either strongly or moderately reduced during A1 deactivation, either alone or in concert with PAF, and were moderately reduced when PAF alone was deactivated. As with responses to noise bursts, responses to tones were also analyzed at the unit level (Fig. 7A). These findings largely paralleled those reported for responses to noise bursts in that a large proportion (∼80%) of units experienced either a strong or moderate reduction in firing rate when A1 was cooled, either alone or in combination with PAF. Conversely, when PAF alone was cooled, ∼25% of units actually increased firing rate and the proportions of units that showed a strong reduction in firing rate was considerably lower (∼5%) than those observed during deactivation of A1 alone (∼40%). These changes in response rates were spread out across DZ, and importantly, the effects of deactivation did not vary with distance from the cooling loop (Fig. 7B), suggesting that the proximity of a recording site to the cooling loops did not account for the effects observed.
Fig. 6.
Population level effects of reversible deactivation on DZ responses to tones. A: representative example of a DZ recording site across deactivation phases is plotted in grey with the averaged PSTH for all DZ sites (n = 92) superimposed in color (±SE in light shading). B: peak responses in DZ (spikes/s) for the warm condition are plotted on the x-axis against peak responses for each of the other cooling conditions plotted on the y-axis. Least square regression lines for the y-axis responses are plotted in color. The slope of the regression line is also indicated in color. C: box plot indicating DZ peak response rates for each of the conditions. The limits of the box indicate the upper and lower quartile range of peak response values, with the colored line indicating the median. Whiskers extend to the most extreme data points. Abbreviations as in Fig. 3. †P < 1.00 × 10⁻⁵; §P < 1.00 × 10⁻¹⁰.
Fig. 7.
Effects of reversible deactivation during tone presentations on individual sites. A: proportion of sites showing strong (black), moderate (dark grey), or small (light grey) reductions in firing rate across deactivation phases. Increases in firing rate are shown in white. B: magnitude of reduction in firing rate during A1 deactivation plotted on the cortical surface for 2 animals. The location of the A1 cooling loop is indicated by finely dashed lines. Note that the magnitude of reduction does not appear to be related to the proximity of the site to the cooling loop. Areal borders are indicated by longer dashed lines. Grey dots indicate sites that did not rewarm to at least 60% of the firing rate during the warm condition and were not used in analysis. Unresponsive sites are indicated with an “x.” Abbreviations as in Fig. 3. Scale bar = 1 mm.
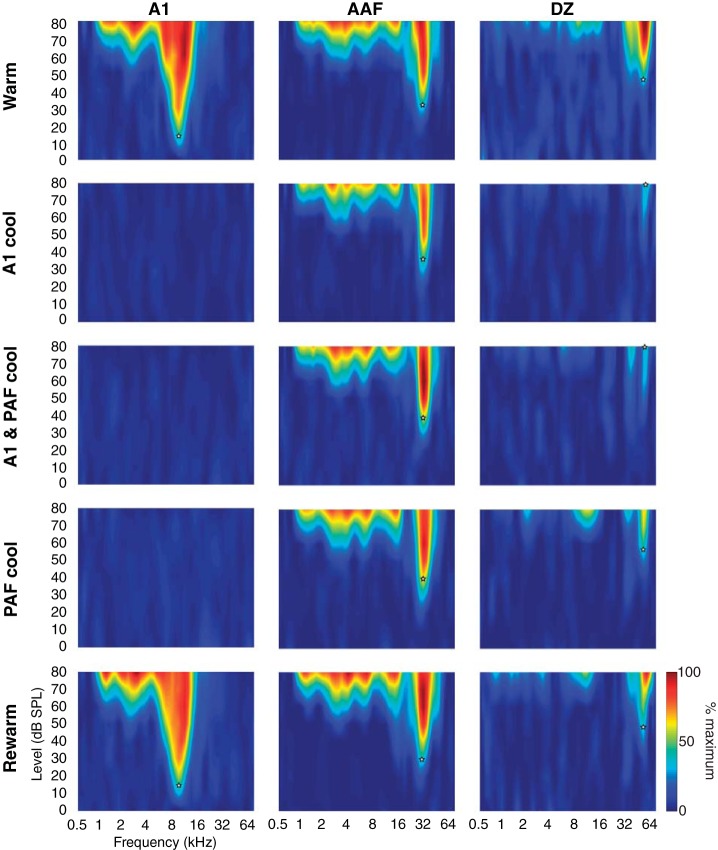
In general, receptive fields constructed for DZ units agreed well with findings reported in previous studies. Specifically, multipeaked tuning curves were observed in 25/81 (30.9%) units (Sutter and Schreiner 1991; He et al. 1997; Stecker et al. 2005), while the remainder were single peaked (56/81). However, it should be noted that in some cases, well-separated peaks were observable during epochs of reversible deactivation, even though the warm and rewarm conditions did not show evidence of clear separation between peaks, and thus, these sites were designated as single peaked (e.g., Fig. 8). Of the multipeaked tuning curves, 7/25 had 3 peaks while the remaining 18/25 had 2. Where multipeaked tuning curves were recorded, it was noted that the peaks tended to cluster in a space of less than one octave in agreement with previously published findings (Sutter and Schreiner 1991). Isofrequency contours were also found to shift caudally at the A1/DZ border, and consequently, more than >75% of CFs in DZ were tuned to frequencies >20 kHz (Middlebrooks and Zook 1983; Sutter and Schreiner 1991). No changes in CF were observed across deactivation phases (χ2 = 4.00, df = 4,320, P = 0.41).
Fig. 8.
Representative examples of tuning curves recorded in different cortical fields (left to right): A1, AAF, and DZ. Each site was recorded over 5 phases of reversible deactivation (top to bottom): while cortex is warm, during A1 deactivation, while both A1 and PAF are deactivated, during PAF deactivation, and upon rewarming. White stars indicate the CF and minimum threshold for the recorded unit. Note that A1, AAF, and DZ examples are considered single-peaked, because the DZ unit lacks clear separation between the peaks in the warm and rewarm phases.
Receptive field bandwidths differed significantly between the phases of the cooling cycle at absolute sound intensity levels (Fig. 9A; χ2 = 623; df = 4,3600; P << 0.001). However, receptive field thresholds were also increased as a consequence of reversible deactivation (Fig. 9B; χ2 = 118; df = 3,240; P << 0.001). On average, the threshold of DZ receptive fields increased by 30.0 [−40.0 −10.0] dB SPL when A1 alone was cooled (P << 0.001), by 20.0 [−40.0 −20.0] when both A1 and PAF were cooled together (P << 0.001), and by 10.0 [−30.0 0.00] when PAF alone was cooled (P << 0.001). No change in threshold occurred between the warm and rewarm conditions (0.00 [−10.0 0.00] dB SPL; P = 0.23). Because of this increase in threshold, an additional analysis of receptive field bandwidths at intensity levels relative to threshold was done to determine whether any reduction in bandwidth observed at absolute sound intensity levels was due to an effect of reversible deactivation on the shape of the tuning curve or simply due to the increased threshold. However, in the majority of cases (>70%), very few evoked responses in DZ tuning curves were discernable when A1 was cooled, rendering it impossible to calculate bandwidth. If such sites are removed from consideration, it is possible to calculate bandwidth at several intensities above threshold; however, very few sites remain (Fig. 9C), making it difficult to draw a conclusion. Thus it is not possible to conclude whether reductions in absolute bandwidth are due to elevated receptive field thresholds or reflect a sharpening of the tuning curve.
Fig. 9.
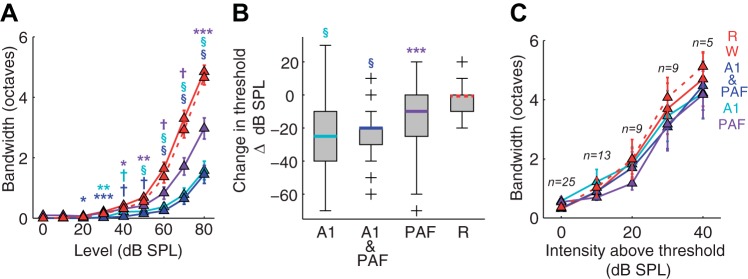
Summary of changes in DZ receptive field properties as a function of reversible deactivation. A: mean absolute bandwidth measures recorded at each sound intensity level presented (±SE). B: boxplot showing the magnitude of change in threshold (from the warm condition) for each phase of reversible deactivation. C: mean relative bandwidth measures recorded in 10 dB SPL steps above minimum threshold (±SE). Abbreviations as in Fig. 3. *P < 0.05, **P < 0.01, ***P < 0.001; †P < 1.00 × 10⁻⁵; § P < 1.00 × 10⁻¹⁰.
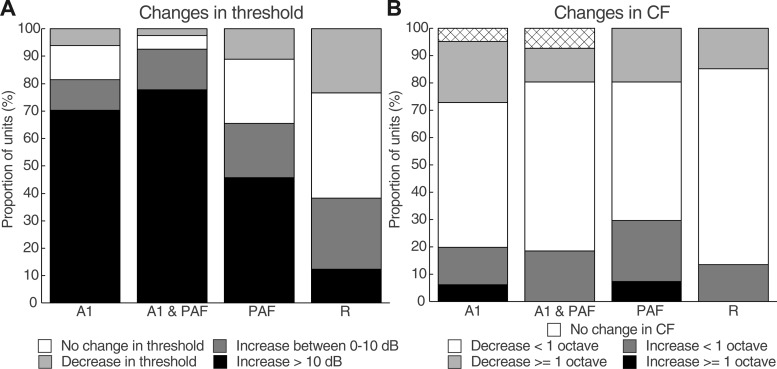
Receptive field properties were also subjected to analysis at the level of individual units. When A1 was cooled either alone or in concert with PAF, ∼70% of units showed an increase in threshold >10 dB SPL (Fig. 10A). PAF deactivation alone also resulted in an increased threshold of >10 dB SPL for ∼45% of units. An increase threshold during combined deactivation of A1 and PAF was observed in a greater proportion of units than during deactivation of either field alone. Across all cooling conditions, the majority of units in each case did not show any change in CF (Fig. 10B). However, some changes in CF did occur across epochs of cooling deactivation. Manual inspection of the receptive fields indicated that changes in CF of less than an octave often reflected changes in multipeaked tuning curves (i.e., an increase in threshold for one peak but not another resulted in a change in CF from the first peak to the second peak). Changes greater than one octave appeared to be due to an increase in threshold during deactivation in which evoked activity was present at 80 dB SPL but did not occur at the same frequency as the CF in the warm/rewarm conditions. This demonstrated that the unit still retained the ability to respond during epochs of reversible deactivation but tuning was generally very poor, resulting in a change in CF (see the definition of CF in materials and methods).
Fig. 10.
Summary of changes in threshold and CF at individual sites in DZ. A: proportion of units during each phase of deactivation that show changes in threshold from the warm condition. B: proportion of units across cooling phases that show changes in CF (in octaves) from the warm condition. Abbreviations as in Fig. 3.
Overall, the effect of A1 deactivation on PSTH measures during tonal stimulation was a reduction in peak firing rates in DZ at both the population and unit level. A1 deactivation also resulted in increased receptive field thresholds and reduced absolute bandwidths. In contrast, PAF deactivation does not reduce peak responses in DZ during tonal stimulation at the population level, at least during the early phase of the response. However, offset response rates were reduced during PAF cooling (e.g., see the second peak in Fig. 5A). With respect to individual units, cortical cooling of PAF resulted in a measurable decline in activity for >60% of sites, however, these reductions are far less robust than those observed during noise burst stimulation. Despite this, an increase in receptive field threshold is evident at both the population and individual unit level during PAF deactivation.
Results summary.
Neuronal responses in DZ were recorded in response to noise burst and tone stimulation during reversible deactivation of A1 alone, PAF alone, or A1 and PAF combined. Reversible deactivation of A1, regardless of whether it was deactivated alone or in combination with PAF, always resulted in strong suppression of DZ responses, both at the population and individual unit level. These changes affected peak response rates as well as longer latency aspects of the response and manifested as increased receptive field thresholds and reduced absolute bandwidths at each sound intensity level presented (Fig. 11, A–D). Conversely, deactivation of PAF alone had stronger effects for noise burst than tonal stimulation, both at the population level and for individual sites. Furthermore, cooling PAF seemed to exert the greatest effect at high sound intensity levels and affected longer latency aspects of the response. Receptive field thresholds were also increased during PAF deactivation. Overall, combined cooling of A1 and PAF together at the population level was largely driven by the effects of A1 deactivation as, in all cases, neuronal responses during deactivation of both A1 and PAF were indistinguishable from those of A1 deactivation alone. However, analysis of individual sites revealed small alterations in the proportions of neurons that showed strong reductions in firing rate and increased minimum thresholds.
Fig. 11.
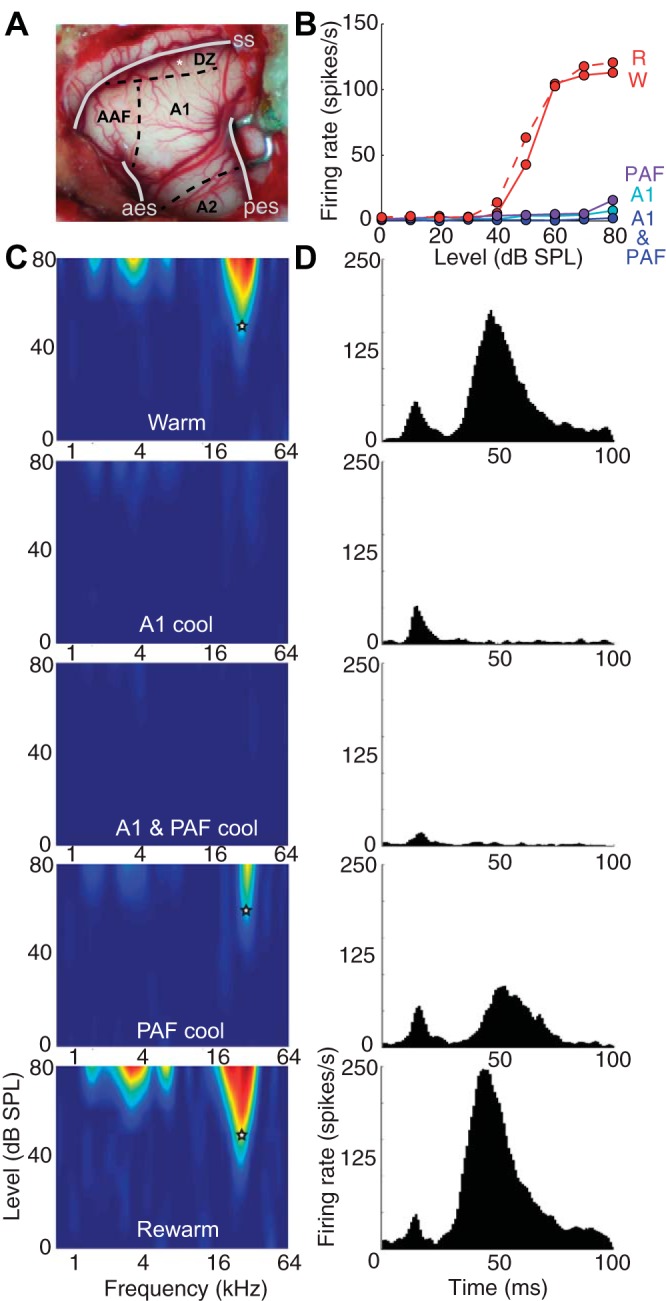
Representative example of a recording site in DZ in response to various stimuli. A: location of the representative site on the cortical surface of the craniotomy is indicated by a white asterisk. B: noise RIF for representative site. C: receptive fields for each of the 5 deactivation phases (indicated in white letters). D: PSTHs to tone stimuli for representative example during the same cooling phases as in C. Note that the data used to plot the PSTHs is the same as that used to plot the receptive fields in C. Abbreviations as in Fig. 3.
DISCUSSION
Comparison of DZ responses to previously published findings.
These data agree well with the few studies that have characterized neuronal responses in DZ. Specifically, DZ exhibits longer response latencies than A1 and AAF (Sutter and Schreiner 1991; Stecker et al. 2005; He et al. 1997), and receptive fields in DZ are complex and broadly tuned to higher frequencies (Middlebrooks and Zook 1983; Sutter and Schreiner 1991; He et al. 1997; Stecker et al. 2005). DZ responds more strongly to noise bursts than to tones, which is consistent with some reports (Sutter and Schreiner 1991) but not others (Stecker et al. 2005). Nonprimary belt areas of primate auditory cortex have also been shown to respond better to band-passed noise than to tones (Rauschecker et al. 1995). DZ also exhibits mainly monotonic RIFs to noise bursts, in agreement with He et al. (1997), but not Stecker et al. (2005). The above discrepancies may be due to differences in anaesthetic regimes, as our data agree with measures collected under pentobarbital (Sutter and Schreiner 1991; He et al. 1997) and differ from those collected under alpha chlorolose (Stecker et al. 2005). This is an important difference, as GABAergic inhibition has been demonstrated to affect the shape of the RIF in the bat inferior colliculus (e.g., Yang et al. 1992) and barbiturates are known to modulate postsynaptic responses to GABA (Olsen 1981). Additionally, it is important to note that stimulus sets in the current study were not optimized for either duration or location at individual sites. Therefore, it is also possible that the discrepancies reported above may reflect differences in terms of the spatial preference of the neuron, since stimulus location was optimized in Stecker et al. (2005) but not Sutter and Schreiner (1991), He et al. (1997), or the present study. Overall, these results support the view that DZ is a higher order auditory field involved in complex sound processing (Sutter and Schreiner 1991; He et al. 1997).
Effects of reversible deactivation on DZ.
To date, the functional effects of the removal of auditory inputs to DZ have not been evaluated. In the present study, A1 deactivation caused a strong reduction, but not abolishment, of DZ responses irrespective of stimulus. These effects were observable across sound levels and affected both peak response rates as well as longer latency aspects of the response. This is consistent with what would be expected following deactivation of a major source of excitatory auditory input to DZ. These effects were evident in the majority of units; however, the proportion of neurons mediating the effect differed for noise burst vs. tonal stimulation. Over 95% of units showed a decline in response rate to tonal stimulation vs. ∼85% for noise burst stimulation. Interestingly, a small portion of units (5% for tones compared with 15% for noise bursts) increased firing rate as a consequence of A1 deactivation, which may reflect a release of inhibition on DZ as a consequence of A1 deactivation. Changes in receptive field properties also occurred following A1 deactivation. Specifically, receptive field thresholds were elevated, and absolute bandwidths were reduced. However, it is not clear whether bandwidth reductions reflect a narrowing of individual receptive fields or whether these reductions occurred as a consequence of elevated threshold because in many cases evoked responses were completely abolished following A1 deactivation.
In contrast to the strong effects of A1 deactivation irrespective of stimulus, PAF deactivation more strongly modulated DZ responses to noise bursts than tonal stimulation. Additionally, responses recorded at higher sound levels appeared to be more susceptible to modulation than those at lower sound levels. Although peak firing rates do not change dramatically during PAF deactivation for tonal stimuli, receptive field thresholds increase both at the population and unit level. This suggests that either a small modulation of peak firing rates during PAF deactivation can effect statistically significant changes in minimum threshold or that some aspect of the response other than peak firing rate is susceptible to PAF deactivation and may be responsible for mediating the increase in minimum thresholds. Indeed, some longer latency aspects of the response do change following PAF deactivation (e.g., see offset responses in PAF panel of Figs. 6A and 11D), which is not surprising given that response latencies in PAF tend to occur later than those of DZ (Stecker et al. 2005).
When A1 and PAF are cooled in concert, responses for all measures calculated were no different at the population level from the effects of A1 deactivation. This suggests that any effect of PAF deactivation may actually be due to blocking neural activity that ultimately originates in A1, because response rates would be expected to decline beyond those observed when A1 was cooled if PAF were contributing additional novel information (i.e., one would expect an additive effect). Modulation of DZ responses by A1 via PAF likely occurs through the most direct route, the cortico-cortical projection from A1 to PAF (Lee and Winer 2008b). However, it is also possible that responses could be modulated via indirect cortical routes that pass through other auditory cortical structures in between A1 and PAF, such as ventral AF and ventral PAF, or through cortico-thalamo-cortical loops as the main sources of thalamic input to PAF arise from the ventral portion and dorsal superficial nucleus of the medial geniculate nucleus (MGN; Lee and Winer 2008a), and corticofugal projections exist from A1 to both of these areas (Winer et al. 2001). Interestingly, an additive effect for the combination of A1 and PAF deactivation does occur to some extent at the level of individual units, particularly for peak response rates to noise burst stimuli and minimum thresholds (see 2nd stacked bar in Figs. 4A and 10A). This suggests that not all of the information arising from PAF originates in A1. The results from this and previous experiments support a framework in which both serial and parallel processing mechanisms are at work.
It is not surprising that some responsiveness in DZ is preserved following reversible deactivation, given that DZ receives projections from cortical and thalamic sources unlikely to be disrupted by A1 or PAF deactivation. DZ receives projections from dorsal MGN (He and Hashikawa 1998; Lee and Winer 2008a; Barone et al. 2013), which in turn receives input from the ascending auditory tract via the inferior colliculus (Winer 2011). Cortically, DZ receives input from AAF (Lee and Winer 2008b; Barone et al. 2013; Kok et al. 2014), which itself receives tonotopically organized input from ventral MGN (Winer et al. 2001; Lee and Winer 2008a). AAF receives weak input from PAF and although AAF receives strong input from A1 (Lee and Winer 2008b), previous studies have demonstrated that it is unsusceptible to A1 deactivation (Carrasco and Lomber 2009b). DZ similarly receives cortical input from auditory field of the anterior ectosylvian sulcus (fAES; Lee and Winer 2008b; Barone et al. 2013; Kok et al. 2014), which is the only dorsal auditory region lacking strong projections from A1, receives weak input from PAF (Lee and Winer 2008b) and also processes auditory spatial information (Malhotra et al. 2004). A2 could be considered a candidate for possible sources contributing to the preservation of responses in DZ based on weak inputs from A1 and PAF with projections of moderate strength to DZ (Lee and Winer 2008b). However, A2 neurons exhibit sustained responses with peak response latencies comparable to or longer than those of DZ (Schreiner and Cynader 1984; Carrasco and Lomber 2010), making it unlikely that information processed in A2 would shape DZ responses, at least during the early phases of the response. While DZ receives projections from other auditory cortical areas, most of these areas either receive strong projections from A1 and/or PAF (Lee and Winer 2008b) or are higher order/parabelt areas known to respond to visual as well as auditory stimulation (Reale and Imig 1980; Updyke 1986), making it more likely that these serve as feedback projections. Any of the sources of input discussed may modulate aspects of DZ responses following deactivation via cortico-cortical connections and/or cortico-thalamo-cortical loops (Winer et al. 2001; Lee and Winer 2008a); however, dorsal MGN, AAF, and fAES are likely the primary sources of “bottom-up” auditory input to DZ that could account for the perseveration of responses following reversible deactivation of A1 and/or PAF.
These results suggest that the contributions of inputs from both A1 and PAF provide important “bottom-up” information to DZ for the stimuli used in the present study. However, future studies might further examine the functional contribution of inputs from A1 and PAF while varying either the duration or location of stimuli to further tease apart the hierarchical contributions of A1 and PAF to DZ using optimized stimuli at each recording site, given that individual sites in DZ have been shown to exhibit duration (He et al. 1997) and spatial (Stecker et al. 2005) tuning. Such investigations may yield additional information regarding the role that A1, PAF, and DZ play in the functional hierarchy of the “where” pathway of auditory cortex and may be particularly informative for higher order fields such as DZ.
Overall, the present study is the first to demonstrate dissociable effects of the removal of auditory inputs from multiple levels of the auditory cortical hierarchy on a higher order region. These results additionally support previous anatomically based hierarchical models involving both serial and parallel processing in auditory cortex (Rouiller et al. 1991; Lee and Winer 2011). While A1 is a significant source of auditory information, particularly for fields in the “where” pathway, A1 does not form a bottleneck for entry of auditory information to cortex in the same way that V1 appears to for the visual system (Girard and Bullier 1989; Girard et al. 1991).
GRANTS
This work was supported by grants from the Canadian Institutes of Health Research, the Natural Sciences and Engineering Research Council of Canada, Canada Foundation for Innovation, and the Ontario Graduate Scholarship Program.
DISCLOSURES
No conflicts of interest, financial or otherwise, are declared by the author(s).
AUTHOR CONTRIBUTIONS
Author contributions: M.A.K. and S.G.L. conception and design of research; M.A.K., D.S., T.A.B., and S.G.L. performed experiments; M.A.K. analyzed data; M.A.K. and D.S. interpreted results of experiments; M.A.K. prepared figures; M.A.K. drafted manuscript; M.A.K., D.S., T.A.B., and S.G.L. edited and revised manuscript; M.A.K. and S.G.L. approved final version of manuscript.
ACKNOWLEDGMENTS
We thank Pam Nixon for technical and surgical assistance during this study and Dr. Andres Carrasco for assistance with stimulation protocols during the early phases of the experiment.
REFERENCES
- Barone P, Lacassagne L, Kral A. Reorganization of the connectivity of cortical field DZ in congenitally deaf cat. PLoS One 8: e60093, 2013. [DOI] [PMC free article] [PubMed] [Google Scholar]
- Carrasco A, Lomber SG. Evidence for hierarchical processing in cat auditory cortex: nonreciprocal influence of primary auditory cortex on the posterior auditory field. J Neurosci 29: 14323–14333, 2009a. [DOI] [PMC free article] [PubMed] [Google Scholar]
- Carrasco A, Lomber SG. Differential modulatory influences between primary auditory cortex and the anterior auditory field. J Neurosci 29: 8350–8362, 2009b. [DOI] [PMC free article] [PubMed] [Google Scholar]
- Carrasco A, Lomber SG. Reciprocal modulatory influences between tonotopic and nontonotopic cortical fields in the cat. J Neurosci 30: 1476–1487, 2010. [DOI] [PMC free article] [PubMed] [Google Scholar]
- Carrasco A, Lomber SG. Neuronal activation times to simple, complex, and natural sounds in cat primary and nonprimary auditory cortex. J Neurophysiol 106: 1166–1178, 2011. [DOI] [PubMed] [Google Scholar]
- Friston KJ. Functional and effective connectivity: a review. Brain Connect 1: 13–36, 2011. [DOI] [PubMed] [Google Scholar]
- Girard P, Bullier J. Visual activity in area V2 during reversible inactivation of area 17 in the macaque monkey. J Neurophysiol 62: 1287–1302, 1989. [DOI] [PubMed] [Google Scholar]
- Girard P, Salin PA, Bullier J. Visual activity in areas V3a and V3 during reversible deactivation of area V1 in the macaque monkey. J Neurophysiol 66: 1493–1503, 1991. [DOI] [PubMed] [Google Scholar]
- He J, Hashikawa T, Ojima H, Kinouchi Y. Temporal integration and duration tuning in the dorsal zone of cat auditory cortex. J Neurosci 17: 2615–2625, 1997. [DOI] [PMC free article] [PubMed] [Google Scholar]
- He J, Hashikawa T. Connections of the dorsal zone of cat auditory cortex. J Comp Neurol 400: 334–348, 1998. [DOI] [PubMed] [Google Scholar]
- Horsley V, Clarke RH. The structure and function of the cerebellum examined by a new method. Brain 31: 45–124, 1908. [Google Scholar]
- Kaas JH, Hackett AT, Tramo MJ. Auditory processing in primate cerebral cortex. Curr Opin Neurobiol 9: 164–170, 1999. [DOI] [PubMed] [Google Scholar]
- Kok MA, Chabot N, Lomber SG. Cross-modal reorganization of cortical afferents to dorsal auditory cortex following early- and late-onset deafness. J Comp Neurol 522: 654–675, 2014. [DOI] [PubMed] [Google Scholar]
- Knight PL. Representation of the cochlea within the anterior auditory field (AAF) of the cat. Brain Res 130: 447–467, 1977. [DOI] [PubMed] [Google Scholar]
- Lee CC, Winer JA. Connections of cat auditory cortex: I. Thalamocortical system. J Comp Neurol 507: 1879–900, 2008a. [DOI] [PMC free article] [PubMed] [Google Scholar]
- Lee CC, Winer JA. Connections of cat auditory cortex: III. Corticocortical system. J Comp Neurol 507: 1920–1943, 2008b. [DOI] [PMC free article] [PubMed] [Google Scholar]
- Lee CC, Winer JA. Convergence of thalamic and cortical pathways in cat auditory cortex. Hear Res 274: 85–94, 2011. [DOI] [PMC free article] [PubMed] [Google Scholar]
- Lomber SG, Malhotra S, Hall AJ. Functional specialization in non-primary auditory cortex of the cat: areal and laminar contributions to sound localization. Hear Res 229: 31–45, 2007. [DOI] [PubMed] [Google Scholar]
- Lomber SG, Payne BR, Horel JA. The cryoloop: an adaptable reversible cooling deactivation method for behavioral or electrophysiological assessment of neural function. J Neurosci Methods 86: 179–194, 1999. [DOI] [PubMed] [Google Scholar]
- Malhotra S, Hall AJ, Lomber SG. Cortical control of sound localization in the cat: unilateral cooling deactivation of 19 cerebral areas. J Neurophysiol 92: 1625–1643, 2004. [DOI] [PubMed] [Google Scholar]
- Malhotra S, Lomber SG. Sound localization during homotopic and heterotopic bilateral cooling deactivation of primary and nonprimary auditory cortical areas in the cat. J Neurophysiol 97: 26–43, 2007. [DOI] [PubMed] [Google Scholar]
- Malhotra S, Stecker GC, Middlebrooks JC, Lomber SG. Sound localization deficits during reversible deactivation of primary auditory cortex and/or the dorsal zone. J Neurophysiol 99: 1628–1642, 2008. [DOI] [PubMed] [Google Scholar]
- Mellott JG, van der Gucht E, Lee CC, Carrasco A, Winer a J, Lomber SG. Areas of cat auditory cortex as defined by neurofilament proteins expressing SMI-32. Hear Res 267: 119–136, 2010. [DOI] [PMC free article] [PubMed] [Google Scholar]
- Merzenich MM, Knight PL, Roth GL. Representation of cochlea within primarv auditory cortex in the cat. J Neurophysiol 38: 231–249, 1975. [DOI] [PubMed] [Google Scholar]
- Middlebrooks JC, Zook JM. Intrinsic organization of the cat's medial geniculate body identified by projections to binaural response-specific bands in the primary auditory cortex. J Neurosci 3: 203–324, 1983. [DOI] [PMC free article] [PubMed] [Google Scholar]
- Olfert ED, Cross BM, McWilliam AA (Editors). Guide to the Care and Use of Experimental Animals. Ottawa, Canada: Canadian Council on Animal Care, 1993. [Google Scholar]
- Olsen RW. GABA-benzodiazepine-barbiturate receptor interactions. J Neurochem 37: 1–13, 1981. [DOI] [PubMed] [Google Scholar]
- Rauschecker JP, Tian B, Hauser M. Processing of complex sounds in the macaque nonprimary auditory cortex. Science 268: 111–114, 1995. [DOI] [PubMed] [Google Scholar]
- Reale RA, Imig TJ. Tonotopic organization in auditory cortex of the cat. J Comp Neurol 192: 265–291, 1980. [DOI] [PubMed] [Google Scholar]
- Rouiller EM, Simm GM, Villa AEP, de Ribaupierre Y, de Ribaupierre F. Auditory corticocortical interconnections in the cat: evidence for parallel and hierarchical arrangement of the auditory cortical areas. Exp Brain Res 86: 483–505, 1991. [DOI] [PubMed] [Google Scholar]
- Schreiner CE, Cynader MS. Basic functional second auditory organization of cortical field (AII) of the cat. J Neurophysiol 51: 1284–1305, 1984. [DOI] [PubMed] [Google Scholar]
- Sporns O. From simple graphs to the connectome: networks in neuroimaging. Neuroimage 62: 881–886, 2012. [DOI] [PubMed] [Google Scholar]
- Stecker GC, Harrington IA, Macpherson EA, Middlebrooks JC. Spatial sensitivity in the dorsal zone (area DZ) of cat auditory cortex. J Neurophysiol 94: 1267–1280, 2005. [DOI] [PubMed] [Google Scholar]
- Sutter ML, Schreiner CE. Physiology and topography of neurons with multipeaked tuning curves in cat primary auditory cortex. J Neurophysiol 65: 1207–1226, 1991. [DOI] [PubMed] [Google Scholar]
- Updyke BV. Retinotopic organization within the cat's posterior suprasylvian sulcus and gyrus. J Comp Neurol 246: 265–280, 1986. [DOI] [PubMed] [Google Scholar]
- Winer JA, Diehl JJ, Larue DT. Projections of auditory cortex to the medial geniculate body of the cat. J Comp Neurol 430: 27–55, 2001. [PubMed] [Google Scholar]
- Yang L, Pollak GD, Resler C. GABAergic circuits sharpen tuning curves and modify response properties in the mustache bat inferior colliculus. J Neurophysiol 68: 1760–1774, 1992. [DOI] [PubMed] [Google Scholar]


