

Summary
Androgens are widely used for treating Fanconi anemia (FA) and other human bone marrow failure syndromes, but their mode of action remains incompletely understood. Aged Fancd2−/− mice were used to assess the therapeutic efficacy of oxymetholone (OXM) and its mechanism of action. Eighteen-month-old Fancd2−/− mice recapitulated key human FA phenotypes, including reduced bone marrow cellularity, red cell macrocytosis, and peripheral pancytopenia. As in humans, chronic OXM treatment significantly improved these hematological parameters and stimulated the proliferation of hematopoietic stem and progenitor cells. RNA-Seq analysis implicated downregulation of osteopontin as an important potential mechanism for the drug’s action. Consistent with the increased stem cell proliferation, competitive repopulation assays demonstrated that chronic OXM therapy eventually resulted in stem cell exhaustion. These results expand our knowledge of the regulation of hematopoietic stem cell proliferation and have direct clinical implications for the treatment of bone marrow failure.
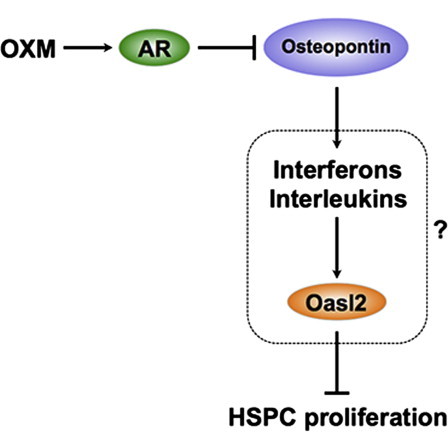
Graphical Abstract
Highlights
-
•
OXM treatment causes loss of quiescence and stem cell exhaustion
-
•
RNaseq analysis reveals transcriptional changes in key pathways in Fancd2−/− HSPC
-
•
OXM suppresses transcription of osteopontin, a known stem cell quiescence promoter
-
•
Unlike previous notions, OXM has no effect on telomerase expression or EPO signaling
In this article, Zhang and colleagues show that 18-month-old Fancd2−/− mice recapitulated key human Fanconi anemia phenotypes, including peripheral pancytopenia and macrocytosis. Chronic oxymetholone treatment improved these hematological parameters and stimulated the proliferation of hematopoietic stem and progenitor cells, but eventually resulted in stem cell exhaustion. RNaseq analysis implicated downregulation of osteopontin as an important mechanism for the drug’s action.
Introduction
Fanconi anemia (FA) is an autosomal recessive disorder associated with birth defects, progressive bone marrow failure, hematopoietic stem cell (HSC) depletion, and cancer predisposition. FA is caused by a disrupted FA-BRCA network and is genetically heterogeneous, with at least 16 complementation groups and respective genes identified so far (Kim and D’Andrea, 2012).
Progressive bone marrow failure is the primary cause of morbidity and mortality in FA patients (Kutler et al., 2003). Most patients develop marrow dysfunction within the first decade of life. The symptoms range from mild cytopenia in any lineage to severe aplastic anemia, often initially with thrombocytopenia (Shimamura and Alter, 2010). Red cell macrocytosis is quite common in FA patients and usually precedes the onset of thrombocytopenia.
HSC transplantation is the only curative treatment for bone marrow failure in FA. However, androgens have also been widely used to treat cytopenia in FA, especially for patients unable to proceed to transplant or patients with high transplant risk. The most commonly used androgen is oxymetholone (OXM), which is an anabolic-androgenic steroid and a synthetic derivative of testosterone (Shimamura and Alter, 2010). Androgen therapy raises blood counts in ∼50% to 70% of individuals with FA and also works for other forms of aplastic anemia (Dokal, 2003).
Despite a long history of androgen use in bone marrow failure syndromes, the mechanism whereby these molecules boost blood counts remains enigmatic (Chute et al., 2010). It has been suggested that androgens stimulate erythropoiesis through an increase in the production of erythropoietin (EPO). However, more recent studies have found no close correlation between androgens and EPO levels (Chute et al., 2010), leading others to speculate that androgens might have a direct effect on bone marrow (T’Sjoen et al., 2005). One recent in vitro study suggested that androgens act by increasing telomerase activity and extending the lifespan of CD34+ stem/progenitor cells (Calado et al., 2009).
Multiple murine models of FA are available. Among them, Fancd2−/− mice, Fancp−/− mice, and Fancc-Fancg double knockout mice represent human FA patient phenotypes more closely than the others (Crossan et al., 2011; Houghtaling et al., 2003; Parmar et al., 2010; Pulliam-Leath et al., 2010; Zhang et al., 2010). Fancd2−/− mice recapitulate the characteristic tumor susceptibility of FA and show an ∼2-fold decrease in hematopoietic stem and progenitor cell (HSPC) populations and a very poor long-term repopulating capacity of bone marrow (Parmar et al., 2010; Zhang et al., 2010). Despite this, the mice have no obvious anemia in their peripheral blood at age 6 months, except for lower platelet counts. Here, however, we found that 18-month-old Fancd2−/− mice developed spontaneous pancytopenia. We then set out to investigate how OXM benefits FA patients using this aged Fancd2−/− mouse model.
Results
Eighteen-Month-Old Fancd2−/− Mice Have Pancytopenia and Respond to OXM Treatment
We previously reported that 4- to 6-month-old Fancd2−/− mice have reduced numbers of HSCs with no evidence for anemia in peripheral blood except for low platelet counts (Zhang et al., 2010, 2013). A follow-up investigation on a larger cohort of mice at the same age confirmed normal white and red blood cell counts and low platelet counts and also revealed a slight but significant elevation of mean corpuscular volume (MCV), which is a characteristic clinical phenotype of human FA patients (Table S1 available online) (Shimamura and Alter, 2010). To track the progression of these defects, we followed a cohort of Fancd2−/− and WT mice until 18 months of age. Similar to the findings in our earlier report (Houghtaling et al., 2003), 5 of 17 mutant mice developed tumors (with 3 of them being ovarian tumors) during this time period, whereas only 1 of 20 WT mice had a tumor. Animals with tumors were excluded from further analysis. We found that cancer-free 18-month-old Fancd2−/− mice had developed spontaneous pancytopenia with red blood cells, white blood cells, hemoglobin levels, and platelet counts all below the normal ranges seen in age-matched WT controls (Figure 1A). Fancd2−/− mice also showed a highly elevated MCV compared with WT controls and a reduction in bone marrow cellularity ranging from 25% to 75% (Figures 1A and 1B). Most of the old Fancd2−/− mice showed spleen defects, with 6 of 10 mice displaying small spleens and 2 of 10 mice having splenomegaly (Figure 1C). We consistently observed Howell-Jolly bodies, which are often associated with decreased splenic function, in peripheral blood smears (Figure 1D). Large, oval-shaped macrocytes and polychromatic cells (bluish red blood cells in hematoxylin and eosin [H&E] staining) were also visible in the peripheral blood of 18-month-old Fancd2−/− mice (Figure 1D). In contrast, they were rare in age-matched WT mice. Four of 10 of the old Fancd2−/− mice had thickening of the cortical bone and narrowing of the marrow cavity typical of osteopetrosis (Figure 1E).
Figure 1.
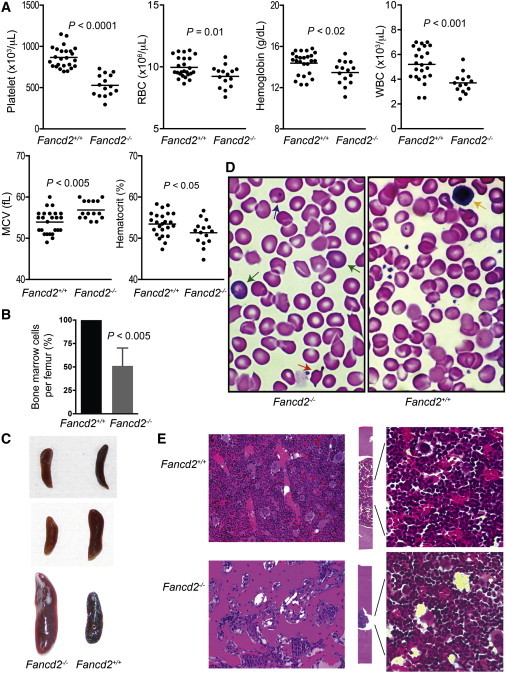
Eighteen-Month-Old Fancd2−/− Mice Have Pancytopenia
(A) Complete blood counts in 18-month-old Fancd2−/− mutants (n = 15) and WT controls (n = 25). WBC, white blood cells; RBC, red blood cells.
(B) Reduced bone marrow cellularity in Fancd2−/− mice. Total nucleated bone marrow cells were counted for each femur bone. The data showed the relative change (as percentage) of marrow cellularity in mutant mice as compared with their littermate WT controls and represented pooled results from four pairs of mice.
(C) Fancd2−/− mice have spleen abnormalities. (Upper and middle panels) Small spleens in two mutant mice. (Lower panel) Larger spleen in a mutant mouse.
(D) Representative blood smear pictures of Fancd2−/− mice and gender-matched WT littermate controls. The blue arrow indicates a Howell-Jolly body; green arrow, polychromatic cells; orange arrow, acanthocyte; yellow arrow, lymphocyte. Original magnification ×1,000.
(E) H&E staining of the bone sections. (Left) Longitudinal section of the trabecular bones (original magnification, ×100). (Middle and right) Longitudinal section of the cortical bones (original magnifications: middle panels, × 50; right panels, × 400).
See also Table S1.
We next wished to test whether OXM could improve these FA-associated hematologic abnormalities. The OXM dose was chosen to be equivalent to ∼80% of the maximum dose for human patients (Shimamura and Alter, 2010). To assure that the compound had the expected biological activity, Fancd2−/− and WT mice were treated with either OXM-supplemented or placebo chow for 4 months. At harvest OXM-treated animals had larger kidneys (Figures S1A and S1B), indicating that the androgenic dose was sufficient and biologically active (Shukla et al., 1992). Androgen is known to downregulate renal ornithine aminotransferase gene Oat (Levillain et al., 2005). As expected, Oat mRNA expression level in OXM-treated mice was reduced by 75% (Figure S1C), further confirming the bioactivity of the OXM diet.
We then treated cohorts of 1-month-old Fancd2−/− mice and WT littermate controls with either OXM-supplemented chow or placebo diet and monitored them until age 18 months. Importantly, mice on OXM exhibited clearly improved hematological parameters, including platelet counts, red blood cell counts, hematocrit, and hemoglobin levels (Figures 2A and 2B), albeit with no significant changes in white blood cell counts. The long-term OXM treatment also partially corrected the macrocytosis typical for FA. Collectively, these results indicate that 18-month-old Fancd2−/− mice recapitulated FA patient phenotypes and that OXM benefited Fancd2−/− mice at the level of peripheral blood in the same way it does for human patients.
Figure 2.
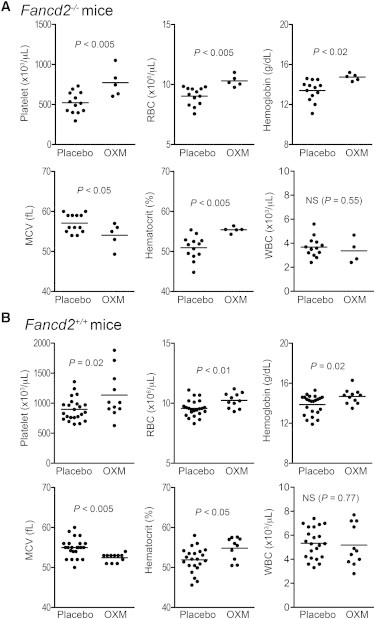
OXM Treatment Improves Hematopoiesis
(A) OXM-treated Fancd2−/− mice (n = 5) exhibited better hematologic parameters than placebo-treated Fancd2−/− controls (n = 13).
(B) OXM-treated Fancd+/+ mice (n = 11) had better hematologic parameters than placebo-treated Fancd2+/+ controls (n = 23). OXM treatment started at weaning and continued for 17 months before final harvest.
See also Figure S1.
Long-Term OXM Treatment Leads to Stem Cell Exhaustion in Both Fancd2−/− and WT Mice
We then sought to determine the effect of long-term OXM administration on bone marrow HSPCs, immunophenotypically defined as c-KIT+SCA-1+LIN− (KSL) cells. Cohorts of 1-month-old Fancd2−/− and WT mice were treated with either OXM-supplemented chow or placebo diet and monitored until age 18 months. CD34−KSL cells, a population enriched with long-term HSCs, were then quantitated by flow cytometry (Figure 3A). First, we compared the frequencies of CD34−KSL cells in these old mice with those in young mice. As shown in Figure 3B, 18-month-old Fancd2−/− mice had significantly fewer CD34−KSL cells than 4-month-old Fancd2−/− mice, indicating a progressive attrition of the HSC pool during the aging process. We then examined the effect of OXM on the frequencies of CD34−KSL cells. Surprisingly, the CD34−KSL proportions of the nucleated bone marrow cells in OXM-treated Fancd2−/− and WT mice (0.005% and 0.019%, respectively) were significantly lower (p < 0.05 for WT and p < 0.02 for Fancd2−/− mice) than those in placebo-treated Fancd2−/− and WT mice (0.009% and 0.027%, respectively), as shown in Figure 3B. These results indicate that long-term OXM administration might cause stem cell exhaustion.
Figure 3.
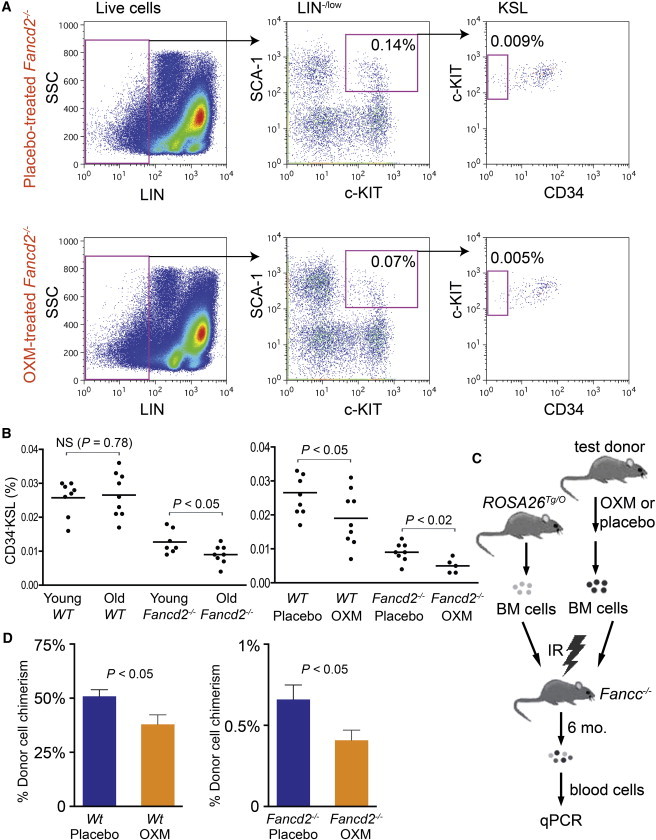
Long-Term OXM Treatment Leads to Stem Cell Exhaustion in Both Fancd2−/− and WT Mice
(A) Long-term (18 months) OXM administration in Fancd2−/− mice reduced the size of bone marrow CD34−KSL cell population. Percentages on flow cytometry profiles were the mean of five to nine mice.
(B) Statistical quantification of CD34−KSL cell proportion in whole nucleated bone marrow cells. (Left) Comparison of CD34−KSL cell frequency between 4- to 6-month-old and 18-month-old mice. (Right) Comparison of CD34−KSL cell frequency between 18-month-old mice on OXM treatment and those on placebo treatment. All the data are pooled results from multiple mice (n = 5–9 for each group).
(C) Strategy used in the competitive repopulation experiment. IR, BM, and mo denote irradiation, bone marrow and months, respectively.
(D) In vivo competitive repopulation of OXM-treated (or control) test donor bone marrow and ROSA26Tg/O competitor bone marrow cells. Three donors were evaluated for each experimental group; % chimerism refers to the percentage of test donor-derived cells in all donor-derived cells. Results from multiple recipients (seven to nine mice per group) were pooled together for each experimental group. Data are presented as mean ± SEM.
See also Table S8.
We next evaluated the function of the HSCs from these older mice with the competitive repopulation assay depicted in Figure 3C. Bone marrow cells of OXM-treated mice were transplanted along with a fixed ratio of ROSA26Tg/O genetically marked bone marrow cells (as competitors) into lethally irradiated Fancc−/− mice. Six months after transplantation, peripheral blood chimerism was measured using quantitative PCR for the three genotypes. At transplantation, the donor mix contained Fancd2−/− bone marrow cells and ROSA26Tg/O bone marrow cells at a 3:1 (Fancd2−/− versus ROSA26Tg/O) ratio. Six months after transplantation, this ratio for placebo-treated Fancd2−/− bone marrow dropped to 1:150 (Figure 3D). This decrease in repopulating ability is significantly worse than that of 3-month-old Fancd2−/− mice under similar experimental settings previously reported by us (Zhang et al., 2010, 2013) and suggests a progressive deterioration of long-term HSC function in Fancd2−/− mice as they age. In contrast, placebo-treated WT bone marrow cells only suffered marginal loss in their HSC repopulating capacity with aging (Figure 3D). Interestingly and importantly, the long-term HSC repopulating capacities of both Fancd2−/− and WT bone marrow were reduced by ∼40% (p < 0.05) in OXM-treatment groups (Figure 3D). Taken together, these data indicate that OXM administration leads to loss of long-term HSC function.
OXM Selectively Stimulates HSPC Proliferation in Both Fancd2−/− and WT Mice
Increased cell cycle entry has been associated with eventual stem cell exhaustion in several models (Orford and Scadden, 2008). To understand what drove the loss of long-term HSC function after chronic OXM administration, the cell cycle status of HSPCs in OXM-treated mice was determined. Fancd2−/− mice and controls were given either OXM diet or placebo for 4 months starting at 1 month of age. We previously reported that Fancd2−/− KSL cells lose quiescence and display enhanced cell cycle entry (Zhang et al., 2010, 2013). Four months of OXM therapy were insufficient to change the size of HSPC pool or affect HSPC function in the colony-forming unit-spleen assay (data not shown). Nonetheless, cell cycle analysis at this time revealed that OXM administration profoundly stimulated the proliferation of HSPCs. The cell cycle status was measured with a well-established method combining Hoechst 33342 staining (for DNA content) with intracellular KI67 expression (expressed only in cycling cells, not in quiescent G0 cells). As shown in Figure 4A, both Fancd2−/− and Fancd2+/+ mice on OXM treatment had substantially fewer quiescent G0 KSL cells and a higher percentage of actively cycling ones (S-G2-M phases of the cell cycle) than their placebo-treated littermate controls. Upon OXM administration, the average G0 percentage of KSL cells in Fancd2−/− and Fancd2+/+ mice dropped from 24.1% and 48.4% to 14.0% and 35.1%, respectively (p < 0.0001 for both) (Figure 4B). Correspondingly, the average S-G2-M proportions of KSL cells increased from 16.2% to 22.9% in mutant animals (p < 0.002) and from 9.4% to 13.0% in WT mice (p < 0.05) (Figure 4B). These results indicate that OXM further enhanced the already accelerated proliferation of FA HSPCs and drove them into active cycling.
Figure 4.
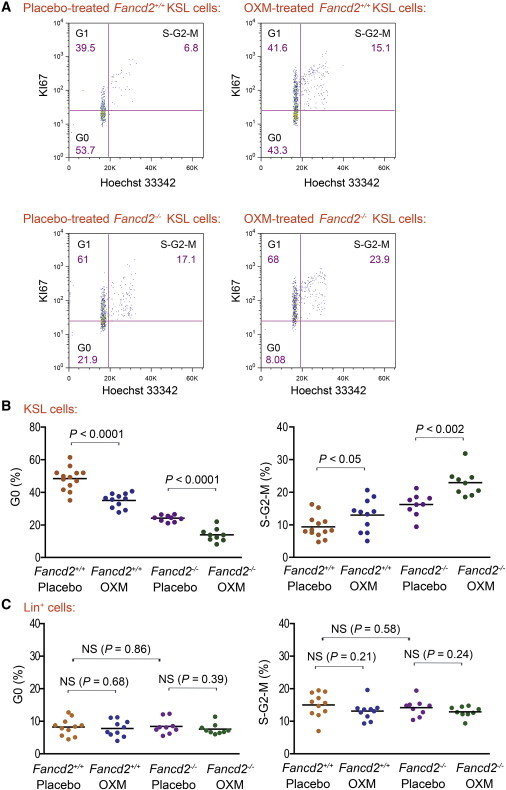
OXM Selectively Stimulates Proliferation of KSL Cells in Both Fancd2−/− and Fancd2+/+ Mice
(A) Representative cell cycle profiles of KSL cells from OXM-treated mice and their gender-matched placebo-treated littermate controls. Hoechst 33342 (for DNA content) and FITC-conjugated antimouse KI67 (for G0/G1 discrimination) were used in combination to distinguish cells in G0, G1, and S-G2-M phases of the cell cycle. The denoted percentage for each gate was from a typical experiment. The mean percentage of multiple mice for each group was shown in the main text.
(B) Statistical quantification of the cell cycle analysis on KSL cells in OXM- versus placebo-treated mice. Data represent the mean values from multiple mice (n = 9 for both OXM and placebo groups of Fancd2−/− mice, n = 13 for Fancd2+/+ placebo group, and n = 11 for Fancd2+/+ OXM group).
(C) Statistical quantification of the cell cycle analysis on LIN+ cells in OXM- versus placebo-treated mice. Data represent the mean values from multiple mice (n = 9 for either OXM or placebo group of Fancd2−/− mice, n = 11 for Fancd2+/+ placebo group, and n = 10 for Fancd2+/+ OXM group).
See also Figures S2 and S3.
We then determined whether the proliferation-enhancing effect of OXM was specific only to HSPCs. The cell cycle profiles of more mature lineage-positive (LIN+) cells from the same mice were evaluated. We found that Fancd2−/− LIN+ cells had a normal cell cycle status (Figure 4C). Interestingly, the G0 and S-G2-M proportions of LIN+ cells were unchanged after OXM administration in both mutant and WT (Figures 4C and S2). In addition, we also examined the cell cycle status of LIN−c-KIT+SCA-1− cells, a population that includes common myeloid progenitors, granulocyte/monocyte progenitors, megakaryocyte/erythroid progenitors, and other cells. Although Fancd2−/− LIN−c-KIT+SCA-1− cells showed slightly reduced quiescence compared with their WT counterparts, neither Fancd2−/− nor WT LIN−c-KIT+SCA-1− cells showed increased proliferation in response to OXM administration (Figure S3). These results indicated that OXM did not broadly stimulate blood cell proliferation, but acted selectively at the level of HSPCs.
RNA-Seq Analysis Discovers Transcriptional Changes in Fancd2−/− HSPCs
We next wished to compare the transcriptomes of Fanconi mutant and normal HSPCs. KSL cells were sorted by flow cytometry after 3 months of OXM administration and used for RNA-Seq gene expression analysis (Wang et al., 2009). Three individual samples (pooled from five mice for each sample) were processed for each experimental condition, with combined reads (aligned to unique RefSeq genes) per condition in the range of 100 to 200 million. As shown in Table S2, Fancd2−/− KSL cells showed clear changes in mRNA expression profiles compared with WT controls: 430 genes were downregulated by more than 1.5-fold, whereas 159 genes were upregulated. As expected from previous work (Houghtaling et al., 2003), we observed a 2.5-fold reduction of Fancd2 mRNA expression level in Fancd2−/− KSL cells, confirming the reliability of the RNA-Seq analysis. Whole bone marrow cells were also analyzed in parallel; genes enriched in KSL cells as compared with whole bone marrow cells are listed in Table S3. The transcriptional downregulation (by 1.8-fold) of Cdkn1c in Fancd2−/− KSL cells is particularly interesting since its protein product p57 is critically required for maintaining quiescence in long-term HSCs (Tesio and Trumpp, 2011). Consistent with its important function in HSCs, our data showed that Cdkn1c transcript was enriched by 23-fold in KSL cells as compared with whole bone marrow cells (Table S3). In addition, the critical DNA-damage response gene Rad51 was also upregulated in Fancd2−/− KSL cells as expected since FA cells often show persistent DNA damage foci due to insufficient DNA interstrand crosslink repair.
Gene ontology analysis revealed key pathways to be significantly altered in Fancd2−/− KSL cells (summarized in Table 1). Consistent with the abnormal cell cycle status discovered by flow cytometry analysis, the pathways of cell cycle activation and its regulation were enhanced in Fancd2−/− KSL cells. Specifically, many cell cycle genes showed transcriptional changes in Fancd2−/− KSL cells, including the upregulation of Cdk1, Ccna2, Ccnb1, Ccnb2, Ccnd1, Cdc25C, Cdkn3, Cdca3, Cdca8, Cks1b, Nek2, Birc5, Cdca5, Mad2l1, Pttg1, and Aurka (Table S4). Some of these genes are known cell cycle regulators in HSCs (Rossi et al., 2012; Tesio and Trumpp, 2011). Surprisingly, we also noticed that a group of genes involved in immune responses and inflammation, comprising Cfp (Properdin), Socs2, Ccr1, Ccr2, Ccr5, Chga (Chromogranin A), Ifi30 (Interferon Gamma-Inducible Protein 30), Lgmn, Txn, and Sell (selectin L), were upregulated in Fancd2−/− KSL cells (Tables 1 and S4).
Table 1.
Pathways Significantly Changed in Fancd2−/− HSPCs as Compared with WT HSPCs
| Pathway | Change | FDR Scorea |
|---|---|---|
| Cell differentiation | down | 0.001 |
| Cell cycle and its regulation | up | 0.002 |
| Mitogenic signaling | down | 0.016 |
| Nuclear receptor signaling | down | 0.022 |
| Inflammatory and immune response | up | 0.060 |
Changes in mRNA Expression Profile in HSPCs in Response to OXM Administration Reveal a Mechanism behind OXM’s Proliferation-Stimulating Effect
In order to interrogate the mechanism underlying the cell cycle changes induced by OXM, we performed RNA-Seq on HSPCs from the placebo and OXM treatment groups. Considering that the proliferation-enhancing effect of OXM was observed in both Fancd2 mutant and WT mice, we focused our analysis on OXM-altered genes shared by both genotypes. Only four genes (Table 2) changed their expression levels significantly after OXM administration in both Fancd2−/− and WT mice. Both mKi67 and Cenpf are cell cycle-regulated genes and proliferation markers. In fact, the mKi67-encoded protein is the antigen recognized by anti-KI67 antibody, the same antibody used in our cell cycle analysis. The RNA-Seq data demonstrated that both genes were expressed at lower levels in KSL cells, as compared with whole bone marrow cells, and were mildly but significantly upregulated after OXM administration, further confirming our observation above that OXM stimulates the proliferation of HSPCs in both Fancd2−/− and WT mice.
Table 2.
Genes Differentially Changed in Both Fancd2−/− and WT HSPCs in Response to OXM Administration
| Gene | Symbol | Gene ID | Fold Change | Q Valuea |
|---|---|---|---|---|
| Centromere protein F | Cenpf | NM_001081363 | 1.5 | 0.000 |
| Marker of proliferation Ki-67 | Mki67 | NM_001081117 | 1.4 | 0.000 |
| Secreted phosphoprotein 1 | Spp1 | NM_009263 | −10.5 | 0.025 |
| 2′-5′ oligoadenylate synthetase-like 2 | Oasl2 | NM_011854 | −1.5 | 0.03 |
Two genes, Spp1 and Oasl2, were significantly downregulated after OXM administration. Spp1 in particular was affected and was suppressed over 10-fold (Table 2). Spp1 was expressed at similar levels in both HSPCs and whole bone marrow cells (Table S3) and encodes secreted phosphoprotein 1 (also known as osteopontin), a cytokine known to upregulate the expression of certain interferons and interleukins. The other gene Oasl2 was enriched 11-fold in HSPCs compared with whole bone marrow cells (Table S3). Oasl2 encodes 2′-5′ oligoadenylate synthetase-like 2 and belongs to a highly conserved family of interferon-induced enzymes (Hovanessian and Justesen, 2007). Since both genes are known to inhibit proliferation (Kumar and Mendelsohn, 1989; Nilsson et al., 2005), it is plausible that OXM-mediated suppression of these genes underlies its proliferation-promoting effects.
It is worth noting that no expression changes in mTert RNA expression levels were detected in response to OXM administration (Table S5), although mTert mRNA was enriched 13-fold in HSPCs of both Fancd2−/− and WT mice (Table S3). Therefore, the induction of telomerase (Calado et al., 2009) is unlikely to underlie the activity of OXM during chronic administration.
OXM Suppresses Spp1 Transcription in an Androgen Receptor-Dependent Manner
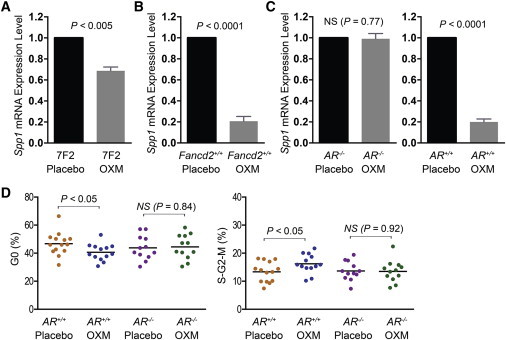
Although it has never been reported that Spp1 is an androgen-target gene, a genome-wide profiling of androgen receptor (AR) binding identified one AR target site in intron 3 of the human SPP1 gene (Figure S4A) (Massie et al., 2011). Bioinformatics analysis using UCSC PhyloP basewise conservation tool (http://genome.ucsc.edu/) further revealed that this AR target site was highly conserved across different species (Figure S4B). Furthermore, a BLAT search with the human AR target sequence returned an intronic sequence with 84% DNA sequence identity in the mouse Spp1 gene. The Spp1-encoded osteopontin is known to be produced by osteoclasts and osteoblasts (Nilsson et al., 2005; Stier et al., 2005), but is also expressed in some soft tissues such as the kidney (Hsieh et al., 2006). Since osteoblasts are difficult to purify from bone marrow, we tested Spp1 transcriptional changes by quantitative RT-PCR in cultured 7F2 mouse osteoblasts in vitro. As shown in Figure 5A, 24 hr of treatment with OXM significantly reduced Spp1 mRNA level in osteoblasts (p < 0.005). We also measured Spp1 gene expression levels in vivo by quantitative RT-PCR. As shown in Figure 5B, Spp1 mRNA levels in the kidneys of chronic OXM-treated mice were 80% lower than those in placebo-treated, gender-matched controls (p < 0.0001). Immunohistochemistry staining of bone sections with an anti-Spp1 antibody confirmed the downregulation of Spp1 in the bone samples from OXM-treated mice (Figure S4C).
Figure 5.
OXM Suppresses Spp1 Transcription through the Mediation of AR
(A) OXM suppressed Spp1 gene expression in cultured 7F2 mouse osteoblasts. RNA input was normalized based on glyceraldehyde 3-phosphate dehydrogenase mRNA expression. The Spp1 expression level in placebo-treated 7F2 cells was set at 1 as a reference. Data are pooled results from four independent experiments. Data are presented as mean ± SEM.
(B) OXM suppressed Spp1 gene expression in kidneys. Data are pooled results from multiple female mice (n = 4 for each group).
(C) Spp1 gene expression levels were not suppressed by OXM in the kidneys of AR-deficient mice. Data are pooled results from multiple female mice (n = 3 for each group).
(D) OXM stimulated KSL cell proliferation through the mediation of AR. Data are pooled results from multiple mice (n = 14 for placebo AR+/+ group, n = 13 for OXM AR+/+ group, and n = 12 for either OXM or placebo group of AR−/− mice). NS denotes not significant.
See also Figures S4 and S5 and Table S6.
Moreover, the suppression of Spp1 transcription by OXM was dependent on the AR. Spp1 mRNA levels were unchanged by OXM treatment in AR-deficient mice of C57BL/6J strain background (p = 0.77; Figure 5C). In contrast, WT mice of the same strain showed clear OXM-mediated suppression of Spp1 transcription (p < 0.0001; Figure 5C).
To further understand the correlation between Spp1 mRNA levels and HSPC proliferation, we then treated AR-deficient mice with OXM for 4 months and examined the cell cycle profiles of their KSL cells. 44.5% (±2.6%) of KSL cells in OXM-treated AR−/− mice were in the G0 stage of the cell cycle, similar to 43.8% (±2.5%) observed in placebo-treated AR−/− mice (p = 0.84; Figure 5D). Similarly, the proportions of KSL cells in S-G2-M phase in both OXM-treated and placebo-treated AR−/− mice were at the same levels (p = 0.92; Figure 5D). In contrast, in WT control mice of the same C57BL/6J background, significant loss of quiescence and enhanced cycling in OXM-treated group (p < 0.05; Figure 5D) were seen. Taken together, these results suggest that OXM stimulates HSPC proliferation through AR-mediated transcriptional suppression of Spp1.
Changes in mRNA Expression Profile in Basophilic Erythroblasts in Response to OXM Rule Out an EPO-Mediated Mechanism of Action by OXM
Finally, we sought to test the previously proposed hypothesis that OXM might activate the EPO pathway in early erythroid progenitors to enhance erythropoiesis (Chute et al., 2010). A group of WT mice was injected with EPO for 3 consecutive days. Complete blood count analysis revealed that the mice on EPO treatment showed higher hemoglobin, an effect similar to that of OXM (Figure S5A). However, the EPO-treated mice also had higher MCV levels than the placebo-treated controls, a known phenomenon caused by the shift of large, immature reticulocytes into circulation as a consequence of EPO-stimulated stress erythropoiesis (Finch, 1982). The macrocytosis effect from EPO was in clear contrast to OXM’s ability to alleviate macrocytosis under our experimental conditions, suggesting a divergence between the two drugs’ mechanisms of action in promoting erythropoiesis.
In addition, the serum levels of EPO in mice on OXM or placebo were measured, and no difference was found (Figure S5B), further indicating that OXM did not function through the activation of the EPO pathway.
In order to further understand this issue and identify any potential targets of OXM in erythroid progenitors, we next sorted TER119high/CD71high/FSChigh basophilic erythroblasts by flow cytometry and investigated the differential mRNA expression profiles with and without OXM administration in WT mice. Basophilic erythroblasts were chosen because this population expresses abundant Epo receptor (Singbrant et al., 2011). OXM had no effect on the abundance of this population (data not shown). No significant differences at all in gene expression were found between OXM-treated WT erythroid progenitors and their placebo-treated counterparts, with no gene displaying an expression change higher than 1.2-fold. Importantly, no upregulation of EPO-inducible genes such as Socs1, Socs2, Socs3, and Cish (Ingley, 2012) was seen in WT mice treated with OXM (Table S6). In addition, there was no differential expression of the well-known EPO target transferrin receptor or any other major players of the Epo-R signaling network such as Bcl2l1, Cdc25a, Btg3, Ccnd2, Lyl1, Pim3, and Tnfrsf13c (Singh et al., 2012) (Table S6). These results further confirm that EPO does not play a role in the action of OXM in the erythroid lineage.
It is also important to mention that Spp1 mRNA expression was undetectable in basophilic erythroblasts (Table S7), whereas it was robustly expressed in HSPCs.
Discussion
Although OXM has been used for patients with aplastic anemia including FA for many years, its mechanism of action remains poorly understood. The studies described herein provide significant information on how this widely used drug affects hematopoiesis and exerts therapeutic benefit. We found that OXM significantly reduced quiescence and promoted proliferation in KSL hematopoietic stem/progenitor cells. This effect was not specific to FA HSPCs, but affected WT mice just as strongly. The percentage of actively cycling cells increased by at least 50% in both genotypes. Interestingly, the effect of OXM on the cell cycle was specific only to HSPC in both mutant mice and controls. Other hematopoietic lineages in the bone marrow did not divide more frequently in response to the drug. This finding indicates that OXM administration has a direct effect on the HSPC compartment and is consistent with the fact that the drug is known to increase the numbers of all blood lineages in humans, including red blood cells, platelets, and neutrophils (Shimamura and Alter, 2010). Although the HSPCs clearly cycle more rapidly on OXM, the number of immunophenotypically defined stem cells did not increase in either mutants or WT mice. This suggests that the newly generated cells rapidly feed into the progenitor compartment rather than generating new stem cells by self-renewal. In fact, our data show that chronic OXM administration eventually results in stem cell exhaustion. The long-term repopulating ability of stem cells from OXM-treated mice was significantly lower than those of placebo-treated controls. This was not unexpected, given the fact that multiple genetic mutations associated with reduced stem cell quiescence have been shown to result in eventual stem cell depletion (Orford and Scadden, 2008). We have previously shown that FA HSPCs already have an accelerated cell cycle and interpreted this finding as a homeostatic mechanism that compensates for the increased loss of stem cells in this disease (Zhang et al., 2010). The administration of OXM can further enhance this compensatory mechanism, at least temporarily, and indeed does improve multiple hematological parameters in FA mice. However, our data predict that OXM will not provide a permanent rescue of hematopoiesis and that a more definitive method of treatment will be eventually needed, even in good early responders. In fact, many FA patients eventually become androgen resistant even if their initial response was positive (Shimamura and Alter, 2010). It is possible that HSCs in these patients have been completely depleted at later stage of the treatment.
The analysis of the transcriptome of OXM-treated HSPCs was revealing. First, the data showed very clearly that the mRNA levels of mTERT were not different between treated and untreated animals. In vitro studies by others have shown that OXM can enhance telomerase activity through estrogen receptor-mediated signaling in short-term assays (Calado et al., 2009). However, this effect was not observed in the long-term in vivo studies described herein. Furthermore, enhanced expression of telomerase, even if present, would not explain the observed effect on stem cell quiescence. We conclude that increased telomerase activity is not the primary mechanism by which OXM acts in vivo. Second, the RNA expression data confirmed that the cell cycle was changed by OXM at the transcriptional level. For example, the mRNA encoding the KI67 antigen was clearly induced. More importantly, however, the data demonstrated a profound (∼10-fold) decrease in osteopontin mRNA. This effect of OXM on osteopontin transcription was AR dependent and likely mediated directly by an AR-target site in Spp1 gene. This finding has clinical implications because it indicates that the use of AR antagonists (Gao, 2010) is not a viable strategy to ameliorate the masculinizing side effects of androgens in bone marrow failure patients.
Although osteopontin is best known as a protein found in bone (Nilsson et al., 2005; Stier et al., 2005), it is expressed at robust levels in the stem cells themselves, as evidenced by our RNA-Seq analysis of KSL cells and previously published gene expression database on SPKSL cells (Chambers et al., 2007) (Figure S6). Its precise function in HSPCs is unclear, but it has been shown that Spp1−/− stem cells have an accelerated cell cycle (Nilsson et al., 2005). It has generally been thought that osteopontin expressed by bone cells in the HSC niche acts on stem cells in a paracrine mode (Nilsson et al., 2005; Stier et al., 2005). Our data indicate that this protein may also have a cell autonomous effect in stem cells. Future studies with cell-type specific knockouts will be required to address this hypothesis. A second gene, Oasl2, was also suppressed by OXM. Oasl2 (2′-5′ oligoadenylate synthetase-like 2), has not been well studied in HSPCs, despite its known high expression in hematopoietic tissues (Hartmann et al., 1998; Tiefenthaler et al., 1999). Our RNA-Seq data further showed that Oasl2 expression was 11-fold higher in KSL cells than that in whole bone marrow cells. Several publications have identified its proapoptotic and antiproliferative roles in other cell types (Ghosh et al., 2001; Kumar and Mendelsohn, 1989), but its high expression level in KSL cells suggests that it might have a direct role in HSPC function. As a cytokine, osteopontin upregulates the expression of interferons and interleukins. Conversely, Oasl2 is known to be induced by interferons (Hovanessian and Justesen, 2007), promote apoptosis, and suppress proliferation (Ghosh et al., 2001; Kumar and Mendelsohn, 1989). Collectively, it is tempting to speculate that osteopontin and 2′-5′ oligoadenylate synthetase-like 2 function in the same pathway to inhibit HSPC proliferation. OXM’s primary mode of action would be to transcriptionally repress this growth inhibitory pathway.
Many publications have suggested that overexpression of osteopontin may play a role in the biology of some cancers, including acute myelogenous leukemia (Bandopadhyay et al., 2014; Liersch et al., 2012), and that its suppression could be therapeutically beneficial. Our data suggest that OXM or other androgens could readily be used for this purpose. OXM should be tested in preclinical animal models of relevant tumors to determine whether it impairs tumor growth.
Our results also shed light on another hypothesis regarding the mechanism of action of androgens in anemia. Early work suggested that androgens stimulate erythropoiesis via the activation of EPO pathway. However, subsequent studies found no correlation between serum EPO and androgen levels (Chute et al., 2010). Similarly, we also observed no difference in serum EPO levels between OXM- and placebo-treated mice, despite finding a substantial increase in renal mass in OXM-treated mice, a phenomenon well known to be associated with chronic androgen administration (Shukla et al., 1992). Consistent with this, RNA-Seq transcriptome analysis of early erythroid progenitors did not show any induction of critical EPO-inducible genes or EPO target genes after OXM treatment. Moreover, under our experimental conditions, OXM reduced the MCV level whereas EPO causes macrocytosis, indicating a clear divergence between the action of the two. Our data therefore argue strongly against an EPO-mediated mechanism of action for androgen therapy.
Our data also provide information on the pathophysiology of FA itself. First, we found that the drastic acceleration of cell cycling observed in Fancd2−/− HSPCs is unique to this blood cell population. No cell cycle abnormalities were observed in mature hematopoietic lineages. Others have found that the hypersensitivity of FA cells to acetaldehyde is also uniquely limited to HSPCs (Garaycoechea et al., 2012) and that it is possible that the lack of stem cell quiescence is mediated by aldehyde toxicity. Unfortunately, OXM had no effect on the expression of any aldehyde-detoxifying genes in stem cells, including Aldh2. Second, in the past, FA mouse models have been considered to be poor models of the human disease because they did not develop readily detectable anemia. Our results, however, indicate that Fancd2−/− mice actually recapitulate the disease rather faithfully when the animals are observed for a longer time period commensurate with the time it takes to develop anemia in humans. We observed clear declines in platelet counts, obvious red cell abnormalities, including macrocytosis, and even osteopetrosis. We also found that OXM therapy had similar effects to those reported in human FA patients, improving platelet counts, red blood cell counts, and hemoglobin levels, with no changes in white blood cell counts. Overall, we conclude that aged Fancd2−/− mutant mice are an adequate model for spontaneous bone marrow failure and can be used for preclinical drug efficacy studies.
Finally and most importantly, we found critical gene expression changes in HSPCs of Fancd2 mutant mice. The changes in cell cycle-related genes and genes involved in DNA damage responses were not surprising, given the obvious lack of stem cell quiescence and the known role of the FA pathway in DNA repair (Kim and D’Andrea, 2012). However, we also found significant changes in multiple genes involved in immune responses. Recent work has clearly shown that DNA damage can activate innate immunity (Gasser et al., 2005) by signals emanating from the damaged cell. Abnormalities in cytokine sensitivity and cytokine levels have long been known to be present in FA (Nalepa and Clapp, 2014). We therefore hypothesize that some genes upregulated in FA HSPCs may be part of an innate immune response to DNA damage. In this model, DNA damage-mediated signals originating from stem cells eventually activate systemic inflammation and cytokine elevations. These proinflammatory cytokines can be toxic to stem cells and cause further genomic damage, thus creating a vicious circle resulting in bone marrow failure.
Experimental Procedures
Mice
Fancd2 mutant, Fancc mutant, and ROSA26 transgenic mice were maintained on the 129S4 strain background as described before (Zhang et al., 2010). AR−/− mice were originally developed in Dr. Kato’s lab and maintained on the C57BL/6J background (Shiina et al., 2006). OXM was obtained from Sigma, milled into standard rodent chow at 300 mg/kg diet (Bio-Serv), and given to the mice upon weaning (3–4 weeks of age). For complete blood count and KSL frequency analyses, the treatment continued for 17 months until harvest. For cell cycle analysis and OXM biological activity, the treatment continued for 4 months; for RNA extraction, the treatment continued for 3 months. Recombinant human EPO (Procrit from Amgen) was given in three consecutive doses at 3,000 IU on day 1, 1,000 IU on day 2, and day 3. All animals were treated in accordance with the guidelines of the Institutional Animal Care and Use Committee.
Cell Culture
7F2 mouse osteoblast (ATCC CRL-12557) cells were purchased from ATCC. For in vitro OXM treatment, cells were split at the ratio of 1:10 and plated with 5 μM OXM-supplemented medium. Twenty-four hours later, cells were harvested for RNA isolation with Trizol reagent.
Complete Blood Count
Complete blood counts were measured by IDEXX Laboratories to monitor hematological parameters.
Histopathology
Bone marrow smears and peripheral blood smears were stained with Wright-Giemsa Stain (Polysciences).
Flow Cytometry
Flow cytometry experiments were performed as described previously (Zhang et al., 2010). Propidium iodide was included as a viability dye. Mouse IgG1 isotype control (for cell cycle analysis) or fluorescence minus one controls (in all the other cases) were used for gating. Cytometric data were analyzed using FlowJo software v.9.6.1 (Tree Star).
Fractionation of erythroblasts at various stages of differentiation in bone marrow was achieved by combining cell surface marker staining of CD71 and TER119 with the analysis of cell size (based on flow cytometric forward scatter intensity) (Singbrant et al., 2011). Bone marrow cells were stained with FITC-conjugated antimouse CD71 and PE-Cy7-conjugated antimouse TER119. The TER119high/CD71high/FSChigh basophilic erythroblast fraction was sorted on a Cytopeia Influx cell sorter equipped with four lasers, allowing for excitation wavelengths of 355, 488, 561, and 633 nm.
Competitive Repopulation Assay
Whole bone marrow cells were isolated from OXM- or placebo-treated mice. After red cell lysis, nucleated cells were counted and mixed with competing ROSA26 bone marrow cells for transplantation. Fancd2−/− cells were mixed with ROSA26 cells at a 3:1 ratio, whereas Fancd2+/+ cells were mixed with ROSA26 at 1:1 ratio. A total of 4 million mixed cells was used for retro-orbital injection of each recipient Fancc−/− mouse preconditioned with a split whole-body lethal dose of 12 Gy irradiation (6 Gy each, 4 hr apart). Six months after transplantation, DNA was extracted for quantitative real-time PCR analysis, and each original donor’s contribution to peripheral blood was calculated to assess peripheral blood chimerism. PCR primers were listed in Table S8.
RNA-Seq
RNA was extracted using Trizol reagent (Invitrogen), followed by RNAeasy Mini Kit (QIAGEN) and DNase I treatment. RNA quality was determined by an Agilent 2100 Bioanalyzer (Agilent technology). Three samples per condition were processed to ensure sufficient power for detecting any differentially expressed genes. For KSL libraries, each sample represented total mRNA isolated from pooled KSL cells of five individual mice; for basophilic erythroblast libraries, each library represented total mRNA isolated from basophilic erythroblasts of one individual mouse.
Libraries were constructed using TruSeq RNA Sample Preparation Kit (Illumina) according to the manufacturer’s instructions and sequenced as 51 base-length reads using Illumina HiSeq 2000 genome analyzer. All reads were mapped to the mouse reference genome (version mm 9) using Bowtie short read aligner software (http://bowtie-bio.sf.net). Data analysis was performed using EdgeR GLM algorithms (McCarthy et al., 2012). Data mining and pathway analysis were carried out with the MetaCore integrated software suite (Thomson Reuters).
Serum EPO Test
Serum samples were tested for EPO levels using a mouse EPO-specific ELISA at Ani Lytics.
Statistical Analyses
Two-tailed, unpaired Student’s t tests were performed to calculate p values using Prism 6.0c software (GraphPad Software). A p value less than 0.05 was considered significant.
Author Contributions
Q.-S.Z. designed the study, performed research, analyzed and interpreted data, and wrote the manuscript. E.B. and M.D. took care of the mice. K.S., A.M., L.M.-L., and R.K.R. helped with research; C.P. and S.I. performed RNA-Seq data analysis. S.K. provided AR−/− mice. G.C.B. helped write the manuscript, and M.G. designed the study, analyzed and interpreted data, and wrote the manuscript.
Acknowledgments
We thank Pamela Canady, Mandy Boyd, and Eric Joseph for their help with flow cytometry and Kevin Watanabe-Smith for taking care of the mice. This work was supported by NIH grant P01 HL048546.
Footnotes
This is an open access article under the CC BY-NC-ND license (http://creativecommons.org/licenses/by-nc-nd/3.0/).
Accession Numbers
The RNA-Seq raw data have been deposited into GEO (Gene Expression Omnibus), a public functional genomics data repository at NCBI. The accession number is GSE58724.
Supplemental Information
References
- Bandopadhyay M., Bulbule A., Butti R., Chakraborty G., Ghorpade P., Ghosh P., Gorain M., Kale S., Kumar D., Kumar S. Osteopontin as a therapeutic target for cancer. Expert Opin. Ther. Targets. 2014;18:883–895. doi: 10.1517/14728222.2014.925447. [DOI] [PubMed] [Google Scholar]
- Calado R.T., Yewdell W.T., Wilkerson K.L., Regal J.A., Kajigaya S., Stratakis C.A., Young N.S. Sex hormones, acting on the TERT gene, increase telomerase activity in human primary hematopoietic cells. Blood. 2009;114:2236–2243. doi: 10.1182/blood-2008-09-178871. [DOI] [PMC free article] [PubMed] [Google Scholar]
- Chambers S.M., Boles N.C., Lin K.Y., Tierney M.P., Bowman T.V., Bradfute S.B., Chen A.J., Merchant A.A., Sirin O., Weksberg D.C. Hematopoietic fingerprints: an expression database of stem cells and their progeny. Cell Stem Cell. 2007;1:578–591. doi: 10.1016/j.stem.2007.10.003. [DOI] [PMC free article] [PubMed] [Google Scholar]
- Chute J.P., Ross J.R., McDonnell D.P. Minireview: Nuclear receptors, hematopoiesis, and stem cells. Mol. Endocrinol. 2010;24:1–10. doi: 10.1210/me.2009-0332. [DOI] [PMC free article] [PubMed] [Google Scholar]
- Crossan G.P., van der Weyden L., Rosado I.V., Langevin F., Gaillard P.H., McIntyre R.E., Gallagher F., Kettunen M.I., Lewis D.Y., Brindle K., Sanger Mouse Genetics Project Disruption of mouse Slx4, a regulator of structure-specific nucleases, phenocopies Fanconi anemia. Nat. Genet. 2011;43:147–152. doi: 10.1038/ng.752. [DOI] [PMC free article] [PubMed] [Google Scholar]
- Dokal I. Inherited aplastic anaemia. Hematol. J. 2003;4:3–9. doi: 10.1038/sj.thj.6200215. [DOI] [PubMed] [Google Scholar]
- Finch C.A. Erythropoiesis, erythropoietin, and iron. Blood. 1982;60:1241–1246. [PubMed] [Google Scholar]
- Gao W. Androgen receptor as a therapeutic target. Adv. Drug Deliv. Rev. 2010;62:1277–1284. doi: 10.1016/j.addr.2010.08.002. [DOI] [PubMed] [Google Scholar]
- Garaycoechea J.I., Crossan G.P., Langevin F., Daly M., Arends M.J., Patel K.J. Genotoxic consequences of endogenous aldehydes on mouse haematopoietic stem cell function. Nature. 2012;489:571–575. doi: 10.1038/nature11368. [DOI] [PubMed] [Google Scholar]
- Gasser S., Orsulic S., Brown E.J., Raulet D.H. The DNA damage pathway regulates innate immune system ligands of the NKG2D receptor. Nature. 2005;436:1186–1190. doi: 10.1038/nature03884. [DOI] [PMC free article] [PubMed] [Google Scholar]
- Ghosh A., Sarkar S.N., Rowe T.M., Sen G.C. A specific isozyme of 2′-5′ oligoadenylate synthetase is a dual function proapoptotic protein of the Bcl-2 family. J. Biol. Chem. 2001;276:25447–25455. doi: 10.1074/jbc.M100496200. [DOI] [PubMed] [Google Scholar]
- Hartmann R., Olsen H.S., Widder S., Jorgensen R., Justesen J. p59OASL, a 2′-5′ oligoadenylate synthetase like protein: a novel human gene related to the 2′-5′ oligoadenylate synthetase family. Nucleic Acids Res. 1998;26:4121–4128. doi: 10.1093/nar/26.18.4121. [DOI] [PMC free article] [PubMed] [Google Scholar]
- Houghtaling S., Timmers C., Noll M., Finegold M.J., Jones S.N., Meyn M.S., Grompe M. Epithelial cancer in Fanconi anemia complementation group D2 (Fancd2) knockout mice. Genes Dev. 2003;17:2021–2035. doi: 10.1101/gad.1103403. [DOI] [PMC free article] [PubMed] [Google Scholar]
- Hovanessian A.G., Justesen J. The human 2′-5′oligoadenylate synthetase family: unique interferon-inducible enzymes catalyzing 2′-5′ instead of 3′-5′ phosphodiester bond formation. Biochimie. 2007;89:779–788. doi: 10.1016/j.biochi.2007.02.003. [DOI] [PubMed] [Google Scholar]
- Hsieh Y.H., Juliana M.M., Hicks P.H., Feng G., Elmets C., Liaw L., Chang P.L. Papilloma development is delayed in osteopontin-null mice: implicating an antiapoptosis role for osteopontin. Cancer Res. 2006;66:7119–7127. doi: 10.1158/0008-5472.CAN-06-1002. [DOI] [PubMed] [Google Scholar]
- Ingley E. Integrating novel signaling pathways involved in erythropoiesis. IUBMB Life. 2012;64:402–410. doi: 10.1002/iub.1024. [DOI] [PubMed] [Google Scholar]
- Kim H., D’Andrea A.D. Regulation of DNA cross-link repair by the Fanconi anemia/BRCA pathway. Genes Dev. 2012;26:1393–1408. doi: 10.1101/gad.195248.112. [DOI] [PMC free article] [PubMed] [Google Scholar]
- Kumar R., Mendelsohn J. Role of 2′-5′-oligoadenylate synthetase in gamma-interferon-mediated growth inhibition of A431 cells. Cancer Res. 1989;49:5180–5184. [PubMed] [Google Scholar]
- Kutler D.I., Singh B., Satagopan J., Batish S.D., Berwick M., Giampietro P.F., Hanenberg H., Auerbach A.D. A 20-year perspective on the International Fanconi Anemia Registry (IFAR) Blood. 2003;101:1249–1256. doi: 10.1182/blood-2002-07-2170. [DOI] [PubMed] [Google Scholar]
- Levillain O., Diaz J.J., Blanchard O., Déchaud H. Testosterone down-regulates ornithine aminotransferase gene and up-regulates arginase II and ornithine decarboxylase genes for polyamines synthesis in the murine kidney. Endocrinology. 2005;146:950–959. doi: 10.1210/en.2004-1199. [DOI] [PubMed] [Google Scholar]
- Liersch R., Gerss J., Schliemann C., Bayer M., Schwöppe C., Biermann C., Appelmann I., Kessler T., Löwenberg B., Büchner T. Osteopontin is a prognostic factor for survival of acute myeloid leukemia patients. Blood. 2012;119:5215–5220. doi: 10.1182/blood-2011-11-389692. [DOI] [PubMed] [Google Scholar]
- Massie C.E., Lynch A., Ramos-Montoya A., Boren J., Stark R., Fazli L., Warren A., Scott H., Madhu B., Sharma N. The androgen receptor fuels prostate cancer by regulating central metabolism and biosynthesis. EMBO J. 2011;30:2719–2733. doi: 10.1038/emboj.2011.158. [DOI] [PMC free article] [PubMed] [Google Scholar]
- McCarthy D.J., Chen Y., Smyth G.K. Differential expression analysis of multifactor RNA-Seq experiments with respect to biological variation. Nucleic Acids Res. 2012;40:4288–4297. doi: 10.1093/nar/gks042. [DOI] [PMC free article] [PubMed] [Google Scholar]
- Nalepa G., Clapp D.W. Fanconi anemia and the cell cycle: new perspectives on aneuploidy. F1000Prime Rep. 2014;6:23. doi: 10.12703/P6-23. [DOI] [PMC free article] [PubMed] [Google Scholar]
- Nilsson S.K., Johnston H.M., Whitty G.A., Williams B., Webb R.J., Denhardt D.T., Bertoncello I., Bendall L.J., Simmons P.J., Haylock D.N. Osteopontin, a key component of the hematopoietic stem cell niche and regulator of primitive hematopoietic progenitor cells. Blood. 2005;106:1232–1239. doi: 10.1182/blood-2004-11-4422. [DOI] [PubMed] [Google Scholar]
- Orford K.W., Scadden D.T. Deconstructing stem cell self-renewal: genetic insights into cell-cycle regulation. Nat. Rev. Genet. 2008;9:115–128. doi: 10.1038/nrg2269. [DOI] [PubMed] [Google Scholar]
- Parmar K., Kim J., Sykes S.M., Shimamura A., Stuckert P., Zhu K., Hamilton A., Deloach M.K., Kutok J.L., Akashi K. Hematopoietic stem cell defects in mice with deficiency of Fancd2 or Usp1. Stem Cells. 2010;28:1186–1195. doi: 10.1002/stem.437. [DOI] [PMC free article] [PubMed] [Google Scholar]
- Pulliam-Leath A.C., Ciccone S.L., Nalepa G., Li X., Si Y., Miravalle L., Smith D., Yuan J., Li J., Anur P. Genetic disruption of both Fancc and Fancg in mice recapitulates the hematopoietic manifestations of Fanconi anemia. Blood. 2010;116:2915–2920. doi: 10.1182/blood-2009-08-240747. [DOI] [PMC free article] [PubMed] [Google Scholar]
- Rossi L., Lin K.K., Boles N.C., Yang L., King K.Y., Jeong M., Mayle A., Goodell M.A. Less is more: unveiling the functional core of hematopoietic stem cells through knockout mice. Cell Stem Cell. 2012;11:302–317. doi: 10.1016/j.stem.2012.08.006. [DOI] [PMC free article] [PubMed] [Google Scholar]
- Shiina H., Matsumoto T., Sato T., Igarashi K., Miyamoto J., Takemasa S., Sakari M., Takada I., Nakamura T., Metzger D. Premature ovarian failure in androgen receptor-deficient mice. Proc. Natl. Acad. Sci. USA. 2006;103:224–229. doi: 10.1073/pnas.0506736102. [DOI] [PMC free article] [PubMed] [Google Scholar]
- Shimamura A., Alter B.P. Pathophysiology and management of inherited bone marrow failure syndromes. Blood Rev. 2010;24:101–122. doi: 10.1016/j.blre.2010.03.002. [DOI] [PMC free article] [PubMed] [Google Scholar]
- Shukla A., Shukla G.S., Radin N.S. Control of kidney size by sex hormones: possible involvement of glucosylceramide. Am. J. Physiol. 1992;262:F24–F29. doi: 10.1152/ajprenal.1992.262.1.F24. [DOI] [PubMed] [Google Scholar]
- Singbrant S., Russell M.R., Jovic T., Liddicoat B., Izon D.J., Purton L.E., Sims N.A., Martin T.J., Sankaran V.G., Walkley C.R. Erythropoietin couples erythropoiesis, B-lymphopoiesis, and bone homeostasis within the bone marrow microenvironment. Blood. 2011;117:5631–5642. doi: 10.1182/blood-2010-11-320564. [DOI] [PubMed] [Google Scholar]
- Singh S., Dev A., Verma R., Pradeep A., Sathyanarayana P., Green J.M., Narayanan A., Wojchowski D.M. Defining an EPOR- regulated transcriptome for primary progenitors, including Tnfr-sf13c as a novel mediator of EPO- dependent erythroblast formation. PLoS ONE. 2012;7:e38530. doi: 10.1371/journal.pone.0038530. [DOI] [PMC free article] [PubMed] [Google Scholar]
- Stier S., Ko Y., Forkert R., Lutz C., Neuhaus T., Grünewald E., Cheng T., Dombkowski D., Calvi L.M., Rittling S.R., Scadden D.T. Osteopontin is a hematopoietic stem cell niche component that negatively regulates stem cell pool size. J. Exp. Med. 2005;201:1781–1791. doi: 10.1084/jem.20041992. [DOI] [PMC free article] [PubMed] [Google Scholar]
- T’Sjoen G.G., Beguin Y., Feyen E., Rubens R., Kaufman J.M., Gooren L. Influence of exogenous oestrogen or (anti-) androgen administration on soluble transferrin receptor in human plasma. J. Endocrinol. 2005;186:61–67. doi: 10.1677/joe.1.06112. [DOI] [PubMed] [Google Scholar]
- Tesio M., Trumpp A. Breaking the cell cycle of HSCs by p57 and friends. Cell Stem Cell. 2011;9:187–192. doi: 10.1016/j.stem.2011.08.005. [DOI] [PubMed] [Google Scholar]
- Tiefenthaler M., Marksteiner R., Neyer S., Koch F., Hofer S., Schuler G., Nussenzweig M., Schneider R., Heufler C. M1204, a novel 2′,5′ oligoadenylate synthetase with a ubiquitin-like extension, is induced during maturation of murine dendritic cells. J. Immunol. 1999;163:760–765. [PubMed] [Google Scholar]
- Wang Z., Gerstein M., Snyder M. RNA-Seq: a revolutionary tool for transcriptomics. Nat. Rev. Genet. 2009;10:57–63. doi: 10.1038/nrg2484. [DOI] [PMC free article] [PubMed] [Google Scholar]
- Zhang Q.S., Marquez-Loza L., Eaton L., Duncan A.W., Goldman D.C., Anur P., Watanabe-Smith K., Rathbun R.K., Fleming W.H., Bagby G.C., Grompe M. Fancd2-/- mice have hematopoietic defects that can be partially corrected by resveratrol. Blood. 2010;116:5140–5148. doi: 10.1182/blood-2010-04-278226. [DOI] [PMC free article] [PubMed] [Google Scholar]
- Zhang Q.S., Watanabe-Smith K., Schubert K., Major A., Sheehan A.M., Marquez-Loza L., Newell A.E., Benedetti E., Joseph E., Olson S., Grompe M. Fancd2 and p21 function independently in maintaining the size of hematopoietic stem and progenitor cell pool in mice. Stem Cell Res. (Amst.) 2013;11:687–692. doi: 10.1016/j.scr.2013.04.010. [DOI] [PMC free article] [PubMed] [Google Scholar]
Associated Data
This section collects any data citations, data availability statements, or supplementary materials included in this article.