

Summary
Glioblastoma (GBM) is a lethal malignancy whose clinical intransigence has been linked to extensive intraclonal genetic and phenotypic diversity and the common emergence of therapeutic resistance. This interpretation embodies the implicit assumption that cancer stem cells or tumor-propagating cells are themselves genetically and functionally diverse. To test this, we screened primary GBM tumors by SNP array to identify copy number alterations (a minimum of three) that could be visualized in single cells by multicolor fluorescence in situ hybridization. Interrogation of neurosphere-derived cells (from four patients) and cells derived from secondary transplants of these same cells in NOD-SCID mice allowed us to infer the clonal and phylogenetic architectures. Whole-exome sequencing and single-cell genetic analysis in one case revealed a more complex clonal structure. This proof-of-principle experiment revealed that subclones in each GBM had variable regenerative or stem cell activity, and highlighted genetic alterations associated with more competitive propagating activity in vivo.
Highlights
-
•
GBM can be propagated by multiple stem cell-like clonal populations
-
•
Tumor-propagating clones display genetic and functional diversity
-
•
Clonal phylogenetic analysis reveals the temporal evolution of a fitness advantage
-
•
Competitive propagating ability is associated with TP53 mutation/EGFR amplification
In this article, Greaves and colleagues show that tumor-propagating cells in glioblastoma are genetically and functionally heterogeneous. When used in in vivo experiments, these cells show a variable competitive capacity for tumor propagation and further genetic diversification, suggesting that glioblastoma evolves through complex dynamics of subclonal fitness advantage and acquisition of mutations and copy number alterations.
Introduction
Glioblastoma (GBM), the most common primary brain cancer, is characterized by genetic instability and complex evolutionary dynamics. Histopathological diversity generates various clinical phenotypes whose common feature is the rapid emergence of treatment resistance to radiotherapy and chemotherapy. Dominant clonal populations that emerge as a result of genetic and epigenetic changes, which confer a tumor survival advantage, drive tumor growth (Nowell, 1976). Intratumor genetic and phenotypic heterogeneity is a hallmark of most cancers (Greaves and Maley, 2012; Marusyk et al., 2012) and is particularly marked in GBM (Bonavia et al., 2011; Sottoriva et al., 2013; Patel et al., 2014). Karyotypic (Shapiro et al., 1981) comparative genomic hybridization (Jung et al., 1999) and fluorescence in situ hybridization (FISH) screens (Little et al., 2012; Snuderl et al., 2011; Szerlip et al., 2012), as well as ultradeep, targeted sequencing (Nickel et al., 2012), have documented the intraclonal diversity of recurrent genetic abnormalities in GBM, including the amplified receptor tyrosine kinase genes EGFR, PDGFRA, and MET. Genetic diversity of subclones is likely to contribute to the clinical intransigence of GBM (Nicholas, 2007), and therapeutic resistance of critical tumor-propagating or stem cells is presumed to be pivotal to this issue (Bao et al., 2006; Chen et al., 2010, 2012).
Subclonal evolution and cancer stem cells (CSCs) have been considered as alternative mechanisms for disease progression (Shackleton et al., 2009), but it is also argued that they are part of the same process because clonal diversity is likely to be generated and sustained by genetically distinct CSCs, which provide the units for evolutionary selection (Greaves, 2013; Kreso and Dick, 2014). Evidence supporting this notion is found in acute lymphoblastic leukemia, where subclonal genetic architecture has been linked to the presence of genetically distinct stem cells assayed in vivo by serial xenotransplantation (Anderson et al., 2011; Notta et al., 2011). It seems likely a priori that GBM would similarly harbor genetically diverse tumor stem/propagating cell populations. This is supported by a previous study in which it was shown that distinct regions of the same dissected GBM tumors had chromosomally distinct (but clonally related) diversity, but were all expandable in vitro under serum-free stem cell conditions and transplantable in vivo as a readout of CSC (Piccirillo et al., 2009). These data raise an important question about the evolution of genetic diversity within the complex subclonal structure of GBMs. Here, we conducted an analysis at single-cell resolution of the genomic changes that occur in GBM, and used competitive clonal phylogenies (Anderson et al., 2011) before and after xenotransplantation to infer the genetics of stem/propagating cells in GBM.
Results and Discussion
Using the neurosphere protocol (Piccirillo et al., 2009), we established stable patient-derived cell cultures from dissociated tumor tissue from 12 cases of primary GBM (Table S1 available online). In order to exclude the possibility of in vitro aberrations and culture selection, as soon as the primary cells formed neurospheres, they were dissociated into single cells and used for intracerebral transplantation (and retransplantation) into NOD-SCID mice. We used high-resolution SNP arrays performed on DNA extracted from the primary GBM tumor cells to identify “driver” copy number alterations (CNAs), defined as recurrent regions of amplification or deletion (Table S2). FISH probes were designed for selected (preferably focal) CNAs, and three-color FISH was applied to neurosphere cells as well as cells isolated from tumors after secondary transplantation in NOD-SCID mice. We then compared the subclonal genetic architecture and clonal phylogenies of the neurospheres and the tumors generated in the mice. In all cases, the driver CNAs chosen from analysis of tumor DNA were present in the neurospheres and subclones that were present in the mouse xenografts could be backtracked to the original tumor, confirming the validity of this approach for investigating clonal progression. A schematic overview of the workflow is given in Figure S1.
Ten of the original 12 GBM neurosphere cultures resulted in tumors in the mice (Table S3). Four of these (GBM 2, GBM 5, GBM 8, and GBM 11) had at least three “driver” lesions that could be tracked by FISH in both the neurospheres and secondary xenografts in the mice. The remaining cases were not included because they had fewer than three “trackable” lesions by SNP array (GBM 3 and GBM 6), because various aneuploid conditions were observed in the derived neurosphere cell line (GBM 1) (Table S2), or because there were too few cells for FISH at secondary transplantation (GBM 4, GBM 7, and GBM 9). In all four cases studied by multicolor FISH, there was genetic heterogeneity in the neurosphere cells, and each case showed a unique, branched phylogenetic architecture. In each case, more than one subclone was capable of propagating tumors in secondary transplanted mice (Figures 1, 2, 3, and 4).
Figure 1.
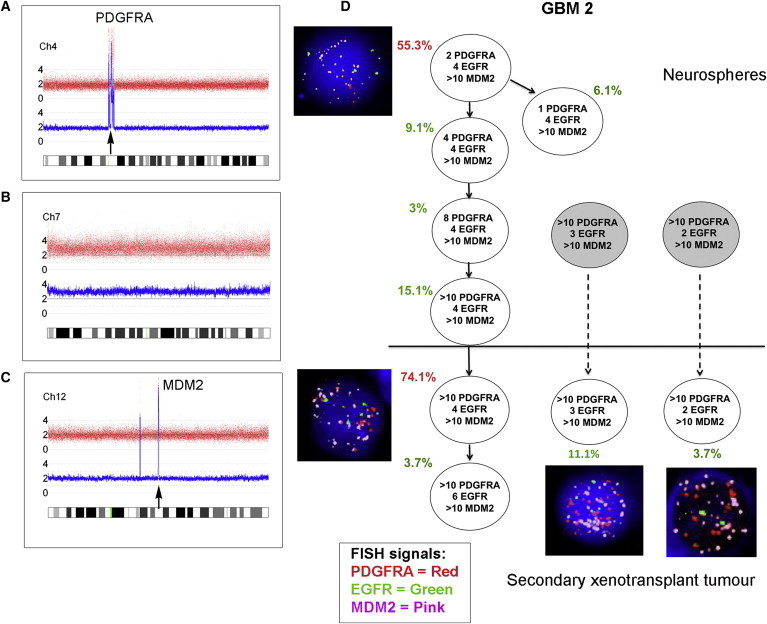
Subclonal Genetic Structure of Neurosphere Cells and Tumor-Propagating Cells Derived from Primary Tumor GBM 2
(A–C) SNP 6 array profiles of DNA from GBM 2 primary tumor showing high-level PDGFRA amplification (A), whole chromosome 7 gain (B), and high-level MDM2 amplification (C).
(D) Subclonal genetic structure in the neurospheres (top) and after secondary transplantation in a single mouse (m3) (bottom). Subclones represented by gray circles were not present in the neurospheres above the threshold detection level. FISH images are shown next to their respective genotype. Red type indicates the major clone. Solid arrows show probable derivation of subclones. Dashed arrows indicate possible alternative derivation of subclones. FISH images were captured at 100× magnification.
Figure 2.
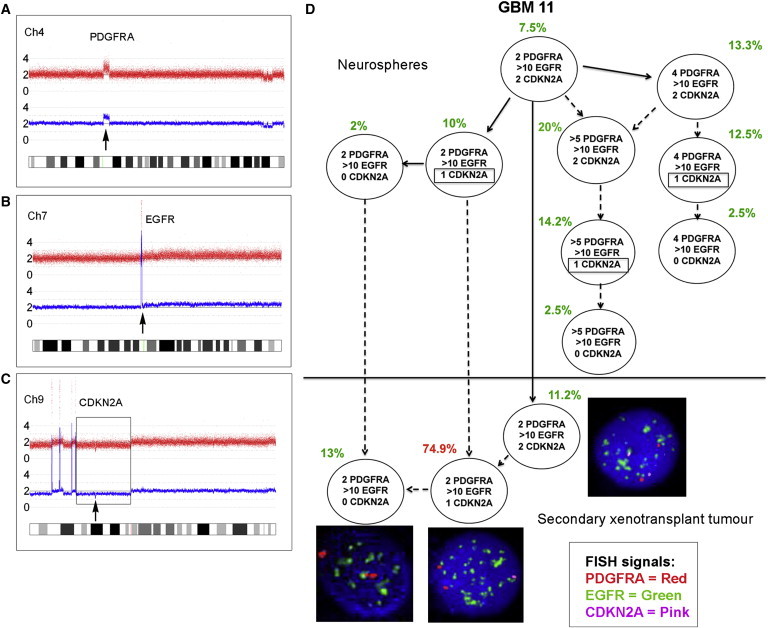
Subclonal Genetic Structure of Neurosphere Cells and Tumor-Propagating Cells Derived from Primary Glioblastoma GBM 11
(A–C) SNP 6 array profiles of DNA from GBM 11 primary tumor showing PDGFRA amplification (A), high-level EGFR amplification (B), and homozygous CDKN2A deletion (C) comprised of a large deletion of one allele (box) and focal deletion of the second allele (arrow).
(D) Subclonal structure of neurosphere cells (top) and tumor cells after secondary transplant in a single mouse (m3) (bottom). Potentially three different CDKN2A deletions occur in different subclones in the neurospheres (indicated by boxes). Solid arrows show probable derivation of subclones. Dashed arrows indicate possible alternative derivation of subclones. FISH images were captured at 100× magnification.
Figure 3.
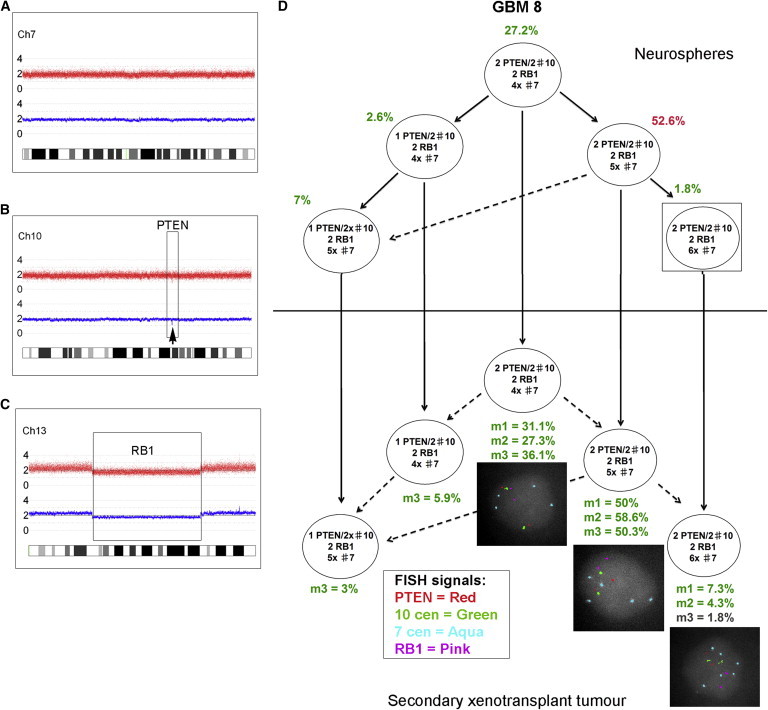
Identical Subclonal Genetic Structure of Neurosphere Cells and Tumor-Propagating Cells Derived from Primary Tumor GBM 8
(A–C) SNP 6 array profiles showing chromosome 7 (A), focal PTEN loss (B), and a large deletion of chromosome 13, including RB1 (C). There was also loss of heterozygosity (LOH) for the whole of 17p (including the TP53 gene) without any copy number change (uniparental disomy [UPD]).
(D) FISH analysis of GBM 8 neurospheres using a range of centromere probes revealed that these were nearly triploid, with two PTEN and RB1 signals corresponding to a loss of one copy of each locus. The neurospheres showed a branched subclonal structure with four subclones above the FISH detection threshold (2%) at the time of injection into primary mice (top). All of these read out in the tumors of at least one secondary transplanted mouse (bottom). One further subclone detected in all mice was present in the neurospheres at a level below the cutoff for FISH (1.8%) (box). m1, m2, m3: three replicate mice, each injected with 1 × 10⁶ neurosphere cells. Solid arrows show the probable derivation of subclones. Dashed arrows indicate the possible alternative derivation of subclones. FISH images were captured at 100× magnification.
Figure 4.
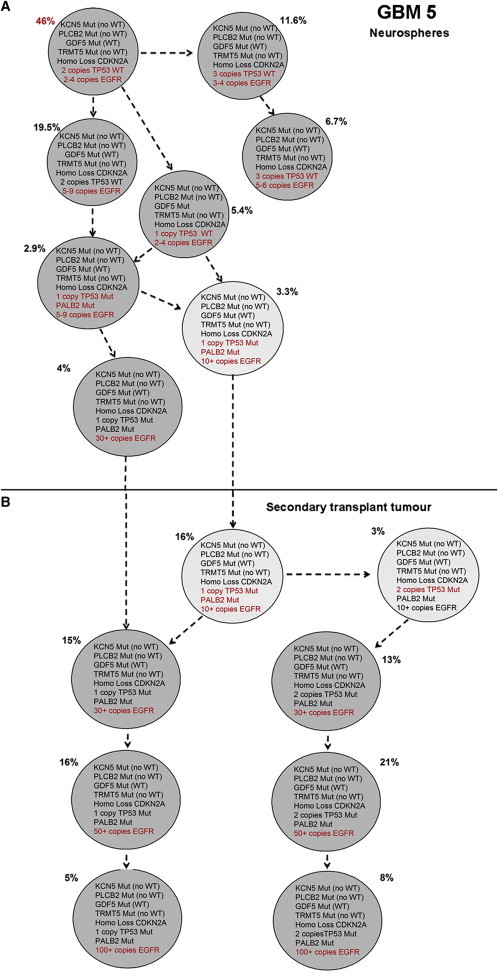
Single-Cell Analysis of Selected Mutations and CNAs Identified by Exome Sequencing in GBM 5
(A and B) Subclonal genetic architecture in neurospheres (A) and tumor-propagating cells derived from GBM 5 after xenotransplantation (B, mouse 2). A total of 240 neurosphere cells and 100 cells from the secondary xenotransplant tumor were evaluated. Mutations and CNAs are given within the circles; additional mutations and CNAs in individual subclones are indicated in red.
See also Figures S2–S4 and Tables S1, S2, S3, and S4.
Analyses of clonal architecture by multicolor FISH for CNAs inevitably underestimate the extent of clonal diversity (Anderson et al., 2011). In GBM 5, we had sufficient material for a more detailed genetic analysis. The SNP arrays of primary tumor GBM 5 revealed high-level, focal amplification of EGFR; homozygous loss of CDKN2A (one large deletion and one small focal deletion); and loss of TP53 due to a deletion of 17p (Figure S2). We observed seven subclones in the neurosphere cells and a branching subclonal structure. The major clone in the neurospheres had high-level focal amplification of EGFR, heterozygous TP53, and homozygous CDKN2A loss. Only two subclones read out in the secondary transplant tumor cells, and both had high-level EGFR amplification and homozygous CDKN2A loss. In contrast to the neurospheres, the major clone in the secondary mouse xenograft had two copies of TP53. We performed mutation screening of the TP53 gene by capillary electrophoresis single-strand conformation analysis in primary patient tumor DNA, followed by Sanger sequencing to characterize any mobility shifts thus identified. This revealed a mutation in exon 5: c.454C > T: p.152S. The same TP53 mutation was also found in xenograft cells after secondary transplantation (mouse 1 and mouse 3). Both wild-type and mutated TP53 sequences were present in the tumor DNA, but only the TP53 mutated sequence was present in the xenograft DNA, indicating that the mutation was present in all subclones of the mouse xenografts. In order to investigate this further, we carried out whole-exome sequencing and single-cell analysis for the simultaneous occurrence of CNAs and selected single-nucleotide variants (SNVs) in this case. For the latter, we used multiplex-targeted DNA amplification of flow-sorted single cells followed by high-throughput quantitative PCR (qPCR) using the BioMark HD microfluidic platform (Potter et al., 2013).
Whole-exome sequencing of tumor DNA from GBM 5 identified a total of 32 SNVs (Table S3). A subset of these SNVs was selected for single-cell analysis based on putative gene function and variant allele fractions encompassing high, low, and intermediate frequencies. The genomic targets selected included SNVs in KCNH5, PLCB2, GDF5, TRMT5, TP53, and PALB2, and CNAs in CDKN2A, TP53, and EGFR.
Single-cell analysis for the simultaneous presence of six SNVs and three CNAs was carried out on flow-sorted neurosphere and xenograft tumor cells from GBM 5 (a representative heatmap of the qPCR data from the BioMark HD is given in Figure S3). A comparison of the clonal phylogeny and subclonal architecture of neurosphere and xenograft cells is shown in Figure 4. Homozygous CDKN2A deletion, gain of EGFR (up to four copies), and KCN5, PLCB2, GDF5, and TRMT5 mutations all occurred early and were present in all subclones of the neurospheres (Figure 4A). Loss of one TP53 wild-type allele occurred after EGFR amplification of more than four copies. Heterozygous TP53 and PALB2 mutations occurred after further EGFR amplification. According to the chromosome 7 copy number as assessed by FISH (Figure S4) and single-cell data (not shown), EGFR gain was uncoupled from chromosome copy number at three or four copies of chromosome 7. Subsequently, there was an increasing gain of EGFR, consistent with the formation of extrachromosomal double minutes. All of the cells in the secondary mouse xenograft possessed all of the mutations, including heterozygous TP53 and PALB2 mutations, and most likely derived from two of the most evolved subclones in the neurospheres (being present in only 3.3% and 4%, respectively; Figure 4B). The subclone with one copy of TP53 mutant and more than ten copies of EGFR evolved further in the xenograft cells by acquiring two mutated copies of TP53, and all subclones evolved to show high-level amplification of EGFR (>100 copies) (Figure 4B).
We used secondary transplantation as a more stringent measure of stem cell renewal (Dick et al., 1997). In five cases (GBM 1, GBM 5, GBM 8, GBM 9, and GBM 11), we observed a statistically shorter time to tumor formation in the secondary transplant than in the primary xenograft tumor. This pattern of evolution is consistent with the typical pattern of disease progression seen in patients and would be consistent with the genetically more evolved subclonal structure observed in the neurospheres of GBM 5, GBM 8, and GBM 11, and with the presence of TP53 mutations in GBM 5 and GBM 8.
Clones with EGFR amplification consistently read out after serial transplantation, and usually further evolved with an incremental gain of more copies of EGFR. Other investigators have demonstrated a mosaic pattern of growth factor amplification in GBM tumors, with EGFR, MET, and PDGFRA gain occurring in distinct populations of cells (Snuderl et al., 2011; Szerlip et al., 2012). In the present study, there was one case (GBM 11) with subclones in the neurosphere cells that showed concurrent PDGFRA and EGFR gain in the same cell, as well as subclones with only EGFR gain (Figure 2). However, only the subclones with high-level EGFR amplification repopulated the mouse xenograft; none of the subclones with PDGFRA gain were present. These observations reveal the dynamic complexity of subclonal interactions in GBM and provide deeper insight into the role of PDGFRA. We previously showed that amplification of PDGFRA occurs in the midphase of GBM evolution (Sottoriva et al., 2013) rather than as a primary driver event. Evidence suggests that tumor-propagating clones may arise from a common precursor, with key early events including genetic alterations in EGFR, CDKN2A/B, and TP53 (Goodenberger and Jenkins, 2012; Snuderl et al., 2011; Sottoriva et al., 2013). These observations are supported by data from glioma susceptibility studies that revealed prominent roles for alterations in EGFR, CDKN2A, and TP53 in glioma evolution (Andersson et al., 2010; Egan et al., 2012; Shete et al., 2009; Stacey et al., 2011; Wrensch et al., 2009).
Our data confirm previously unrecognized levels of temporal diversity and complexity in the subclonal landscape of GBM. In all cases analyzed, genetically distinct subclones had variable serial repopulating activity in vivo. We can exclude the possibility that the presence of in vitro aberrations played a role in the clonal architecture of the mouse xenografts, given the culture conditions used and the number of in vitro cell passages. Since the in vivo readout is likely to be a functional activity of self-renewing CSCs, this suggests that the competitive self-renewal ability of tumor-propagating stem cells in GBM varies on the basis of frequency and/or quantitative features (e.g., proliferation rates and growth factor dependence). This is in line with the principle that the extensive replicative potential of CSCs allows subclonal evolution (Greaves and Maley, 2012).
Our interrogation of subclonal genetic diversity of human GBM has revealed that tumor-propagating cells in GBM are genetically heterogeneous and have a variable competitive capacity for tumor propagation in vivo. The link forged among genetic diversity, clonal architecture, and propagating activity in vivo may facilitate the characterization of mutational variants that are responsible for disease recurrence and therapeutic resistance in patients (Johnson et al., 2014).
Experimental Procedures
GBM Sample Collection
Twelve patients diagnosed with primary GBM were administered 5-aminolevulinic acid (Medac UK) 5 hr before surgery as an oral dose of 20 mg/kg as previously described (Piccirillo et al., 2012; Stummer et al., 2006). The tissue collection protocols complied with the UK Human Tissue Act 2004 (HTA license ref. 12315) and were approved by the local regional ethics committee (LREC ref. 04/Q0108/60). Informed consent was obtained from each patient before surgery.
Cell Line Derivation and In Vivo Tumorigenicity
Primary culture and neurosphere cell line derivation were performed as previously described (Fael Al-Mayhani et al., 2009; Piccirillo et al., 2009, 2012). Briefly, primary GBM cells were plated in culture dishes directly after tumor resection from the patient and used for in vivo experiments upon formation of the first neurospheres. To evaluate in vivo tumorigenicity, serial transplantations (two in vivo passages) were performed using immunosuppressed animals. As soon as neurosphere cultures were established, mechanical dissociation to single cells was carried out and 1 × 10⁶ cells/animal were used for intracerebral transplantation into the right striatum of 4-week-old NOD-SCID mice (Charles River), using previously described stereotactic coordinates (Piccirillo et al., 2006, 2009). From the same single-cell suspension, 1 × 10⁶ cells were used for FISH analysis.
In total, 36 animals were injected with cells derived from 12 GBMs (n = 3 animals/GBM). Mice were sacrificed when they became symptomatic according to the Home Office guidelines. Whole mouse brains were removed and tumors were resected as previously described (Galli et al., 2004). The tissue was mechanically disaggregated and reinjected into other 4-week-old NOD-SCID mice using the same stereotactic coordinates (n = 3 animals/GBM, 34 animals in total). When symptoms appeared, the animals were sacrificed and the whole tumors were resected and disaggregated. All of the tumors harvested from mice after the secondary in vivo passage were used in FISH analyses for comparison with the single-cell suspension derived from neurosphere cultures. Disaggregated cells from the primary xenograft tumors were fixed for FISH and stored for comparison if needed. All of the in vivo experiments were performed according to UK Project license approval.
FISH
Single-cell suspensions from dissociated neurosphere cultures or mouse xenograft tumor mice were harvested and fixed in methanol-acetic acid according to standard cytogenetic methods (Horsley et al., 2008). Then, 100–200 nuclei from each cell preparation were analyzed for the presence of the relevant FISH probes signals. Interphase FISH for selected CNAs was carried out as previously described (Anderson et al., 2011) using BAC and fosmid probes for selected genes (the BACPAC Resource Center, Children’s Hospital, Oakland Research Institute; http://bacpac.chori.org). Probes were labeled by nick translation with biotin-16-dUTP (Roche Diagnostics), SpectrumGreen (Vysis, Abbott Laboratories), or Cy3-dUTP (Roche Diagnostics), and hybridized in combination as previously described (Anderson et al., 2011). Hybridization and washes were performed according to the Vysis protocol, with a single layer of Cy5-conjugated streptavidin (GE Healthcare) for detection of biotinylated probes. Fluorescent signals were viewed with a Zeiss Axioskop fluorescence microscope equipped with filters for DAPI, fluorescein isothiocyanate/SpectrumGreen, SpectrumOrange, and Cy5. Images were captured and analyzed using a Hamamatsu ORCA-ER CCD camera and SmartCapture X software (Digital Scientific).
Whole-Exome Sequencing
Genomic DNA was subjected to whole-exome sequencing (Oxford Gene Technology). Exome capture was performed using the SureSelectXT Human All Exon v4 kit (Agilent) according to manufacturer’s instructions and sequenced with Illumina paired-end sequencing (protocol v1.2).
Single-Cell Analysis
Single-cell sorting, qPCR, and analysis were all performed essentially as previously described (Potter et al., 2013). Briefly, single cells were sorted on a BDFACSAria1-SORP instrument (BD) directly into lysis buffer. Specific (DNA) targeted amplification was then performed prior to qPCR. Single-cell, target-amplified DNA was interrogated by qPCR for each DNA target of interest using the 96.96 dynamic microfluidic array and the BioMark HD system (Fluidigm) as recommended by the manufacturer.
Author Contributions
M.G., C.W., L.K., and S.G.M.P. conceived and designed the study. S.G.M.P., S.C., L.K., N.E.P., F.W.v.D., S.L., and M.-J.C. carried out the work, including development of the methodology. M.G., C.W., L.K., S.G.M.P., N.E.P., and F.W.v.D. analyzed and interpreted the results. L.K., S.G.M.P., M.G., C.W., N.E.P., and F.W.v.D. were involved in writing, reviewing, and/or revising the manuscript. M.G., C.W., and L.K. supervised the study.
Acknowledgments
We thank Oxford Gene Technology for providing the method for whole-exome sequencing. This study was supported by the National Institute for Health Research, the Cambridge Biomedical Research Centre, the Higher Education Funding Council for England, the Royal College of Surgeons of Edinburgh, The Brain Tumour Charity, the European Commission-Seventh Framework Programme (Marie Curie Intra-European Fellowship to S.G.M.P.), and the Wellcome Trust (Strategic Award to M.G.).
Footnotes
This is an open access article under the CC BY-NC-ND license (http://creativecommons.org/licenses/by-nc-nd/3.0/).
Contributor Information
Colin Watts, Email: cw209@cam.ac.uk.
Mel Greaves, Email: mel.greaves@icr.ac.uk.
Supplemental Information
References
- Anderson K., Lutz C., van Delft F.W., Bateman C.M., Guo Y., Colman S.M., Kempski H., Moorman A.V., Titley I., Swansbury J. Genetic variegation of clonal architecture and propagating cells in leukaemia. Nature. 2011;469:356–361. doi: 10.1038/nature09650. [DOI] [PubMed] [Google Scholar]
- Andersson U., Schwartzbaum J., Wiklund F., Sjöström S., Liu Y., Tsavachidis S., Ahlbom A., Auvinen A., Collatz-Laier H., Feychting M. A comprehensive study of the association between the EGFR and ERBB2 genes and glioma risk. Acta Oncol. 2010;49:767–775. doi: 10.3109/0284186X.2010.480980. [DOI] [PubMed] [Google Scholar]
- Bao S., Wu Q., Sathornsumetee S., Hao Y., Li Z., Hjelmeland A.B., Shi Q., McLendon R.E., Bigner D.D., Rich J.N. Stem cell-like glioma cells promote tumor angiogenesis through vascular endothelial growth factor. Cancer Res. 2006;66:7843–7848. doi: 10.1158/0008-5472.CAN-06-1010. [DOI] [PubMed] [Google Scholar]
- Bonavia R., Inda M.M., Cavenee W.K., Furnari F.B. Heterogeneity maintenance in glioblastoma: a social network. Cancer Res. 2011;71:4055–4060. doi: 10.1158/0008-5472.CAN-11-0153. [DOI] [PMC free article] [PubMed] [Google Scholar]
- Chen R., Nishimura M.C., Bumbaca S.M., Kharbanda S., Forrest W.F., Kasman I.M., Greve J.M., Soriano R.H., Gilmour L.L., Rivers C.S. A hierarchy of self-renewing tumor-initiating cell types in glioblastoma. Cancer Cell. 2010;17:362–375. doi: 10.1016/j.ccr.2009.12.049. [DOI] [PubMed] [Google Scholar]
- Chen J., Li Y., Yu T.S., McKay R.M., Burns D.K., Kernie S.G., Parada L.F. A restricted cell population propagates glioblastoma growth after chemotherapy. Nature. 2012;488:522–526. doi: 10.1038/nature11287. [DOI] [PMC free article] [PubMed] [Google Scholar]
- Dick J.E., Bhatia M., Gan O., Kapp U., Wang J.C. Assay of human stem cells by repopulation of NOD/SCID mice. Stem Cells. 1997;15(Suppl 1):199–203. doi: 10.1002/stem.5530150826. discussion 204–207. [DOI] [PubMed] [Google Scholar]
- Egan K.M., Nabors L.B., Olson J.J., Monteiro A.N., Browning J.E., Madden M.H., Thompson R.C. Rare TP53 genetic variant associated with glioma risk and outcome. J. Med. Genet. 2012;49:420–421. doi: 10.1136/jmedgenet-2012-100941. [DOI] [PMC free article] [PubMed] [Google Scholar]
- Fael Al-Mayhani T.M., Ball S.L., Zhao J.W., Fawcett J., Ichimura K., Collins P.V., Watts C. An efficient method for derivation and propagation of glioblastoma cell lines that conserves the molecular profile of their original tumours. J. Neurosci. Methods. 2009;176:192–199. doi: 10.1016/j.jneumeth.2008.07.022. [DOI] [PubMed] [Google Scholar]
- Galli R., Binda E., Orfanelli U., Cipelletti B., Gritti A., De Vitis S., Fiocco R., Foroni C., Dimeco F., Vescovi A. Isolation and characterization of tumorigenic, stem-like neural precursors from human glioblastoma. Cancer Res. 2004;64:7011–7021. doi: 10.1158/0008-5472.CAN-04-1364. [DOI] [PubMed] [Google Scholar]
- Goodenberger M.L., Jenkins R.B. Genetics of adult glioma. Cancer Genet. 2012;205:613–621. doi: 10.1016/j.cancergen.2012.10.009. [DOI] [PubMed] [Google Scholar]
- Greaves M. Cancer stem cells as ‘units of selection’. Evol. Appl. 2013;6:102–108. doi: 10.1111/eva.12017. [DOI] [PMC free article] [PubMed] [Google Scholar]
- Greaves M., Maley C.C. Clonal evolution in cancer. Nature. 2012;481:306–313. doi: 10.1038/nature10762. [DOI] [PMC free article] [PubMed] [Google Scholar]
- Horsley S.W., Colman S., McKinley M., Bateman C.M., Jenney M., Chaplin T., Young B.D., Greaves M., Kearney L. Genetic lesions in a preleukemic aplasia phase in a child with acute lymphoblastic leukemia. Genes Chromosomes Cancer. 2008;47:333–340. doi: 10.1002/gcc.20537. [DOI] [PubMed] [Google Scholar]
- Johnson B.E., Mazor T., Hong C., Barnes M., Aihara K., McLean C.Y., Fouse S.D., Yamamoto S., Ueda H., Tatsuno K. Mutational analysis reveals the origin and therapy-driven evolution of recurrent glioma. Science. 2014;343:189–193. doi: 10.1126/science.1239947. [DOI] [PMC free article] [PubMed] [Google Scholar]
- Jung V., Romeike B.F., Henn W., Feiden W., Moringlane J.R., Zang K.D., Urbschat S. Evidence of focal genetic microheterogeneity in glioblastoma multiforme by area-specific CGH on microdissected tumor cells. J. Neuropathol. Exp. Neurol. 1999;58:993–999. doi: 10.1097/00005072-199909000-00009. [DOI] [PubMed] [Google Scholar]
- Kreso A., Dick J.E. Evolution of the cancer stem cell model. Cell Stem Cell. 2014;14:275–291. doi: 10.1016/j.stem.2014.02.006. [DOI] [PubMed] [Google Scholar]
- Little S.E., Popov S., Jury A., Bax D.A., Doey L., Al-Sarraj S., Jurgensmeier J.M., Jones C. Receptor tyrosine kinase genes amplified in glioblastoma exhibit a mutual exclusivity in variable proportions reflective of individual tumor heterogeneity. Cancer Res. 2012;72:1614–1620. doi: 10.1158/0008-5472.CAN-11-4069. [DOI] [PubMed] [Google Scholar]
- Marusyk A., Almendro V., Polyak K. Intra-tumour heterogeneity: a looking glass for cancer? Nat. Rev. Cancer. 2012;12:323–334. doi: 10.1038/nrc3261. [DOI] [PubMed] [Google Scholar]
- Nicholas M.K. Glioblastoma multiforme: evidence-based approach to therapy. Expert Rev. Anticancer Ther. 2007;7(12, Suppl):S23–S27. doi: 10.1586/14737140.7.12s.S23. [DOI] [PubMed] [Google Scholar]
- Nickel G.C., Barnholtz-Sloan J., Gould M.P., McMahon S., Cohen A., Adams M.D., Guda K., Cohen M., Sloan A.E., LaFramboise T. Characterizing mutational heterogeneity in a glioblastoma patient with double recurrence. PLoS ONE. 2012;7:e35262. doi: 10.1371/journal.pone.0035262. [DOI] [PMC free article] [PubMed] [Google Scholar]
- Notta F., Mullighan C.G., Wang J.C., Poeppl A., Doulatov S., Phillips L.A., Ma J., Minden M.D., Downing J.R., Dick J.E. Evolution of human BCR-ABL1 lymphoblastic leukaemia-initiating cells. Nature. 2011;469:362–367. doi: 10.1038/nature09733. [DOI] [PubMed] [Google Scholar]
- Nowell P.C. The clonal evolution of tumor cell populations. Science. 1976;194:23–28. doi: 10.1126/science.959840. [DOI] [PubMed] [Google Scholar]
- Patel A.P., Tirosh I., Trombetta J.J., Shalek A.K., Gillespie S.M., Wakimoto H., Cahill D.P., Nahed B.V., Curry W.T., Martuza R.L. Single-cell RNA-seq highlights intratumoral heterogeneity in primary glioblastoma. Science. 2014;344:1396–1401. doi: 10.1126/science.1254257. [DOI] [PMC free article] [PubMed] [Google Scholar]
- Piccirillo S.G., Reynolds B.A., Zanetti N., Lamorte G., Binda E., Broggi G., Brem H., Olivi A., Dimeco F., Vescovi A.L. Bone morphogenetic proteins inhibit the tumorigenic potential of human brain tumour-initiating cells. Nature. 2006;444:761–765. doi: 10.1038/nature05349. [DOI] [PubMed] [Google Scholar]
- Piccirillo S.G., Combi R., Cajola L., Patrizi A., Redaelli S., Bentivegna A., Baronchelli S., Maira G., Pollo B., Mangiola A. Distinct pools of cancer stem-like cells coexist within human glioblastomas and display different tumorigenicity and independent genomic evolution. Oncogene. 2009;28:1807–1811. doi: 10.1038/onc.2009.27. [DOI] [PubMed] [Google Scholar]
- Piccirillo S.G., Dietz S., Madhu B., Griffiths J., Price S.J., Collins V.P., Watts C. Fluorescence-guided surgical sampling of glioblastoma identifies phenotypically distinct tumour-initiating cell populations in the tumour mass and margin. Br. J. Cancer. 2012;107:462–468. doi: 10.1038/bjc.2012.271. [DOI] [PMC free article] [PubMed] [Google Scholar]
- Potter N.E., Ermini L., Papaemmanuil E., Cazzaniga G., Vijayaraghavan G., Titley I., Ford A., Campbell P., Kearney L., Greaves M. Single-cell mutational profiling and clonal phylogeny in cancer. Genome Res. 2013;23:2115–2125. doi: 10.1101/gr.159913.113. [DOI] [PMC free article] [PubMed] [Google Scholar]
- Shackleton M., Quintana E., Fearon E.R., Morrison S.J. Heterogeneity in cancer: cancer stem cells versus clonal evolution. Cell. 2009;138:822–829. doi: 10.1016/j.cell.2009.08.017. [DOI] [PubMed] [Google Scholar]
- Shapiro J.R., Yung W.K., Shapiro W.R. Isolation, karyotype, and clonal growth of heterogeneous subpopulations of human malignant gliomas. Cancer Res. 1981;41:2349–2359. [PubMed] [Google Scholar]
- Shete S., Hosking F.J., Robertson L.B., Dobbins S.E., Sanson M., Malmer B., Simon M., Marie Y., Boisselier B., Delattre J.Y. Genome-wide association study identifies five susceptibility loci for glioma. Nat. Genet. 2009;41:899–904. doi: 10.1038/ng.407. [DOI] [PMC free article] [PubMed] [Google Scholar]
- Snuderl M., Fazlollahi L., Le L.P., Nitta M., Zhelyazkova B.H., Davidson C.J., Akhavanfard S., Cahill D.P., Aldape K.D., Betensky R.A. Mosaic amplification of multiple receptor tyrosine kinase genes in glioblastoma. Cancer Cell. 2011;20:810–817. doi: 10.1016/j.ccr.2011.11.005. [DOI] [PubMed] [Google Scholar]
- Sottoriva A., Spiteri I., Piccirillo S.G., Touloumis A., Collins V.P., Marioni J.C., Curtis C., Watts C., Tavaré S. Intratumor heterogeneity in human glioblastoma reflects cancer evolutionary dynamics. Proc. Natl. Acad. Sci. USA. 2013;110:4009–4014. doi: 10.1073/pnas.1219747110. [DOI] [PMC free article] [PubMed] [Google Scholar]
- Stacey S.N., Sulem P., Jonasdottir A., Masson G., Gudmundsson J., Gudbjartsson D.F., Magnusson O.T., Gudjonsson S.A., Sigurgeirsson B., Thorisdottir K., Swedish Low-risk Colorectal Cancer Study Group. A germline variant in the TP53 polyadenylation signal confers cancer susceptibility. Nat. Genet. 2011;43:1098–1103. doi: 10.1038/ng.926. [DOI] [PMC free article] [PubMed] [Google Scholar]
- Stummer W., Pichlmeier U., Meinel T., Wiestler O.D., Zanella F., Reulen H.J., ALA-Glioma Study Group. Fluorescence-guided surgery with 5-aminolevulinic acid for resection of malignant glioma: a randomised controlled multicentre phase III trial. Lancet Oncol. 2006;7:392–401. doi: 10.1016/S1470-2045(06)70665-9. [DOI] [PubMed] [Google Scholar]
- Szerlip N.J., Pedraza A., Chakravarty D., Azim M., McGuire J., Fang Y., Ozawa T., Holland E.C., Huse J.T., Jhanwar S. Intratumoral heterogeneity of receptor tyrosine kinases EGFR and PDGFRA amplification in glioblastoma defines subpopulations with distinct growth factor response. Proc. Natl. Acad. Sci. USA. 2012;109:3041–3046. doi: 10.1073/pnas.1114033109. [DOI] [PMC free article] [PubMed] [Google Scholar]
- Wrensch M., Jenkins R.B., Chang J.S., Yeh R.F., Xiao Y., Decker P.A., Ballman K.V., Berger M., Buckner J.C., Chang S. Variants in the CDKN2B and RTEL1 regions are associated with high-grade glioma susceptibility. Nat. Genet. 2009;41:905–908. doi: 10.1038/ng.408. [DOI] [PMC free article] [PubMed] [Google Scholar]
Associated Data
This section collects any data citations, data availability statements, or supplementary materials included in this article.