

1. The need for India specific guidelines for lipids
Cardiovascular disease (CVD) is the single largest cause of death in the developed countries and is among the leading causes of death and disability in the developing nations as well. There are an estimated 31.8 million people living with coronary artery disease (CAD) in India alone.1 Furthermore, in contrast to developed countries, CVD tends to occur at a younger age in Indians with 52% of CVD deaths occurring under 70 years and 10% of heart attacks occurring in subjects <40 years. The age-standardized estimates for disability-adjusted life-years (DALY's) lost due to CAD are three times higher in India than in developed countries.
Of the defined traditional CV risk factors, dyslipidemia is perhaps the most common and easily controllable risk factor. Worldwide, high cholesterol levels are estimated to cause 56% of ischemic heart disease and 18% of strokes, amounting to 4.4 million deaths annually. At the same time, the CV benefits of lipid lowering have also been well researched. A review of ten large cohort studies reported that a decrease of 10.8 mg/dlin cholesterol concentration was associated with a decrease in risk of ischemic heart disease by 54% at age 40, 39% at age 50, 27% at age 60, 20% at age 70 and 19% at age 80.2 Further, the meta-analysis of trials to reduce serum cholesterol concentrations showed that for a similar reduction in serum cholesterol, there was a 7% reduction in ischemic heart disease events for men enrolled in the trial for less than 2 years, 22% for those enrolled between 2 and 5 years and 25% for those enrolled between 5 and 12 years.2 Thus, sustained cholesterol lowering, using either drug therapy or dietary interventions, reduces the occurrence of ischemic events across all age groups. Although there are distinct epidemiological difference between South-Asians and the western populations, overall CV risk factors are same in both. In fact, as shown in the INTERHEART study, dyslipidemia appears to be the strongest contributor of acute myocardial infarction (MI) in South-Asians.3
Numerous studies conducted in Indians have revealed that various forms of dyslipidemia such as high total and low-density lipoprotein cholesterol (TC and LDL-C), low high-density lipoprotein cholesterol (HDL-C) and high triglycerides (TG) are highly prevalent. At the same time, while extensive guidelines are available for management of dyslipidemia in US and Europe, no specific guidelines exist for lipid management among Indians. Consequently, Indian physicians need to resort to the western guidelines only for managing lipid abnormalities in Indian patients, which, for several reasons, is not a very desirable practice. As outlines below, Indians are known to have significant socioeconomic, cultural, lifestyle and genetic differences that directly or indirectly impact prevalence and management of dyslipidemia and CVD-
-
•
The pattern of dyslipidemia is different in Indians. The LDL-C levels are not very high but there is greater preponderance of more atherogenic small, dense LDL particles as compared to Caucasian subjects. In addition, the TG levels are usually elevated and HDL-C levels are low. This pattern of dyslipidemia, which is known as ‘atherogenic dyslipidemia’, is a quite common in South Asian populations.
-
•
The prevalence and the pattern of concomitant CV risk factors that modulate the impact of dyslipidemia on CV risk (e.g. truncal obesity, metabolic syndrome and diabetes) are also different in Indians.
-
•
Early age of onset of CVD in Indians renders the prediction of CV risk a challenging task. Most of the conventional risk assessment approaches are known to underestimate the CV risk in Indians and are therefore not applicable.
-
•
Pharmacokinetics of the different lipid-lowering agents may differ in Indians with potential implications on the optimum dosages required to achieve the lowest risk-benefit ratio.
-
•
There are several cultural and socioeconomic differences that further complicate the situation. The Indian society is primarily “food centric” with food being one of the most important elements of any celebration. A wide variety of cuisines are consumed across different states of our country. Most of them involve extensive use of different types of saturated fats, trans-fatty acids and sugars. North India extensively uses saturated fats like ghee and butter whereas the southern part traditionally uses coconut oil as the predominant cooking medium. Both have been shown to be highly atherogenic through their impact on lipid levels. Also, reheating of oils for deep frying foods is a common practice. This increases the levels of trans-fatty acids in the food which have incremental harmful effect on lipid levels. Sweets consumed in large quantities during celebrations and social gathering are also rich in dairy fats. The harmful effects of these unhealthy eating practices are further reinforced by the lack of physical activity among Indians, which is becoming increasingly common as a result of urbanization and growing affluence.
-
•
Periodic health checks are uncommon, making timely detection of dyslipidemia difficult. Even when detected, treatment rates are dismal, partly because the treatment costs are borne largely out-of-pocket. The Prospective Urban Rural Epidemiological (PURE) study demonstrated that only about 2.6% of CVD patients take regular medications among low income countries, including India.4
-
•
Finally, the differences are apparent even at the health policy level. As the burden of communicable diseases is still substantial in our country, the primary focus of the healthcare policies continues to remain on the communicable diseases.
The present document has therefore been prepared as an attempt to address the above concerns and to suggest management approaches that are more pertinent to Indians. It must be remembered that this document only represents a consensus of expert opinions, reached after a systematic review of the available current scientific evidence, and is intended primarily to assist in clinical-decision making. However,the final decision regarding care of a particular patient has to be made by the treating physician, keeping in consideration all relevant clinical and non-clinical factors related to that particular patient.
While formulating these recommendations, the consensus committee faced several challenges, some of which merit attention. The biggest challenge faced was the unavailability of large-scale epidemiological studies and outcome studies to define normal lipid values and their relationship with the development of CVD. Most published studies from India are from special regional groups, which, by design, are not representative of the entire Indian population. A large cross sectional study, with samples from different socioeconomic strata across different cultural groups with different dietary habits is required to determine normal lipid values amongst Indians. Similarly, in absence of prospective studies, it was not possible to specifically determine the long-term impact of different lipid management approaches in Indian subjects. Another major hurdle in lipid management in India has been the frequent use of non-standardized laboratories by physicians across the country, not only for managing their patients but also while reporting their experiences. Nevertheless, despite these limitations, an attempt has been made to transform the knowledge gained from the research conducted so far and the clinical experience accumulated over the years in to practical guidelines that are likely to be more relevant, than the existing ones, to Indian populations. The available scientific evidence relating to the different aspects of dyslipidemia in Indians was reviewed and compared with the data available for the western populations. The existing western guidelines were then modified in light of these findings to render them more applicable to our population. If, for any particular aspect, negligible or only limited information was available for Indian subjects, the recommendations were made based on the clinical practice experience of the expert consensus group, while highlighting the limitations of such an approach.
1.1. Governmental emphasis on public health
The government should promote a positive attitude towards health, being proactive rather than being reactive, especially towards CV health. As prevention is perhaps the only cure, educating the general public about the importance of lipids and CVD prevention should be high on the agenda. The laws regarding permissible levels of quality and quantity of salts and fats in packaged and restaurant foods have to be formulated and strictly adhered to. Similarly, a uniform lipid testing and monitoring strategy should be a part of National Health Advisory statement. In addition, better urban planning and school-based and worksite interventions for increasing physical activity are also desirable. At the same time, the policy initiatives should also focus on improvement in socioeconomic status and literacy, adequate healthcare financing and public health insurance to ensure uniform availability of healthcare to all segments of the society, irrespective of their socioeconomic status.
Prevention of CVD in India requires concentrated efforts from all the different sections of the society, including general public, patient groups, doctors, media, policy makers, etc. To be able to derive the maximum benefit, the goal should be to influence as large section of the society as possible. Geoffrey Rose, who developed concept of continuum of risk associated for CVD, famously pointed out that “more people making small changes in their risk factor profile are likely to result in a much larger benefit to the society, as opposed to large changes in a small number of patients”.5
2. Epidemiological aspects
2.1. Burden of CVD in India
CVDs are the largest causes of mortality in the world and majority of deaths occur in low and middle income countries such as India.6 The Global Burden of Diseases (GBD) Study 2010 reported that coronary heart disease (CHD) and stroke are the top 2 causes of deaths globally. From years 1990–2010, mortality from these diseases has increased by 35% for CHD and 26% for stroke.7 In terms of global years of life lost (YLL), CHD and stroke were at number 4 and 5 in global ranking in 1990 but have since jumped to rank 1 and 3 in 2010.3 In South Asia (India), CHD is at number 4 and stroke is at 9 for YLLs, with lower respiratory infections, preterm birth complications, diarrheal diseases, chronic obstructive pulmonary disease, sepsis, neonatal encephalopathy and tuberculosis being the other leading causes of YLLs.7
CV mortality rates in India are quite high and are among the highest in the world. WHO reports annual age-adjusted mortality rate in men and women respectively of 386 and 283/100,000.6 These rates are similar to those in other South Asian countries and much greater than in USA (men 191, women 122/100,000) and all European countries except Russia.6 Only a few prospective studies of CV mortality are available. A small study in rural Gujarat8 and a larger study in rural Andhra Pradesh9 reported age-adjusted annual mortality rates of 200–250/100,000 while studies in urban Kerala10 and Mumbai11 have reported high CV mortality rates approaching 500/100,000 for men and 250/100,000 for women. These rates are almost twice that of USA and 3–5 times greater than many European countries.6
In the last 50 years there have been multiple CV epidemiological studies in India that have defined prevalence of CHD and stroke and identified burden of disease.12 A meta-analysis of these studies reported that prevalence rates have more than trebled in the Indian population.13 Studies in middle of last century reported a low prevalence of 1–2% in urban locations and 0.5–1% in rural locations with very little urban-rural difference. In the intervening years the CHD prevalence in urban areas increased to 10–12% while it increased to only 4–5% in rural adults.12 However, using the criteria of known CHD or pathological ECG-Q waves a lower prevalence has been reported in various Indian studies. The PURE Study reported prevalence of known CHD, stroke or either in high income, upper middle income, lower middle income and low income (mainly India) countries. The prevalence (%) of CHD was 4.2, 3.2, 4.8 and 2.1, stroke 1.3, 1.6, 1.7 and 1.0, and either of the two 5.2, 4.5, 6.1 and 3.0 percent, respectively.4
2.2. CV risk factors
There are no prospective CV epidemiological studies that have identified risk factors of importance in India. However, multiple case-control studies exist.3,12 The largest of these case-control studies is the INTERHEART study.3 This study was performed in 15152 cases with acute MI and 14820 controls in 52 countries of the world. About 4000 cases (n = 1732) and controls (n = 2204) were from the South Asian region.14 This study showed that 9 standard risk factors including smoking, abnormal lipids, hypertension, diabetes, high waist-hip ratio, sedentary lifestyle, psychosocial stress, and lack of consumption of fruits and vegetables explained more than 90% of acute CHD events in South Asians (Table 1). These risk factors were similar to those in other populations but developed at a younger age in South Asians, which explained the earlier onset of disease in them.14 Similarly, the INTERSTROKE study15 also reported that ten common risk factors explained more than 90% of the incident haemorrhagic and thrombotic strokes. The risk factors were same as in the INTERHEART study (apart from cardiac illnesses being an additional cause of strokes) but the population attributable risks were different with greater importance of hypertension and lesser importance of diabetes and lipids (Table 1).
Table 1.
Population attributable risks (%) of various cardiovascular risk factors in INTERHEART and INTERSTROKE studies (Data source: Yusuf S, et al3 and O'Donnell M, et al15).
| Risk factor | INTERHEART (acute myocardial infarction) | INTERSTROKE (any stroke-thrombotic, haemorrhagic) |
|---|---|---|
| Apo A/B ratio | 49.2 | 24.9 |
| Hypertension | 17.9 (history) | 34.6 |
| Smoking | 35.7 | 18.9 |
| Diabetes history | 9.9 | 5.0 |
| High waist-hip ratio | 20.1 | 26.5 |
| Psychosocial stress | 32.5 | 9.8 |
| Regular physical activity | 12.2 | 28.5 |
| Diet/high poor diet score | 13.7 | 18.8 |
| Lack of alcohol intake | 6.7 | 3.8 |
| Cardiac causes | – | 6.7 |
Although, in the INTERHEART study, overall contribution of the common risk factors was same in South Asians as in other regions, there were some important variations. Some of the harmful factors [elevated Apo B100/Apo A-1 (Apo B100/Apo A-1) ratio and history of diabetes] were more common in South Asians than in individuals from other countries (43.8% vs 31.8% and 9.5% vs 7.2%, respectively) whereas some protective factors were lower in South Asian controls as compared to controls from other countries (moderate or high intensity exercise 6.1% vs 21.6% and daily intake of fruits and vegetables 26.5% vs 45.2%, p < 0.001).14
2.2.1. Risk factor prevalence and trends
Review of epidemiological studies suggests that all the major CV risk factors are increasing in India. Tobacco production and consumption have increased significantly. Smoking is increasing particularly in the low educational stratum in the urban areas16 and among younger subjects (20–35 years).17 Prevalence of hypertension has increased in both urban and rural subjects and presently is 25–40% in urban and 10–15% among rural adults.18,19Although there are large regional variations in prevalence of diabetes, it has more than quadrupled in the last 20 years, from <1 to 3% to 10–15% in urban and 3–5% in rural areas.20 The current prevalence rates of diabetes are significantly greater in India as compared to most high and middle income countries.20,21 Only China and the middle-eastern countries have greater diabetes prevalence.21 Similarly, studies have reported an increase in obesity also, esp. the more ominous truncal obesity.22 The prevalence of dyslipidemia has also increased, as discussed in the subsequent sections.
Unfortunately, most of the data presented above have come from multiple cross-sectional studies and there are almost no studies that have evaluated risk factors using a prospective cohort design. The only studies to come closest to a prospective design have been a series of five Jaipur Heart Watch studies that evaluated multiple CV risk factors in urban middle-class subjects using multiple cross-sectional study design over a period of twenty years from 1991–2010.23 Over this period, in these urban subjects, the prevalence of smoking declined, hypertension did not change significantly, while cardiometabolic risk factors such as obesity, truncal obesity, hypercholesterolemia, diabetes and metabolic syndrome increased significantly.
The prevalence of CV risk factors in India has significant regional variations also.24 The second and third National Family Health Survey (NFHS) reported state-wise prevalence of smoking and obesity in Indians.25 The smoking rates were the highest in eastern Indian states and the lowest in Punjab whereas the prevalence of overweight and obesity was the highest in southern and northern Indian states and the lowest in central Indian states.22 Although regional variations in other CV risk factors are not well reported within a single study using uniform methodology, review of hypertension epidemiological studies shows that the prevalence of hypertension is significantly greater in metropolitan cities such as Mumbai and low in less populated cities.18,19 However, these same studies have also shown thatthe hypertension prevalence in rural populations is approaching the rates in urban subjects. The studies for hypercholesterolemia have not shown a very large regional variation (Table 2), but the prevalence is significantly greater in urban as compared to rural populations.26 The ICMR-WHO six-site CV risk factor surveillance study reported hypercholesterolemia (≥200 mg/dl) in urban, peri-urban and rural sites in 31.7, 18.1 and 19.5% men and 32.8, 23.4 and 26.4% women respectively (p < 0.01 for urban-rural difference).27 These prevalence rates are lower than in high and middle income countries.28
Table 2.
Prevalence of hypercholesterolemia (TC ≥ 200 mg/dl) in recent Indian studies (Data source: Maheshwari P, et al26).
| Study | Year reported | Sample size | Prevalence (%) |
|
|---|---|---|---|---|
| Men | Women | |||
| Delhi Urban Slum Study | 2001 | 532 | 26.8 | 27.5 |
| Jaipur Heart Watch-2 | 2002 | 1123 | 34.1 | 36.1 |
| Chennai Urban Population Study | 2003 | 1262 | 25.7 | – |
| Indian Industrial Population Surveillance Study | 2007 | 10,442 | 25.1 | – |
| India Migration Study: Rural | 2010 | 1983 | 21.1 | 27.8 |
| WHO-ICMR Integrated Disease Surveillance Project: Urban | 2010 | 15,223 | 31.7 | 32.8 |
| WHO-ICMR Integrated Disease Surveillance Project: Rural | 2010 | 13,517 | 19.5 | 26.4 |
| WHO-ICMR Integrated Disease Surveillance Project: Periurban/Urban Slum | 2010 | 15,751 | 18.1 | 23.4 |
| Indian Women's Health Study: Urban | 2011 | 2008 | – | 27.7 |
| Indian Women's Health Study: Rural | 2011 | 2616 | – | 13.5 |
| Jaipur Heart Watch-3-5 | 2012 | 1941 | 28.9 | 25.6 |
| India Heart Watch | 2013 | 6123 | 25.1 | 24.9 |
2.3. Dyslipidemia prevalence, patterns and determinants
The term dyslipidemia is used to denote the presence of any of the following abnormalities, occurring alone or in combination-increased concentration of TC or LDL-Cor serum TG or a decreased concentration of HDL-C.
Although it is difficult to compare observations from different studies due to different cut-offs taken to define dyslipidemia, different sampling procedures and different methodologies used for estimations of lipoproteins, dyslipidemia appears to be widely prevalent in India. The prevalence of hypercholesterolemia (TC ≥ 200 mg/dl) alone, as reported in numerous studies across India, has varied from about 20% to 35% (Table 2). However, what is more important is the pattern of dyslipidemia. When compared with the western populations, Indians and migrant Asian Indians tend to have higher triglycriede levels and lower HDL-C levels.29–37 In contrast, mean serum cholesterol levels among Asian Indians have been shown to be similar to that of the general population in the US and lower than the levels in the UK.38,39 The low HDL-C levels and hypertriglyceridemia are metabolically interlinked and their combination has been termed as “atherogenic dyslipidemia”, which is also characterized by increased levels of small-dense LDL particles with relatively normal total LDL-C, and insulin resistance.40,41 Atherogenic dyslipidemia is particularly common in South Asians and has been shown to have a strong association with type 2 diabetes mellitus, metabolic syndrome and CVD.41,42
Numeorus studies have reported prevalence of different forms of lipid abnormalities among Indians. In a randomized sample of 13,414 adults in the age group 25–64 years living in urban Delhi, hypertriglyceridemia was found in 73% of the obese and 61% of the non-obese individuals.43 In another more recent study from urban New Delhi, hypertriglyceridemia was observed in 42.7% individuals.44 Studies from rural populations have shown lower prevalence of hypertriglyceridemia but the rates are still higher than the comparable data from the Caucasians.29 HDL-C levels are particularly lower in Indians than in white Caucasians, as shown consistently in several comparative studies.29–37 In the afore-mentioned study from urban New Delhi, low HDL-C was found in 37% of the study population.44 In yet another study involving ∼2700 young office executives (mean age 40 years) from New Delhi, low HDL-C was found in 39.5% individuals.45 The prevalence of dyslipidemia, esp. low HDL-C, has been shown to be unusually high among patients undergoing coronary artery bypass surgery. In a cross sectional study on 1000 such consecutive patients, dyslipidemia was observed in 84.5% men and 93.9% women with high LDL-C levels in 23.3% patients, elevated TG in 37.0% and low HDL-C in 72.5% patients.46 Furthermore, it appears that average HDL-C concentrations in all Asian subgroups whether residing in India or elsewhere are lower than Caucasians. For example, according to Tai et al ∼34% of the subjects with isolated low HDL-C levels in the multi-ethnic population in Singapore were Asian Indians.47 Finally, studies have also documented significantly higher prevalence of atherogenic small, dense LDL-Cin Indians as compared to the white Caucasians.48
Not only the prevalence of dyslipidemia is high among Indians, it has been increasing steadily over the past few decades. The serial Jaipur Heart Watch studies have demonstrated progressive increase in the mean levels of TC, LDL-C and non-HDL-C and a decline in the HDL-C levels. The triglyceride levels, however, have not increased and in fact have shown a decline during the same period.49
The relative importance of different lipid components in causation of CVD in different ethnic groups was highlighted in the INTERHEART study (Table 3). Overall, Apo A-1 was a better marker of protection (odds ratio, OR, 0.72, CI 0.66–0.78) than HDL-C (OR 0.97, CI 0.90–1.05) while raised Apo B100/Apo A-1 was the best indicator of risk.50 Importantly, the risks associated with 1 S.D. change in TC, non-HDL-C, Apo B100, TC/HDL-C and Apo B100/Apo A-1 in South Asians were similar to those in other ethnic groups.
Table 3.
Risk of acute myocardial infarction with 1 SD change in various lipid measures in INTERHEART study (Data source: McQueen MJ, et al50).
| South Asians | European | Chinese | Latin American | Overall | |
|---|---|---|---|---|---|
| TC | 1.23 (1.14–1.31) | 1.08 (1.02–1.15) | 1.16 (1.09–1.23) | 1.05 (0.97–1.14) | 1.16 (1.13–1.19) |
| HDL-C | 0.97 (0.90–1.05) | 0.78 (0.73–0.83) | 0.83 (0.78–0.88) | 1.03 (0.94–1.13) | 0.85 (0.83–0.88) |
| Non-HDL-C | 1.23 (1.15–1.31) | 1.17 (1.10–1.24) | 1.24 (1.18–1.31) | 1.04 (0.96–1.28) | 1.21 (1.17–1.24) |
| Apo A-1 | 0.72 (0.66–0.78) | 0.70 (0.66–0.75) | 0.67 (0.63–0.71) | 0.67 (0.61–0.74) | 0.67 (0.65–0.70) |
| Apo B | 1.38 (1.29–1.48) | 1.24 (1.16–1.32) | 1.28 (1.20–1.36) | 1.18 (1.09–1.28) | 1.32 (1.28–1.36) |
| TC:HDL-C | 1.10 (1.04–1.17) | 1.31 (1.21–1.42) | 1.34 (1.24–1.45) | 0.97 (0.90–1.05) | 1.17 (1.13–1.20) |
| Apo B/ApoA-1 | 1.53 (1.42–1.64) | 1.47 (1.37–1.59) | 1.77 (1.63–1.92) | 1.27 (1.17–1.38) | 1.59 (1.52–1.64) |
2.3.1. Reasons for greater prevalence of atherogenic dyslipidemia in Indians
The higher prevalence of atherogenic dyslipidemia in Indians can be attributed to environmental as well as genetic factors-
2.3.1.1. Environmental factors
Changing socioeconomic architecture of the society has resulted in a multitude of life-style abnormalities that appear to be contributing to the development of CV risk factors and CVD in India. The role of environmental factors in the development of CVRFs has been highlighted by the migrant studies comparing Indian subjects living in India with those living in other countries and with other ethnic groups. For example, Bhatnagar et al compared coronary risk factors in a randomly selected group of 247 migrants from the Indian subcontinent of Punjabi origin living in West London and 117 of their siblings living in the Punjab in India.51 The West London cohort had a greater body mass index, systolic blood pressure, serum cholesterol, Apo B, lower HDL-C and higher fasting blood glucose than their siblings in the Punjab (p < 0.01). Insulin sensitivity was lower in men in West London than in their counterparts in India (p < 0.05). Similar results have been reported by other migrant studies also which have shown greater prevalence of truncal obesity, metabolic syndrome and diabetes among Indian subjects than other ethnic groups. More importantly, these studies have also shown that unhealthy lifestyle practices and not ethnicity per se, are the likely cause of increased cardiometabolic risk factors among Indian migrants.52
Common socioeconomic/behavioral/cultural changes that underlie the increasing prevalence of CVRFs and CVD in India include-
-
•
Nutritional Transition: With better purchasing power, South Asians are increasingly consuming diets high in saturated fats, cholesterol, and refined carbohydrates and low in polyunsaturated fatty acids and fiber.53 Importantly, while processed non-traditional ‘fast-foods’ contribute to faulty diets, some of the locally made ‘fast-foods’ sold by street vendors in several developing countries are equally unhealthy. These food items contain high amount of trans-fatty acids due to deep-frying using low cost and widely available partially hydrogenated vegetable oils.53,54
-
•
Urbanization and demographic transition: In South Asia, urbanization is increasing rapidly and has now encompassed nearly 38% of the population and is expected to increase to 50% by 2020. Urbanization exposes people to a number of challenges such as imbalanced diets, physical inactivity, long working hours and other urban stresses, making them vulnerable to CVD.
-
•
Migration: Migration, whether inter-country or rural-to-urban within country, is a risk factor for T2DM and CVD. In an earlier study, it was shown that migrant postmenopausal women settled in urban slums had high prevalence of multiple CVD risk factors.55 These findings were further supported by a later study from the same group that showed a distinct gradient in the prevalence of cardiometabolic risk factors between rural, rural-urban migrants and urban residents.56
-
•
Physical inactivity: The changes of occupations, advent of newer technologies and rapid pace of urban life have increasingly resulted in more sedentary work and less energy expenditure. Other social factors for physical inactivity include priority for academics at the cost of playing time in children, increasing use of television and computers, lack of playfields and open spaces, and security concerns in the outdoors, especially for women. In a study involving different ethnic groups, lower level of physical activity in Asian Indians, Pakistanis and Bangladeshis was seen to be inversely correlated with body-mass index, waist circumference, systolic blood pressure, plasma glucose and insulin levels.57
-
•
Other socio-economic and cultural factors: Socio-cultural and psychological factors and prevalent misconceptions are important factors to be looked at for modifying diet and lifestyle habits in India. In this region, there is a prevalent misconception that an ‘obese child is a healthy child’ and, hence should be fed in excess. Mothers often have traditional belief that feeding excess ghee (clarified butter) and butter to children would be beneficial for their growth and impart them strength. A cross-sectional study of 1800 children aged 9–18 years and their mothers, using qualitative (focus group) and quantitative (semi-structured survey) data, showed such widely prevalent myths, and correlation between obesity and dietary habits of children and their mothers.58
2.3.1.2. Genetic factors
Genetic susceptibility of Asian Indians to development of dyslipidemia and obesity has been shown in some studies. Association of Apo B gene polymorphisms (Xba I and EcoRI) with hyperlipidemia has been reported in migrant Asian Indians.59,60 Similalry, positive correlation has also been reported between Apo E3/E3 phenotype and low levels of HDL-C.61 In another study conducted in north India, APOC3 SstI gene polymorphism (S1S1, S1S2 and S2S2 genotypes) was shown to be associated with plasma triglyceride levels.62 It is notable that the polymorphisms of the APOC3 promoter (−455 T/C and −482C/T) are frequently encountered in young migrant Asian Indians.63
Another study reported that variants of Myostatin gene predispose to obesity, abdominal obesity and low lean body mass in north Indians.64 In yet another study, LMNA 1908T/T and C/T genotypes were found to be the independent risk factors for generalized obesity in non-diabetics.65 And finally, a recent study has shown DOK5 as a susceptibility gene for obesity and T2DM in Indians.66 All these studies are small and inconclusive. Larger studies are required.
3. Evaluation of a patient with dyslipidemia
3.1. Measurement of lipid values
Measurement of lipids is the first step towards management of dyslipidemia. The NECP-ATP III guidelines recommend that a lipid profile should be obtained at least once every 5 years in adults age 20 years or above.67 However, considering the issues of applicability, accuracy and costs involved in India, the present consensus committee recommendsperforming lipid estimations as a routine in adults above 30 years of age. In patients younger than 30 years, the need to perform a lipid estimation should be individualized, based on the presence or absence of concomitant risk factors and evidence of pre-existing CVD. This recommendation of higher age-threshold for initial lipid estimation is commensurate with that of the European Society of Cardiology/European Atherosclerosis Society (recommend screening in adult men ≥40 years of age, and in women ≥50 years of age).68 After initial lipid profile measurement, the timing and frequency of subsequent testing should be determined by the abnormalities detected in the initial assessment and can vary from once every five years to as frequent as every 6–12 weeks.
A typical lipid profile consists of TG, TC, HDL-C and LDL-C. Most of the laboratories measure TC, TG and HDL-C directly using enzymatic assays but LDL-Cis often derived indirectly from the Friedewald equation (LDL-C = TC-HDL-C – TG/5). As feeding acutely affects serum TG levels, a fasting blood sample (after 9–12 h fasting) is required to estimate LDL-C accurately. This presents a practical challenge as many-a-times circumstances do not allow fasting sampling. In such settings, using non-HDL-C instead of LDL-Cis a good alternative. Non-HDL-C is calculated simply by subtracting HDL-C from TC and because food does not affect TC or HDL-C acutely, non-HDL-C remains accurate irrespective of fasting status. As discussed subsequently, non-HDL-C has several additional advantages over LDL-C as a CV risk marker. It includes all the atherogenic lipid molecules present within the blood such as VLDL, intermediate density lipoprotein (IDL), chylomicrons, chylomicron remnants and lipoprotein (a) [Lp(a)] and therefore provides a more accurate estimate of CV risk than LDL-C alone, as shown in numerous epidemiological and clinical studies.69–73 This is particularly true for patients who are already on statin therapy74 or those with elevated levels of VLDL-C such as patients with obesity, metabolic syndrome and diabetes.
Some prospective studies have reported that non-fasting serum triglyceride levels may be a useful predictor of CV events.75 However, issues such as standardizing sampling conditions and reference values are yet to be clarified.
Routine estimation of Apo B and Apo A-1 levels is not recommended at present because of several logistic issues. These assays are expensive, not readily available, and not adequately standardized. Moreover, non-HDL-C, by incorporating all Apo B containing lipid particles in blood, can provide a similar, albeit slightly less accurate, information in a more cost-effective and simpler manner.
Summary
The present consensus committee recommends that lipid measurement should be performed in all adults beginning at the age of 30 years. As all the currently existing guidelines are based on LDL-C levels, it is advisable to obtain complete fasting lipid profile. However, when fasting sample cannot be obtained, measurement of TC, HDL-C and non-HDL-C from a non-fasting sample should be sufficient and if required, a more detailed lipid profile can then be obtained in selected individuals. Routine measurement of Apo B and Apo A is not recommended at present.
After the initial screening, the nature, frequency and timing of subsequent testing should be determined based on the findings on the initial assessment.
3.2. CV risk stratification
3.2.1. Assessment of the absolute CV risk: role of risk assessment algorithms
Traditionally, assessment of the CV risk is performed by determining the presence and severity of the major CV risk factors and subsequently using risk algorithms and prediction charts to determine the overall CV risk in any given individual. A number of risk assessment tools are available for this purpose such as Framingham risk score (FRS),76,77 Prospective Cardiovascular Munster Score (PROCAM),78 World Health Organization/International Society of Hypertension (WHO/ISH) CVD risk prediction charts,79 Joint British Societies for CVD risk chart,80 Systemic Coronary Risk Evaluation (SCORE),81 QRISK,82–84 Reynolds score,85,86 New Zealand score,87 etc. Among them, FRS is the most commonly used risk assessment algorithm in clinical practice.
3.2.1.1. FRS: the most commonly used CV risk assessment algorithm
The FRS is based on the data derived from the Framingham Heart Study which was initiated in 1948 in the town of Framingham in Massachusetts, USA. The initial FRS, which was developed in 1998, predicted only coronary heart disease (CHD) risk but subsequently, a new general risk prediction tool was developed in 2008 to predict the overall CVD risk.76,77 The FRS is based on age, gender, smoking status, diabetes, systolic blood pressure (SBP), total or LDL-C and HDL-C. Based on these parameters, an individual's 10-year absolute risk of adverse CHD or CVD events is estimated. Ten-year risk <10% signifies low risk, 10–20% intermediate risk and >20% indicates high risk.
While FRS has been validated in a number of populations and has been the cornerstone of CV risk assessment over the years, it has several limitations.88 First, it was developed at a time when the CVD incidence was at its peak in the US. As a result, FRS tends to overestimate CV risk in populations in which the CVD incidence is much lower, as in the Europeans. Second, FRS does not take in to account many of the non-conventional risk factors such as obesity, physical activity, family history of premature CAD, etc which are being increasingly recognized as important contributors to the development of atherosclerotic vascular disease. Finally, FRS relies heavily on age as a determinant of the CV risk. Consequently, in a young individual, the estimated 10-year CV risk according to FRS is invariably low, despite the presence of multiple CV risk factors. This has important implications for Indians in whom CVD tends to occur at a younger age than the western populations. As a result, FRS is likely to underestimate CV risk in Indians, as has been amply highlighted in some of the studies.89,90
3.2.1.2. Alternate CV risk scores
A number of other scoring systems, as mentioned above, have been developed to overcome the limitations of FRS but none of them has been validated in Indians.
In 2007, the World Health Organization (WHO), in collaboration with the International Society for Hypertension (ISH), published a series of risk prediction charts, each dedicated to a different geographic region, including South-East Asia79 (Fig. 1). These risk assessment charts have been derived with the help of statistical models using extrapolated data about the prevalence of various CV risk factors in different geographical regions. Though these charts have not been systematically validated in prospective studies, this scoring system is among the very few that specifically refer to the South Asian populations.
Fig. 1.
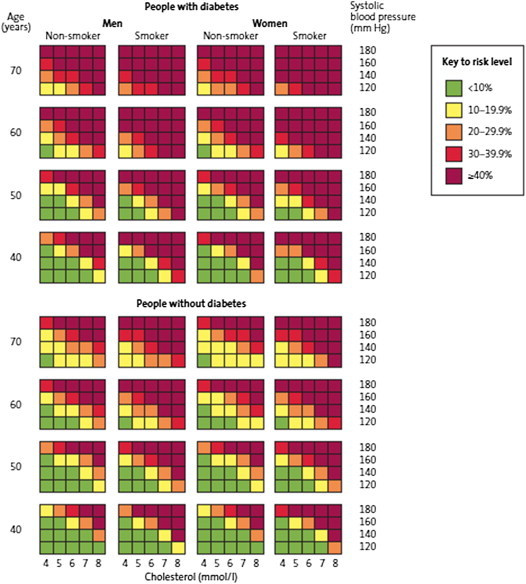
World Health Organization cardiovascular risk prediction charts applicable for Indians (South-East Asia Region D). These charts predict 10-year risk of a fatal or non-fatal cardiovascular event.
More recently, two new risk scoring systems have become available. The American College of Cardiology/American Heart Association (ACC/AHA) task force on practice guidelines in 2013 developed a new risk assessment approach using pooled data from multiple cohorts, including the Framingham original and off-springs cohorts.91 However, this score has also not been validated in Indians and its accuracy, even for Americans, has become a subject of controversy.92,93 At the same time, the 3rd iteration of the Joint British Societies (JBS) have also come out with their own risk assessment model.94 Although this risk score is applicable to the populations in the UK, it includes data on non-resident Indians also and may therefore be able to provide relatively more accurate risk estimates for resident Indians than other risk algorithms.339
A yet another approach, as has been suggested by several investigators, is to recalibrate the FRS by multiplying the calculated FRS by a correction factor, specifically derived for a given population. For rural Indians, the suggested correction factor is 1.0 for men and 0.8 for women, whereas the same for urban Indians is 1.81 and 1.54 for men and women respectively.
Summary
Estimation of the future CV risk is an essential prerequisite for defining optimum lipid-lowering strategy (pharmacological and non-pharmacological) in any patient with dyslipidemia. Unfortunately, none of the currently available risk scoring algorithms have been specifically validated in Indians. However, of all the available options, the WHO/ISH risk prediction charts and the JBS3 risk prediction model may be more relevant to the Indians (Fig. 1).
3.2.2. Role of sub-clinical atherosclerosis imaging
The conventional risk assessment algorithms have yet another important limitation thatwhile they work well at the population level, their accuracy at the individual level is limited. Thus, it is not uncommon to find individuals with no apparent CV risk factors to develop CVD while many of those with multiple CV risk factors remain free from CVD for years. Accordingly, one of the major challenges to CVD prevention is our inability to accurately identify the individuals who are actually going to develop the disease. A potential solution to this problem is to look for the evidence of the disease itself, when it is still in its subclinical stage, rather than the risk factors. If a person has evidence of sub-clinical atherosclerosis, he or she has high probability of developing clinically manifest CVD later on, irrespective of the presence or absence of the CV risk factors and will therefore deserve aggressive risk factor modification. Several tools for detection of subclinical atherosclerosis are now available such as carotid plaque assessment, carotid intima-media thickness (CIMT), brachial artery flow-mediated dilatation, coronary calcium score (CCS), ankle-brachial index, pulse wave velocity, etc. Among them, carotid imaging and CCS appear to be the most promising and have an extensive evidence-base to support their use in clinical practice.
Carotid ultrasound imaging allows detection and characterization of carotid plaques and measurement of CIMT. CIMT refers to the combined thickness of intima and media of the carotid arteries, usually measured at the distal common carotid artery. The basic premise underlying carotid vascular imaging is that atherosclerosis is a generalized process, which affects all vascular beds sooner or later. Hence, the evidence of atherosclerosis in carotid arteries is likely to indicate high risk of coronary events also. This hypothesis has been adequately validated in autopsy studies as well as a number of large clinical trials.95
CCS is a computed tomography test that detects and quantifies the amount of calcium in the coronary arteries. In coronary arteries, calcium is deposited only in the atherosclerotic plaques and therefore the presence of coronary calcium serves as an indirect evidence of ongoing atherosclerotic process in the coronary arteries. The total CCS is directly related to the total atherosclerotic burden in the coronaries and has an excellent correlation with the risk of adverse CV events. However, the calcium in the coronaries is not site-specific, i.e. the site of maximum calcium deposition may not necessarily be the site of the most significant luminal narrowing. This occurs as a result of positive remodeling in which the coronary arterial wall undergoes expansion secondary to inflammation produced by the atherosclerotic process. The CCS estimation involves radiation exposure but does not require the use of iodinated contrast medium.96
Numerous clinical trials involving several thousand patients have shown that both carotid atherosclerosis and CCS have incremental value above conventional risk factors and the risk assessment algorithms such as FRS in predicting future risk of CV events.95–97 Using these tools permit estimation of the vascular age of the patients which provides the clinician and the patient with a simple, easily understandable assessment of the overall vascular health of the individual. The main incremental role of these tools is in patients deemed to be at intermediate risk. The treatment can be intensified in those who are shown to have the evidence of ongoing atherosclerosis whereas a less aggressive approach can be adopted in those having no evidence of atherosclerosis. An added advantage of these imaging techniques is that they may also help in improving patient compliance to the treatment. The patients, when shown the evidence of ongoing atherosclerosis, are more likely to adopt healthy life-style measures and are more likely to follow the pharmacological advices.9,98–102
3.2.2.1. Experience with subclinical atherosclerosis assessment in Indians
Several cross-sectional studies have been performed in resident Indians to assess the utility of CIMT and CCS in them. CIMT has been shown to correlate with the presence and extent of existing CAD as well as the presence of conventional CV risk factors.103–111 However, no prospective study demonstrating utility of CIMT is available in Indian subjects. In addition, the normal reference values of CIMT in Indian subjects are also not available at present. The data with CCS is even more limited with hardly few studies published so far.112,113 These limitations preclude routine clinical use of CIMT or CCS for CV risk stratification in Indians.
Summary
The assessment of subclinical atherosclerosis is an attractive approach to refine CV risk estimate in patients considered to be at ‘intermediate risk’ on the basis of the conventional risk assessment methods. However, their routine use cannot be recommended at present because of the lack of outcome data with these techniques and also because the normal reference values for these various atherosclerosis markers are not yet available for Indians. Nevertheless, the physicians or cardiologists with adequate experience with these techniques may continue to use them to more accurately define the CV risk in appropriate patient subgroups.
3.2.3. Biochemical markers for risk assessment
Atherosclerosis is now well-recognized to be an inflammatory disease. Consequently, a number of markers of inflammation have been shown to be associated with the extent of atherosclerosis and the risk of adverse CV events. Among them, high-sensitive c-reactive protein (hsCRP) has been the most extensively studied marker.114–118 Several large-scale prospective studies have shown that elevated hsCRP levels strongly predict the risk of CV events and may be a target for initiation of statin therapy, irrespective of the lipid levels.118 Based on the available evidence, the AHA recommends that in men ≥50 years or women ≥60 years with LDL-C less than 130 mg/dl, measurement of hsCRP can be useful in the selection of patients for statin therapy in absence of any other inflammatory condition or contraindications to statins.97 However, a major drawback with hsCRP is that it is a marker of inflammation and not atherosclerosis per se. Therefore, any significant inflammatory condition can lead to the elevation of hsCRP levels and hence adequate care needs to be taken to avoid using hsCRP as a marker of CV risk in presence of any underlying inflammatory disease.
At present, there is only limited data available to assess the role of hsCRP in CV risk assessment in Indians. While several cross-sectional studies have demonstrated relationship between hsCRP and various conventional and non-conventional CV risk factors,119–123 no prospective study is available as yet to show the prognostic utility of hsCRP measurement in Indians.
Lp(a) is a genetically modified form of LDL-C particle which appears to confer higher risk of CVD owing to its ability to bind to oxidized lipoproteins. More importantly, it accentuates risk imparted by several other CV risk factors such as diabetes, low HDL-C and high LDL-C.124 A number of studies have reported an association between Lp (a) levels and incident CVD.125–127 However, prospective studies have failed to conclusively establish a causative link between Lp (a) and CVD.128–130 This, coupled with the lack of standardized tests for accurate measurement of Lp (a) and limited therapeutic options for lowering it, have prevented widespread use of Lp (a) measurement in clinical practice.67 Nevertheless, Lp (a) may be an important risk marker in Indian subjects as Indians are known to have higher levels of Lp (a) with as many as 30–40% Indians having levels >20 mg/dl, which is generally considered as the threshold for high risk for CAD.131
Summary
Routine measurement of hsCRP and Lp(a) is not recommended at present. The use of these markers to further refine CV risk in intermediate risk patients is optional. Lp(a) estimation can be considered in patients with family history of premature CAD.
3.2.4. Other markers for CV risk assessment
Urinary albumin excretion has been suggested to be a useful tool for CV risk prediction as microalbuminuria is considered to be a manifestation of vascular damage. The presence of microalbuminuria not only indicates already existing vascular damage but may also contribute to further vascular injury through multiple mechanisms. However, the value of microalbuminuria as a CV risk marker is restricted largely to the patients with diabetes or hypertension.97
3.2.5. Suggested approach to CV risk assessment in Indians (Fig. 2, Box 1).
Fig. 2.
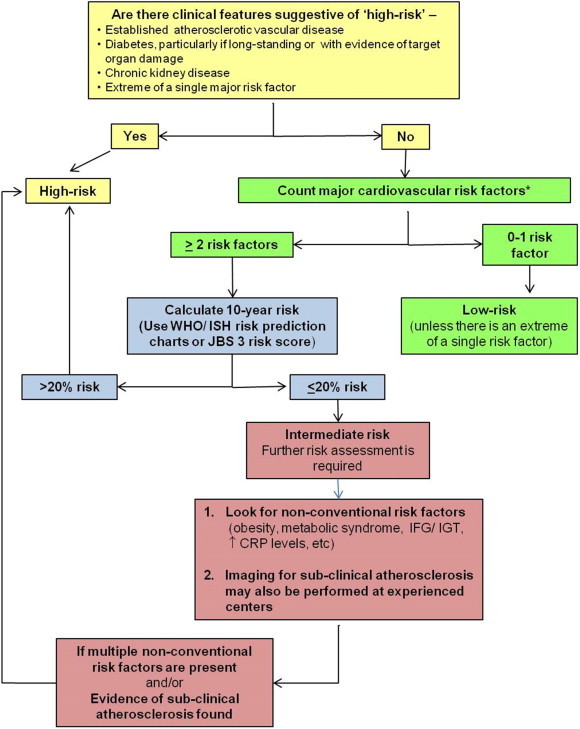
Suggested cardiovascular risk assessment approach in Indians with dyslipidemia. * The major risk factors include-i) Cigarette smoking (any cigarette smoking during the last one month), ii) Hypertension (blood pressure ≥140/90 mmHg or on antihypertensive medication), iii) Low HDL-C cholesterol (<40 mg/dl), iv) Family history of premature CAD (CAD in male first-degree relative <55 years or in female first-degree relative <65 years), v) Age ≥45 years in men and ≥55 years in women). If the HDL-C cholesterol level is > 60 mg/dl, it is considered a negative risk factor CAD-coronary artery disease; CRP- c-reactive protein, HDL-C- high-density lipoprotein cholesterol; IFG-impaired fasting glucose; IGT-impaired glucose tolerance; ISH- International Society of Hypertension; JBS- Joint British Societies; WHO- World Health Organization.
Box 1. Cardiovascular risk categories as applicable to Indians.
High risk
-
•
Patients with evidence of atherosclerotic vascular disease (CAD, carotid artery disease, peripheral arterial disease, abdominal aortic aneurysms, atherosclerotic renal artery stenosis, etc)
-
•
Long-standing diabetes mellitus, esp. with other CV risk factors or with target organ damage
-
•
Chronic kidney disease
-
•
Extreme of a single major risk factor (e.g. strong family history of premature CAD, chronic heavy smoking, markedly deranged lipid profile, etc)
-
•
Any combination of CV risk factors with estimated 10-year risk >20%*
-
•
Estimated 10-year risk <20%* but with evidence of subclinical atherosclerosis or with multiple non-conventional CV risk factors (obesity, metabolic syndrome, impaired fasting glucose, impaired glucose tolerance, psychosocial stress, microalbuminuria, etc.)
Moderately highrisk (10-year risk of CV events 10–20%)
-
•
Any combination of CV risk factors with estimated 10-year risk 10-20%*
-
•
Recent onset diabetes mellitus with no other major CV risk factor and no evidence of target organ damage
Moderate or intermediaterisk (2 or more CV risk factors with 10-year risk of CV events <10%)
-
•
Patients with >1 major CV risk factor# with estimated 10-year risk <10%* in absence of any of the above markers of higher risk
Low-risk (<2 CV risk factors with 10-year risk of CV events <10%)
-
•
Patients with 0–1 major CV risk factor# in absence of any of the above markers of higher risk
* Risk estimation based on World Health Association/International Society of Hypertension risk factor charts or Joint British Societies 3 risk scoring system (see text for details).
# The major risk factors include-i) Cigarette smoking (any cigarette smoking during the last one month), ii) Hypertension (blood pressure ≥140/90 mmHg or on antihypertensive medication), iii) Low HDL-C cholesterol (<40 mg/dl), iv) Family history of premature CAD (CAD in male first-degree relative <55 years or in female first-degree relative <65 years), v) Age ≥45 years in men and ≥55 years in women). If the HDL-C cholesterol level is > 60 mg/dl, it is considered a negative risk factor.
CAD – coronary artery disease; CV – cardiovascular; HDL-C – high-density lipoprotein.
Fig. 1 presents a practical approach to the CV risk assessment in Indian subjects based on the available evidence and these recommendations are summarized in Box 1.
When a patient presents with one or more clinical features of already existing atherosclerotic vascular disease, he or she is considered to be at “high-risk” and no formal risk scoring is required. Long-standing diabetes, particularly with other CV risk factors or with evidence of target organ damage and presence of chronic kidney disease also signify high CV risk and should be treated accordingly. Conversely, if there is no evidence of pre-existing atherosclerotic vascular disease and the patient has no or only one major CV risk factor, the risk of adverse CV events is generally low. An exception to this is when there is an extreme of the single risk factor such as strong family history of premature CAD, chronic heavy smoking, markedly deranged lipid values, etc. In all the remaining patients, formal risk scoring needs to be performed. If the estimated 10-year CV risk is >20%, it signifies ‘high CV risk’, 10–20% ‘moderately high risk’ and <10% risk indicates ‘moderate or intermediate risk’. Since majority of the asymptomatic patients encountered in the regular clinical practice fall in the ‘intermediate risk’ category, further refinement of the risk estimate is required in them to permit better matching of the intensity of the therapeutic approach with the true CV risk. In such patients, it is advisable to look for the presence of one or more of the non-conventional risk factors such as-
-
•
Obesity
-
•
Sedentary lifestyle
-
•
Metabolic syndrome
-
•
Impaired fasting glucose or impaired glucose tolerance
-
•
Raised levels of C-reactive protein, homocysteine, or Lp(a)
-
•
Microalbuminuria
-
•
Psychosocial stress, etc.
If a combination of the above risk factors is present in a patient otherwise deemed to be at intermediate risk, it will signify higher CV risk warranting more aggressive risk reduction strategy. However, if none of the above risk factors is present and the estimated 10-year risk is <10%, the patient can be safely treated as ‘low-risk’.
When available, the imaging for subclinical atherosclerosis can also be performed in patients at ‘intermediate-risk’ to provide direct evidence of atherosclerosis and to further refine the CV risk.
4. Management of dyslipidemia
4.1. Lipid goals and overall approach to treatment
(Please also refer to Section 5 for discussion on the implications of recently published ACC/AHA guidelines on management of dyslipidemia).
4.1.1. Primary prevention
Fig. 3 presents the overall approach to the management of dyslipidemia.67,68 Given the extensive database demonstrating association between LDL-C and CV risk and the powerful beneficial effects of LDL-C reduction, LDL-C remains the primary target for lipid lowering therapy (unless serum triglyceride levels are very high e.g. >500 mg/dl). However, as discussed above, when accurate LDL-C values are not available (for example in case of non-fasting sampling), non-HDL-C is an acceptable primary target of therapy. Non-HDL-C is also a more accurate predictor of CV risk than LDL-C in disease statescharacterized by elevated triglyceride levels such as metabolic syndrome and diabetes-the conditions commonly seen among Indians.71,132 As the initial treatment approach for lowering non-HDL-C is same as that for lowering LDL-C, using non-HDL-C as the primary target for therapy does not require any deviation from the standard clinical practice. At the same time, as LDL-C is lowered with the help of statin therapy, non-HDL-C becomes an increasingly superior predictor of residual CV risk than the on-treatment LDL-C levels.74
Fig. 3.
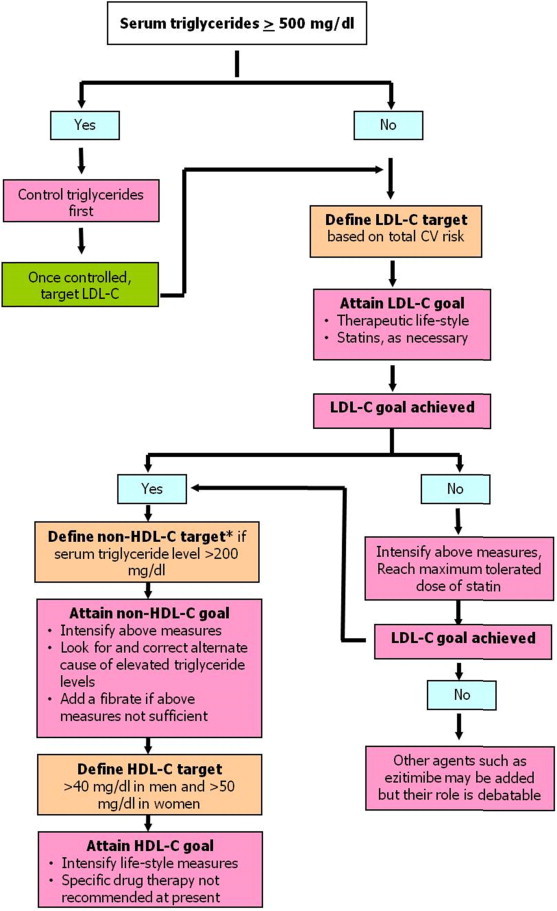
Overall approach to lipid-lowering therapy for prevention of cardiovascular disease. (HDL-C- high-density lipoprotein cholesterol, LDL-C- low-density lipoprotein cholesterol). * Please note, non-HDL-C is an acceptable primary target of lipid lowering therapy if LDL-C values are not available or not reliable.
In any patient requiring lipid lowering treatment for primary prevention of CVD, the management approach is tailored according to the estimated global CV risk, based on which the goals for lipid lowering and means of achieving it are decided. The appropriate LDL-C goals and cut-off levels for initiating pharmacological therapy are listed in Table 4. As there are no prospective studies available to determine the optimal LDL-C levels and the treatment thresholds in Indians, these recommendations are based on the available western guidelines only.67,68,133 The recommended non-HDL-C goal for each category of patients is 30 mg/dl higher than the corresponding LDL-C goals. The rationale behind this recommendation is that non-HDL-C primarily reflects the sum total of LDL-C and VLDL-C and 30 mg/dl cholesterol in VLDL-C would correspond to serum triglyceride level of 150 mg/dl, which is the acceptable upper limit of normal.
Table 4.
Cardiovascular risk categories, LDL-C and non-HDL-Ctargets and initial treatment strategy.
| Purpose | Risk Category | LDL-C target | Non-HDL-C target | Threshold for initiating pharmacological therapya,b |
|---|---|---|---|---|
| Primary prevention | Low risk (0–1 CV risk factor and 10-year risk of hard CV events <10%) | <130 mg/dl | <160 mg/dl | Drug therapy required if LDL-C continues to remain elevated (>130 mg/dl) despite adequate TLC for 3 months |
| Moderate risk (2 or more CV risk factors with 10-year risk of hard CV events <10%) | <100 mg/dl | <130 mg/dl | Drug therapy required if LDL-C continues to remain elevated (>100 mg/dl) despite adequate TLC for 3 months | |
| Moderately high risk (2 or more CV risk factors with 10-year risk of hard CV events10-20%) | <100 mg/dl with at least 30–50% reduction from the baseline | <130 mg/dl | All patients should be on a statin | |
| High risk (10-year risk of hard CV events ≥20% or long-standing diabetes or other high-risk categories as defined in section 3.2) | <70 mg/dl with at least 50% reduction from the baseline | <100 mg/dl | All patients should be on a statin | |
| Secondary preventionc | Patients with established atherosclerotic vascular disease | <70 mg/dl with at least 50% reduction from the baseline | <100 mg/dl | All patients should be on a statin |
Whenever initiated, the aim of the statin therapy should be to lower LDL-C by at least 50% in those at high CV risk or those with established atherosclerotic vascular diseaseand by at least 30–50% in all the other subjects.
The treatment should begin with a statin dose expected to lower LDL-C by the desired margin. The dose can be up titrated if the initial dose fails to achieve the desired LDL-C reduction.
Does not include patients presenting with an acute CV event.
Therapeutic life style change (TLC, discussed in subsequent sections) is the initial step in the management of dyslipidemia and is indicated in all individuals, irrespective of their LDL-C levels and even when LDL-C levels are within the desired range. TLC forms an essential and important component of lipid lowering therapy but requires a great deal of motivation from the patient and his family. Therefore, it is important that TLC is initiated by the clinician, explaining and emphasizing its value in a detailed discussion with the patient and his/her family. Nutritionist's involvement often helps.
When the patient is unable to achieve desired changes in LDL-C levels with TLC alone or when LDL-C levels are too high at the time of initial presentation itself, pharmacological therapy needs to be instituted. Pharmacotherapy is also recommended from the beginning itself in individuals perceived to be at high risk of CV events (Table 4). Among all the currently available lipid lowering agents, statins have the most profound effect on LDL-C and also have numerous pleiotopic effects that contribute to prevention of CVD. A large number of studies in a wide range of patient populations have established unparalleled efficacy and safety of statins for CVD prevention. For these reasons, statins are the first-line agent for LDL-C lowering. The treatment should begin with a statin dose expected to lower LDL-C by the desired margin and the dose should be up-titrated if the initial dose fails to achieve the desired LDL-C reduction. If LDL-C goals cannot be achieved even with the maximum tolerated dose of statins, other agents such as fibrates, ezitimibe, etcmay be considered. However, it must be remembered that large-scale studies have failed to show incremental CV risk reduction with these agents.133
Once LDL-C goal is achieved with appropriate non-pharmacological and pharmacological measures, the next target for therapy is non-HDL-C, which primarily aims at correcting serum triglyceride levels. Weight reduction is one of the most effective modalities for lowering serum triglyceride levels and the patient should be encouraged to increase physical activity and adopt healthy diet. Smoking cessation is also very helpful and should be encouraged. At the same time, one should also diligently look for and correct any secondary causes of hypertriglyceridemia if present such as uncontrolled diabetes, nephrotic syndrome, chronic renal failure, certain drugs (e.g. corticosteroids, protease inhibitors for HIV, beta blockers, estrogens) etc.67,68
If the serum triglyceride levels remain high in spite of adequate lie-style measures or if the patient is not able to follow life-style measures for some reason, pharmacological measures may be needed. Statin dose can be increased further and/or a fibrate can be added to the regimen. It should be noted that addition of a fibrate to a statin has been shown to be of benefit in only select subgroup of patients (i.e. those with atherogenic dyslipidemia)134,135 and therefore routine co-prescription of a statin and a fibrate is neither justifiable nor recommended.
Once LDL-C and non-HDL-C goals are achieved, the next step is to focus on HDL-C. In men, HDL-C should be above 40 mg/dl and in women>50 mg/dl. In view of the disappointing results of the recent trials evaluating HDL-C raising therapies, no drug can be recommended at present for correction of low HDL-C levels and the management depends solely on TLC. Weight reduction and smoking cessation are the two most effective non-pharmacological measures to raise HDL-C levels and should be aggressively pursued.67,68
4.1.2. Secondary prevention
Patients with established atherosclerotic vascular disease are obviously at high risk of having another vascular event and therefore deserve aggressive lipid lowering therapy. The recommended LDL-C goal in such patients is <70 mg/dl with at least 50% reduction from the baseline value (Table 4). Given the profound beneficial effects of statins in patients with established vascular disease, all patients requiring secondary prevention of CVD should be on a statin, irrespective of the baseline LDL-C levels, while aggressive TLC is continued simultaneously.
4.2. Life-style modifications
Lifestyle modifications including diet control, physical exercise, tobacco cessation, moderate alcohol intake and stress management are essential and amongst the most cost-effective methods to control dyslipidemia and for overall primary and secondary prevention of heart disease.
4.2.1. Diet
Dietary modification is a powerful non-pharmacological strategy for improving blood lipids. The goals of nutrition management are to maintain or improve quality of life, nutritional and physiological health, and to prevent and treat dyslipidemia and associated co-morbid conditions. In general, nutrition advice for people with dyslipidemia is the same as that for all Asian Indians. For individuals with dyslipidemia, attention to food portions and weight management combined with physical activity may help improve the condition. Nutrition in all forms of dyslipidemia management should be individualized.
4.2.1.1. Energy
Energy intake should be limited to the amount of energy needed to maintain (or obtain) a healthy weight, i.e. a BMI ≤23 kg/m2 (Table 5). It should be enough to support energy needs, yet allowing for a 5%–10% body-weight loss, if indicated. Energy requirement for any individual is calculated by multiplying the activity factor by ideal body weight of that individual (Table 6). For example, an Asian Indian man with medium built frame, 165 cm tall, should ideally weigh 62 kg and would require 1850 Kcal to maintain healthy weight if he is sedentary. Ideal body weight should be aimed to maintain a body mass index (BMI) between 18 and 23 kg/m2.
Table 5.
Calculation of Ideal Body weight.
| Build | Women | Men |
|---|---|---|
| Medium | 100 lbs (45.5 kg) for first 5 ft. (152 cm) height, plus 5 lb (2.3 kg) for each additional inch | 106 lbs (48 kg) for first 5 ft. (152 cm) of height, plus 6 lbs (2.7 kg) for additional inch. |
| Small | Subtract 10% | Subtract 10% |
| Large | Add 10% | Add 10% |
A Guide for Professionals: The Effective Application of ‘‘Exchange Lists for Meal Planning.’’ New York: American Diabetes Association; Chicago: American Dietetic Association, 1977.
A quick and easy guide for use in the clinical setting is the Broca Index. This measurement relates weight in kilograms to height in centimeters, but makes no allowance for sex- The Broca Index: Height (cm) - 100 = Ideal weight (kg), For example: A patient whose height is 162.5 cm tall. Ideal weight = 162.5–100 = 62.5 kg Brodsky has modified the Broca Index to allow for gender differences, based on the premise that females have a higher ratio of fat tissue compared to total body weight. The Modified Broca Index: Males: Height (cm) - 100 = Ideal weight (kg) Females: Height (cm) – 105 = ideal weight (Kg).
Source: Adapted from Committees of the American Diabetes Association Inc. and American Dietetics Association, 1977.
Table 6.
Calculation of energy requirement.
| Activity level | Energy requirement (Kcal/Kg IBW/day) |
||
|---|---|---|---|
| Obese | Normal | Underweight | |
| Sedentary | 20–25 | 30 | 35 |
| Moderate | 30 | 35 | 40 |
| Heavy | 35 | 40 | 45–50 |
Williams SR: Nutrition and Diet Therapy, 6th ed. St. Louis: Times Mirror/Mosby, 1989.
Source: Williams, 1989
4.2.1.2. Carbohydrates and fiber
Recommendations
-
1.
The daily carbohydrate intake should be approximately 50–60% of the total calorie intake. For example, in an 1800 and 2000 calorie diet, the carbohydrate intake for a sedentary to moderately active individual should be 225–270 g/day and 250–300 g/day, respectively.
-
2.
The primary source of complex carbohydrates in the diet should be cereals (whole wheat, brown rice etc.), millets [pearl millet (bajra), finger millet (ragi), great millet (Jowar)], pulses [red gram (tur dal), green gram (sabutmoong) etc.] and legumes [soya, horse gram (kulthi)]. Complex carbohydrates should be preferred over refined carbohydrates and its products, e.g. whole grain bread over white (maida) bread.
-
3.
While deciding for carbohydrates, the glycemic index (GI) of foods should also be considered. Emerging research, globally and from India, has shown the relevance of GI in the Indian context.136
-
4.
GI is a measure of the effects of carbohydrates on blood sugar levels. Carbohydrates that break down quickly during digestion and release glucose rapidly into the bloodstream have a high GI, whereas carbohydrates that break down more slowly, releasing glucose more gradually into the bloodstream, have a low GI. Foods having GI of 55 or less are considered to have low GI; between 56 and 69 as medium GI; and 70 or above as high GI. GI of some commonly consumed foods has been provided in Table 7. Low GI foods such as oats (jai), unpolished rice, parboiled rice, whole pulses, beans (fali) and legumes (sabutanaz), some whole fruits (like guava, apple etc.) should be preferred. In contrast, high GI foods [refined flour, root vegetables such as yam (sooran/shakarkand), potato, tapioca (a type of shakarkand), colocasia (arbi) etc] should be consumed in moderation.
-
5.
Along with GI, glycemic load (GL) of the food should also be considered, which depends on the amount of carbohydrate consumed. The glycemic load of a food is calculated by multiplying the GI and the amount of carbohydrate (in g) provided by a food and dividing the total by 100. For one serving of a food, a GL lower than 10 is considered low; between 11 and 19 is considered medium, and 20 or more is considered high.
-
6.
The total dietary fiber in daily diet should be 25–40 g/day [e.g. 100 g of apple (1 small apple) gives 1.0 g of fiber; 100 g of whole wheat flour gives 1.9 g of fiber]. Whole grains, cereals, pulses, vegetables and fruits contain high dietary fiber. Diets higher in soluble fiber lead to TC reductions of 5%–19% and LDL-C reductions of 8%–24%. Foods high in soluble fiber include oat bran, oatmeal, beans, peas, rice bran, barley, citrus fruits, strawberries, and apple pulp.
-
7.
A minimum of four to five servings per day of fruits and vegetables are recommended i.e. approximately 400–500 g/day including 3 vegetable and 2 fruit portions. [e.g. 100 g (onekatori) raw vegetables e.g. cauliflower, brinjal etc. = 20–30 Kcal, 100 g fruit e.g. one apple = 59 Kcal]. Fruits should be eaten whole preferably with the skin whenever feasible instead of fruit juices.
-
8.
Simple sugars like crystalline sugar, sugarcane juice, sweetened carbonated beverages, fruit juices and sugar syrups should be avoided.
Table 7.
The average glycemic index of common foods derived from multiple studies by different laboratories.
| High- carbohydrate foods | GI | Breakfast cereals | GI | Fruit and fruit products | GI | Vegetables | GI | Dairy products and alternatives | GI | Legumes | GI | Snack products | GI | Sugars | GI |
|---|---|---|---|---|---|---|---|---|---|---|---|---|---|---|---|
| White wheat bread* | 75 ± 2 | Cornflakes | 81 ± 6 | Apple,raw† | 36 ± 2 | Potato, boiled | 78 ± 4 | Milk, full fat | 39 ± 3 | Chickpeas | 28 ± 9 | Chocolates | 40 ± 3 | Fructose | 15 ± 4 |
| Whole wheat/whole meal bread | 74 ± 2 | Wheat flake biscuit | 69 ± 2 | Orange, raw† | 43 ± 3 | Potato instant mash | 87 ± 3 | Milk, skim | 37 ± 4 | Kidney beans | 24 ± 4 | Popcorn | 65 ± 5 | Sucrose | 65 ± 4 |
| Unleavened wheat bread | 70 ± 5 | Porridge, rolled oats | 55 ± 2 | Banana, raw† | 51 ± 3 | Potato, French fries | 63 ± 5 | Ice cream | 51 ± 3 | Lentils | 32 ± 5 | Potato crisps | 56 ± 3 | Glucose | 103 ± 3 |
| Wheat roti | 62 ± 3 | Instant oat porridge | 79 ± 3 | Pineapple, raw | 59 ± 8 | Carrots, boiled | 39 ± 4 | Yogurt, fruit | 41 ± 2 | Soya beans | 16 ± 1 | Soft drink/soda | 59 ± 3 | Honey | 61 ± 3 |
| Chapatti | 52 ± 4 | Rice porridge/congee | 78 ± 9 | Mango, raw | 51 ± 5 | Sweet potato, boiled | 63 ± 6 | Soy milk | 34 ± 4 | Rice crackers/crisps | 87 ± 2 | ||||
| Corn tortilla | 46 ± 4 | Millet porridge | 67 ± 5 | Watermelon†, raw | 76 ± 4 | Pumpkin, boiled | 64 ± 7 | Rice milk | 86 ± 7 | ||||||
| White rice, boiled* | 73 ± 4 | Muesli | 57 ± 2 | Dates, raw | 42 ± 4 | Plantain/green banana | 55 ± 6 | ||||||||
| Brown rice, boiled | 68 ± 4 | Peaches, canned† | 43 ± 5 | Taro, boiled | 53 ± 2 | ||||||||||
| Barley | 28 ± 2 | Strawberry jam/jelly | 49 ± 3 | Vegetable soup | 48 ± 5 | ||||||||||
| Sweet corn | 52 ± 5 | Apple juice | 41 ± 2 | ||||||||||||
| Spaghetti, white | 49 ± 2 | Orange juice | 50 ± 2 | ||||||||||||
| Spaghetti, whole meal | 48 ± 5 | ||||||||||||||
| Rice noodles† | 53 ± 7 |
∗ Low glycemic index varieties were also identified. † Average of all available data.
4.2.1.3. Fats
A high dietary intake of fat has been reported in Asian Indians.137,138 In a report from the National Institute of Nutrition, fat consumption in India was documented to range from 13 to 59 g/d in different regions and states, with rural populations deriving smaller proportion of energy (17%) from dietary fat as compared to urban residents (22%).139
Dietary fat includes both unsaturated and saturated fatty acids. The substitution of unsaturated fatty acids [including both polyunsaturated and monounsaturated fatty acids (PUFA and MUFA respectively)] for saturated fatty acids leads to decreased LDL-C levels with slightly greater LDL-C reductions observed with PUFA than with MUFA.67,140 While high intake of PUFA may reduce HDL-C and triglyceride levels, the substitution of MUFAfor saturated fatty acids has a minimal effect on HDL-Cvalues and does not raise triglyceride levels.67,140–143 Consumption of trans-fatty acids is the most harmful and is associated with both increased LDL-C and decreased HDL-Clevels. Combined with evidence from epidemiologic cohort studies, these effects indicate that diets high in trans-fatty acids are associated with an increased risk of CAD; current evidence indicates that, on a per calorie basis, risk with trans-fatty acids is higher than with any other macro nutrients.
The ratio of n-6 and n-3 PUFA in diet is also important. Even though it has not been well investigated in healthy individuals, long-chain n-3 supplementation clearly lowers serum TG.144 South Asians have been shown to have a higher proportion of total fatty acids as n-6 PUFA and a lower proportion of long-chain n-3 PUFA in plasma and cellular membrane phospholipids as compared to white Caucasians.145 It has been suggested that an imbalance in dietary n-6 and n-3 PUFA may be important for the development of insulin resistance and dyslipidemia in South Asians.146
Recommendations
-
1.
Fats should provide not more than 30% of total energy/day and SFAs should provide no more than 10% of total energy/day. For individuals having LDL-C of ≥100 mg/dl, SFAs should be <7% of total energy/day.
-
2.
Essential PUFAs [(linoleic acid (LA)] should provide 5–8% of total energy/day.
-
3.
α-linolenic acid (ALA) should be 1–2% of total energy/day.
-
4.
Optimal ratio of LA/ALA should be 5–10.
-
5.
Long chain n-3 PUFAs should be obtained from fish/walnuts/flaxseeds/canola oil etc.
-
6.
Cis MUFAs should provide 10–15% of total energy/day.
-
7.
TFAs should be <1% of total energy/day.
-
8.
Cholesterol intake should be limited to 200–300 mg/day.
The lower limit of fat should be adequate for the energy needs (15% of total energy), should prevent essential fatty acid deficiency (LA, 3% of total energy; ALA, 0.5% of total energy), and should facilitate optimal absorption of fat-soluble vitamins.39
4.2.1.3.1. Food-based guidelines to ensure optimal fat quality in Asian Indian diets
-
1.The recommendation for oils are as follows147:
-
a.Complete dependence on just one vegetable oil does not ensure optimal intake of various fatty acids. Combination/blend of 2 or more vegetable oils (1:1) is recommended. Some recommended oil combinations are-
-
•Groundnut/sesame/rice bran/cottonseed + Mustard/Canola/Soyabean
-
•Safflower/sunflower + mustard/olive/Groundnut/Rice bran
Improvement of n-3 PUFA nutritional status in Indian adults has been shown with two of these oil combinations (groundnut oil/sunflower oil and canola).147 -
•
-
b.Consumption of butter and ghee (clarified butter) should be kept to minimum.
-
c.To limit the intake of trans fats, strictly avoid the use of partially hydrogenated vegetable fat (vanaspati/margarine) for cooking/frying/baking
-
d.Coconut oil, palm kernel oil, palm oil and palmolein or their solid fractions should be substituted for partially-hydrogenated vegetable oils in foods that require solid fats (bakery fats, shortening etc). These oils are high in saturated fats but are trans-fat free.
-
a.
-
2.To ensure correct balance of fatty acids from dietary components other than visible fat, the following dietary guidelines are recommended146,147:
-
a.Regular consumption of foods with high ALA content (wheat, pearl millet, pulses, green leafy vegetables, fenugreek, flaxseed, mustard seeds).
-
b.Partial substitution of visible fat and invisible fats from animal foods with whole nuts such as pistachios and almonds.
-
c.Moderation in the use of animal foods containing high fat, saturated fats and cholesterol. For non-vegetarians, consumption of 100–200 g fish (4–6 pieces)/week is recommended.
-
d.Minimizing consumption of premixed, ready-to-eat, fast foods, bakery foods and processed foods prepared in partially-hydrogenated vegetable oilssuch as savories (namkeen).
-
e.Choose low fat dairy foods such as double toned milk (fats < 1.5%) or curd prepared from such milk. The preference of low fat dairy foods would also reduce ruminant TFAs.
-
a.
While low-fat diets are generally recommended, it is important to recognize that decreases in dietary fat intake may lead to increased carbohydrate consumption and subsequent weight gain.141,143,148 Patients at risk for the insulin resistance syndrome are advised to avoid excessive carbohydrate intake and to consume diets that include relatively more unsaturated fats.67,149 A diet high in carbohydrates (>60% of total energy) will increase TG, while a diet that replaces saturated fatty acids with MUFA will not.67
4.2.1.4. Proteins
-
1.
Protein intake should be based on body weight. This should be 1 g/kg/day, considering the quality of protein in a usual Indian vegetarian diet.
-
2.
In conjunction with energy intake, the protein intake should provide 10–15% of the total calories/day in sedentary to moderately active individuals.
-
3.Recommended protein sources:
-
a.Non-vegetarian: Egg white, fish, and lean chicken.
-
b.Vegetarian: Soya, pulses, whole grams (channa, rajma, green gram etc.), milk and low fat dairy products.
-
a.
4.2.1.5. Salt
-
1.
Salt intake should be less than 5 g of sodium chloride (or about 2 g sodium)/day.
-
2.
Addition of extra salt at the dining table should be avoided.
-
3.
Dietary intake of sodium from all sources (pickles, chutneys, namkeens, papads bakery items, potato chips, popcorn, salty biscuits, preserved meat products, other pre-prepared and preserved foods, soups, cheese, fast foods) should be limited. Avoid processed foods that have high salt content.
-
4.
Reading of food labels to determine sodium content of the commercial foods should be encouraged. Sodium, in such foods may be added in the form of sodium benzoate, monosodium glutamate, baking powder, and baking soda.
4.2.1.6. Sugar and artificial sweeteners
-
1.
Free sugars should be less than 10% of total calories/day, which includes all added sugars and sugars present in honey, syrups and fruit juices
-
2.
Alternatives to sweetened beverages can be water, skimmed buttermilk, tender coconut water, low fat milk.
-
3.
Indian sweets, halwa (a gelatinous sweet dish made from grain flour, ghee, sugar and nuts), kheer (a sweet dish made from boiling rice with milk, sugar, cardamoms, saffron and nuts), puddings, ice creams, sweetened biscuits, cakes, pastries and baked goods are high in added sugars and should be restricted.
-
4.
Encourage reading of food labels to determine sugar content. Some of the names in the ingredients list for the presence of added sugars include: brown sugar, corn syrup, dextrose, honey, malt syrup, sugar, molasses and sucrose.
-
5.
Artificial sweeteners could be used in moderation. However, these do not contain any beneficial nutrients and long–term health benefit, if any, is not clear in non-diabetic individuals. The Food and Drug Administration (FDA) has approved 5 artificial sweeteners; saccharin (Sweet ‘N’ Low, Sweet Twin, Necta Sweet), aspartame (Equal, Sweetex, Sugar free, Sugar free gold), acesulfame-K, neotame (both are used in beverages, dairy products, pharmaceutical products, chewing gum etc.), and sucralose (Splenda, Zero, Sugar free natura) as safe. Although doubts have been raised regarding safety of saccharin, FDA has approved it to be used in limited quantity due to low price, good shelf life and heat stability. Stevia (Stevi0cal, Gwiser) and some sugar alcohols (Sorbitol, xylitol, mannitol, maltitol etc.) have been approved by FDA under GRAS (Generally Recognized as Safe) status.
4.2.1.7. Lipid lowering foods
There is also a need to identify and include foods which have been reported to have lipid lowering properties. Following are some of the food items that have been documented to have lipid lowering effect:
-
1.
Oats150,151
-
2.
Nuts152–155
-
3.
Psyllium husk156
-
4.
Cinnamon157,158
-
5.
Flaxseeds159,160
-
6.
Fenugreek161,162
-
7.
Soy163,164
-
8.
Amla165
-
9.
Garlic166
-
10.
Finger Millet167
-
11.
Terminalia arjuna168
Long term studies are required to evaluate the effect of these food items and appropriate dosage for Asian Indians.
4.2.2. Non-dietary measures
4.2.2.1. Physical exercise (PE)
There is ample evidence that physical inactivity is an important risk factor for development of CAD, hypertension, obesity, dyslipidemia, type II diabetes mellitus.3,169,170 Conversely, PE is associated with reduction in risk for CAD, T2DM, hypertension and obesity.171 The benefit of PE on CV risk has been postulated to be multifactorial and includes beneficial effects on thrombosis, endothelial function, inflammation, autonomic nervous system, blood pressure, obesity, glucose metabolism, insulin resistance and lipids.
PE has been documented to raise HDL-C but there is a wide variability in the HDL-C raising effect of PE, probably due to differences in baseline characteristics and genetic factors. In addition, PE has been shown to reduce TG as well as improve the LDL-C particle size. Thus, in effect, PE directly improves “atherogenic dyslipidemia”, which is frequently present among Indians. Therefore, PE may prove to be particularly helpful in reducing CVD in Indians.
4.2.2.1.1. Effects of PE on HDL-C
Several cross sectional and prospective cohort studies have shown that HDL-C values are higher in physically active people as compared to less active counterparts.172,173Randomized clinical trials addressing the effects of at least 12 weeks aerobic exercise on lipids, where diet was held constant, have also reported significant increase in HDL-C levels.174–176 In the Health Risk Factors Exercise Training and Genetics (HERITAGE) Family Study,177 the largest published interventional study, 675 normolipidemic subjects were given 20 weeks of supervised exercise and their HDL-C concentrations increased by 3.6 ± 11% in both males and females compared with baseline with significant individual variability.
The reasons for individual variability in HDL-C response to PE are not entirely clear. Data are inconsistent regarding whether greater benefit occurs with low vs normal to high baseline HDL-C.178–180 However subjects with high baseline TG and low HDL-C as seen in metabolic syndrome appear to show a significant increase in HDL-C levels (+4.9%)suggesting that effect of HDL-C from PE may be linked to baseline TG levels.179 Another issue is whether effect of PE on HDL-C levels depends on the amount or intensity of PE. Kraus et al found that high amount/high intensity exercise significantly increased HDL-C by 8.8% (p < 0.02) and HDL particle size and diameter also increased resulting in more beneficial HDL2 fraction.175 However other studies have not shown a consistent relationship between the intensity of exercise and increase in HDL-C.181,182 The Heritage Family Studysuggested that genetics might play a key role in response of HDL-C to exercise.177,183 The possible heritable factors suggested included Apo E, cholesteryl ester transfer protein (CETP) genotype, and lipoprotein lipase (LPL) genotype.184–186
4.2.2.1.2. Effects of PE on TG
PE has a consistent favorable effect on serum TG levels especially in patients with disorders of TG-HDL-C axis. Observational studies have shown an inverse association between PE and TG levels.173 However the results from clinical trials have been mixed depending upon the subset of patients studied.187 It appears that PE affects TG more significantly in men as compared to women.173,177 A subset analysis of 200 men in the Heritage Family Study showed that 20 weeks of exercise reduced TG by 15%, especially in subjects with abnormalities of TG-HDL-C axis.179 In another randomized trial of 111 sedentary overweight adults with dyslipidemia, TG reduced from 10 to 26% in the PE group compared with 18% increase in the non exercising control group.175 A recent meta-analysis in the overweight/obese children and adolescents shows that PE decreases TG in these subjects.187
4.2.2.1.3. Effects of PE on LDL-C
LDL-C is the most important lipid predictor of CV events. Although LDL-C can be reduced by low fat diet, PE alone has shown no significant effect on LDL-C as reported in several systemic reviews.173,181,187 One review noted that the subset of studies which showed reduction of LDL-C by PE also showed significant reduction in body fat and weight.174 A recent meta-analysis of RCTs on the effects of aerobic exercise on lipids in adults with type II diabetes suggests that aerobic exercise lowers LDL-C level in adults with Type II DM.188 However additional controlled trials are needed to confirm these observations. Resistance training over longer periods may also reduce LDL-C.189 Although the effects of PE on LDL-C are mixed, PE appears to increase the average size of LDL-C particles and reduce the number of more atherogenic, small-dense LDL particles.175 This is of particular importance to Indians who are known to have increased proportions of small-dense LDL.
4.2.2.1.4. Summary and recommendations regarding physical exercise
Available evidence suggests that aerobic exercise can raise HDL-C modestly by 3–10%, lower TG by 15–25% and increase LDL-C particle size. In addition, resistance training appears to lower LDL-C levels also.
The following recommendations are made as per WHO's Global Recommendations on Physical activity for health (2010)189
-
•
Children and young people aged 5–17 years old should accumulate atleast 60 min of moderate to vigorous intensity (such as jogging) daily.
-
•
Adults aged 18–64 years should do at least 150 min of moderate-intensity (such as brisk walking) PE throughout the week, or do at least 75 min of vigorous-intensity aerobic exercise throughout the week, or an equivalent combination of moderate- and vigorous-intensity exercise.
-
•
For Adults aged 65 years and above, recommended level of PE is similar to adults aged 18–64 years but when adults of this age group cannot do the recommended amounts of exercise due to health conditions, they should try to be as physically active as their abilities and conditions may allow.
While brisk walking is the simplest form of PE that can be performed, outdoor sports have an added advantage of being a source of recreation, in addition to being an excellent form of PE. In addition, in India, folk dances, such as bhangra from Punjab, and martial arts (for example, Kalaripayattu of Kerala) can serve as acceptable, low cost, indigenous forms of healthy exercise.190
4.2.2.2. Smoking cessation
Smoking intensity has been associated with reduction in HDL-C with small but statistically significant increase in LDL-C.191–193 Some studies have described small-dense LDL particles among current smokers and improvements in lipids after smoking cessation, though these findings are less consistent.194 A recent large randomized clinical trial suggested that smoking cessation improved HDL-C, total HDL-C, and large HDL particles, in spite of increase in weight.195 The effect was more marked in women. The increase in HDL-C may mediate part of reduced CVD after smoking cessation.
Recommendations
Smokers should quit smoking because it decreases CV mortality and morbidity and also has beneficial effects on lipids. Though, separate data on bidi smoking and chewable tobacco are not available, they should also be avoided.
4.2.2.3. Alcohol consumption
Moderate alcohol intake has been shown to reduce the risk of CAD by 40–70% compared to non drinkers and heavy drinkers in several prospective cohort studies. A recent meta-analysis by Castelnuovo et al of 34 studies has shown a similar effect.196 Several mechanisms like antioxidant, antithrombotic, enhanced insulin sensitivity and increase in HDL-C have been hypothesized for this benefit. However, binge drinking and heavy drinking increase CV mortality.197 Heavy drinking has also been shown to be associated with metabolic syndrome, through elevation of blood pressure and TG, inmale patients with diabetes.198
Although moderate alcohol intake was found to be protective against MI in the overall study population in the INTERHEART study,3 it was shown to be harmful for Indians.14 Similarly a cross sectional study by Roy et al among 4465 alcohol users in India shows that alcohol intake increased the risk for CAD.199
Recommendations
In spite of the fact that moderate alcohol intake increases HDL-C and has shown cardio-protective effects in western populations, it has been found to be harmful in Indian subjects. Hence, alcohol intake, even in moderation, should preferably be avoided by Indians. In addition, as heavy drinking can increase TG and blood pressure and cause metabolic syndrome, apart from causing other non-lipid harmful effects, it should completely be avoided.
4.2.2.4. Yoga
Yoga is an ancient Indian and holistic technique which has been shown to control stress. It has also been shown to have several cardio protective effects in several small studies like control of hypertension,200 body weight, blood sugar, and improvement in lipids.201–203 Many controlled studies have demonstrated that yoga may be useful for regression of early204 and advanced coronary atherosclerosis.205–207 A recent controlled trial of secondary prevention in blacks showed that meditation (which is an essential component of yoga) reduced major adverse CV events (death, MI, stroke) by 48% over a 5.4 years average follow up.208 These studies have also demonstrated a marked decrease in TC, TG and LDL-C levels with yoga. In addition, one study in normal volunteers has shown an increase in HDL-C also, apart from reductions in TC, TG and LDL-C levels. A recent study suggests that yoga may improve lipid profile in patients with end stage renal disease.209
Recommendations
Psychosocial stress is an important but neglected risk factor for CAD. Yoga can control the stress and has several other cardio-protective effects which could be useful in primary and secondary prevention of CAD. Several small studies suggest that yoga can affect lipids favorably. Therefore, although no large studies are available, in view of its several cardio-protective effects including possible improvement in lipids, the present guidelines encourage practice of yoga among Indians.
4.3. Pharmacological therapy
4.3.1. Statins
Statins are currently the most effective drugs available for lowering LDL-C. Statins act by inhibition of 3-hydroxy 3-methylglutaryl coenzyme A (HMG-CoA) reductase, which results in reduction in cholesterol concentration in the hepatocytes, leading to up-regulation of LDL receptors and subsequent increased clearance of LDL as well as VLDL particles.210,211
4.3.1.1. Statin pharmacokinetics and clinical benefits
Statins can be grouped as natural (those derived from fungal fermentation) e.g. – lovastatin, pravastatin and simvastatin; and the more recent synthetic ones fluvastatin, atorvastatin, cerivastatin, rosuvastatin and the new pitavastatin. Table 9 summarizes the pharmacology of commonly available statins. Most statins are metabolized by CYP P 450 3A4 enzyme systems (Lovastatin, simvastatin, atorvastatin) whereas some synthetic statins like fluvastatin and rosuvastatin are metabolized by CYP P450 2C9 pathway. Pitavastatin has minimal effects on CYP P450, while pravastatin has none. Since a large number of drugs are metabolized by CYP P 450 3A4 pathway, caution needs to be exercised while choosing a statin inpatients already on multiple other drugs. Statins metabolized by alternate pathways are to be chosen if there is evidence of hepatic or muscle toxicity by a statin with CYP P 450 3A4 pathway.
Table 9.
Statin pharmacokinetics.
| Statin | Atorvastatin | Fluvastatin/xl | Lovastatin | Pitavastatin | Pravastatin | Rosuvastatin | Simvastatin |
|---|---|---|---|---|---|---|---|
| Origin | Synthetic | Synthetic | Fungal | Synthetic | Semi-synthetic | synthetic | Semi-synthetic |
| Lipophilicity | Yes | Yes | Yes | No | No | No | Yes |
| Protein binding | >98% | >99% | >95% | >99% | 50% | 88% | 95% |
| Cytochrome P variant | 3A4 | 2C9 | 3A4 | Minimal | None | 2C9 minor | 3A4 |
| T ½a | Long acting | Short acting | Short acting | Long acting | Short acting | Long acting | Short acting |
| Renal adjustments to statin dosage | None | If sever impairment, use with caution | If severe impairment, use doses>20 mg/day with caution | Maximum 2 mg/day | Monitor if impairment | No more than 10 mg/day if severe impairment | Monitor if severe impairment |
Short acting >5 h, long acting >10 h. Of the long acting statins, rosuvastatin has a longer action than atorvastatin, which acts longer than pitavastatin.
4.3.1.2. Dosages
Statins as a class reduce LDL-C levels; the dose/response relationship is log linear, which means that although the initial dose lowers LDL-C from 25% to 45%, additional doublings of the statin dose result in only an additional 6%–7% of LDL-C lowering. The standard dosages as well as maximal dosages of various statins are shown in Table 8. Although the most recent ACC/AHA guidelines on cholesterol management have recommended moderate- or high-intensity statin therapy regardless of baseline LDL-C,133 the present document recommends initiating therapy at the commonly tolerated doses of statins. The rationale for this recommendation is discussed in Section 5. This of course does not apply to patients presenting with an acute CV event, in whom intensive statin therapy is recommended from the outset (ref. Section 6.3).
Table 8.
Effective clinical doses of different statins.
| Statin | Daily dose (mg) to lower LDL-C by around 30% | Maximal dose (mg) |
|---|---|---|
| Lovastatin | 40 | 80 |
| Pravastatin | 40 | 80 |
| Simvastatin | 20 | 40 |
| Fluvastatin XL | 80 | 80 |
| Atorvastatin | 10 | 80 |
| Rosuvastatin | 5 | 40 |
| Pitavastatin | 2 | 4 |
In general, the reduction in LDL-C increases with statin dose and for most statins equivalent doses can achieve the targeted levels of LDL-C. Fluvastatin XR 80 mg, lovastatin 40 mg, pravastatin 40 mg, simvastatin 20 mg, atorvastatin 20 mg, rosuvastatin 10 mg and pitavastatin 2 mg are equivalent in decreasing LDL-C by 30–40%. Greater than 40% reduction is expected with atorvastatin >40 mg, rosuvastatin 20 mg, and pitavastatin 4 mg.
Lower dosages of statin are recommended in patients above 75 years or age and in those requiring co-administration of drugs that inhibit the CYP3A4 or 2C9 pathways such as cyclosporine. In addition, it is advisable to avoid consumption of large quantities of grape juice while taking statins that are metabolized by CYP3A4 pathway (i.e., avoid >960 ml daily while taking simvastatin or lovastatin or >1.2 L while taking atorvastatin).
4.3.1.3. Adverse effects
Statins are safe drugs. In large clinical trials, side effects of statins have been quite rare. Liver related toxicity is estimated to happen in 1–2% cases while actual muscle injury being much rarer at 0.1–0.2%.
4.3.1.3.1. Muscle toxicity
Statins may cause different types of muscle toxicity which can be classified as follows-
-
•
Myalgia – characterized by muscle ache without creatine phosphokinase (CPK) elevation. Reported in up to 10% of the patients.
-
•
Myositis-diagnosed when muscle pain and tenderness are associated with elevation of CPK 3 to 10 times upper limit of normal (ULN), incidence 0.1%, or
-
•
Rhabdomyolysis-severe muscle pain in conjunction with increases in CPK >10000 or >10 times the ULN, associated with myoglobinuria or elevated serum creatinine.
Routine measurement of CPK is not required prior to initiating statin therapy. However, in patients at high risk of muscle toxicity, such as elderly patients, patients on concomitant drug therapy likely to increase the risk of myotoxicity or those with hypothyroidism, reduced renal or hepatic function, rheumatologic disorders such as polymyalgia rheumatica, steroid myopathy, vitamin D deficiency, or primary muscle diseases, it is advisable to obtain CPK levels at baseline.
If mild to moderate muscle symptoms develop during statin therapy, discontinue the statin until the symptoms can be evaluated. If muscle symptoms resolve, and if no contraindication exists, the original or a lower dose of the same statin should be restarted establish a causal relationship between the muscle symptoms and the statin therapy. If a causal relationship exists, the original statin should be discontinued and a low dose of a different statin should be started once muscle symptoms have resolved. If this is tolerated, then gradually the dose should be increased as per the patient's tolerance.
However, if the muscle symptoms or elevated CK levels do not resolve completely even after 2 months of cessation of statin therapy, other causes of muscle symptoms should be looked for. If persistent muscle symptoms are determined to arise from a condition unrelated to statin therapy, or if the predisposing condition has been treated, statin therapy can be resumed at the original dose.
In patients who develop unexplained severe muscle symptoms or fatigue develop during statin therapy, statin therapy should be promptly discontinued and the possibility of rhabdomyolysis addressed by evaluating CPK, creatinine, and a urinalysis for myoglobinuria. If rhabdomyolysis is confirmed, then restarting statin therapy in such patients may not be advisable unless a temporary, reversible cause of rhabdomyolysis (such as severe acute infection, major surgery, trauma, severe metabolic, endocrine and electrolyte disorders and uncontrolled seizures, unaccustomed exercise, etc.) could be found.
4.3.1.3.2. Liver function abnormality
Statins have been associated with biochemical abnormalities of liver function with alanine aminotransferase (ALT) elevation in <1–2%, although increasing to 2–3% with higher doses. Liver enzyme changes generally occur in the first 3 months of therapy related to changes in the lipid components of the hepatocyte membrane, leading to an increase in permeability. Serious liver injury with statins is rare.
ALT and aspirate aminotransferase (AST) should be checked prior to the initiation of therapy and when clinically indicated. Statin therapy should be avoided in patients with ALT >3 times ULN at baseline, until a treatable cause can be found and the liver function abnormality has been corrected. Routine periodic monitoring of liver enzymes does not appear to be effective in detecting or preventing serious liver injury and is therefore not required.
If symptoms suggesting hepatotoxicity (e.g., unusual fatigue or weakness, loss of appetite, abdominal pain, dark-colored urine or yellowing of the skin or sclera) arise during statin therapy, then liver function tests should be repeated and statin therapy should be temporarily discontinued. These patients should be monitored until the abnormalities resolve. Nearly 70% of cases resolve spontaneously. Once abnormalities resolve, statin can be restarted cautiously, using a smaller dose and possibly a different statin than the previously used one. If liver injury recurs and an alternate etiology is not found, statin therapy may have to be permanently discontinued.
Statins should be used with caution in patients who consume substantial quantities of alcohol and/or have a history of liver disease.
4.3.1.3.3. Other important adverse effects
Statin therapy is associated with very modest excess risk of new onset diabetes (1 excess case per 1000 individuals treated 1 year with moderate-intensity statin therapy and 3 excess cases per 1000 individuals treated for 1 year with high-intensity statin therapy). However, the benefit with statin therapy clearly outweighs this small risk of new-onset diabetes.133
There have also been concerns of increased risk of cancers, hemorrhagic stroke and cognitive impairment with statin therapy but no cause–effect relationship has been established, in any of the trials.133
4.3.1.4. Clinical evidence
The benefits of statins have been proven in multiple clinical trials and are extremely robust. They have been tried, tested and proven in almost every category of dyslipidemia and CVD, ranging from primary prevention to established CVD including post ACS, post-coronary revascularization (percutaneous or surgical) patients also. From mild elevation of LDL-C to combined dyslipidemia, the benefits are durable. Tables 10 and 11 summarize the evidence showing beneficial effects of statins in large clinical trials in primary and secondary prevention settings, respectively.
Table 10.
Cardiovascular benefits of statins in placebo-controlled primary prevention clinical trials.
| Trial | Population | Statin dosage | LDL-C reduction | Effective AGAINST CHD | Effective AGAINST stroke |
|---|---|---|---|---|---|
| AFCAPS/TEXCAPS212 | 5608 men aged 45–73 and 997 women aged 55–73 y with lipid entry criteria (low HDL-C required) | Lovastatin 20 mg and 40 mg/day | 25% | Yes | NR |
| WOSCOPS213 | High-risk men aged 45–64 y without prior MI, followed up for 4.9 y | Pravastatin 40 mg/day | 26% | Yes | No |
| ASCOT-LLA214 | 10,305 hypertensive patients aged 40–79 y with atleast three other CV risk factors, followed up for 3.3 y before study was halted by the data safety and monitoring board | Atorvastatin 10 mg/day | 29% | Yes | Yes |
| ALLHAT-LLA215 | 10,355 subjects aged ≥ 25 y who met lipid criteria, monitored for up to 8 y | Pravastatin 40 mg/day | 16.7% (related to drop-insin placebo group and drop-outs in treatment groups) | No; because of less marked LDL-C difference between the two groups due to high crossover and dropout rates | No |
| JUPITER118 | 17,802 apprentlyhealthy men and women with LDL-C <130 mg/dl and hs-CRP 2.0 or higher | Rosuvastatin 20 mg/day | 50% | Yes | Yes |
| CARDS216 | 2838 men and women with type 2 diabetes and ≥1 other risk factor | Atorvastatin 10 mg/day | 40% | Yes | Yes |
AFCPS/TEXCAPS, Air Force/Texas Coronary Atherosclerosis Prevention Study, ALLHAT-LLA-Antihypertensive and Lipid Lowering to Prevent Heart Attacks Trial, ASCOT-LLA – Anglo-Scandinavian Cardiac Outcomes Trial Lipid Lowering Arm, CARDS – Collaborative Atorvastatin Diabetes study; CHD-coronary heart disease, JUPITER – Justification for the Use of Statins in Prevention- An Intervention Trial Evaluating Rosuvastatin; LDL-C low density lipoprotein cholesterol; MI-myocardial infarction; NR-not reported, WOSCOPS-West of Scotland Coronary Prevention Study.
Table 11.
Cardiovascular benefits of statins in secondary prevention clinical trials.
| Study | Population | Statin; duration of follow-up | LDL-C reduction | Efficacy against CHD | Efficacy against stroke |
|---|---|---|---|---|---|
| HPS282 | Age 40–80 y with coronary disease, other occlusive disease, diabetes | Simvastatin 40 mg/day vs. placebo; 5 years | 37% | Significant reduction in total mortality,fatal and nonfatal MI, revascularization | Yes |
| PROSPER336 | Age 70–82 y with history of, or risk factors for, vascular disease | Pravastatin 40 mg/day vs. placebo; 3.2years | 3% | No reduction in total mortality, but significant reduction in fatal and nonfatal CHD | No, although a decrease in TIA (low rate of stroke in placebo group) |
| CARE279 | 4159 subjects post MI; mean age, 59 y | Pravastatin 40 mg/day vs. placebo; 5years | 28% | Significant reduction of primary endpoint | Yes |
| LIPID280 | 9014 subjects aged 31–75 with MI and ACS | Pravastatin 40 mg/day vs. placebo; 5years | 25% | Significant reduction of primary endpoint | Yes |
| TNT337 | 10,001 subjects age 35–75 y with stable CHD | Atorvastatin 10 mg/day vs. 80 mg/day; 4.9years | 77 mg/dl with 80 mg dose and 100 mg/dl with 10 mg dose | No difference in total mortality but significant reduction in primary combined endpoint, fatal and nonfatal MI and major coronary events | Yes |
| IDEAL338 | 8288 subjects <80 y with prior MI; 4.8 years | Simvastatin 20 mg/day vs. atorvastatin 80 mg/day; 4. years | 22% lower values achieved with atorvastatin (79 vs. 102 mg/dl) | No significant lowering of primary combined endpoint; no significant decrease in any coronary event | No |
ACS-Acute Coronary Syndrome, CARE-Cholesterol And Recurrent Events; CHD-coronary heart disease; HPS-Heart Protection Study; IDEAL-Incremental Decrease in Clinical Endpoints Though Aggressive Lipid Lowering, LDL-C-low density lipoprotein cholesterol, LIPID-Long Term Intervention in Ischemic Patients, MI- myocardial infarction, PROSPER-Prospective Study of Pravastatin in The Elderly at Risk, TIA-transient ischemic attack, TNT-Treat To New Targets.
4.3.2. Fibrates
Fibrates reduce TG levels by 20–50%, and increase HDL-C by 10–20%.67 They also reduce small, dense LDL particles by promoting a shift to larger, more buoyant particles which have higher binding affinity for the LDL receptor.217,218 Fibrates are considered first-line therapy for severe hypertriglyceridemia while as an adjunct to statins, they are a therapeutic option for combined dyslipidemia.
4.3.2.1. Pharmacology
Fibrates act through the peroxisome proliferator receptor-α (PPAR-α) agonism,218 which perhaps is responsible for their multiple beneficial non-lipid pleiotropic effects on endothelial function, vascular inflammation, and fibrinolytic pathway.
Available fibrates are: fenofibric acid derivatives, gemfibrozil and bezafibrate.
4.3.2.1.1. Gemfibrozil
After oral administration, Gemfibrozil reaches peak plasma concentration at around 1–2 h. The absorption of the drug is best when given before meals. Approximately 70% of an administered dose is excreted in the urine, mostly as the glucuronide conjugate. Gemfibrozil is highly bound to plasma proteins and there is a potential for displacement interactions with other drugs. The elimination half-life is approximately 1.1 h.218
4.3.2.1.2. Fenofibrate
Fenofibrate is the most commonly used fibrate in clinical practice. After absorption in to the circulation, it is hydrolyzed to fenofibric acid, which is the active metabolite. Approximately 99% of it is protein bound. Fenofibricacid is metabolized by conjugation with glucuronic acid and excreted primarily in the urine (60%) and to a lesser extent (∼25%) in the feces. The elimination half-life is approximately 20 h.218 Neither fenofibrate nor fenofibric acid undergo metabolism by CYP P450.
A major problem with fenofibrate is its poor water solubility resulting in low and unpredictable oral bioavailability. Micronized and nano-particle formulations have been developed to overcome these challenges but oral bioavailability related issues still remain. More recently, choline salt of fenofibric acid has been developed which does not have most of these problems. It has good (∼81%) and predictable bioavailability and can be taken regardless of meals. It is the only preparation of fenofibric acid recommended for use at present.
4.3.2.1.3. Bezafibrate
Bezafibrate has an elimination half-life of 1–2 h and protein binding of 94–96%. Excretion is almost exclusively renal with 95% recovered in the urine.
4.3.2.2. Indications
Fibrates are indicated as first-line therapy (along with intensive life-style measures) for severe hypertriglyceridemia (TG > 500 mg/dl) or as an adjunctive therapy with statins when there is persistent elevation of serum TG levels despite optimum life-style measures and statin therapy. Choline salt of fenofibric acid is the only fibrate approved by the USFDA for use with a statin.
4.3.2.3. Dosage
4.3.2.3.1. Fenofibrate
The recommended initial dose of fenofibric acid is 135 mg once a day, with lower doses (45 mg/d) recommended for those with impaired renal function [glomerular filtration rate (GFR) < 60 mL/min/1.73 m2].
4.3.2.3.2. Gemfibrozil
The recommended dose of gemfibrozil is 600 mg twice a day, given 30 min before the meals. The dose needs to be reduced to 600 mg once a day when GFR is < 60 mL/min/1.73 m2.
4.3.2.3.3. Bezafibrate
The recommended dosage of bezafibrate is 200 mg twice or thrice a day (or 400 mg modified release formulation once daily). Dose adjustment according to renal function is indicated.
4.3.2.4. Contraindications
Fibrates are pregnancy category C drugs and should be used during pregnancy only if the benefit justifies the potential risk for the fetus. Fibrates are contraindicated in nursing mothers. In addition, extreme caution needs to be exercised when prescribing fibrates to those with end-stage renal disease.
4.3.2.5. Adverse effects
Fibrate use can cause myotoxicity including myopathy and rhabdomyolysis especially when co-administered with a statin, particularly in patients with diabetes mellitus, renal failure, hypothyroidism and in elderly patients.219
The risk of myotoxicity increases by a factor of 33 when gemfibrozil is combined with a statin as opposed to fenofibrate. If gemfibrozil needs to be combined with a statin, fluvastatin may be preferred, since there is no significant effect of gemfibrozil on its concentration.219,220
Fenofibratestatin combination was evaluated in around 1000 patients (of the total population of 9795 patients) who received both the drugs, in the Fenofibrate Intervention and Event Lowering in Diabetes (FIELD) trial. There were no reported cases of rhabdomyolysis.221 Similar data emerged out of the Action to Control Cardiovascular risk in Diabetes (ACCORD) trial.134 However, fenofibrate can increase serum creatinine levels by 10–20% which return to normal on discontinuation of therapy. In the ACCORD trial, the study drug was discontinued by 2.4% patients in the fenofibrate group and by 1.1% in the placebo group because of a decrease in the estimated GFR. It is therefore recommended that serum creatinine should be checked before initiating fibrate therapy, and routine creatinine monitoring is required in patients with preexisting chronic kidney disease.220
In a pooled analysis of 10 placebo-controlled trials, rise of hepatic enzymes to > 3times the ULN occurred in 5.3% of patients taking fenofibrate compared to 1.1% on placebo. Hence, liver enzymes should be periodically monitored during therapy and therapy to be discontinued if enzyme levels persist >3 times the ULN.
The dosage of coumarin anticoagulants may need to be adjusted during fibrate therapy to prevent bleeding complications.220
4.3.2.6. Clinical evidence
A number of trials have evaluated fibrates, either alone or in combination with statin therapy. In the FIELD trial, 9795 diabetics who were not on any statin were randomized to receive fenofibrate or a placebo. After an average follow-up of 5 years, no significant difference was seen between the two groups in the composite endpoint of CHD death and nonfatal MI. However, fenofibrate therapy resulted in significantly lower risk of non-fatal MI and coronary revascularization.221 Similarly, in the ACCORD trial, in which fenofibrate was added on top of open label simvastatin, no overall benefit was seen with fenofibratein reducing the combined primary endpoint of first nonfatal MI, non fatal stroke and CHD death or individual components, despite reduction of triglycerides and increase in HDL-C.134
However, a subgroup analysis involving patients with TG more than 204 mg/dl and HDL-C <34 mg/dl showed significant benefit with fenofibrate therapy in both the above trials. There were around 2014 patients in the FIELD trial who showed a CV event reduction of 27% while in the 941 patients of ACCORD trial there was a CV endpoint reduction of 31%.222,223 These results were confirmed in a meta-analysis that included 5 large trials with fibrates.135
4.3.3. Bile acid sequestrants (BAS)
Cholestyramine, colestipol and colesevelam are the three commonly available BASs. Cholestyramine and colestipol were initially available as water insoluble powder, but colestipol was subsequently developed as a tablet form to improve palatability and compliance.224 Colesevelam has a unique polymer structure accounting for its higher capacity bile acid binding (Table 12).
Table 12.
Currently available bile acid sequestrants for clinical use.
| Bile acid sequestrant | Initial dosage | Maintenance dosage | LDL-C reduction | Comments |
|---|---|---|---|---|
| Cholestyramine resin | 8 g/day in divided doses | 16–24 g/day as monotherapy; lower doses if used with statins | Varies from 8.7% to 28% depending on dosage of resin | Take other drugs 1 h before or 3 h after, psylium augments action |
| Colestipol resin | 10 g/day in divided doses | 16–24 g/day as monotherapy; lower doses if used with statins | Similar to cholestyramine, varies with dosage of resin | Take other drugs 1 h before or 3 h after, psylium augments action |
| Colesevelam | Two or three 625 mg tabs twice daily (7 tabs/day max) | 19% (with 3.8 g/day dose) | Take with a large glass of water, lowers HbA1C in type 2 diabetes |
4.3.3.1. Mechanism of action
Bile acids are secreted in the bile from the liver and gallbladder into the intestine. They emulsify the fat in food, facilitating absorption. A major portion of the secreted bile acid is reabsorbed from the intestines and returned to the liver via the portal circulation, thus, forming the enterohepatic cycle. However, about 5% escape absorption and additional bile acids are synthesized from cholesterol by the liver. BASs bind with the negatively charged bile acids and bite salts in the small intestine promoting their excretion. This results in increased conversion of hepatic cholesterol in to bile acid and a compensatory increase in LDL-Cuptake. Monotherapy with BAS lowers LDL-C by 5–30% in a dose dependent manner.225
4.3.3.2. Pharmacology
BASs are not absorbed or metabolized, and there is no interference with systemic drug metabolizing enzymes.225
4.3.3.3. Indication
BASs are indicated to reduce elevated LDL-C as monotherapy (when statins are contraindicated) or in combination with a statin. Colesevelam is approved for use as adjunct to diet and exercise.
4.3.3.4. Dosage
4.3.3.4.1. Cholestyramine
The recommended starting dose is 4 g once or twice a day followed by maintenance daily dose is 8–16 g, divided into 2 doses. Dose increments should be gradual with periodic assessment of lipid levels at intervals of 4 weeks. The maximum recommended daily dose is 24 g.
4.3.3.4.2. Cholestipol
The recommended dose is 5–30 g/day of granules or 2–16 g/day of tablets given once or in divided doses. The starting doses should be 5 g granules once a day, or two 1 g tablets once or twice a day and should be gradually increased every 1–2 months.
4.3.3.4.3. Colesevelam
Colesevelam can be used at lower doses since it has greatest bile acid binding capacity among BAS. The recommended dose is six 625 mg tablets once a day or divided in two doses with meals. It can be dosed at the same time as a statin or the two drugs can be dosed apart. After initiation, lipids should be checked in 4–6 weeks. The decline in LDL-C is usually evident within 2 weeks with colesevelam.
4.3.3.5. Contraindications
As BASs increase serum TG levels, their use is contraindicated in patients with baseline TG > 300 mg/dl or those who have type III hyperlipoproteinemia.
Cholestyramine and colestipol are pregnancy category C drugs. Their use during pregnancy or lactation, or by women of childbearing age requires that potential benefit be weighed against hazard to fetus.
Colesevelam is a pregnancy category B drug and should be used during pregnancy only if clearly needed. It is not expected to be excreted in human milk because it is not absorbed systemically from the GI tract.
4.3.3.6. Adverse effects
BAS may produce gastro-intestinal (GI) side effects like constipation, dyspepsia and flatulence. To minimize GI slide effects with BAS, low initial doses are to be started. For constipation, increased fluid and dietary fiber intake are recommended and stool softeners may be added as needed. Less frequent adverse effects include abdominal discomfort and/or pain, flatulence, nausea and vomiting. BASs are not recommended in patients with gastroparesis, other gastro-intestinal motility disorders, those who have had major gastrointestinal motility tract surgery, patients who may be at risk of bowel obstruction and those with complete biliary tract obstruction. Because of the tablet size, colesevelam and colestipol should be used with caution in patients with dysphagia or swallowing disorders, since they may cause dysphagia or esophageal obstruction.
BASs can increase triglycerides. For example, colesevelam may increase triglycerides by 5% in patients with primary hyperlipidemia whereas median increases in triglycerides of 18–22% have been reported in clinical studies treating patients with type 2 diabetes mellitus. Chronic use of BAS may be associated with increased bleeding tendency due to hypoprothrombinemia and vitamin K deficiency.
BAS may decrease absorption of fat-soluble vitamins. Patients on vitamin therapy should take vitamins at least 4 h before the BAS. If a patient is taking other medications in addition to cholestyramine or colestipol, the other medications should be taken 1 h before or 4 h after the BAS. Colesevelam is a more specific BAS, but may reduce GI absorption of some drugs. Drugs with a known interaction that should be taken at least 4 h prior to a colesevelam dose are: cyclosporine, glyburide, levothyroxine, oral contraceptives and phenytoin.
4.3.3.7. Clinical evidence (Table 13)
Table 13.
Clinical trial evidence demonstrating efficacy of bile acid sequestrants.
| Trial | Population | Drug | LDL-C reduction | Efficacy in prevention of CHD |
|---|---|---|---|---|
| LRC CPPT226 | 3806 men, no CHD | Cholestyramine 16–24 g/day | 20.3% | 19% reduction in fatal and nonfatal MI noted at 7.4 years |
| STARS227 | 90 men, CHD | Cholestyramine 16 g/day | 35.7% | Improvement seen on angiography at 2 years |
| NHLBI type 2 trial228 | 116 men and women, CHD | Cholestyramine 16 g/day average | 26% | Reduced progression, at 5 years, of lesions causing >50% stenosis at baseline |
| CLAS229 | 162 men, CHD | Colestipol 30 g/day + nicotinic acid 4.3 g/day | 43% | Patients treated had significantly more atherosclerosis regression on angiography at 2 years |
| FH-SCOR230 | 72 men and women, familial hypercholesterolemia | Colestipol, nicotinic acid and lovastatin | 39% | Angiographic change correlated with change in LDL-C at 2 years |
| FATS231 | 120 men, CHD | Colestipol 30 g/day and either lovastatin 20 mg bid or nicotinic acid 4 g/day | 46% (lovastatin), 36% (nicotinic acid) | Nicotinic acid group had higher HDL-C than lovastatin group, significant angiographic and clinical improvement seen at 2.5 years |
*No dosage available.
CHD-coronary heart disease; CLAS-Cholesterol Lowering Atherosclerosis Study; HDL-C- high density lipoprotein cholesterol; LDL-C- low density lipoprotein cholesterol; LRC CPT- Lipid Research Clinics Coronary Primary Prevention; MI-myocardial infarction; STARS-ST-Thomas Atherosclerosis Regression Study.
The most significant outcome trial was the Lipid Research Clinics Coronary Primary Prevention Trial (LRC-CPPT), which demonstrated a 19% decrease in the risk of combined CHD death and nonfatal MI in men with elevated cholesterol treated with 24 g/day of cholestyramine.226
In combination trials, the addition of colesevelam to a statin resulted in an additional 10–16% reduction in LDL-C. However, the effect of colesevelam on CV morbidity and mortality has not been determined.
4.3.3.8. When to use
If treatment with a statin does not achieve the LDL-C goal selected for a patient, intensification of LDL-C lowering drug therapy with a BAS is reasonable. In addition, BAS provides an alternative to statins as initial drug therapy for LDL-C lowering. The combination of BAS and ezetimibe can have additive effects on LDL-C lowering, and is useful for patients who do not tolerate a statin or for whom statins are contraindicated.225
An advantage of the statin-BAS combination is that here may be a reduction in blood glucose in diabetic patients.
4.3.4. Niacin
Niacin reduces LDL-C, VLDL-C, TG, Lp(a) and increases HDL-C.232,233Its primary effect is to down-regulate lipolysis and production of free fatty acids. This leads to a reduction in the amount of free fatty acids released from the adipocyte that are available to the liver for TG and VLDL production. Decreased levels of VLDL lead to diminished hepatic and peripheral production of IDL and LDL. At the same time, niacin increases apo-A1 by decreasing its cellular uptake resulting in HDL-C increase.232,234,235
Although niacin is amongst the most effective agents to raise HDL-C, results of recent large trials have shown no benefit, and even harm, with addition of niacin to statin therapyalone.236,237In addition, niacin has several side effects. As a result, niacin is currently not recommended for treatment of any form of dyslipidemia.
4.3.5. Omega-3-fatty acids
The omega-3 fatty acids (OFA) include the marine-derived long-chain fatty acids eicosapentaenoic acid (EPA) and docosahexaenoic acid (DHA). They lower triglycerides in patients with severe hypertriglyceridemia. OFA is available as an 1 gm liquid-filled gel capsule containing at least 900 mg ethyl esters of OFA derived from fish oils (465 mg EPA and 375 mg DHA).
4.3.5.1. Mechanism of action
OFA interfere with many transcription factors and lower triglycerides.
4.3.5.2. Pharmacology
OFA is manufactured by trans-esterification of fish oil. After intestinal absorption and breakdown of the ethyl esters, the resulting EPA and DHA enter the circulation.
4.3.5.3. Indications
For patients with mixed hyperlipidemia who attain LDL goal with statins, OFA supplementation is a reasonable therapeutic option as an alternative to fibrate to achieve non-HDL target goals.
For patients with very high triglyceride levels >500 mg/dl, the initial therapeutic goal is to lower triglyceride levels to prevent pancreatitis, and OFAs are indicated as an adjunct to diet.
4.3.5.4. Dosage
Daily dose of OFA of 4 g/day is recommended for severe hypertriglyceridemia. The daily dose may be taken as a single 4 g dose or as two 2 g doses. The capsule should be swallowed whole and not broken open or chewed. Lower doses (1–2 gm/d) may be sufficient for less severe hypertriglyceridemia.
4.3.5.5. Contraindications
People with sea fish allergy should be careful with OFA.
Prescription OFAs are pregnancy category C drugs and should be used during pregnancy only if the potential benefit to the patient justifies the potential risk to the fetus. It is not known whether OFAs are excreted in human milk, and therefore caution should be exercised when administering OFAs to a nursing woman.
4.3.5.6. Adverse effects
Dyspepsia, and/or taste perversion have been reported in 3–4% of patients in clinical studies. Some studies have demonstrated a prolongation of bleeding time, but the times reported have not exceeded normal limits and did not produce clinically significant bleeding episodes.
4.3.5.7. Clinical evidence
In patients with severe hypertriglyceridemia (levels > 500 mg/dl), 4 g prescription of OFA decreased triglycerides by 45%and increased HDL by 9>%. In patients treated with simvastatin 40 mg/day and having persistently elevated triglycerides in the range of 200–499 mg/dl, the addition of 4 g prescription OFA resulted in reductions in triglyceride levels by 23% and increases in HDL of 4.6%and LDL of 3.5%.
Japan EPA Lipid Intervention Study (JELIS), compared a low dose statin plus either EPA (1.8 g) or placebo. Subgroup analysis of primary prevention patients with baseline triglyceride levels>150 mg/dl and HDL <40 mg/dL demonstrated that the combination therapy reduced CVD risk by 53% compared with statin monotherapy.238 The effect of prescription OFA on CV mortality and morbidity in patients with elevated triglycerides has not been determined.
4.3.6. Ezetimibe
Ezetimibebelongs to a class of lipid-lowering compounds that selectively inhibit absorption of cholesterol by the small intestine.225
Ezetimibe reduces LDL-C and triglycerides and increases HDL-C in patients with combined hyperlipidemia. The maximal response is generally achieved within 2 weeks and maintained during chronic therapy. The addition of ezetimibe to either a statin or fenofibrate is more effective in lipid lowering than with either agent alone. However, the effect of ezetimibe as monotherapy or in addition to a statin or fenofibrate on CV morbidity and mortality has not been proven.239
4.3.6.1. Mechanism of action
Ezetimibe acts by interfering with a sterol transporter, which prevents transport of micelles into intestinal cells. The reduction in delivery of cholesterol to the liver causes a drop of hepatic cholesterol stores and a compensatory increase in LDL receptors and therefore increased clearance of cholesterol from the blood.240
4.3.6.2. Pharmacology
Ezetimibe is metabolized in the small intestine and liver via glucuronide conjugation with subsequent biliary and renal excretion. Both ezetimibe and its glucuronide metabolite have an elimination half-life of 22 h. Excretion of the drug is 78% in feces and 11% in urine. Ezetimibe is highly (>90%) bound to plasma proteins. It is neither an inhibitor nor an inducer of the CYP P450 isoenzymes.
4.3.6.3. Dosage
The recommended dose of ezetimibe is 10 mg once a day. Concomitant food administration has no effect on absorption, and ezetimibe can be administered with or without food. No dosage adjustment is necessary in patients with mild hepatic or renal impairment.
4.3.6.4. Contraindications
Ezetimibe is a pregnancy category C drugs. There are no adequate, well – controlled studies of ezetimibe in pregnant women.
4.3.6.5. Adverse effects
Ezetimibe monotherapy does not cause significant elevations of hepatic transaminases. The incidence of increased transaminases is marginally higher in patients receiving ezetimibe in combination with a statin (1.3%) compared to patients treated with a statin alone (0.4%). When used with a statin, liver function tests should be performed at the initiation of therapy and subsequently as recommended for statins.239
4.3.6.6. Clinical evidence
As monotherapy, ezetimibe produces LDL-C reductions of 15–25% but there is a compensatory increase in cholesterol synthesis. Combining it with statins results in greater decrease in LDL-C, as compared to ezetimibe monotherapy. The advantage of the combination is the low incidence of side effects, but the disadvantage is the lack of clinical outcome data for ezetimibe.225
In the Ezetimibe and Simvastatin in Hypercholesterolemia Enhances Atherosclerosis Regression (ENHANCE) trial, the addition of ezetimibe to statin therapy did not significantly change CIMT compared to statin monotherapy, despite a >50 mg/dl lowering of LDL in the combination therapy group.241
4.3.6.7. When to use
If treatment with a maximally tolerated dose of statin does not achieve the LDL-C goal selected for a patient (often in those with primary hyperlipidemia), intensification of LDL lowering drug therapy with ezetimibe may be considered. It is also indicated for use in combination with statin and fenofibrate for the reduction of elevated LDL-C and non-HDL-C in patients with mixed hyperlipidemia.
5. The 2013 ACC/AHA guidelines on lipid management and their relevance to the present document
The ACC and AHA, in collaboration with the National Heart, Lung and Blood Institute (NHLBI), have recently released new guidelines for the management of blood cholesterol in adults.133 These guidelines serve to update the previously available document for this purpose, the NCEP ATP III recommendations.67 However, unlike all the currently existing guidelines on lipid management, including those from the European Society of Cardiology68 and the American Diabetes Association,242 the new document proposes a complete paradigm shift in the approach towards lipid management and, therefore, has become a subject of intense controversy. The fundamental reason underlying this departure from the conventional principles is that the current document is purposefully based predominantly on data derived from randomized controlled trials (RCTs), systematic reviews and meta-analyses of RCTs. The expert committee identified a few critical questions and addressed them based on such available data, while choosing to make no recommendation, except in few circumstances, if a relevant RCT or meta-analysis was not available to answer a particular critical question. As a result, the document has become vastly different and less encompassing than its previous iterations. Given the far-reaching recommendations made in the new guidelines, a careful review of the same is required to determine their relevance to the Indian populations.
5.1. Key features of the new lipid guidelines
Following are the key recommendations of the new ACC/AHA lipid guidelines:
-
1.
The expert panel found no evidence to support the use of specific LDL–C or non-HDL–C targets for either primary or secondary prevention of CVD and therefore has not recommended any specific lipid targets.
-
2.Four major statin benefit groups were identified for whom at least moderate to high-intensity statin therapy was strongly recommended-
-
a.Those with clinically manifest atherosclerotic CVD,
-
b.Those with primary elevations of LDL–C >190 mg/dl,
-
c.Diabetics aged 40–75 years with LDL–C 70–189 mg/dl and without clinical CVD, or
-
d.Those without clinically manifest atherosclerotic CVD or diabetes with LDL–C 70–189 mg/dl and estimated 10-year CVD risk >7.5%.
-
a.
While high-intensity therapy is recommended for the first 3 groups, moderate-to high-intensity statin therapy is considered appropriate for the fourth group.
-
3.
Regular use of non-statin lipid-lowering drugs is discouraged, placing major emphasis on using appropriate dose statin therapy only.
-
4.
The expert panel made no recommendations regarding the initiation or discontinuation of statins in patients with functional class II–IV ischemic systolic heart failure or in patients on maintenance hemodialysis.
5.2. Relevance to Indian populations
5.2.1. Statin dose
The new guidelines recommend using high-intensity statin therapy, and if not possible then at least moderate-intensity therapy, in all the high risk groups identified. High-intensity statin therapy is defined as the one that results in ≥50% reduction in LDL-C from baseline whereas moderate-intensity is the one that lowers LDL-C by 30–50%. These recommendations are based on the fact that the large-scale RCTs showing benefit with statin therapy had used these dosages only and had resulted in this much reduction in LDL-C.133
It is well known that Asians respond more strongly to statins as compared to their western counterparts. Among Asians, atorvastatin 10–20 mg/d and rosuvastatin 5–10 mg/d have been shown to result in as much as 40–50% reduction in the LDL-C.243–247 In the IRIS study (Investigation of Rosuvastatin In South Asians), the largest statin efficacy trial in an exclusively South-Asian population, 740 patients in US and Canada received 6 weeks of treatment with rosuvastatin 10 or 20 mg/d and atorvastatin 10 or 20 mg/d. Nearly 40%, 47% and 45% reduction in LDL-C was seen with atorvastatin 10 mg, 20 mg and rosuvastatin 10 mg/d dose, respectively.247 It is believed that lower body mass index and slower statin metabolism are the possible reasons underlying heightened statin response in Asians.243,248–250
Unfortunately, no large-scale study has yet compared CV event reduction with regular dose versus high-dose statin therapy exclusively in Asian populations. However, it is noteworthy that in most of the larges-scale statin trials, the observed benefit on CV risk reduction was directly proportional to the reduction in LDL-C,251 suggesting that it may be possibleto achieve a similar degree of CV event reduction with lower dosages of statins in Asian populations. Indeed, in the MEGA (Management of Elevated Cholesterol in the Primary Prevention Group of Adult Japanese) trial enrolling 7832 individuals, 10–20 mg pravastatin every day resulted in 33% reduction in CHD events as compared to diet alone.252
Exaggerated statin response in Asians also raises concerns of increased risk of adverse effects. Although no causal relationship has been established, some studies have reported increased risk of hemorrhagic strokes and cancers in Asian patients achieving very low serum cholesterol levels.253–257 In contrast, a recent 12-week study in Indian patients presenting with ACS has demonstrated good safety and tolerability profile of intensive statin therapy.258 However, this study was small and had only a short follow-up. In addition, apart from the risk of side effects, high dose statin therapy is also associated with increased cost, which is an important consideration in Indian patients with limited financial affordability. Given these observations, it remains debatable to routinely recommend high dose statin therapy for Indian patients in whom the desired LDL-C reduction can be achieved with much lower dosages. A more prudent approach would be to start treatment with commonly used dosages and then up-titrate the dose if the desired magnitude of LDL-C reduction is not achieved.
5.2.2. LDL-C targets
While setting aside fixed LDL-C targets, the current guidelines assume that moderate or high-intensity statin therapy, once initiated, will result in at least 30–50% or >50% reduction in LDL-C, respectively. However, it is well known that individual responses and tolerability to statin therapy vary considerably, translating into variable magnitude of LDL-C reduction with variable degree of CV risk reduction. A patient having sub-optimal response to a particular statin dose is likely to benefit from further intensification of life-style measures, an increment in the statin dose and/or change of statin preparation to achieve adequate LDL-C reduction. However, in absence of a reference value, it becomes difficult to determine whether a particular patient has achieved a desired fall in LDL-C or not, particularly if the baseline lipid values are not available. These issues are especially relevant for Asian populations in whom lower statin doses are used very frequently and baseline lipid levels are often difficult to trace. Furthermore, successful achievement of LDL-C goal provides the patient with a sense of accomplishment, boosts his/her morale and motivates him/her further to continue with the treatment regimen. At the same time, persistently elevated LDL-C above the goal can help improve patient compliance to the treatment, particularly the adherence to life-style measures.
Considering these issues, the present consensus document advocates using a hybrid approach. Fixed LDL-C goals are defined to provide the treating physicians with a perspective on the anticipated CV risk in a given individual and to determine the aggressiveness of therapy. At the same time, among those high-risk patients who already have baseline LDL-C values close to the target levels, it is strongly recommended that adequate dose statin therapy be prescribed to achieve at least 40–50% further reduction in LDL-C. This is also consistent with the recent American Diabetes Association statement that continues to recommend fixed LDL-C targets for diabetic individuals.259
5.2.3. Non-statin drugs
Statins have the most profound effect on LDL-C, while also lowering TG to a lesser extent and raising HDL-C. As discussed in the previous sections, of all the available lipid-lowering agents, statins are known to be the most effective in reducing CV risk. However, it is also being increasingly recognized now that persistently elevated non-HDL-C in patients who have achieved adequate LDL-C reduction with statins is associated with increased CV risk.74,260 Lowering non-HDL-C in such patients can potentially lead to further CV risk reduction. As fibrates have potent action on triglycerides (and therefore non-HDL-C), they have been evaluated for this purpose. Two large trials-the FIELD and the ACCORD-studied fenofibrate, the most commonly used fibrate in clinical practice, in diabetic patients.134,221 While most patients in the FIELD trial were not on any statin, in the ACCORD study, fenofibrate was added on top of simvastatin. In both these trials, fenofibrate did not result in any significant reduction in the primary end-point in the overall study populations, but those with atherogenic dyslipidemia (increased TG and low HDL-C) derived significant benefit.134,222 Furthermore, fenofibrate also reduced the risk of microvascular complications of diabetes.221 Other large fibrate trials have also shown similar CV risk reduction in patients with atherogenic dyslipidemia.135 These observations render fenofibrate a useful agent for lipid management in Indians in whom atherogenic dyslipidemia is widely prevalent. Considering this, the present consensus committee advocates use of fenofibratein patients who continue to have elevated non-HDL-C despite adequate dose of statin therapy and intensive life-style measures. However, at the same time, it must be re-emphasized that treatment with any non-statin lipid lowering agent should not be happen at the cost of adequate statin therapy.
6. Special situations
6.1. Diabetes mellitus
6.1.1. Type 2 diabetes
Type 2 diabetes is a common co-morbid condition encountered in the lipidology clinic. It is a major risk factor for CVD and increases the risk of CVD by five times in women, and three fold in men. It has been demonstrated that people with diabetes and no history of MI have a CV risk nearly equivalent to those without diabetes and a history of MI.67 The mechanisms postulated to cause rapid development of vascular disease in diabetes include hyperglycemia, hypertension, low HDL-C, high triglyceride levels, elevated small-dense LDL, increased pro-coagulant activity and a pro-inflammatory milieu.261 It stands to reason, therefore, that lipid management is an essential part of diabetes care.
6.1.1.1. Screening and investigations
As mentioned above, people with diabetes are classified as high risk patients for vascular events. Hence, irrespective of the presence or absence of other risk factors on history (age, gender, smoking, hypertension, family history) or physical examination (obesity, hypertension, polycystic ovary syndrome in woman), they should be screened for dyslipidemia.
A fasting lipid profile should be performed annually. The minimum investigations should include TC, LDL-C, TG, and HDL-C. Non-HDL-C should be routinely calculated in these patients given the higher prevalence of elevated triglycerides and small-dense LDL among diabetics. In addition, estimation of Apo-B levels is also desirable in these patients. However, routine assessment of these markers is not mandatory.
6.1.1.2. Goals of therapy
As all patients with type2 diabetes with evidence of target organ damage or other CV risk factors and those with type 1 diabetes with microalbuminuria are automatically designated to high risk category, they require management which is similar to that for secondary prevention of CVD.67,68 In other patients, formal risk assessment may be needed. The treatment approach is broadly same as that for any high risk individual without diabetes, as described in the previous sections. The primary target is LDL-C, while non HDL-C, HDL-C and apoB are secondary targets.68 The present document reiterates the fact that these goals are global, i.e. for both genders and for all adults. However, in children and adolescents, the acceptable LDL-C level is relaxed to 110 mg%.68,261
6.1.1.3. Non-pharmacological therapy
Management of dyslipidemia in diabetes is similar to that in people without diabetes. Non-pharmacological therapy viz physical activity, cessation of smoking, and healthy nutrition therapy are important aspects of therapy and should follow the same principles as outlined in the previous sections. However, it should be noted that dietary fructose leads to hypertriglyceridemia if consumed in excess of 10% of total energy intake, in spite of its low glycemic index. Therefore, a careful dietary review focusing on fructose intake is required for all persons with hypertriglyceridemia.
6.1.1.4. Pharmacological therapy
6.1.1.4.1. Statins
The choice of drug therapy is similar in dyslipidemic persons with and without diabetes.261,262 The present guidelines strongly recommend statin therapy despite the fact that certain studies document a rise in incidence of diabetes with these drugs. Meta-analysis has shown that statin use is linked to a higher (9%) risk of development of new – onset diabetes, especially in older persons. However, the risk: benefit ratio of statins is strongly tilted in favor of drug use.263
Although the choice of statin in diabetes is broadly similar to that in people without diabetes, there are some important differences in the impact of different statins on the glycemic control. Glucose neutral effects have been reported for pravastatin. Simvastatin has been show to inhibit glucose-induced insulin secretion through blockade of L-type Ca2+ channels in β cells. Atorvastatin is thought to suppress glucose transporter GLUT4 expression in 3T3_L1 adipose cells by blocking isoprenoid synthesis. Cytotoxic effects on the β cell have also been reported for atorvastatin. Another postulated mechanism is through activation of SREBPs (Sterol Regulatory Element-Binding Proteins). Pitavastatin use has been reported to be devoid of the adverse effects on glycemia that are reported with atorvastatin. Pitavastatin, in fact, demonstrated a beneficial effect on HbA1c in subjects with diabetes who were enrolled in the LIVES study.264 Differences in the metabolic pathways for various statins may explain these differential effects on glycemic control. Pitavastatin is minimally metabolized by the CYP3A4 isoenzyme, unlike other statins, and this may be responsible for its glucose-neutral character.
The patients with diabetes often have multiple co-morbidities and are recognized to be in a ‘poly-medicated’ state. Therefore, lipid therapy in diabetics should have low risk of drug–drug interactions. While most statins are safe, one should be aware of potential drug–drug interactions. Antifungal agents such as itraconazole, commonly prescribed in diabetes, may increase atorvastatin and simvastatin concentrations by inhibiting CYP3A4, which metabolizes these statins.
6.1.1.4.2. Fibrates
Fenofibrate is the most widely used fibrate compound, and is recommended for use as add-on to statins. Addition of fenofibrate to statin therapy may benefit patients with diabetes, hyperglyceridemia and low HDL-C.134,221Gemfibrozil can also be used in patients with TG >200 mg% and HDL-C <40 mg%, who do not respond to statin monotherapy. However, it does not offer any advantages as compared to fenofibrate. Monotherapy with fibrates is suggested only in patients with isolated hypertriglyceridemia who do not tolerate statin therapy, even at low doses.
6.1.1.4.3. Other drugs
Colesevelam, is a bile acid sequestrant, is a lipid-lowering drug which has been approved for use as an oral hypoglycemic agent as well.265 However, this does not make it a first line drug for use in dyslipidemia complicated by diabetes. Cholesterol absorption inhibitors (e.g. ezetimibe) have no impact on glycemia, and can be used in combination with statins. Niacin is not recommended for use now.
6.1.1.5. Choice of anti-diabetic drugs
Insulin, when used to manage hyperglycemia, also corrects hypertriglyceridemia. Similarly, management of insulin resistance helps manage dyslipidemia as well.261 Diabetic patients with severe hypertriglyceridemia (>440 mg%) should be admitted if symptomatic, or at risk of developing acute pancreatitis, and started on insulin therapy to achieve tight glycemic control.
Although pioglitazone has been shown to have beneficial effects on lipids,266 there have been questions marks about its safety, particularly the risk of bladder cancer. Additionally, pioglitazone is also not safe in patients with heart failure. Incretin-based therapy, including the glucagon-like peptide 1 analogs (liraglutide, exenatide) and gliptins (vildagliptin, alogliptin, sitagliptin) also improve deranged lipid levels in patients with diabetes. This effect is likely mediated through reduction in lipolysis and an improvement in the metabolism of postprandial intestinal triglyceride-rich lipoprotein particles.267
6.1.1.6. Special situations within diabetes
Statins are safe to use in non-alcoholic steatohepatitis, with mild to moderate elevation of liver enzymes. Obese individuals with diabetes and dyslipidemia should be treated in a manner similar to those without other features of metabolic syndrome. Atorvastatin has been shown to have relatively less benefit in obese persons in the REVERSAL (Reversal of Atherosclerosis with Aggressive Lipid-Lowering Therapy) study268 and CHIBA trial.269 The lipophilic nature of the drug may promote drug redistribution in the adipose tissue, thus reducing its efficacy. Pitavastatin has been reported to have better results in obese persons. This effect may be due to an increase in lipoprotein lipase expression in 3T3-L1 preadipocytes, which is otherwise suppressed in insulin resistance.
6.1.1.7. Monitoring
In persons who experience deterioration of diabetes control and/or considerable weight gain, frequent lipid estimations are advisable. Lipid profile can be checked at 6 weekly intervals till goals are achieved. People with sudden worsening of glycemia after initiation or escalation of statin therapy may benefit from temporary cessation of the offending drug, or substitution with another statin molecule with different metabolism.
Liver enzymes should be assessed along with routine diabetes monitoring, especially before and 3 months after initiation of pharmacotherapy. Creatine Kinase should be measured only in patients with myalgia. Bile acid sequestrants (cholestyramine, colestipol, colesevelam) may reduce blood glucose and increase TG, and careful monitoring should be done in patients with diabetes.
6.1.2. Pre diabetes
As the underlying pathophysiology is similar, the patients with pre-diabetes (i.e. impaired fasting glucose or impaired glucose tolerance) are equally prone to develop CVD, as are those with frank diabetes. Hence, the treatment strategies and goals of management are also the same.261
6.1.3. Type1 diabetes
Patients with type 1 diabetes develop atherosclerosis earlier than others, with a more rapid progression, and experience higher premature mortality due to vascular disease. This is in spite of the fact that they enjoy higher HDL-C levels and rarely exhibit insulin resistance. This apparently ‘healthy’ profile, characteristic of type 1 diabetes, is explained by the action of exogenous insulin therapy. Insulin increases lipoprotein lipase activity in skeletal muscle and adipose tissue, which catabolizes VLDL-C, and reduces TG and LDL-C. The paradoxical increase in CV mortality is due to atherogenic changes in the composition of HDL and LDL particles.68 The factors associated with increased risk of CVD in type 1 diabetes include proteinuria, previous history of MI, high HbA1c >10.4%, prolonged duration of disease (>16years), presence of metabolic syndrome, and elevated high-sensitive CRP >3.0 mg% levels.67,68,190
6.1.3.1. Screening
Screening for dyslipidemia should be carried out from the age of 12 onwards, in fasting state, only after stabilizing diabetes. If there is a family history of hypercholesterolemia, early CVD or if the family history is unknown, screening should start at the age of 2 years itself. If normal results are obtained, screening should be repeated every 5 years, till adulthood, and yearly thereafter.270
6.1.3.2. Goals
There is a controversy regarding goals for lipid levels in children with type 1 diabetes. While the American Academy of Paediatrics, and American Association of Clinical Endocrinologists support softer LDL-C targets (normal <110 mg/dl, high >130 mg/dl, borderline 110–130 mg/dl), the International Society for Pediatric and Adolescent Diabetes suggests that the target for LDL-C should be <100 mg/dl. The presentdocument supports the same target levels for lipids, irrespective of age, gender or type of diabetes.
6.1.3.3. Management
Management of dyslipidemia in type 1 diabetes is similar to that of type 2 diabetes. If interventions to improve metabolic control and dietary changes fail to achieve the targets, statins should be considered, though long-term safety is not established. Rosuvastatin, atorvastatin and simvastatin are approved for use above 10 years of age, while colesevalam is approved in children aged 8 years and more.
6.2. Metabolic syndrome
The metabolic syndrome is a constellation of closely-linked metabolic and hemodynamic abnormalities, including central obesity, dyslipidemia, hyperglycemia and hypertension, and is associated with increased CV risk. Apart from these common abnormalities, metabolic syndrome has also been shown to be associated with hyperuricemia, polycystic ovarian syndrome and non-alcoholic steatohepatitis, etc.271 Although insulin resistance is a key abnormality in metabolic syndrome, the exact relationship between insulin resistance and the cause of the metabolic syndrome remains unclear at present. The new data reveals that it possibly has origins in an adverse lifestyle in the early years of life.272
Dyslipidemia is an integral component of metabolic syndrome and is a risk factor for atherosclerotic vascular disease. Therefore, appropriate management of dyslipidemia is an important goal of treatment in these patients.
6.2.1. Diagnosis and general management of the metabolic syndrome
Worldwide, modified ATP-III criteria are being used for the diagnosis of metabolic syndrome, with different cut-off values for different ethnic groups.273 These criteria have been appropriately modified for Indian population also.274
Though the presence of the metabolic syndrome heightens CV risk, it remains controversial whether itimparts incremental risk over and above its individual components. For this reason, several investigators have questioned the clinical utility of the diagnosis “metabolic syndrome” itself. Indeed, in a recent proposal to the WHO, experts opined that the term metabolic syndrome be used only for research, and not to guide clinical practice.275 The experts also cautioned against applying the diagnosis of metabolic syndrome to subjects with established coronary disease. Nevertheless, the present consensus document proposes some practical suggestions to manage dyslipidemia in these subjects.
6.2.2. Screening
Screening for dyslipidemia should be carried out annually in all persons with one or more features of metabolic syndrome, viz, diabetes, obesity and hypertension. Presence of any feature of metabolic syndrome should trigger a careful assessment of associated features. The minimum screening evaluation recommended in persons with metabolic syndrome is a fasting lipid profile, consisting of TC, TG, HDL-C and LDL-C. Metabolic syndrome is characterized by elevation of triglycerides, Apo B, small-dense LDL, as well as a fall in HDL-C and Apo A1. Therefore, estimation and correction of non-HDL-C is very important in these patients. In addition, as in diabetics, measurement of Apo B levels may be desirable but not routinely recommended.
Assessment and relatively more frequent follow up of lipid levels is indicated in the following clinical or laboratory situations in metabolic syndrome-
-
1.Clinical
-
•rise in blood pressure
-
•worsening of glycemia
-
•gain in weight
-
•
-
2.Drug-related
-
•addition
-
•discontinuation
-
•significant change in dose of anyanti-hypertensive, anti-diabetic, anti-obesity drug, or other drug expected to have a(n)-
-
○effect on lipid levels
-
○drug–drug interaction with lipid-lowering therapy
-
○
-
•
-
3.Biochemical
-
•worsening of HbA1c
-
•rise in liver enzymes
-
•
6.2.3. Goals of therapy
The targets for therapy are similar to those in patients without metabolic syndrome. The primary therapeutic goal is normalization of LDL-C, while non HDL-C and Apo B are secondary therapeutic objectives.
6.2.4. Management
Eulipidemic obesity itself is not an indication for pharmacological lipid lowering therapy and therefore not all patients with metabolic syndrome need lipid lowering therapy. The need and the choice of lipid-lowering therapy should be guided by the severity and the pattern of dyslipidemia.
Lifestyle modification, consisting of physical activity and nutrition, is extremely important for these patients, particularly when lipid levels are significantly deranged. Drugs should be initiated in those who have dyslipidemia, and in normolipidemic persons aged >40 years who have concomitant diabetes (to keep the LDL-C levels below 100 mg/dl).
6.2.4.1. Weight reduction
Weight reduction is the central pillar of management, both for metabolic syndromeitself and for dyslipidemia. Weight reduction improves insulin sensitivity, and favorably affects lipid levels. Maximal effect is observed on TG (20–30%), with HDL-C (0.4 mg% increase per kg body weight lost) and LDL-C (0.8 mg % fall per kg body weight loss) showing lesser benefit. Exercise per se has significant effects on HDL-C (3.1–6 mg% increase in HDL-C with 1500–2200 kcal/week of aerobic exercise), but not on LDL-C.
6.2.4.2. Pharmacological management of dyslipidemia
The choice of therapy for dyslipidemia is based upon the type of lipid abnormality and not the presence or absence of various components of metabolic syndrome. The dosages of lipid-lowering therapy also depend upon the extent of lipid-lowering required, not upon body weight, blood pressure, or glycemia.
Statins do not affect body weight and can be used irrespective of body mass index. Bile acid sequestrants, such as colesevalam, improve glycemia and are approved for use as anti-diabetic drugs as well. However, this alone does not make them drug of choice in metabolic syndrome with diabetes and dyslipidemia, as there is a paucity of event-driven randomized controlled trial data with these medications. The presence or otherwise of metabolic syndrome does not impact the choice of, or dosage of, statins or ezetimibe or fibrates.
Summary
The metabolic syndrome is a cluster of risk factors that heighten CV risk. There is no large multicenter randomized controlled study of CV outcomes in persons with metabolic syndrome. In the absence of such data, the treatment of the metabolic syndrome should continue to be tailored according to the various individual components of metabolic syndrome. In subjects with type 2 diabetes, established atherosclerotic vascular disease, or severe obesity, the diagnosis of metabolic syndrome is not really relevant, as treatment, including lipid management, will be based according to these concomitant conditions.
6.3. Acute coronary syndrome
Acute coronary syndrome (ACS) continues to present a major challenge to clinicians because of its increasing incidence and because of the subsequent high risk of recurrent ischemic CV events. As most of the acute coronary events result from rupture of non-obstructive plaques, preventive strategies, including lipid management, assume critical importance after ACS and early and intensive lipid modifying therapy is considered to be mandatory after an acute coronary event.
6.3.1. Effect of recent acute coronary syndrome on lipid and lipoprotein measurements
To determine the relationship between plasma lipids and lipoproteins and prognosis after ACS and to guide a rational approach to therapy, lipids and lipoproteins need to be ideally measured under steady-state metabolic conditions. However, ACS is often accompanied by an acute systemic inflammatory response, manifest by fever, leukocytosis, elevation of erythrocyte sedimentation rate, and an alteration in the profile of plasma proteins known as the acute-phase reactants. Some acute-phase reactants, such as CRP, increase in concentration, while HDL and LDL decrease, resulting in a decrease in HDL-C and LDL-C levels. The time course of lipoprotein changes after ACS has been characterized and reviewed by Rosenson.276 The levels may begin to decrease within 24 h after an ACS event, particularly among those with more extensive myocardial necrosis, reach a nadir at approximately 1 week and then gradually recover.277,278 A metabolic steady-state is usually re-attained by 1 month following ACS.279,280 The most pronounced lipid changes seen after ACS are-decreased levels of LDL-C, a similar decrement in HDL-C and a smaller increase in TG and Lp(a). The magnitude of changes is variable & is related to the extent of myocardial necrosis, with the largest changes generally observed after extensive transmural MI& smaller to insignificant changes after limited infarction or unstable Angina. After an extensive MI, it is not uncommon to observe a nadir in LDL-C that is 30% or more below baseline. Concurrent drug therapy may also influence lipid measurements after ACS. For example, initiation of beta-blocker therapy may contribute to a rise in TGs. The practical implications of all these acute phase effects is that, after an acute coronary event, accurate measurement of lipid levels is best made either at the time of presentation or several weeks later. Nonetheless, it is fair to say that if LDL-C levels are higher than desirable during acute phase following ACS, they will almost certainly be undesirably high during metabolic steady state.
6.3.2. Is there any influence of lipoprotein and lipids on long & short term prognosis after ACS?
There is strong epidemiological data linking elevated levels of atherogenic lipoproteins particularly LDL-C& reduced levels of protective lipoproteins particularly HDL-C to initial development of CHD. Similarly, in patients with stable CHD e.g. patients with stable angina pectoris, remote MI or prior coronary revascularization, substantial evidence from observational studies & placebo controlled trials of statins indicates that long term prognosis is adversely affected by derangement of plasma lipoproteins. Relationship between high LDL-C and low HDL-C with CV events persists among patients treated with statins in randomized trials.
In ACS, the scenario is different. Each 1 mg/dl increase in LDL-C measured 1–4 days after ACS (prior to assignment to statin or placebo), the hazard ratio for an ischemic CV event has been 1.0 i.e. a null relationship, supporting the lack of relationship between LDL-C & short term prognosis after ACS. The absence of a relationship between LDL-C levels & short term risk is likely to be the result of 2 counterbalancing factors. On one hand, higher levels of LDL-C may be associated with increased risk through promotion of atherosclerosis, while on the other, lower levels of LDL-C may indicate greater acute phase depression of LDL-C resulting from larger infarcts and therefore associated with increased risk.
6.3.3. Evidence supporting early and intensive statin treatment after acute coronary syndrome
Until recently, lipid-lowering drug therapy was viewed as a long-term strategy to reduce CV risk, rather than an intervention to be employed in the short-term management of patients after ACS. The conventional viewpoint was based on experimental and angiographic evidence that lipid lowering promotes gradual removal of lipid from atherosclerotic plaques, leading to gradual, modest regression of arterial stenoses. The conventional view was also based on landmark clinical trials that established the efficacy of statin treatment in reducing CV morbidity and mortality in patients with stable coronary heart disease. These landmark trials included the Scandinavian Simvastatin Survival Study (4S),281 Cholesterol and Recurrent Events (CARE) study,279 Long-Term Intervention with Pravastatin in Ischemic Disease (LIPID) study,280 and Heart Protection Study.282 In each of these trials, patients with ACS within preceding 3–6 months were excluded and 1–2 years of statin treatment was required before a reduction in events could be discerned. Furthermore, all these trials employed moderate intensity statin treatment such as pravastatin 40 mg daily or simvastatin 20–40 mg daily. However, in ACS population, potentially modifiable pathophysiological changes in the vessel wall occur at a much faster pace. Both experimental and clinical evidence indicate that statins have the potential to act rapidly to normalize the interface between blood stream and the vessel wall. Such effects include anti-inflammatory actions, improvement in endothelial integrity and function, antithrombotic effects and favorable plaque remodeling. These effects are independent of the concurrent reduction of LDL-C and are the most pronounced at high doses of statins. It is therefore possible that high intensity treatment (i.e. the highest doses and/or use of the most potent statins), when initiated early after ACS, can result in potential benefit in terms of CV risk reduction.
6.3.3.1. Observational data supporting statin treatment after acute coronary syndrome
The clinical evidence supporting early statin therapy after ACS consists of observational analyses & randomized controlled trials. The former category generally supports a benefit of early statin therapy, but individual analyses vary widely in magnitude of the estimated effect. A Swedish cohort of 20,000 patients who suffered first MI was followed prospectively for 1 year. After adjusting for 42 covariates & a propensity score for statin use,prescription of a statin drug at hospital discharge was associated with a reduction in 1-year mortality compared with discharge without statin treatment (relative risk 0.75; p = 0.001).283 Similar findings were obtained in a multivariate analysis of more than 20,000 patients with ACS enrolled in the GUSTO (Global Use of Streptokinase or t-PA for Occluded Coronary Arteries) and PURSUIT (Platelet Glycoprotein IIb/IIIa in Unstable Angina: Receptor Suppression Using Integrilin Therapy) studies. Use of lipid lowering therapy at hospital discharge was associated with odds ratio of 0.67 (P = 0.02) for death at 6 months compared with no lipid lowering therapy.284
6.3.3.2. Randomized clinical trials of statins in ACS
There are six large randomized trials conducted in ACS patients (Table 14). Out of these, 3 large trials- MIRACL (Myocardial Ischemia Reduction with Aggressive Cholesterol Lowering),285 A-to-Z (Aggrastat to Zocor)288 and PROVE-IT TIMI 22 (Pravastatin or Atorvastatin Evaluation and Infection Therapy–Thrombolysis In Myocardial Infarction 22)287- provide the foundation for our current understanding of the role of statins after ACS. None of these trials imposed a lower limit on total or LDL-C at base line, and each had an upper limit of TC at randomization of 240–270 mg/dl. The MIRACL trial showed that early and intensive statin therapy after ACS was an efficient and effective intervention. The 4 months composite endpoint of death, reinfarction, cardiac arrest, or recurrent unstable angina was reduced from 17.2% in placebo group to 14.6% in the atorvastatin 80 mg group.285 In the PROVE-IT TIMI 22 study, the composite endpoint of death, reinfarction, stroke, recurrent unstable angina or unanticipated coronary revascularization was reduced from 26.3% in the pravastatin 40 mg group to 22.4% in the atorvastatin 80 mg group at 2 years (p = 0.005). The difference between the event rates in the two groups became statistically significant at 6-months.287 Thus, MIRACL trial demonstrated superiority of high intensity statin over placebo in a 4 month period following ACS whereas PROVE-IT TIMI 22 demonstrated superiority of high intensity statin treatment over moderate intensity treatment over a 2-year period following ACS. In contrast, the results of A-to-Z trial did not show any significant benefit of moderate intensity treatment over placebo early after ACS. During the 4 month placebo controlled phase of A-to-Z, event rates were 8.2% in the simvastatin 40 mg group & 8.1% in the placebo group. However, in the active comparator phase of A-to-Z, high intensity statin treatment provided greater benefit than moderate intensity statin treatment. Treatment with simvastatin 80 mg from 4-months to 2 years resulted in significantly fewer events compared with treatment with simvastatin 20 mg over this period of time. Thus, A-to-Z also supports the efficacy of high intensity statin treatment after ACS.288
Table 14.
Major randomized controlled trial of statins after acute coronary syndrome.
| Trial, year | n | Statin | Comparator | Duration | Mean LDL-C (mg/dl; statin v/s comparator) | % Of primary event (statin v/s comparator) |
|---|---|---|---|---|---|---|
| MIRACL, 2001285 | 3086 | Atorvastatin 80 mg | Placebo | 4months | 72 v/s 135 | 14.8 v/s 17.4 |
| FLORIDA, 2002286 | 540 | Fluvastatin | Placebo | 1 yr | 104 v/s 151 | 33 v/s 36 (NS) |
| PROVE-IT TIMI 22, 2004287 | 4162 | Atorvastatin 80 mg | Pravastatin 40 mg | 2 yrs | 62 v/s 95 | 22.4 v/s 26.3 |
| A to Z, 2004288 | 4497 | Simvastatin 40 mg | Placebo + simvastatin 20 mg | 4 months | 66 v/s 81 | 14.4 v/s 16.7 |
| PACT, 2004289 | 3408 | Pravastatin 20–40 mg | Placebo | 1 month | Not measured | 11.6 v/s 12.4 (NS) |
A to Z = Aggrastat to Zocor, FLORIDA- Fluvastatin on Risk Diminishing after Myocardial Infarction, MIRACL- Myocardial Ischemia Reduction with Aggressive Cholesterol Lowering, NS- not significant, PACT- Pravastatin in Acute Coronary Treatment, PROVE-IT TIMI 22- Pravastatin or Atorvastatin Evaluation and Infection Therapy–Thrombolysis In Myocardial Infarction 22.
6.3.3.3. Is greater reduction in LDL-C with intensive statin treatment reduces early recurrent events after ACS?
Unfortunately, data from 3 key randomized trials do not support such a simple explanation. In fact, at 4 months of randomized treatment in the A-to-Z trial, average LDL-C concentration was 62 mg/dl in the simvastatin 40 mg group & 124 mg/dl in the placebo group, while at the same time point in the MIRACL trial, LDL-C averaged 72 mg/dl in the atorvastatin 80 mg group & 135 mg/dl in the placebo group. Thus, the difference in LDL-C between active treatment & placebo groups was nearly identical in both trials (62-62 mg/dl) but atorvastatin at 80 mg reduced clinical events in MIRACL while simvastatin 40 mg did not in A-to-Z. Moreover, analysis of MIRACL did not demonstrate a relationship between LDL-C concentration during randomized treatment & risk of an ischemic event.285,288 Thus, it appears that factors other than LDL-C reduction determine whether statin therapy is beneficial in the early period after ACS.
6.3.4. Should CRP or other inflammatory markers be targets of therapy after ACS in addition to low density lipoprotein cholesterol?
The role of inflammation in the pathogenesis of atherosclerosis, the relationship between risk after ACS& elevated levels of inflammatory markers such as CRP & the beneficial effect of statins on CRP levels lead to the question of whether CRP (or other inflammatory biomarkers) should be the primary target of therapy in patients with ACS. Current data do not support such an approach, at least in regard to CRP. The conventional paradigm is that inflammation in the arterial wall leads to release of nanogram per liter quantities of inflammatory cytokines such as interleukins, which act on the liver to stimulate synthesis & release of milligram per liter quantities of CRP. Thus, the liver amplifies inflammatory stimuli from sites such as the vasculature, which are then reflected by circulating CRP concentrations. While this paradigm may explain the relation between atherosclerosis & elevated levels of CRP, the reduction of CRP with statin therapy may not necessarily reflect suppression of vascular inflammation. This is because statins exert direct effects on the liver to suppress CRP expression. Therefore, it is possible that reduction in CRP with statin therapy primarily reflects suppression of hepatic CRP production rather than attenuation of vascular inflammation. In sum, CRP has been validated as a risk marker after ACS, but not yet as a primary target of therapy.
6.3.5. Safety of intensive statin therapy in ACS
Atorvastatin 80 mg has been proven to be remarkably safe in large clinical trials. In the combined atorvastatin 80 mg arms in the MIRACL, PROVE-IT and TNT (Treat –to-New-Target) trials, there weretotal six cases of rhabdomyolysis in 59000 patient-years of assigned treatment, an incidence no higher than that with placebo. Thus, vast majority of patients with ACS can be treated safely with higher doses of statins. However, it is important to recognize the factors that increase the risk of rhabdomyolysis, such as advanced age, renal or hepatic dysfunction, hypothyroidism, etc.
There have been concerns about the safety of high-dose statin therapy in Asians. Although no causal link could be established, an increase in cancer mortality and hemorrhagic stroke has been reported in some of the studies, particularly those involving Japanese populations.253,255–257Recently, a short-term (12 weeks) randomized study comparing two different doses of atorvastatin (80 mg and 40 mg) was conducted in Indian patients presenting with ACS.258 Both doses of atorvastatin were well tolerated with no dose-related differences in incidence of adverse events between the two treatment groups. No patient had elevation of (≥3 times of upperlimit of normal) liver enzymes or creatinine phosphokinase whereas only one patient on atorvastatin 80 mg complained ofmyalgia. However, as mentioned above, this was only a short-term study and involved only 236 patients.
6.3.5.1. Incident diabetes with intensive statin therapy
In a pooled analysis of data from 5 statin trials (PROVE IT, A-to-Z, TNT, IDEAL and SEARCH) intensive-dose statin therapy was associated with an increased risk of new-onset diabetes compared with moderate-dose statin therapy.290 The odds ratios were 1.12 (95% confidence interval 1.04–1.22) for the development of new-onset diabetes and 0.84 (95% confidence interval 0.75–0.94) for CV events in participants receiving intensive therapy compared with moderate-dose therapy. As compared with moderate-dose statin therapy, 498 patients needed to be treated per year with intensive-dose statin therapy to result in one new case of diabetes while the number needed to treat for preventing one new CV event was 155. Thus, the benefit clearly outweighed the risk of inducing mild hyperglycemia with intensive statin therapy.
6.3.6. Translating clinical trials to clinical practice
Based in part on the data from MIRACL & PROVE IT TIMI 22, the National Cholesterol Education Program recommended an optional target for LDL-C of less than 70 mg/dl in patients considered to be at very high risk of CV events, including those with recent ACS.251 On the surface, this recommendation appears to be consistent with the finding of the clinical trials in which LDL-C averaged 62–70 mg/dl in the Atorvastatin 80 mg arm. However, the PROVE-IT TIMI 22 trial found progressively lower risk with progressively lower achieved LDL-C level in the atorvastatin 80 mg arm, extending even to those patients with LDL-C level less than 40 mg/dl. Therefore, it would appear to be illogical to attenuate the intensity of therapy to achieve an LDL-C level of 70 mg/dl when a higher statin dosage might drive LDL-C even lower. Thus, given the data supporting efficacy & safety of high intensity statin treatment after ACS, it would be reasonable to apply this strategy of initiation of high dose statin therapy to the majority of patients presenting with ACS, rather than titrating the intensity of statin treatment to achieve an LDL-C level of 70 mg/dl. In all patients, the goal of the treatment should be to achieve at least 40–50% reduction in LDL-C, irrespective of the baseline levels.
In Indians also, it is recommended that high-dose statin therapy to be prescribed to all patients presenting with an acute coronary event. However, as the data about safety of high-dose statin therapy in Indians is limited to only 3 months' period, it is reasonable to reduce statin dose,3 months after initial presentation with ACS, to levels sufficient enough to sustain desired LDL-C reduction (at least 40–50% from baseline).
6.4. Chronic kidney disease
The number of patients with chronic kidney disease (CKD) is increasing but the survival of these patients remains dismal, largely due to premature CVD. As a matter of fact the risk attributable to CKD is so high that it deserves to be considered tobe a ‘CAD risk equivalent’ and the risk factors should be managed accordingly.291
6.4.1. Target population
CKD is defined according to the presence, for at least 3 months, of either of the following:
-
1.
Structural or functional abnormalities of the kidneys, with or without decreased GFR. These abnormalities are manifested either as pathological abnormalities or markers of kidney damage, including abnormalities in the composition of blood or urine, or abnormalities in radiographic imaging tests.
-
2.
GFR <60 ml/min/1.73 m2.
The definitions of stages 1–5 CKD are based on measured or estimated GFR, where the GFR is estimated from the serum creatinine using an established formula, as described in the NKF K/DOQI (National Kidney Foundation Kidney Disease Outcomes Quality Initiative) CKD Guidelines.292
-
•
Stage 1 CKD is defined as estimated GFR ≥ 90 ml/min/1.73 m2, with evidence of kidney damage (as defined above).
-
•
Stage 2 CKD is defined as evidence of kidney damage with mildly decreased GFR of 60–89 ml/min/1.73 m2.
-
•
The level of estimated GFR, with or without kidney damage, defines stages 3–4 (30–59 and 15–29 ml/min/1.73 m2, respectively).
-
•
Stage 5 (kidney failure) is defined as GFR <15 mL/min/1.73 m2, or the clinical indication for renal replacement therapy in the form of maintenance hemodialysis, peritoneal dialysis, or transplantation.
Thus, some Stage 5 patients may need renal replacement therapy because of uremic symptoms, even when, based solely on GFR they would be classified in stage 4 (GFR 15–29 mL/min/1.73 m2). An interesting sub-set is kidney transplant patients who have normal kidney function (GFR ≥ 90 mL/min/1.73 m2) and therefore may not have CKD according to the conventional CKD criteria. In addition, they may also not have evidence of kidney damage, i.e. they have normal urine protein excretion, urine sediment, histology, and radiographic imaging. However, these patients are still at increased risk for CKD related complications and thus considered within the scope of this guideline.
6.4.2. CKD and dyslipidemia
Patients with CKD have high prevalence of dyslipidemias and CAD293–296 and the general guidelines for management of CVD, such as the updated guidelines of the ATP III,67 are applicable to patients with stages 1–4 CKD as well (Table 15). However, as mentioned above, CKD needs to be classified as a CAD risk equivalent and the management approach needs be modified accordingly. Apart from this, there are some additional issues that need to be considered-
-
•
Relation between dyslipidemia and mortality in CKD
-
•
Therapy for dyslipidemia in CKD
-
•
Complications of lipid-lowering therapies that may result from reduced kidney function
Table 15.
The management of dyslipidemia in adults with chronic kidney disease.
| Dyslipidemia | Goal | Initiate | Increase | Alternative |
|---|---|---|---|---|
| TG ≥ 500 mg/dl | TG < 500 mg/dl | Lifestyle changes | Lifestyle changes + fibrate or niacin | Fibrate or niacin |
| LDL-C 100–129 mg/dl | LDL-C < 100 mg/dl | Lifestyle changes | Lifestyle changes + low-dose statin | Bile acid sequestrant or niacin |
| LDL-C ≥ 130 mg/dl | LDL-C < 100 mg/dl | Lifestyle changes + low-dose statin | Lifestyle changes + max-dose statin | Bile acid sequestrant or niacin |
| TG ≥ 200 mg/dl and non-HDL-C ≥ 130 mg/dl | Non-HDL-C < 130 mg/dl | Lifestyle changes + low-dose statin | Lifestyle changes + max-dose statin | Fibrate or niacin |
6.4.3. Relationship between serum cholesterol levels and mortality in CKD
Unlike the patients without CKD, the relationship between cholesterol levels and CVD mortality in those with CKD is more complex. A review of observational studies of dialysis patients demonstrated a reverse relation between TC levels and risk of all-cause mortality such that lower cholesterol levels were associated with a higher mortality rate.297 In another analysis of data from more than 12,000 hemodialysis patients, patients with low TC levels (less than 100 mg/dl) had over 4 times the mortality risk of patients with TC levels between 200 and 250 mg/dl.298 A more recent 10-year prospective study evaluated the importance of TC levels in 1167 chronic hemodialysis patients in Japan.299 When compared to a reference group with TC between 200 and 220 mg/dl, hypocholesterolemia was associated with a significantly higher all-cause mortality rate. Hypocholesterolemia also correlated closely with low serum albumin and high CRP levels, suggesting that it perhaps served as a surrogate for malnutrition or inflammation. On the other hand, in patients with high serum albumin levels, elevated TC was a strong predictor of CV death. Similarly, in another study of dialysis patients, in the absence of inflammation and malnutrition, elevated TC was associated with increased risk of CVD events, while the presence of inflammation attenuated the relationship between hypocholesterolemia and CVD.300
6.4.4. Treatment of dyslipidemia in CKD
There are no randomized controlled intervention trials in CKD patients showing that the treatment of dyslipidemias reduces the incidence of CVD. Moreover, it is possible that trial results from the general population may not be applicable to all patients with CKD. It is also possible that in some subpopulations of CKD patients, treatment of dyslipidemias may not be as safe—or as effective—in reducing the incidence of CVD, as it is in the general population. This may be due to the unique complications of CKD (eg, anemia, calcium and phosphorus metabolic abnormalities) that may contribute to the risk of CVD in CKD.
Based on the risk reductions achieved in the general population in patients with or at high risk for CVD, the small amount of existing data in the CKD population, and the marked risk of CVD in patients with kidney disease, the NKF K/DOQI has established guidelines for management of dyslipidemia in CKD.292 The important differences between these guidelines and the ones published by the ATP III are listed in Table 16. The more recent ACC/AHA guidelines on management of dyslipidemia observed that routine administration of statin therapy did not provide any significant CV benefit in patients undergoing maintenance hemodialysis and therefore did not make any recommendation for statin therapy in these patients.133 Apart from this, no discussion was provided on management of dyslipidemia in other CKD patients.
Table 16.
Key features of the K/DOQI guidelines that differ from NCEP ATP III.
| NKF K/DOQI guidelines | ATP III guidelines |
|---|---|
| CKD patients are considered to be in the highest risk category | CKD patients are not managed differently from other patients |
| Evaluation of dyslipidemias should occur at presentation, after a change in status, and annually | Evaluation of dyslipidemias should occur every 5 years |
| Drug therapy should be used for LDL-C 100–129 mg/dl after only 3 months of TLC | Drug therapy considered optional for LDL-C 100–129 mg/dl |
| Initial drug therapy for elevated LDL-C should be with a statin | Initial drug therapy for elevated LDL-C should be with a statin, bile acid sequestrant, or nicotinic acid |
| Fibrates may be used in Stage 5 CKD 1) for patients with TG ≥ 500; and 2) for patients with TG ≥ 200 mg/dl with non-HDL-C ≥130 mg/dl who do not tolerate statins | Fibrates are contraindicated in CKD |
| Gemfibrozil may be the fibrate of choice for treatment of high TG in patients with CKD | No preferences for which fibrate should be used for hypertriglyceridemia |
CKD, chronic kidney disease; NKF K/DOQI, National Kidney Foundation Kidney Disease Outcomes Quality Initiative; NCEP ATP III, National Cholesterol Education Program Adult Treatment Panel III; LDL, low-density lipoprotein; HDL-C, high-density lipoprotein; TLC, therapeutic lifestyle changes.
6.4.4.1. Statins in patients with CKD
6.4.4.1.1. Efficacy of statin therapy in reducing lipid levels in patients with CKD
6.4.4.1.1.1. Peritoneal dialysis patients
Only 3 small trials have evaluated statin therapy in patients undergoing peritoneal dialysis. A randomized, placebo-controlled study assessed the effect of atorvastatin in 177 patients undergoing continuous ambulatory peritoneal dialysis (CAPD).301 After 16 weeks, patients receiving atorvastatin experienced greater reductions in LDL-C and triglyceride levels and significant increases in HDL-C levels compared with subjects receiving placebo. Another 4-month, non-randomized study evaluating the effect of atorvastatin in 29 hypercholesterolemic patients undergoing peritoneal dialysis showed similar results.302 Finally, significant reductions in LDL-C levels compared with placebo were noted in a 24-week randomized study of simvastatin 10 mg/day in 23 patients undergoing CAPD.303
6.4.4.1.1.2. Hemodialysis patients
Four studies to date have assessed the effect of statin therapy on LDL-C levels in patients undergoing hemodialysis and all 4 studies demonstrated that statin therapy reduced LDL-C levels. In one study, 34 hemodialysis patients randomized to therapy with simvastatin experienced a large, statistically significant reduction in LDL-C levels and a smaller but significant reduction in triglyceride levels compared with placebo.303 An 8-week randomized trial in 58 hemodialysis patients also noted that simvastatin significantly reduced LDL-C levels,304 while a 24-week, non-randomized study of simvastatin 5 mg/day demonstrated significant reductions in LDL-C levels in 38 hypercholesterolemic patients.305 Finally, a randomized study of atorvastatin and simvastatin found that both statins significantly reduced LDL-C levels.306
6.4.4.1.1.3. Kidney transplant recipients
The use of statins in kidney transplant patients has been well investigated. In addition to several small studies that have demonstrated a significant reduction in LDL-C levels with statins,307–309 the results of a large, randomized, placebo-controlled trial-the Assessment of LEscol in Renal Transplantation (ALERT) are also available.310 After a mean follow-up of 5.1 years, kidney transplant patients receiving fluvastatin 40–80 mg/day (N = 1050) experienced a 32% reduction in LDL-C compared with patients receiving placebo (N = 1052).
6.4.4.1.2. Statins and CVD events
6.4.4.1.2.1. Stages 2–4 CKD
Few studies have examined this question in CKD. The best evidence to date comes from a post-hoc subgroup analysis of the Cholesterol and Recurrent Events (CARE) study, focusing on patients with stages 2–4 CKD.311 The CARE study was a randomized, double-blinded, placebo-controlled trial of pravastatin in patients with a history of MI and total plasma cholesterol levels below 240 mg/dl. Among 1711 subjects with estimated creatinine clearance less than 75 ml/min (mean creatinine clearance, 64 ml/min), a 28% reduction in the composite study outcome of MI and fatal CHD was noted in the pravastatin group, but there was no significant difference in all-cause mortality. Pravastatin therapy resulted in similar risk reductions in all subjects regardless of kidney function as well as in subjects with creatinine clearance less than 60 ml/min.
6.4.4.1.2.2. Stage 5 CKD
No randomized controlled trial to date has assessed whether statin therapy reduces the rate of CVD events in dialysis patients. Limited data include a recent observational study that compared 362 hemodialysis patients receiving statin therapy with 3354 patients not receiving statins and noted an independent association between statin use and a reduced risk of total mortality and CV-specific mortality.312 The association between statin use and reduced CVD mortality held only for patients with known preexisting CVD, and the conclusions are limited by the observational nature of the study.
6.4.4.1.2.3. Kidney transplant recipients
To date, only a single trial (ALERT) has assessed whether there was a reduction in the rate of CVD events in kidney transplant patients with statin therapy.307 In this trial, there was a trend towards reduction in the composite endpoint (cardiac death, nonfatal MI, or coronary intervention procedure) with fluvastatin as compared to placebo (relative risk [RR], 0.83; 95% confidence interval [CI], 0.64–1.06). There were significantly fewer cardiac deaths and nonfatal MIs in the treatment group but no reduction was seen for coronary intervention procedures, cerebrovascular events, non-CV death, all-cause mortality, graft loss, or doubling of serum creatinine levels.
6.4.4.1.3. Reducing progression of CKD
Results from small, randomized trials have demonstrated a potential benefit of statins with regard to slowing decline in GFR. A meta-analysis of 12 trials in subjects with CKD demonstrated that patients receiving lipid-lowering therapy, primarily statins, experienced significantly lower monthly decline in GFR compared with controls (0.16 ml/min/month; 95% CI, 0.03–0.29).313 This study also showed a trend toward a reduction of proteinuria with lipid-lowering therapy, although there was considerable heterogeneity among the included studies. In a recent post-hoc analysis of a subgroup of 690 patients with moderate to severe CKD (estimated GFR < 60 ml/min per 1.73 m2) who were part of a randomized controlled trial, statin therapy slowed the decline in kidney function, especially in those with proteinuria.314 In another randomized controlled study, Bianchi et al evaluated atorvastatin 10–40 mg/day versus no treatment in 56 patients with CKD receiving antihypertensive medications.315 After 1 year, the rate of proteinuria in the atorvastatin-treated patients decreased significantly compared with baseline (P < 0.01), while there was no change in proteinuria in the control group. Notably, there was wide inter-patient variability in efficacy.
In summary, data from several small, randomized controlled trials indicate that statins effectively reduce LDL-C levels in patients with CKD. Because of the paucity of clinical data, it is currently unclear whether statin therapy is associated with a reduced rate of CVD events and whether this effect is only seen in patients at greatest risk. Although large, controlled, randomized trials are lacking, statins may confer other protective effects, such as slowing the decline in GFR or reducing levels of inflammation.
6.4.4.2. Other pharmacologic therapy in CKD
Fibrates are indicated when hypertriglyceridemia (serum TG ≥ 500 mg/dl) is the primary lipid abnormality (Table 15), and may reduce triglyceride levels by up to 30%–50%.67 However, fibrates are excreted by kidneys and may cause myositis, particularly when used in conjunction with statins. Therapy with fibrates may also cause an increase in serum creatinine levels that is not related to overt muscle injury, although this has not been observed with gemfibrozil.316 It is uncertain whether this represents an actual decrease in GFR versus an assay effect, an alteration in creatinine secretion, or an increase in creatinine production.317–319http://www.ncbi.nlm.nih.gov/pmc/articles/PMC1492581/-b44.
Nicotinic acid (niacin) is the most efficacious agent for increasing HDL-C levels in the general population and also has beneficial effects on triglyceride levels and less significant but favorable LDL-C-lowering effects. However, the recent experience with HDL-C raising therapies, including niacin, has been disappointing and at present, no pharmacological therapy can be considered safe for raising HDL-C.237,320
Bile acid sequestrants work by binding bile acids in the intestine, blocking distal reabsorption and thereby decreasing LDL-C levels. Bile acid sequestrants are not well studied in patients with CKD, but are probably well tolerated given their lack of systemic absorption. Bile acid sequestrants currently are recommended as second-line agents for reducing elevated LDL-C levels.
6.4.4.3. Safety of pharmacologic therapy in CKD
The treatment of patients with CKD can be quite complex because of the many co-morbid conditions in this population. Given the use of multiple medications as well as the changes in metabolism of medications, it is important to remain aware of dose adjustments and potential medication interactions.
Table 17 presents dosing recommendations and several contraindications for lipid-lowering medications. For statins, the acceptable dosage varies according to the statin used and the level of kidney function. In general, statins that are not metabolized by the kidneys are well tolerated at all doses. Indeed, atorvastatin dose of up to 80 mg/day have been shown to produce no serious adverse events in hemodialysis patients.321
Table 17.
Lipid-lowering medication dose adjustments for reduced kidney function.
| Agents | Dose adjustment according to GFR (ml/min/1.73 m2) |
Notes | ||
|---|---|---|---|---|
| 60 to 90 | 15 to 59 | <15 | ||
| Statinsa | ||||
| Atorvastatin | None | None | None | |
| Fluvastatin | None | ↓ to 50% | ↓ to 50% | Decrease dosage by half at GFR < 30 |
| Lovastatin | None | ↓ to 50% | ↓ to 50% | Decrease dosage by half at GFR < 30 |
| Pravastatin | None | None | None | Starting dose of 10 mg/day recommended for GFR < 60 |
| Rosuvastatin | None | ↓ | ↓ | Decrease to a maximum of 10 mg/day at GFR < 30; recommended starting dose is 5 mg/day |
| Simvastatin | ? | ? | ? | Start at 5 mg/day in patients with GFR < 10 |
| Nicotinic acid | None | None | ↓ to 50% | May worsen glycemic control and cause orthostasis, hyperuricemia, and flushing |
| Bile acid sequestrant | ||||
| Cholestyramine | None | None | None | Not systemically absorbed |
| Cholestipol | None | None | None | Not systemically absorbed |
| Colesevelam | None | None | None | Not systemically absorbed |
| Fibratesa | ||||
| Clofibrate | ↓ to 50% | ↓ to 25% | Avoid | May increase serum creatinineb ↑ risk of myopathy |
| Fenofibrate | ↓ to 50% | ↓ to 25% | Avoid | May increase serum creatinineb ↑ risk of myopathy |
| Gemfibrozil | None | None | Avoid | Likely no effect on serum creatinine ↑ risk of myopathy |
GFR, glomerular filtration rate in ml/min/1.73 m2.
Because of increased risk of myositis and rhabdomyolysis, statin therapy in conjunction with a fibrate should be avoided in patients with chronic kidney disease.
The increase in levels of serum creatinine seen with most fibrates has not been appreciated with gemfibrozil.
Before initiating statin therapy in CKD patients, it may be helpful to establish the patient's baseline CPK levels, so that if adverse effects such as myositis occur, the patient can be evaluated more readily. If a patient reports muscle pain, statins should be withdrawn and CPK levels assessed. Patients with only mild adverse reactions to their initial statin regimen could be prescribed the same statin at a lower dosage or started on a different statin before proceeding to alternative lipid-lowering therapies.292
Statins are contraindicated for patients with acute or chronic liver disease and close attention should be paid to interactions that affect statin metabolism. Agents known to increase statin blood levels include calcineurin inhibitors, such as cyclosporine and tacrolimus, which are commonly used in kidney transplant recipients. Other agents that interact with statins include macrolide antibiotics, azole antifungal agents, calcium channel blockers (particularly nondihydropyridines), fibrates, nicotinic acid, serotonin reuptake inhibitors, warfarin, and grapefruit juice. Statin therapy in conjunction with a fibrate can increase the risk of myositis or rhabdomyolysis; K/DOQI guidelines recommend avoiding this combination in patients with CKD.292
6.5. Familial dyslipidemia
There is a lack of unifying classification of inherited lipid disorders and therefore, we still continue to use an old classification laid down by Donald Fredrickson in 1967, despite its limitations.
| Fredrickson Classification | |
| Type I | Hyperchylomicronemia |
| Type IIa | Familial hypercholesterolemia (FH) |
| Type IIb | Familial Combined Hypercholesterolemia (FCH) |
| Type III | Dysbetalipoproteinemia |
| Type IV | Fimilial Hypertriglyceridemia |
| Type V | Familial Lipoprotein Lipase deficiency |
The above classification system has two main deficiencies. Firstly, it is incomplete since it does not include more recently discovered genetic disorders which are discussed later under the group captioned “Non-Fredrickson inherited lipid diseases”. Secondly, many patients with hypertrigly-ceridemia can be either Type I, IIb, IV or V. Thirdly, it does not include HDL-C and it does not differentiate severe monogenic disorders from more common polygenic disorders.
The Fredrickson classification strictly applies to type I (Hyperchylomicronemia) and type IIa (Familial hypercholesterolemia) disorders. For other Fredrickson subtypes, serum profile of a single patient can move from one category to another depending on environmental factors or treatment, as the extent of enzymatic activity can increase or decrease depending on the clinical milieu.
6.5.1. Fredrickson type I (Hyperchylomicronemia)322–324
-
•Frequency:
-
○Rare inherited disorders with a frequency of 1 in 1,000,000
-
○
-
•Underlying metabolic defect:
-
○Deficiency of lipoprotein lipase (LPL) or Apo CII deficiency
-
○
-
•Clinical presentation:
-
○TG usually > 1000 mg/dl, often in children; TC usually 1/10 of TG
-
○Blood sample appears lipemic (creamy top layer) and contains chylomicrons
-
○Eruptive xanthomas and recurrent pancreatitis
-
○Low atherogenicity
-
○
-
•Treatment:
-
○Low fat diet (<20 g/day) with supplementation of diet with medium chain TG and also provide 1% of total calorie intake as linoleic acid
-
○Fibrates or omega-3 fatty acids if there is a VLDL-C component to reduce the degree of hypertriglyceridemia
-
○Glycemic control in diabetics; insulin activates LPL
-
○Plasmapheresis in extreme cases
-
○
6.5.2. Fredrickson type IIa (familial hypercholesterolemia)68
-
•Inheritance and Frequency:
-
○Autosomal dominant (especially French Christians, Lebanese Christians and Finns)
-
○Homozygous 1/1,000,000
-
○Heterozygous 1/500
-
○[FH is under-diagnosed; high index of suspicion and aggressive family testing is a proven way to identify and treat this potentially fatal disease.
-
○
-
•Underlying Metabolic defect:
-
○Defective LDL-C-receptor or defective Apo B; the latter is likely to carry a better prognosis than LDL-C receptor mutations. While a few mutations in preprotein convertase subtilism kexin 9 (PCSK-9) have been described to be prognostically poorer, it remains to be seen whether this is the case for all PCSK-9 activating mutations.
-
○
-
•Clinical presentation and diagnosis:
-
○There are well defined diagnostic criteria laid down for familial hypercholesterolemia (Table 18)
-
○
-
•Treatment:
-
○Aggressive low saturated fat diet.
-
○High dose statins (Atorvastatin 40–80 mg, Rosuvasvatin 20–40 mg) or moderate dose statin + Ezetimibe 10 mg or moderate dose statin + colesevelam (625 mg tablet 3 tabs bid)
-
○Target LDL-C: <100 mg/dL for high risk subjects or <70 mg/dL in presence of very high risk or established CVD. If targets cannot be reached, maximal reduction of LDL-C should be considered using appropriate drug combinations in tolerated doses.
-
○In children diagnosed with FH, if family history of CAD<40 years, start statins (Atorvastatin 10–20 mg or Rosuvastatin 5–10 mg) at age of 6 years. If family history of CAD<50 years not present, start statins in same dosage at age 10–16 years.
-
○Add ezetimibe or colesevelam as needed to reach at least 50% reduction in LDL-C.
-
○Monitor atheroma progression e.g. Carotid intima-medial thickness (cIMT), check for cardiac atheroma; monitor aortic valve by echocardiography.
-
○When drugs fail, then apheresis or plasmapheresis is used to physically remove LDL-C and lipoprotein particles (usually indicated at LDL-C ≥250 mg/dl despite drug therapy). Apheresis is preferred to plasmapheresis as there is no need for infusions of albumin or fresh frozen plasma.
-
○When homozygous FH is diagnosed in young children, then the usual plan is to restore hepatic LDL-C-receptor function by liver transplantation as soon child is technically fit to undergo surgery; if not feasible, some success has been reported with portocaval shunts.
-
○Heterozygous familial hypercholesterolemia (HeFH) is a treatable cause of early vascular disease and pharmacological treatment of HeFH is cost-effective strategy. Most cost-effective strategy is clinical and biochemical screening of close relatives of the proband patient.
-
○
Table 18.
Diagnostic criteria for familial hypercholesterolemia [according to MedPed (Make Early Diagnosis to Prevent Early Deaths) and WHO].
| Category | Criterion | Score |
|---|---|---|
| Family history | First-degree relative known with premature CAD and/or first-degree relative with LDL-C >95th centile | 1 |
| First –degree relative with tendon xanthomata and/or children <18 with LDL-C >95th centile | 2 | |
| Clinical history | Patient has premature CAD | 2 |
| Patient has premature cerebral/peripheral vascular disease | 1 | |
| Physical examination | Tendon xanthomata | 6 |
| Arcuscornealis below age of 45 years | 4 | |
| LDL-C | >330 mg/dL | 8 |
| 250-329 mg/dL | 5 | |
| 190-249 mg/dL | 3 | |
| 155-189 mg/dL | 1 |
Interpretation: Definite FH – score >8; Probable FH – score 6–8; Possible FH – score 3–5; No diagnosis – score <3.
6.5.3. Fredrickson type IIb (familial combined Hypercholesterolemia)325
-
•Inheritance and Frequency:
-
○Autosomal dominant
-
○Frequency: 1/200; commonest frequency in lipid clinics
-
○
-
•Underlying metabolic Defect:
-
○Hepatic over-production of apo-B leading to increased plasma VLDL-C
-
○
-
•Clinical presentation:
-
○TC: 200–400 mg/dl
-
○TG: 150–500
-
○HDL-C usually low
-
○Premature CAD out of proportion to modest degree of overallhyperlipidemia but high proportion of small-dense LDL particles
-
○Apo B > LDL-Cholesterol
-
○Commonly seen with insulin resistance and metabolic syndrome
-
○Xanthomas not seen
-
○
-
•Treatment:
-
○Lifestyle modification:
-
−Check fasting blood sugar and HbA1C
-
−Limit refined carbohydrates and alcohol
-
−Monosaturated and Omega-3 fats >> saturated fats
-
−
-
○Drugs:
-
−Start at mid-level dose of high-potency statin
-
−Atorvastatin 20 mg, Simvastatin 20 mg, Rosuvastatin 10–20 mg/day
-
−Check LDL-C, TG, non-HDL-C,and apoB or LDL particles – if not at goal → add either fenofibrate or niacin (check liver function and blood sugar) → if still not at goal → combine statin + fibrate + niacin (aim for maximal dose tolerated)
-
−
-
○In families with a severe history of very early coronary heart disease (<40 years old), screening at age 6 may be appropriate. Most children can be tested at age 16–18 years.
-
○
6.5.4. Fredrickson type III (familial dysbetalipoproteinaemia) or remnant hyperlipipaemia326
-
•Frequency:
-
○Rare
-
○
-
•Underlying metabolic defect:
-
○Apo E2/E2 does not bind with hepatic B/E receptor
-
○
-
•Clinical presentation:
-
○IDL (VLDL-C remnants) are increased
-
○Tubero-eruptive xanthomas on elbows and knees
-
○Orange palmar xanthomas
-
○TC ∼300 mg/dL
-
○TG ∼300 mg/dL
-
○
-
•Treatment:
-
○Life-style measures, mainly weight loss
-
○Statins are mainstay of therapy as statins reduce TG in proportion to their efficacy in reducing LDL-C and baseline triglyceride levels; however, often triglyceride-lowering therapy for residual hypertriglyceridemia is required.
-
○Given the role of insulin resistance in this disorder, there is also evidence for combining statins with metformin or thiazolidinediones.
-
○
6.5.5. Fredrickson type-IV (Familial Hypertriglyceridemia)323
-
•Inheritance and frequency:
-
○Autosomal dominant
-
○Common disorder, frequency > 40% in lipid clinics
-
○
-
•Underlying metabolic Defect:
-
○Impaired lipolysis of TG (? role of apo CIII) or increased production of VLDL-C
-
○
-
•Clinical presentation:
-
○Family history of hypertriglyceridaemia
-
○Exacerbated by high carbohydrate diets and/or alcohol
-
○Low atherogenicity
-
○Serum TG > 500 mg/dL
-
○
-
•Treatment:
-
○Check liver enzymes, uric acid, fasting blood sugar or HbA1C
-
○Lifestyle measures:
-
−Low fat diet
-
−Limit refined carbohydrates
-
−Avoid alcohol
-
−Daily 30 min of brisk walking
-
−
-
○Drugs
-
−Start with fenofibrate, niacin or omega 3–4 g; if statins are likely to be added later, avoid gemfibrozil, unless renal failure is present.
-
−Target triglyceride is < 150 mg/dL
-
−If TG > 1500, start fenobibric acid 145 mg and Omega 3 at a dose of 4 g simultaneously
-
−
-
○
6.5.6. Fredrickson type V (Familial lipoprotein lipase deficiency)327
-
•Frequency and inheritance:
-
○Rare in general population
-
○Autosomal recessive condition; LPL is the only gene in which mutation (p.Gly 188 Glu) is known to cause this condition.
-
○
-
•Underlying metabolic defect:
-
○Lipoprotein Lipase deficiency
-
○Both chylomicrons and TG present
-
○
-
•Clinical presentation:
-
○TC ∼250 mg/dL
-
○TG ≥2000 mg/dL, childhood onset with episodic abdominal pain
-
○Recurrent acute pancreatitis, eruptive cutaneous xanthomata, hepato-splenomegaly
-
○
-
•Treatment:
-
○Along the lines of chylomicronemia.
-
○
6.5.7. Non-Fredrickson inherited lipid disorders
6.5.7.1. Lipoprotein(a) [Lp(a)]
Lp(a) is an Apo-B lipoprotein with an Apoa attached. It is inherited in an autosomal dominant fashion. An elevated level of Lp(a) is doubly bad because (i) it is atherogenic like LDL-C-and (ii) it is prothrombotic because of its similarity to plasminogen. Although LP(a) levels > 30 mg/dl are generally considered threshold at which premature CHD increases rapidly, levels below 20 mg/dl are considered optimum, particularly in Asian Indians.131
Lp(a) is an independent risk factor for CVD, but is clinically relevant only when the LDL-C is also abnormally high.328 In the Familial Atherosclerosis Trial Study (FATS) follow-up, reduction of LDL-C levels to <2.6 mmol/L was associated with amelioration of the residual risk posed by Lp(a).329 Best known therapy that reduces Lp(a) by > 20% is niacin. Estrogen therapy and raloxifane also reduces Lp(a) levels. Since Lp(a) is fully expressed in the first year of life, tracking Lp(a) from childhood may be better optionthan focusing on other dyslipidemias that are not expressed until later life.
6.5.7.2. Inherited low HDL-C330
Most low HDL-C is not inherited. Most common causes of low HDL-C include the pandemic of obesity, inactivity, a high-carbohydrate diet or a very low-fat diet. Inherited low HDL-C has four causes- (i) familial hypo-alpha-lipoproteinemia; (ii) Tangier disease-inherited deficiency of ABCA-1 (ATP-binding cassette transporter-1); (iii) a deficiency of LCAT (Lecithin—cholesterol acyltransferase); (iv) HDL-Milano. First three may be or are associated with premature CAD and the last one, i.e. HDL-Milano is cardio-protective but unfortunately rare.
6.5.7.3. Inherited elevated HDL-C331
There are three inherited causes of elevated HDL-C-
-
−
First is almost exclusively seen in people of Japanese ancestry, is an inherited loss-of-function mutation in the allele for the gene that encodes CETP. CEPT deficiency occurs primarily in Japan, where its relationship to CV risk is still under debate i.e. whether it reduces or increases CV risk.
-
−
Second is inherited hepatic lipase deficiency
-
−
Third is primary hyperalphaliproproteinemia
6.5.7.4. Inherited low LDL-C (Hypobetalipoproteinemia)332
These patients are heterozygotes for hypo-beta-lipoproteinemia. Homozygotes cannot carry cholesterol to cells for membrane formation and do not survive. Heterozygotes have an LDL-C that ranges from 25 to 40, and neither do they develop atherosclerosis nor have any biologic or developmental problems.
6.5.7.5. Sitosterolemia or Phytosterolemia333
This is a rare (although probably under-diagnosed) autosomal recessive lipid disorder characterized by increased absorption of the plant sterols compesterol and sitosterol and various plant stanols. This occurs due to mutation in ABCG5 and ABCG8 transporter enzymes which pumps the sterols and stanols from the enterocytes back into the intestine.
Excessive systemic levels of phytosterols are highly toxic to cells and there patient have high LDL-C levels since LDL receptors are down-regulated. Patients with sitosterolemia present like classic homozygotic FH with tendon xanthomas, arcussenilis and premature CAD.
6.5.7.5.1. Studies on familial dyslipidemia amongst Indians
Prevalence of familial hypercholesterolemia (FH) in India is not known. Till date, 10 different LDL receptor gene mutations have been reported in the literature.334 Most of these mutations have been reported in exons 3, 4, 9 and 14 among Indians settled in South Africa, which suggests an increased frequency of FH in India.334 The Indians, who migrated to South Africa, originated from diverse areas in India and they remained isolated in that country primarily as a result of religious and cultural practices. Hence the group in South Africa probably represents the incidence in the Indian subcontinent.
Ashavaid et al studied DNA samples from 25 hypercholesterolemia patients and using heteroduplex (HDX) analysis, two patients were found to show an abnormal HDX pattern, one each in exon 3 and exon 4.335 Genetic investigations of hyperlipidemia in Asian Indians clearly need more research attention.
Conflicts of interest
All authors have none to declare.
References
- 1.Gupta R. Burden of coronary heart disease in India. Indian Heart J. 2005;57:632–638. [PubMed] [Google Scholar]
- 2.Law M.R., Wald N.J., Thompson S.G. By how much and how quickly does reduction in serum cholesterol concentration lower risk of ischaemic heart disease? BMJ. 1994;308:367–372. doi: 10.1136/bmj.308.6925.367. [DOI] [PMC free article] [PubMed] [Google Scholar]
- 3.Yusuf S., Hawken S., Ounpuu S. Effect of potentially modifiable risk factors associated with myocardial infarction in 52 countries (the interheart study): case-control study. Lancet. 2004;364:937–952. doi: 10.1016/S0140-6736(04)17018-9. [DOI] [PubMed] [Google Scholar]
- 4.Yusuf S., Islam S., Chow C.K. Use of secondary prevention drugs for cardiovascular disease in the community in high-income, middle-income, and low-income countries (the pure study): a prospective epidemiological survey. Lancet. 2011;378:1231–1243. doi: 10.1016/S0140-6736(11)61215-4. [DOI] [PubMed] [Google Scholar]
- 5.Rose G. Strategy of prevention: lessons from cardiovascular disease. Br Med J (Clin Res Ed. 1981;282:1847–1851. doi: 10.1136/bmj.282.6279.1847. [DOI] [PMC free article] [PubMed] [Google Scholar]
- 6.World health organization . World health organization; Geneva: 2011. Global Status Report of Ncd 2010. [Google Scholar]
- 7.Lozano R., Naghavi M., Foreman K. Global and regional mortality from 235 causes of death for 20 age groups in 1990 and 2010: a systematic analysis for the global burden of disease study 2010. Lancet. 2012;380:2095–2128. doi: 10.1016/S0140-6736(12)61728-0. [DOI] [PMC free article] [PubMed] [Google Scholar]
- 8.Trivedi D.H., Sharma V., Pandya H. Longitudinal epidemiological study of coronary heart disease in a rural population of kheda district, gujarat, India. Soz Praventivmed. 1996;41:373–379. doi: 10.1007/BF01324287. [DOI] [PubMed] [Google Scholar]
- 9.Joshi R., Cardona M., Iyengar S. Chronic diseases now a leading cause of death in rural India–mortality data from the andhra pradesh rural health initiative. Int J Epidemiol. 2006;35:1522–1529. doi: 10.1093/ije/dyl168. [DOI] [PubMed] [Google Scholar]
- 10.Soman C.R., Kutty V.R., Safraj S., Vijayakumar K., Rajamohanan K., Ajayan K. All-cause mortality and cardiovascular mortality in kerala state of India: results from a 5-year follow-up of 161,942 rural community dwelling adults. Asia. Pac. J Public Health. 2011;23:896–903. doi: 10.1177/1010539510365100. [DOI] [PubMed] [Google Scholar]
- 11.Pednekar M.S., Gupta R., Gupta P.C. Illiteracy, low educational status, and cardiovascular mortality in India. BMC Public Health. 2011;11 doi: 10.1186/1471-2458-11-567. 567–567. [DOI] [PMC free article] [PubMed] [Google Scholar]
- 12.Gupta R., Joshi P., Mohan V., Reddy K.S., Yusuf S. Epidemiology and causation of coronary heart disease and stroke in India. Heart. 2008;94:16–26. doi: 10.1136/hrt.2007.132951. [DOI] [PubMed] [Google Scholar]
- 13.Gupta R., Gupta V.P. Meta-analysis of coronary heart disease prevalence in India. Indian Heart J. 1996;48:241–245. [PubMed] [Google Scholar]
- 14.Joshi P., Islam S., Pais P. Risk factors for early myocardial infarction in south asians compared with individuals in other countries. JAMA. 2007;297:286–294. doi: 10.1001/jama.297.3.286. [DOI] [PubMed] [Google Scholar]
- 15.O'Donnell M.J., Xavier D., Liu L. Risk factors for ischaemic and intracerebral haemorrhagic stroke in 22 countries (the interstroke study): a case-control study. Lancet. 2010;376:112–123. doi: 10.1016/S0140-6736(10)60834-3. [DOI] [PubMed] [Google Scholar]
- 16.Gupta R., Gupta V.P., Sarna M., Prakash H., Rastogi S., Gupta K.D. Serial epidemiological surveys in an urban Indian population demonstrate increasing coronary risk factors among the lower socioeconomic strata. J Assoc Physicians India. 2003;51:470–477. [PubMed] [Google Scholar]
- 17.Indian institute of population sciences and macro international . Indian institute of population sciences; Mumbai: 2007. National Family Health Survey 2005–2006 (nfhs-3) [Google Scholar]
- 18.Gupta R. Trends in hypertension epidemiology in India. J Hum Hypertens. 2004;18:73–78. doi: 10.1038/sj.jhh.1001633. [DOI] [PubMed] [Google Scholar]
- 19.Gupta R., Deedwania P.C. Hypertension in south asians. In: Black H.R., Elliott W.J., editors. Hypertension: A Companion Textbook to Braunwald's Heart Disease. WB Saunders; New York: 2013. pp. 373–378. [Google Scholar]
- 20.Anjana R.M., Ali M.K., Pradeepa R. The need for obtaining accurate nationwide estimates of diabetes prevalence in India – rationale for a national study on diabetes. Indian J Med Res. 2011;133:369–380. [PMC free article] [PubMed] [Google Scholar]
- 21.Whiting D.R., Guariguata L., Weil C., Shaw J. Idf diabetes atlas: global estimates of the prevalence of diabetes for 2011 and 2030. Diabetes Res Clin Pract. 2011;94:311–321. doi: 10.1016/j.diabres.2011.10.029. [DOI] [PubMed] [Google Scholar]
- 22.Wang Y., Chen H.J., Shaikh S., Mathur P. Is obesity becoming a public health problem in India? Examine the shift from under- to overnutrition problems over time. Obes Rev. 2009;10:456–474. doi: 10.1111/j.1467-789X.2009.00568.x. [DOI] [PubMed] [Google Scholar]
- 23.Gupta R., Guptha S., Gupta V.P., Agrawal A., Gaur K., Deedwania P.C. Twenty-year trends in cardiovascular risk factors in India and influence of educational status. Eur J Prev Cardiol. 2012;19:1258–1271. doi: 10.1177/1741826711424567. [DOI] [PubMed] [Google Scholar]
- 24.Gupta R., Guptha S., Sharma K.K., Gupta A., Deedwania P. Regional variations in cardiovascular risk factors in India: India heart watch. World J Cardiol. 2012;4:112–120. doi: 10.4330/wjc.v4.i4.112. [DOI] [PMC free article] [PubMed] [Google Scholar]
- 25.Subramanian S.V., Nandy S., Kelly M., Gordon D., Davey Smith G. Patterns and distribution of tobacco consumption in India: cross sectional multilevel evidence from the 1998–9 national family health survey. BMJ. 2004;328:801–806. doi: 10.1136/bmj.328.7443.801. [DOI] [PMC free article] [PubMed] [Google Scholar]
- 26.Maheshwari P., Sharma M., Sharma K.K. Equivalence of cholesterol levels at hospital-based health-check program with population-based studies: a comparative study. J Clin Prev Cardiol. 2013;2:1–7. [Google Scholar]
- 27.Shah B., Mathur P. Surveillance of cardiovascular disease risk factors in India: the need & scope. Indian J Med Res. 2010;132:634–642. doi: 10.4103/0971-5916.73420. [DOI] [PMC free article] [PubMed] [Google Scholar]
- 28.Burke G.L., Bell R.A. National and international trends in cardiovascular disease: Incidence and risk factors. In: Blumenthal R.S., Foody J.M., Wong N.D., editors. Preventive Cardiology: A Companion to Braunwald's Heart Disease. Saunders-Elsevier; Philadelphia: 2011. pp. 14–32. [Google Scholar]
- 29.Misra A., Khurana L. Obesity-related non-communicable diseases: South asians vs white caucasians. Int J Obes (Lond) 2011;35:167–187. doi: 10.1038/ijo.2010.135. [DOI] [PubMed] [Google Scholar]
- 30.McKeigue P.M., Shah B., Marmot M.G. Relation of central obesity and insulin resistance with high diabetes prevalence and cardiovascular risk in south asians. Lancet. 1991;337:382–386. doi: 10.1016/0140-6736(91)91164-p. [DOI] [PubMed] [Google Scholar]
- 31.Chambers J.C., Eda S., Bassett P. C-reactive protein, insulin resistance, central obesity, and coronary heart disease risk in Indian asians from the united kingdom compared with european whites. Circulation. 2001;104:145–150. doi: 10.1161/01.cir.104.2.145. [DOI] [PubMed] [Google Scholar]
- 32.Forouhi N.G., Sattar N., McKeigue P.M. Relation of c-reactive protein to body fat distribution and features of the metabolic syndrome in europeans and south asians. Int J Obes Relat Metab Disord. 2001;25:1327–1331. doi: 10.1038/sj.ijo.0801723. [DOI] [PubMed] [Google Scholar]
- 33.Bhalodkar N.C., Blum S., Rana T., Kitchappa R., Bhalodkar A.N., Enas E.A. Comparison of high-density and low-density lipoprotein cholesterol subclasses and sizes in asian Indian women with caucasian women from the framingham offspring study. Clin Cardiol. 2005;28:247–251. doi: 10.1002/clc.4960280510. [DOI] [PMC free article] [PubMed] [Google Scholar]
- 34.Somani R., Grant P.J., Kain K., Catto A.J., Carter A.M. Complement c3 and c-reactive protein are elevated in south asians independent of a family history of stroke. Stroke. 2006;37:2001–2006. doi: 10.1161/01.STR.0000231649.56080.6d. [DOI] [PubMed] [Google Scholar]
- 35.Chandalia M., Mohan V., Adams-Huet B., Deepa R., Abate N. Ethnic difference in sex gap in high-density lipoprotein cholesterol between Asian Indians and whites. J Investig Med. 2008;56:574–580. doi: 10.2310/JIM.0b013e31816716fd. [DOI] [PubMed] [Google Scholar]
- 36.Whincup P.H., Gilg J.A., Papacosta O. Early evidence of ethnic differences in cardiovascular risk: cross sectional comparison of british south asian and white children. Bmj. 2002;324 doi: 10.1136/bmj.324.7338.635. 635–635. [DOI] [PMC free article] [PubMed] [Google Scholar]
- 37.Ehtisham S., Crabtree N., Clark P., Shaw N., Barrett T. Ethnic differences in insulin resistance and body composition in united kingdom adolescents. J Clin Endocrinol Metab. 2005;90:3963–3969. doi: 10.1210/jc.2004-2001. [DOI] [PubMed] [Google Scholar]
- 38.Hughes L.O., Wojciechowski A.P., Raftery E.B. Relationship between plasma cholesterol and coronary artery disease in asians. Atherosclerosis. 1990;83:15–20. doi: 10.1016/0021-9150(90)90125-3. [DOI] [PubMed] [Google Scholar]
- 39.Enas E.A., Garg A., Davidson M.A., Nair V.M., Huet B.A., Yusuf S. Coronary heart disease and its risk factors in first-generation immigrant Asian Indians to the united states of america. Indian Heart J. 1996;48:343–353. [PubMed] [Google Scholar]
- 40.Grundy S.M., Vega G.L. Two different views of the relationship of hypertriglyceridemia to coronary heart disease. Implications for treatment. Arch Intern Med. 1992;152:28–34. [PubMed] [Google Scholar]
- 41.Vega G.L. Management of atherogenic dyslipidemia of the metabolic syndrome: evolving rationale for combined drug therapy. Endocrinol Metab Clin North Am. 2004;33:525–544. doi: 10.1016/j.ecl.2004.03.013. [DOI] [PubMed] [Google Scholar]
- 42.Chandalia M., Deedwania P.C. Coronary heart disease and risk factors in Asian Indians. Adv Exp Med Biol. 2001;498:27–34. doi: 10.1007/978-1-4615-1321-6_5. [DOI] [PubMed] [Google Scholar]
- 43.Gopinath N., Chadha S.L., Jain P., Shekhawat S., Tandon R. An epidemiological study of obesity in adults in the urban population of delhi. J Assoc Physicians India. 1994;42:212–215. [PubMed] [Google Scholar]
- 44.Bhardwaj S., Misra A., Misra R. High prevalence of abdominal, intra-abdominal and subcutaneous adiposity and clustering of risk factors among urban Asian Indians in North India. PLoS One. 2011;6:e24362. doi: 10.1371/journal.pone.0024362. [DOI] [PMC free article] [PubMed] [Google Scholar]
- 45.Bansal M., Shrivastava S., Mehrotra R., Agrawal V., Kasliwal R.R. Time-trends in prevalence and awareness of cardiovascular risk factors in an asymptomatic North Indian urban population. J Assoc Physicians India. 2009;57:568–573. [PubMed] [Google Scholar]
- 46.Kasliwal R.R., Kulshreshtha A., Agrawal S., Bansal M., Trehan N. Prevalence of cardiovascular risk factors in Indian patients undergoing coronary artery bypass surgery. J Assoc Physicians India. 2006;54:371–375. [PubMed] [Google Scholar]
- 47.Tai E.S., Emmanuel S.C., Chew S.K., Tan B.Y., Tan C.E. Isolated low hdl cholesterol: an insulin-resistant state only in the presence of fasting hypertriglyceridemia. Diabetes. 1999;48:1088–1092. doi: 10.2337/diabetes.48.5.1088. [DOI] [PubMed] [Google Scholar]
- 48.Kulkarni K.R., Markovitz J.H., Nanda N.C., Segrest J.P. Increased prevalence of smaller and denser ldl particles in Asian Indians. Arterioscler Thromb Vasc Biol. 1999;19:2749–2755. doi: 10.1161/01.atv.19.11.2749. [DOI] [PubMed] [Google Scholar]
- 49.Gupta R., Guptha S., Agrawal A., Kaul V., Gaur K., Gupta V.P. Secular trends in cholesterol lipoproteins and triglycerides and prevalence of dyslipidemias in an urban Indian population. Lipids Health Dis. 2008;7 doi: 10.1186/1476-511X-7-40. 40–40. [DOI] [PMC free article] [PubMed] [Google Scholar]
- 50.McQueen M.J., Hawken S., Wang X. Lipids, lipoproteins, and apolipoproteins as risk markers of myocardial infarction in 52 countries (the interheart study): a case-control study. Lancet. 2008;372:224–233. doi: 10.1016/S0140-6736(08)61076-4. [DOI] [PubMed] [Google Scholar]
- 51.Bhatnagar D., Anand I.S., Durrington P.N. Coronary risk factors in people from the Indian subcontinent living in west London and their siblings in India. Lancet. 1995;345:405–409. doi: 10.1016/s0140-6736(95)90398-4. [DOI] [PubMed] [Google Scholar]
- 52.Zaman M.J., Bhopal R.S. New answers to three questions on the epidemic of coronary mortality in south asians: Incidence or case fatality? Biology or environment? Will the next generation be affected? Heart. 2013;99:154–158. doi: 10.1136/heartjnl-2012-302364. [DOI] [PubMed] [Google Scholar]
- 53.Misra A., Khurana L., Isharwal S., Bhardwaj S. South asian diets and insulin resistance. Br J Nutr. 2009;101:465–473. doi: 10.1017/S0007114508073649. [DOI] [PubMed] [Google Scholar]
- 54.Bhardwaj S., Passi S.J., Misra A. Overview of trans fatty acids: biochemistry and health effects. Diabetes Metab Syndrome. 2011;5:161–164. doi: 10.1016/j.dsx.2012.03.002. [DOI] [PubMed] [Google Scholar]
- 55.Misra A., Pandey R.M., Devi J.R., Sharma R., Vikram N.K., Khanna N. High prevalence of diabetes, obesity and dyslipidaemia in urban slum population in northern India. Int J Obes Relat Metab Disord. 2001;25:1722–1729. doi: 10.1038/sj.ijo.0801748. [DOI] [PubMed] [Google Scholar]
- 56.Gupta R., Agrawal A., Misra A. Migrating husbands and changing cardiovascular risk factors in the wife: a cross sectional study in Asian Indian women. J Epidemiol Community Health. 2012;66:881–889. doi: 10.1136/jech-2011-200101. [DOI] [PubMed] [Google Scholar]
- 57.Hayes L., White M., Unwin N. Patterns of physical activity and relationship with risk markers for cardiovascular disease and diabetes in Indian, Pakistani, Bangladeshi and European adults in a UK population. J Public Health Med. 2002;24:170–178. doi: 10.1093/pubmed/24.3.170. [DOI] [PubMed] [Google Scholar]
- 58.Gulati S., Misra A., Colles S.L. Dietary intakes and familial correlates of overweight/obesity: a four-cities study in India. Ann Nutr Metab. 2013;62:279–290. doi: 10.1159/000346554. [DOI] [PubMed] [Google Scholar]
- 59.Saha N., Tay J.S., Heng C.K., Humphries S.E. DNA polymorphisms of the apolipoprotein b gene are associated with obesity and serum lipids in healthy Indians in singapore. Clin Genet. 1993;44:113–120. doi: 10.1111/j.1399-0004.1993.tb03861.x. [DOI] [PubMed] [Google Scholar]
- 60.Renges H.H., Wile D.B., McKeigue P.M., Marmot M.G., Humphries S.E. Apolipoprotein b gene polymorphisms are associated with lipid levels in men of south asian descent. Atherosclerosis. 1991;91:267–275. doi: 10.1016/0021-9150(91)90174-2. [DOI] [PubMed] [Google Scholar]
- 61.Meena K., Misra A., Vikram N., Ali S., Pandey R.M., Luthra K. Cholesterol ester transfer protein and apolipoprotein e gene polymorphisms in hyperlipidemic Asian Indians in North India. Mol Cell Biochem. 2011;352:189–196. doi: 10.1007/s11010-011-0753-1. [DOI] [PubMed] [Google Scholar]
- 62.Luthra K., Bharghav B., Chabbra S. Apolipoprotein e polymorphism in northern Indian patients with coronary heart disease: phenotype distribution and relation to serum lipids and lipoproteins. Mol Cell Biochem. 2002;232:97–9102. doi: 10.1023/a:1014869827322. [DOI] [PubMed] [Google Scholar]
- 63.Chhabra S., Narang R., Krishnan L.R. Apolipoprotein c3 ssti polymorphism and triglyceride levels in Asian Indians. BMC Genet. 2002;3 doi: 10.1186/1471-2156-3-9. 9–9. [DOI] [PMC free article] [PubMed] [Google Scholar]
- 64.Bhatt S.P., Nigam P., Misra A. Association of the myostatin gene with obesity, abdominal obesity and low lean body mass and in non-diabetic Asian Indians in North India. PLoS One. 2012;7 doi: 10.1371/journal.pone.0040977. [DOI] [PMC free article] [PubMed] [Google Scholar]
- 65.Sharma M., Misra A., Vikram N. Genotype of the lmna 1908c > t variant is associated with generalized obesity in Asian Indians in North India. Clin Endocrinol (Oxf) 2011;75:642–649. doi: 10.1111/j.1365-2265.2011.04111.x. [DOI] [PubMed] [Google Scholar]
- 66.Tabassum R., Mahajan A., Chauhan G. Evaluation of dok5 as a susceptibility gene for type 2 diabetes and obesity in North Indian population. BMC Med Genet. 2010;11 doi: 10.1186/1471-2350-11-35. 35–35. [DOI] [PMC free article] [PubMed] [Google Scholar]
- 67.Third report of the national cholesterol education program (NCEP) expert panel on detection, evaluation, and treatment of high blood cholesterol in adults (adult treatment panel iii) final report. Circulation. 2002;106:3143–3421. [PubMed] [Google Scholar]
- 68.Reiner Z., Catapano A.L., De Backer G. ESC/EAS guidelines for the management of dyslipidaemias: the task force for the management of dyslipidaemias of the European Society of Cardiology (ESC) and the European Atherosclerosis Society (EAS) Eur Heart J. 2011;32:1769–1818. doi: 10.1093/eurheartj/ehr158. [DOI] [PubMed] [Google Scholar]
- 69.Cui Y., Blumenthal R.S., Flaws J.A. Non-high-density lipoprotein cholesterol level as a predictor of cardiovascular disease mortality. Arch Intern Med. 2001;161:1413–1419. doi: 10.1001/archinte.161.11.1413. [DOI] [PubMed] [Google Scholar]
- 70.Liu J., Sempos C.T., Donahue R.P., Dorn J., Trevisan M., Grundy S.M. Non-high-density lipoprotein and very-low-density lipoprotein cholesterol and their risk predictive values in coronary heart disease. Am J Cardiol. 2006;98:1363–1368. doi: 10.1016/j.amjcard.2006.06.032. [DOI] [PubMed] [Google Scholar]
- 71.Liu J., Sempos C., Donahue R.P., Dorn J., Trevisan M., Grundy S.M. Joint distribution of non-hdl and ldl cholesterol and coronary heart disease risk prediction among individuals with and without diabetes. Diabetes Care. 2005;28:1916–1921. doi: 10.2337/diacare.28.8.1916. [DOI] [PubMed] [Google Scholar]
- 72.Bittner V., Hardison R., Kelsey S.F., Weiner B.H., Jacobs A.K., Sopko G. Non-high-density lipoprotein cholesterol levels predict five-year outcome in the bypass angioplasty revascularization investigation (bari) Circulation. 2002;106:2537–2542. doi: 10.1161/01.cir.0000038496.57570.06. [DOI] [PubMed] [Google Scholar]
- 73.Ridker P.M., Rifai N., Cook N.R., Bradwin G., Buring J.E. Non-hdl cholesterol, apolipoproteins a-i and b100, standard lipid measures, lipid ratios, and crp as risk factors for cardiovascular disease in women. JAMA. 2005;294:326–333. doi: 10.1001/jama.294.3.326. [DOI] [PubMed] [Google Scholar]
- 74.Kastelein J.J.P., van der Steeg W.A., Holme I. Lipids, apolipoproteins, and their ratios in relation to cardiovascular events with statin treatment. Circulation. 2008;117:3002–3009. doi: 10.1161/CIRCULATIONAHA.107.713438. [DOI] [PubMed] [Google Scholar]
- 75.Nordestgaard B.G., Benn M., Schnohr P., Tybjaerg-Hansen A. Nonfasting triglycerides and risk of myocardial infarction, ischemic heart disease, and death in men and women. JAMA. 2007;298:299–308. doi: 10.1001/jama.298.3.299. [DOI] [PubMed] [Google Scholar]
- 76.Wilson P.W., D'Agostino R.B., Levy D., Belanger A.M., Silbershatz H., Kannel W.B. Prediction of coronary heart disease using risk factor categories. Circulation. 1998;97:1837–1847. doi: 10.1161/01.cir.97.18.1837. [DOI] [PubMed] [Google Scholar]
- 77.D'Agostino R.B., Sr., Vasan R.S., Pencina M.J. General cardiovascular risk profile for use in primary care: the framingham heart study. Circulation. 2008;117:743–753. doi: 10.1161/CIRCULATIONAHA.107.699579. [DOI] [PubMed] [Google Scholar]
- 78.Assmann G., Cullen P., Schulte H. Simple scoring scheme for calculating the risk of acute coronary events based on the 10-year follow-up of the prospective cardiovascular munster (procam) study. Circulation. 2002;105:310–315. doi: 10.1161/hc0302.102575. [DOI] [PubMed] [Google Scholar]
- 79.World health organization . WHO; Geneva: 2007. Prevention of Cardiovascular Disease Guidelines for Assessment and Management of Cardiovascular Risk. [Google Scholar]
- 80.Prepared by: British Cardiac Society BHS, Diabetes UK, HEART UK, Primary Care Cardiovascular Society, The Stroke Association Jbs 2: joint British societies' guidelines on prevention of cardiovascular disease in clinical practice. Heart. 2005;91:v1–v52. doi: 10.1136/hrt.2005.079988. [DOI] [PMC free article] [PubMed] [Google Scholar]
- 81.Conroy R.M., Pyorala K., Fitzgerald A.P. Estimation of ten-year risk of fatal cardiovascular disease in Europe: the score project. Eur Heart J. 2003;24:987–1003. doi: 10.1016/s0195-668x(03)00114-3. [DOI] [PubMed] [Google Scholar]
- 82.Hippisley-Cox J., Coupland C., Vinogradova Y. Predicting cardiovascular risk in England and Wales: prospective derivation and validation of qrisk2. BMJ. 2008;336:1475–1482. doi: 10.1136/bmj.39609.449676.25. [DOI] [PMC free article] [PubMed] [Google Scholar]
- 83.Hippisley-Cox J., Coupland C., Vinogradova Y., Robson J., May M., Brindle P. Derivation and validation of qrisk, a new cardiovascular disease risk score for the united kingdom: prospective open cohort study. BMJ. 2007;335:136. doi: 10.1136/bmj.39261.471806.55. [DOI] [PMC free article] [PubMed] [Google Scholar]
- 84.Hippisley-Cox J., Coupland C., Vinogradova Y., Robson J., Brindle P. Performance of the qrisk cardiovascular risk prediction algorithm in an independent UK sample of patients from general practice: a validation study. Heart. 2008;94:34–39. doi: 10.1136/hrt.2007.134890. [DOI] [PubMed] [Google Scholar]
- 85.Ridker P.M., Buring J.E., Rifai N., Cook N.R. Development and validation of improved algorithms for the assessment of global cardiovascular risk in women: the reynolds risk score. Jama. 2007;297:611–619. doi: 10.1001/jama.297.6.611. [DOI] [PubMed] [Google Scholar]
- 86.Ridker P.M., Paynter N.P., Rifai N., Gaziano J.M., Cook N.R. C-reactive protein and parental history improve global cardiovascular risk prediction: the reynolds risk score for men. Circulation. 2008;118:2243–2251. doi: 10.1161/CIRCULATIONAHA.108.814251. 2244p following 2251. [DOI] [PMC free article] [PubMed] [Google Scholar]
- 87.Greenland P., Smith S.C., Jr., Grundy S.M. Improving coronary heart disease risk assessment in asymptomatic people: role of traditional risk factors and noninvasive cardiovascular tests. Circulation. 2001;104:1863–1867. doi: 10.1161/hc4201.097189. [DOI] [PubMed] [Google Scholar]
- 88.Chia Y.C. Review of tools of cardiovascular disease risk stratification: Interpretation, customisation and application in clinical practice. Singap Med J. 2011;52:116–123. [PubMed] [Google Scholar]
- 89.Bansal M., Shrivastava S., Mehrotra R., Agarwal V., Kasliwal R.R. Low framingham risk score despite high prevalence of metabolic syndrome in asymptomatic north-Indian population. J Assoc Physicians India. 2009;57:17–22. [PubMed] [Google Scholar]
- 90.Kanjilal S., Rao V.S., Mukherjee M. Application of cardiovascular disease risk prediction models and the relevance of novel biomarkers to risk stratification in Asian Indians. Vasc Health Risk Manag. 2008;4:199–211. doi: 10.2147/vhrm.2008.04.01.199. [DOI] [PMC free article] [PubMed] [Google Scholar]
- 91.Goff D.C., Jr., Lloyd-Jones D.M., Bennett G. 2013 ACC/AHA guideline on the assessment of cardiovascular risk: a report of the American College of Cardiology/American Heart Association Task Force on Practice Guidelines. Circulation. 2014 Jun 24;129(25 Suppl 2):S49–S73. doi: 10.1161/01.cir.0000437741.48606.98. Epub 2013 Nov 12. [DOI] [PubMed] [Google Scholar]
- 92.Ridker P.M., Cook N.R. Statins: new american guidelines for prevention of cardiovascular disease. Lancet. 2013;382:1762–1765. doi: 10.1016/S0140-6736(13)62388-0. [DOI] [PubMed] [Google Scholar]
- 93.Amin N.P., Martin S.S., Blaha M.J., Nasir K., Blumenthal R.S., Michos E.D. Headed in the right direction but at risk for miscalculation: a critical appraisal of the 2013 ACC/AHA risk assessment guidelines. J Am Coll Cardiol. 2014;63:2789–2794. doi: 10.1016/j.jacc.2014.04.010. [DOI] [PMC free article] [PubMed] [Google Scholar]
- 94.Joint British societies' consensus recommendations for the prevention of cardiovascular disease (jbs3) Heart. 2014;100:ii1–ii67. doi: 10.1136/heartjnl-2014-305693. [DOI] [PubMed] [Google Scholar]
- 95.Stein J.H., Korcarz C.E., Hurst R.T. Use of carotid ultrasound to identify subclinical vascular disease and evaluate cardiovascular disease risk: a consensus statement from the American Society of echocardiography carotid intima-media thickness task force endorsed by the society for vascular medicine. J Am Soc Echocardiogr. 2008;21:93–111. doi: 10.1016/j.echo.2007.11.011. [DOI] [PubMed] [Google Scholar]
- 96.Greenland P., Bonow R.O., Brundage B.H. ACCF/AHA 2007 clinical expert consensus document on coronary artery calcium scoring by computed tomography in global cardiovascular risk assessment and in evaluation of patients with chest pain: a report of the american college of cardiology foundation clinical expert consensus task force (ACCF/AHA writing committee to update the 2000 expert consensus document on electron beam computed tomography) developed in collaboration with the society of atherosclerosis imaging and prevention and the society of cardiovascular computed tomography. J Am Coll Cardiol. 2007;49:378–402. doi: 10.1016/j.jacc.2006.10.001. [DOI] [PubMed] [Google Scholar]
- 97.Greenland P., Alpert J.S., Beller G.A. 2010 ACCF/AHA guideline for assessment of cardiovascular risk in asymptomatic adults: a report of the American College of Cardiology Foundation/American Heart Association Task Force on Practice Guidelines. J Am Coll Cardiol. 2010;56:e50–e103. doi: 10.1016/j.jacc.2010.09.001. [DOI] [PubMed] [Google Scholar]
- 98.Bovet P., Perret F., Cornuz J., Quilindo J., Paccaud F. Improved smoking cessation in smokers given ultrasound photographs of their own atherosclerotic plaques. Prev Med. 2002;34:215–220. doi: 10.1006/pmed.2001.0976. [DOI] [PubMed] [Google Scholar]
- 99.Wyman R.A., Gimelli G., McBride P.E., Korcarz C.E., Stein J.H. Does detection of carotid plaque affect physician behavior or motivate patients? Am Heart J. 2007;154:1072–1077. doi: 10.1016/j.ahj.2007.06.046. [DOI] [PubMed] [Google Scholar]
- 100.Barth J.D. Which tools are in your cardiac workshop? Carotid ultrasound, endothelial function, and magnetic resonance imaging. Am J Cardiol. 2001;87:8A–14A. doi: 10.1016/s0002-9149(01)01419-9. [DOI] [PubMed] [Google Scholar]
- 101.O'Malley P.G., Feuerstein I.M., Taylor A.J. Impact of electron beam tomography, with or without case management, on motivation, behavioral change, and cardiovascular risk profile: a randomized controlled trial. JAMA. 2003;289:2215–2223. doi: 10.1001/jama.289.17.2215. [DOI] [PubMed] [Google Scholar]
- 102.Orakzai R.H., Nasir K., Orakzai S.H. Effect of patient visualization of coronary calcium by electron beam computed tomography on changes in beneficial lifestyle behaviors. Am J Cardiol. 2008;101:999–1002. doi: 10.1016/j.amjcard.2007.11.059. [DOI] [PubMed] [Google Scholar]
- 103.Hansa G., Bhargava K., Bansal M., Tandon S., Kasliwal R.R. Carotid intima-media thickness and coronary artery disease: an Indian perspective. Asian Cardiovasc Thorac Ann. 2003;11:217–221. doi: 10.1177/021849230301100308. [DOI] [PubMed] [Google Scholar]
- 104.Kasliwal R.R., Bansal M., Gupta H., Agrawal S. Association of carotid intima-media thickness with left main coronary artery disease. Indian Heart J. 2007;59:50–55. [PubMed] [Google Scholar]
- 105.Kasliwal R.R., Agrawal S., Bansal M. Carotid intima-media thickness and brachial artery flow-mediated dilatation in patients with and without metabolic syndrome. Indian Heart J. 2006;58:42–46. [PubMed] [Google Scholar]
- 106.Kasliwal R.R., Bansal M., Bhargava K., Gupta H., Tandon S., Agrawal V. Carotid intima-media thickness and brachial-ankle pulse wave velocity in patients with and without coronary artery disease. Indian Heart J. 2004;56:117–122. [PubMed] [Google Scholar]
- 107.Ravikumar R., Deepa R., Shanthirani C., Mohan V. Comparison of carotid intima-media thickness, arterial stiffness, and brachial artery flow mediated dilatation in diabetic and nondiabetic subjects (the Chennai urban population study [cups-9]) Am J Cardiol. 2002;90:702–707. doi: 10.1016/s0002-9149(02)02593-6. [DOI] [PubMed] [Google Scholar]
- 108.Jadhav U.M., Kadam N.N. Association of microalbuminuria with carotid intima-media thickness and coronary artery disease–a cross-sectional study in western India. J Assoc Physicians India. 2002;50:1124–1129. [PubMed] [Google Scholar]
- 109.Rema M., Mohan V., Deepa R., Ravikumar R. Association of carotid intima-media thickness and arterial stiffness with diabetic retinopathy: the Chennai urban rural epidemiology study (cures-2) Diabetes Care. 2004;27:1962–1967. doi: 10.2337/diacare.27.8.1962. [DOI] [PubMed] [Google Scholar]
- 110.Chow C.K., McQuillan B., Raju P.K. Greater adverse effects of cholesterol and diabetes on carotid intima-media thickness in South Asian Indians: comparison of risk factor-imt associations in two population-based surveys. Atherosclerosis. 2008;199:116–122. doi: 10.1016/j.atherosclerosis.2007.10.008. [DOI] [PubMed] [Google Scholar]
- 111.Ahmad J., Ahmned F., Siddiqui M.A. Inflammatory markers, insulin resistance and carotid intima-media thickness in North-Indian type 2 diabetic subjects. J Assoc Physicians India. 2007;55:693–699. [PubMed] [Google Scholar]
- 112.Shrivastava S., Agrawal V., Kasliwal R.R. Coronary calcium and coronary artery disease: an Indian perspective. Indian Heart J. 2003;55:344–348. [PubMed] [Google Scholar]
- 113.Wasnik A., Raut A., Morani A. Coronary calcium scoring in asymptomatic Indian population: correlation with age, gender and risk factors–a prospective study on 500 subjects. Indian Heart J. 2007;59:232–238. [PubMed] [Google Scholar]
- 114.Pai J.K., Pischon T., Ma J. Inflammatory markers and the risk of coronary heart disease in men and women. N Engl J Med. 2004;351:2599–2610. doi: 10.1056/NEJMoa040967. [DOI] [PubMed] [Google Scholar]
- 115.Ridker P.M., Rifai N., Rose L., Buring J.E., Cook N.R. Comparison of c-reactive protein and low-density lipoprotein cholesterol levels in the prediction of first cardiovascular events. N Engl J Med. 2002;347:1557–1565. doi: 10.1056/NEJMoa021993. [DOI] [PubMed] [Google Scholar]
- 116.Ridker P.M., Hennekens C.H., Buring J.E., Rifai N. C-reactive protein and other markers of inflammation in the prediction of cardiovascular disease in women. N Engl J Med. 2000;342:836–843. doi: 10.1056/NEJM200003233421202. [DOI] [PubMed] [Google Scholar]
- 117.Ridker P.M., Cushman M., Stampfer M.J., Tracy R.P., Hennekens C.H. Inflammation, aspirin, and the risk of cardiovascular disease in apparently healthy men. N Engl J Med. 1997;336:973–979. doi: 10.1056/NEJM199704033361401. [DOI] [PubMed] [Google Scholar]
- 118.Ridker P.M., Danielson E., Fonseca F.A. Rosuvastatin to prevent vascular events in men and women with elevated c-reactive protein. N Engl J Med. 2008;359:2195–2207. doi: 10.1056/NEJMoa0807646. [DOI] [PubMed] [Google Scholar]
- 119.Mahadik S.R., Deo S.S., Mehtalia S.D. Association of adiposity, inflammation and atherosclerosis: the role of adipocytokines and crp in Asian Indian subjects. Metab Syndr Relat Disord. 2008;6:121–128. doi: 10.1089/met.2007.0034. [DOI] [PubMed] [Google Scholar]
- 120.Mahajan A., Tabassum R., Chavali S. High-sensitivity c-reactive protein levels and type 2 diabetes in urban North Indians. J Clin Endocrinol Metab. 2009;94:2123–2127. doi: 10.1210/jc.2008-2754. [DOI] [PubMed] [Google Scholar]
- 121.Jha H.C., Divya A., Prasad J., Mittal A. Plasma circulatory markers in male and female patients with coronary artery disease. Heart Lung. 2010;39:296–303. doi: 10.1016/j.hrtlng.2009.10.005. [DOI] [PubMed] [Google Scholar]
- 122.Ganguli D., Das N., Saha I. Association between inflammatory markers and cardiovascular risk factors in women from Kolkata, W.B, India. Arq Bras Cardiol. 2011;96:38–46. doi: 10.1590/s0066-782x2010005000165. [DOI] [PubMed] [Google Scholar]
- 123.Yajnik C.S., Joglekar C.V., Chinchwadkar M.C. Conventional and novel cardiovascular risk factors and markers of vascular damage in rural and urban Indian men. Int J Cardiol. 2011 doi: 10.1016/j.ijcard.2011.08.053. [DOI] [PubMed] [Google Scholar]
- 124.Enas E.A., Singh V., Munjal Y.P., Bhandari S., Yadave R.D., Manchanda S.C. Reducing the burden of coronary artery disease in India: challenges and opportunities. Indian Heart J. 2008;60:161–175. [PubMed] [Google Scholar]
- 125.Stubbs P., Seed M., Lane D., Collinson P., Kendall F., Noble M. Lipoprotein(a) as a risk predictor for cardiac mortality in patients with acute coronary syndromes. Eur Heart J. 1998;19:1355–1364. doi: 10.1053/euhj.1998.1043. [DOI] [PubMed] [Google Scholar]
- 126.Seman L.J., DeLuca C., Jenner J.L. Lipoprotein(a)-cholesterol and coronary heart disease in the framingham heart study. Clin Chem. 1999;45:1039–1046. [PubMed] [Google Scholar]
- 127.Budde T., Fechtrup C., Bosenberg E. Plasma lp(a) levels correlate with number, severity, and length-extension of coronary lesions in male patients undergoing coronary arteriography for clinically suspected coronary atherosclerosis. Arterioscler Thromb. 1994;14:1730–1736. doi: 10.1161/01.atv.14.11.1730. [DOI] [PubMed] [Google Scholar]
- 128.Nishino M., Malloy M.J., Naya-Vigne J., Russell J., Kane J.P., Redberg R.F. Lack of association of lipoprotein(a) levels with coronary calcium deposits in asymptomatic postmenopausal women. J Am Coll Cardiol. 2000;35:314–320. doi: 10.1016/s0735-1097(99)00555-0. [DOI] [PubMed] [Google Scholar]
- 129.Moliterno D.J., Jokinen E.V., Miserez A.R. No association between plasma lipoprotein(a) concentrations and the presence or absence of coronary atherosclerosis in african-americans. Arterioscler Thromb Vasc Biol. 1995;15:850–855. doi: 10.1161/01.atv.15.7.850. [DOI] [PubMed] [Google Scholar]
- 130.Danesh J., Collins R., Peto R. Lipoprotein(a) and coronary heart disease. Meta-analysis of prospective studies. Circulation. 2000;102:1082–1085. doi: 10.1161/01.cir.102.10.1082. [DOI] [PubMed] [Google Scholar]
- 131.Misra A. Atherosclerosis in Indians and lipoprotein (a) J Assoc Physicians India. 1999;47:313–317. [PubMed] [Google Scholar]
- 132.Frost P.H., Davis B.R., Burlando A.J. Serum lipids and incidence of coronary heart disease. Findings from the systolic hypertension in the elderly program (shep) Circulation. 1996;94:2381–2388. doi: 10.1161/01.cir.94.10.2381. [DOI] [PubMed] [Google Scholar]
- 133.Stone N.J., Robinson J., Lichtenstein A.H. 2013 ACC/AHA guideline on the treatment of blood cholesterol to reduce atherosclerotic cardiovascular risk in adults: a report of the American College of Cardiology/American Heart Association Task Force on Practice Guidelines. Circulation. 2013 [Google Scholar]
- 134.Ginsberg H.N., Elam M.B., Lovato L.C. Effects of combination lipid therapy in type 2 diabetes mellitus. N Engl J Med. 2010;362:1563–1574. doi: 10.1056/NEJMoa1001282. [DOI] [PMC free article] [PubMed] [Google Scholar]
- 135.Sacks F.M., Carey V.J., Fruchart J.C. Combination lipid therapy in type 2 diabetes. N Engl J Med. 2010;363:692–694. doi: 10.1056/NEJMc1006407. author reply 694–695. [DOI] [PubMed] [Google Scholar]
- 136.Mohan V., Radhika G., Sathya R.M., Tamil S.R., Ganesan A., Sudha V. Dietary carbohydrates, glycaemic load, food groups and newly detected type 2 diabetes among urban Asian Indian Population in Chennai, India (chennai urban rural epidemiology study 59) Br J Nutr. 2009;102:1498–1506. doi: 10.1017/S0007114509990468. [DOI] [PubMed] [Google Scholar]
- 137.Misra A., Sharma R., Pandey R.M., Khanna N. Adverse profile of dietary nutrients, anthropometry and lipids in urban slum dwellers of northern India. Eur J Clin Nutr. 2001;55:727–734. doi: 10.1038/sj.ejcn.1601214. [DOI] [PubMed] [Google Scholar]
- 138.Yagalla M.V., Hoerr S.L., Song W.O., Enas E., Garg A. Relationship of diet, abdominal obesity, and physical activity to plasma lipoprotein levels in Asian Indian physicians residing in the united states. J Am Diet Assoc. 1996;96:257–261. doi: 10.1016/S0002-8223(96)00077-6. [DOI] [PubMed] [Google Scholar]
- 139.Administrative Committee on Coordination/Subcommittee on nutrition (United Nations) vol. 2. National institute of nutrition; Hyderabad, India: 1992. (Second Report on the World Nutrition Sanitation). 1992;2. [Google Scholar]
- 140.Mensink R.P., Katan M.B. Effect of dietary fatty acids on serum lipids and lipoproteins. A meta-analysis of 27 trials. Arterioscler Thromb. 1992;12:911–919. doi: 10.1161/01.atv.12.8.911. [DOI] [PubMed] [Google Scholar]
- 141.Garg A. High-monounsaturated-fat diets for patients with diabetes mellitus: a meta-analysis. Am J Clin Nutr. 1998;67:582. doi: 10.1093/ajcn/67.3.577S. [DOI] [PubMed] [Google Scholar]
- 142.Kris-Etherton P.M., Pearson T.A., Wan Y. High-monounsaturated fatty acid diets lower both plasma cholesterol and triacylglycerol concentrations. Am J Clin Nutr. 1999;70:1009–1015. doi: 10.1093/ajcn/70.6.1009. [DOI] [PubMed] [Google Scholar]
- 143.Garg A., Grundy S.M., Unger R.H. Comparison of effects of high and low carbohydrate diets on plasma lipoproteins and insulin sensitivity in patients with mild niddm. Diabetes. 1992;41:1278–1285. [PubMed] [Google Scholar]
- 144.Vessby B., Uusitupa M., Hermansen K. Substituting dietary saturated for monounsaturated fat impairs insulin sensitivity in healthy men and women: the kanwu study. Diabetologia. 2001;44:312–319. doi: 10.1007/s001250051620. [DOI] [PubMed] [Google Scholar]
- 145.Lovegrove J.A., Lovegrove S.S., Lesauvage S.V.M. Moderate fish-oil supplementation reverses low-platelet, long-chain n-3 polyunsaturated fatty acid status and reduces plasma triacylglycerol concentrations in british indo-asians. Am J Clin Nutr. 2004;79:974–982. doi: 10.1093/ajcn/79.6.974. [DOI] [PubMed] [Google Scholar]
- 146.Ghafoorunissa Requirements of dietary fats to meet nutritional needs & prevent the risk of atherosclerosis–an Indian perspective. Indian J Med Res. 1998;108:191–202. [PubMed] [Google Scholar]
- 147.Ghafoorunissa Fats in Indian diets and their nutritional and health implications. Lipids. 1996;31:S287–291. doi: 10.1007/BF02637093. [DOI] [PubMed] [Google Scholar]
- 148.Chen Y.D., Coulston A.M., Zhou M.Y., Hollenbeck C.B., Reaven G.M. Why do low-fat high-carbohydrate diets accentuate postprandial lipemia in patients with niddm? Diabetes Care. 1995;18:10–16. doi: 10.2337/diacare.18.1.10. [DOI] [PubMed] [Google Scholar]
- 149.Narayan K.M., Echouffo-Tcheugui J.B. Analysis of the Indian council of medical research-India diabetes (icmr-indiab) study. J Diabetes Sci Technol. 2011;5:915–917. doi: 10.1177/193229681100500414. [DOI] [PMC free article] [PubMed] [Google Scholar]
- 150.Liatis S., Tsapogas P., Chala E. The consumption of bread enriched with betaglucan reduces ldl-cholesterol and improves insulin resistance in patients with type 2 diabetes. Diabetes Metab. 2009;35:115–120. doi: 10.1016/j.diabet.2008.09.004. [DOI] [PubMed] [Google Scholar]
- 151.Charlton K.E., Tapsell L.C., Batterham M.J. Effect of 6 weeks' consumption of β-glucan-rich oat products on cholesterol levels in mildly hypercholesterolaemic overweight adults. Br J Nutr. 2012;107:1037–1047. doi: 10.1017/S0007114511003850. [DOI] [PubMed] [Google Scholar]
- 152.Spiller G.A., Jenkins D.A., Bosello O., Gates J.E., Cragen L.N., Bruce B. Nuts and plasma lipids: an almond-based diet lowers ldl-c while preserving hdl-c. J Am Coll Nutr. 1998;17:285–290. doi: 10.1080/07315724.1998.10718761. [DOI] [PubMed] [Google Scholar]
- 153.Jenkins D.J.A., Hu F.B., Tapsell L.C., Josse A.R., Kendall C.W.C. Possible benefit of nuts in type 2 diabetes. J Nutr. 2008;138:1756. doi: 10.1093/jn/138.9.1752S. [DOI] [PubMed] [Google Scholar]
- 154.Kendall C.W.C., Josse A.R., Esfahani A., Jenkins D.J.A. Nuts, metabolic syndrome and diabetes. Br J Nutr. 2010;104:465–473. doi: 10.1017/S0007114510001546. [DOI] [PubMed] [Google Scholar]
- 155.Sabate J., Fraser G.E. Nuts: a new protective food against coronary heart disease. Curr Opin Lipidol. 1994;5:11–16. doi: 10.1097/00041433-199402000-00003. [DOI] [PubMed] [Google Scholar]
- 156.Anderson J.W., Allgood L.D., Lawrence A. Cholesterol-lowering effects of psyllium intake adjunctive to diet therapy in men and women with hypercholesterolemia: meta-analysis of 8 controlled trials. Am J Clin Nutr. 2000;71:472–479. doi: 10.1093/ajcn/71.2.472. [DOI] [PubMed] [Google Scholar]
- 157.Khan A., Safdar M., Ali Khan M.M., Khattak K.N., Anderson R.A. Cinnamon improves glucose and lipids of people with type 2 diabetes. Diabetes Care. 2003;26:3215–3218. doi: 10.2337/diacare.26.12.3215. [DOI] [PubMed] [Google Scholar]
- 158.Markey O., McClean C.M., Medlow P. Effect of cinnamon on gastric emptying, arterial stiffness, postprandial lipemia, glycemia, and appetite responses to high-fat breakfast. Cardiovasc Diabetol. 2011;10:78. doi: 10.1186/1475-2840-10-78. [DOI] [PMC free article] [PubMed] [Google Scholar]
- 159.Mani U.V., Mani I., Biswas M., Kumar S.N. An open-label study on the effect of flax seed powder (Linum usitatissimum) supplementation in the management of diabetes mellitus. J Diet Suppl. 2011;8:257–265. doi: 10.3109/19390211.2011.593615. [DOI] [PubMed] [Google Scholar]
- 160.Pan A., Yu D., Demark-Wahnefried W., Franco O.H., Lin X. Meta-analysis of the effects of flaxseed interventions on blood lipids. Am J Clin Nutr. 2009;90:288–297. doi: 10.3945/ajcn.2009.27469. [DOI] [PMC free article] [PubMed] [Google Scholar]
- 161.Kassaian N., Azadbakht L., Forghani B., Amini M. Effect of fenugreek seeds on blood glucose and lipid profiles in type 2 diabetic patients. Int J Vitam Nutr Res. 2009;79:34–39. doi: 10.1024/0300-9831.79.1.34. [DOI] [PubMed] [Google Scholar]
- 162.Sharma R.D., Raghuram T.C., Rao N.S. Effect of fenugreek seeds on blood glucose and serum lipids in type i diabetes. Eur J Clin Nutr. 1990;44:301–306. [PubMed] [Google Scholar]
- 163.Jenkins D.J., Kendall C.W., Mehling C.C. Combined effect of vegetable protein (soy) and soluble fiber added to a standard cholesterol-lowering diet. Metabolism. 1999;48:809–816. doi: 10.1016/s0026-0495(99)90184-1. [DOI] [PubMed] [Google Scholar]
- 164.Hu X., Gao J., Zhang Q. Soy fiber improves weight loss and lipid profile in overweight and obese adults: a randomized controlled trial. Mol Nutr Food Res. 2013 doi: 10.1002/mnfr.201300159. [DOI] [PubMed] [Google Scholar]
- 165.Akhtar M.S., Ramzan A., Ali A., Ahmad M. Effect of amla fruit (emblica officinalis gaertn.) on blood glucose and lipid profile of normal subjects and type 2 diabetic patients. Int J Food Sci Nutr. 2011;62:609–616. doi: 10.3109/09637486.2011.560565. [DOI] [PubMed] [Google Scholar]
- 166.Ried K., Toben C., Fakler P. Effect of garlic on serum lipids: an updated meta-analysis. Nutr Rev. 2013;71:282–299. doi: 10.1111/nure.12012. [DOI] [PubMed] [Google Scholar]
- 167.Shobana S., Krishnaswamy K., Sudha V. Finger millet (ragi, eleusine coracana l.): a review of its nutritional properties, processing, and plausible health benefits. Adv Food Nutr Res. 2013;69:1–39. doi: 10.1016/B978-0-12-410540-9.00001-6. [DOI] [PubMed] [Google Scholar]
- 168.Maulik S.K., Katiyar C.K. Terminalia arjuna in cardiovascular diseases: making the transition from traditional to modern medicine in India. Curr Pharm Biotechnol. 2010;11:855–860. doi: 10.2174/138920110793262051. [DOI] [PubMed] [Google Scholar]
- 169.Jakes R.W., Day N.E., Khaw K.T. Television viewing and low participation in vigorous recreation are independently associated with obesity and markers of cardiovascular disease risk: epic-norfolk population-based study. Eur J Clin Nutr. 2003;57:1089–1096. doi: 10.1038/sj.ejcn.1601648. [DOI] [PubMed] [Google Scholar]
- 170.Hu F.B., Li T.Y., Colditz G.A., Willett W.C., Manson J.E. Television watching and other sedentary behaviors in relation to risk of obesity and type 2 diabetes mellitus in women. JAMA. 2003;289:1785–1791. doi: 10.1001/jama.289.14.1785. [DOI] [PubMed] [Google Scholar]
- 171.Thompson P.D., Buchner D., Pina I.L. Exercise and physical activity in the prevention and treatment of atherosclerotic cardiovascular disease: a statement from the council on clinical cardiology (subcommittee on exercise, rehabilitation, and prevention) and the council on nutrition, physical activity, and metabolism (subcommittee on physical activity) Circulation. 2003;107:3109–3116. doi: 10.1161/01.CIR.0000075572.40158.77. [DOI] [PubMed] [Google Scholar]
- 172.Skoumas J., Pitsavos C., Panagiotakos D.B. Physical activity, high density lipoprotein cholesterol and other lipids levels, in men and women from the attica study. Lipids Health Dis. 2003;2 doi: 10.1186/1476-511X-2-3. 3–3. [DOI] [PMC free article] [PubMed] [Google Scholar]
- 173.Durstine J.L., Grandjean P.W., Davis P.G., Ferguson M.A., Alderson N.L., DuBose K.D. Blood lipid and lipoprotein adaptations to exercise: a quantitative analysis. Sports Med. 2001;31:1033–1062. doi: 10.2165/00007256-200131150-00002. [DOI] [PubMed] [Google Scholar]
- 174.Furukawa F., Kazuma K., Kawa M. Effects of an off-site walking program on energy expenditure, serum lipids, and glucose metabolism in middle-aged women. Biol Res Nurs. 2003;4:181–192. doi: 10.1177/1099800402239623. [DOI] [PubMed] [Google Scholar]
- 175.Kraus W.E., Houmard J.A., Duscha B.D. Effects of the amount and intensity of exercise on plasma lipoproteins. N Engl J Med. 2002;347:1483–1492. doi: 10.1056/NEJMoa020194. [DOI] [PubMed] [Google Scholar]
- 176.Fahlman M.M., Boardley D., Lambert C.P., Flynn M.G. Effects of endurance training and resistance training on plasma lipoprotein profiles in elderly women. J Gerontol A Biol Sci Med Sci. 2002;57:54–60. doi: 10.1093/gerona/57.2.b54. [DOI] [PubMed] [Google Scholar]
- 177.Leon A.S., Rice T., Mandel S. Blood lipid response to 20 weeks of supervised exercise in a large biracial population: the heritage family study. Metabolism. 2000;49:513–520. doi: 10.1016/s0026-0495(00)80018-9. [DOI] [PubMed] [Google Scholar]
- 178.Thompson P.D., Rader D.J. Does exercise increase hdl cholesterol in those who need it the most? Arterioscler Thromb Vasc Biol. 2001;21:1097–1098. doi: 10.1161/hq0701.092147. [DOI] [PubMed] [Google Scholar]
- 179.Couillard C., Despres J.P., Lamarche B. Effects of endurance exercise training on plasma hdl cholesterol levels depend on levels of triglycerides: evidence from men of the health, risk factors, exercise training and genetics (heritage) family study. Arterioscler Thromb Vasc Biol. 2001;21:1226–1232. doi: 10.1161/hq0701.092137. [DOI] [PubMed] [Google Scholar]
- 180.Zmuda J.M., Yurgalevitch S.M., Flynn M.M. Exercise training has little effect on hdl levels and metabolism in men with initially low hdl cholesterol. Atherosclerosis. 1998;137:215–221. doi: 10.1016/s0021-9150(97)00257-8. [DOI] [PubMed] [Google Scholar]
- 181.King A.C., Haskell W.L., Young D.R., Oka R.K., Stefanick M.L. Long-term effects of varying intensities and formats of physical activity on participation rates, fitness, and lipoproteins in men and women aged 50 to 65 years. Circulation. 1995;91:2596–2604. doi: 10.1161/01.cir.91.10.2596. [DOI] [PubMed] [Google Scholar]
- 182.Crouse S.F., O'Brien B.C., Grandjean P.W. Training intensity, blood lipids, and apolipoproteins in men with high cholesterol. J Appl Physiol (1985) 1997;82:270–277. doi: 10.1152/jappl.1997.82.1.270. [DOI] [PubMed] [Google Scholar]
- 183.Leon A.S., Gaskill S.E., Rice T. Variability in the response of hdl cholesterol to exercise training in the heritage family study. Int J Sports Med. 2002;23:1–9. doi: 10.1055/s-2002-19270. [DOI] [PubMed] [Google Scholar]
- 184.Hagberg J.M., Ferrell R.E., Dengel D.R., Wilund K.R. Exercise training-induced blood pressure and plasma lipid improvements in hypertensives may be genotype dependent. Hypertension. 1999;34:18–23. doi: 10.1161/01.hyp.34.1.18. [DOI] [PubMed] [Google Scholar]
- 185.Wilund K.R., Ferrell R.E., Phares D.A., Goldberg A.P., Hagberg J.M. Changes in high-density lipoprotein-cholesterol subfractions with exercise training may be dependent on cholesteryl ester transfer protein (cetp) genotype. Metabolism. 2002;51:774–778. doi: 10.1053/meta.2002.32730. [DOI] [PubMed] [Google Scholar]
- 186.Hagberg J.M., Ferrell R.E., Katzel L.I., Dengel D.R., Sorkin J.D., Goldberg A.P. Apolipoprotein e genotype and exercise training-induced increases in plasma high-density lipoprotein (hdl)- and hdl2-cholesterol levels in overweight men. Metabolism. 1999;48:943–945. doi: 10.1016/s0026-0495(99)90185-3. [DOI] [PubMed] [Google Scholar]
- 187.Kelley G.A., Kelley K.S. Aerobic exercise and lipids and lipoproteins in children and adolescents: a meta-analysis of randomized controlled trials. Atherosclerosis. 2007;191:447–453. doi: 10.1016/j.atherosclerosis.2006.04.019. [DOI] [PMC free article] [PubMed] [Google Scholar]
- 188.Kelley G.A., Kelley K.S. Effects of aerobic exercise on lipids and lipoproteins in adults with type 2 diabetes: a meta-analysis of randomized-controlled trials. Public Health. 2007;121:643–655. doi: 10.1016/j.puhe.2007.02.014. [DOI] [PMC free article] [PubMed] [Google Scholar]
- 189.Global Recommendations on Physical Activity for Health. World health organisation; 2010. Whqlibdoc.Who.Int/publications/2010/9789241599979_eng.Pdf Available from: [PubMed] [Google Scholar]
- 190.Unnikrishnan A.G., Kalra S., Garg M.K. Preventing obesity in India: weighing the options. Indian J Endocrinol Metab. 2012;16:4–6. doi: 10.4103/2230-8210.91174. [DOI] [PMC free article] [PubMed] [Google Scholar]
- 191.Criqui M.H., Wallace R.B., Heiss G., Mishkel M., Schonfeld G., Jones G.T. Cigarette smoking and plasma high-density lipoprotein cholesterol. The lipid research clinics program prevalence study. Circulation. 1980;62:70–76. [PubMed] [Google Scholar]
- 192.Gossett L.K., Johnson H.M., Piper M.E., Fiore M.C., Baker T.B., Stein J.H. Smoking intensity and lipoprotein abnormalities in active smokers. J Clin Lipidol. 2009;3:372–378. doi: 10.1016/j.jacl.2009.10.008. [DOI] [PMC free article] [PubMed] [Google Scholar]
- 193.Chelland Campbell S., Moffatt R.J., Stamford B.A. Smoking and smoking cessation – the relationship between cardiovascular disease and lipoprotein metabolism: a review. Atherosclerosis. 2008;201:225–235. doi: 10.1016/j.atherosclerosis.2008.04.046. [DOI] [PubMed] [Google Scholar]
- 194.Urahama N., Iguchi G., Shimizu M., Fujihira K., Kobayashi S., Baba H. Smoking and small, dense low-density lipoprotein particles: cross-sectional study. Nicotine Tob Res. 2008;10:1391–1395. doi: 10.1080/14622200802238852. [DOI] [PubMed] [Google Scholar]
- 195.Gepner A.D., Piper M.E., Johnson H.M., Fiore M.C., Baker T.B., Stein J.H. Effects of smoking and smoking cessation on lipids and lipoproteins: outcomes from a randomized clinical trial. Am Heart J. 2011;161:145–151. doi: 10.1016/j.ahj.2010.09.023. [DOI] [PMC free article] [PubMed] [Google Scholar]
- 196.Di Castelnuovo A., Costanzo S., Bagnardi V., Donati M.B., Iacoviello L., de Gaetano G. Alcohol dosing and total mortality in men and women: an updated meta-analysis of 34 prospective studies. Arch Intern Med. 2006;166:2437–2445. doi: 10.1001/archinte.166.22.2437. [DOI] [PubMed] [Google Scholar]
- 197.Roerecke M., Rehm J. Irregular heavy drinking occasions and risk of ischemic heart disease: a systematic review and meta-analysis. Am J Epidemiol. 2010;171:633–644. doi: 10.1093/aje/kwp451. [DOI] [PubMed] [Google Scholar]
- 198.Wakabayashi I. Association between alcohol drinking and metabolic syndrome in Japanese male workers with diabetes mellitus. J Atheroscler Thromb. 2011;18:684–692. doi: 10.5551/jat.7435. [DOI] [PubMed] [Google Scholar]
- 199.Roy A., Prabhakaran D., Jeemon P. Impact of alcohol on coronary heart disease in Indian men. Atherosclerosis. 2010;210:531–535. doi: 10.1016/j.atherosclerosis.2010.02.033. [DOI] [PubMed] [Google Scholar]
- 200.Anderson J.W., Liu C., Kryscio R.J. Blood pressure response to transcendental meditation: a meta-analysis. Am J Hypertens. 2008;21:310–316. doi: 10.1038/ajh.2007.65. [DOI] [PubMed] [Google Scholar]
- 201.Raub J.A. Psychophysiologic effects of hatha yoga on musculoskeletal and cardiopulmonary function: a literature review. J Altern Complement Med. 2002;8:797–812. doi: 10.1089/10755530260511810. [DOI] [PubMed] [Google Scholar]
- 202.Mahajan A.S., Reddy K.S., Sachdeva U. Lipid profile of coronary risk subjects following yogic lifestyle intervention. Indian Heart J. 1999;51:37–40. [PubMed] [Google Scholar]
- 203.Schmidt T., Wijga A., Von Zur Muhlen A., Brabant G., Wagner T.O. Changes in cardiovascular risk factors and hormones during a comprehensive residential three month kriya yoga training and vegetarian nutrition. Acta Physiol Scand Suppl. 1997;640:158–162. [PubMed] [Google Scholar]
- 204.Fields J.Z., Walton K.G., Schneider R.H. Effect of a multimodality natural medicine program on carotid atherosclerosis in older subjects: a pilot trial of maharishi vedic medicine. Am J Cardiol. 2002;89:952–958. doi: 10.1016/s0002-9149(02)02245-2. [DOI] [PubMed] [Google Scholar]
- 205.Manchanda S.C., Narang R., Reddy K.S. Retardation of coronary atherosclerosis with yoga lifestyle intervention. J Assoc Physicians India. 2000;48:687–694. [PubMed] [Google Scholar]
- 206.Ornish D., Brown S.E., Scherwitz L.W. Lifestyle changes and heart disease. Lancet. 1990;336:741–742. doi: 10.1016/0140-6736(90)92230-f. [DOI] [PubMed] [Google Scholar]
- 207.Gupta S.K., Sawhney R.C., Rai L. Regression of coronary atherosclerosis through healthy lifestyle in coronary artery disease patients–mount abu open heart trial. Indian Heart J. 2011;63:461–469. [PubMed] [Google Scholar]
- 208.Schneider R.H., Grim C.E., Rainforth M.V. Stress reduction in the secondary prevention of cardiovascular disease: randomized, controlled trial of transcendental meditation and health education in blacks. Circ Cardiovasc Qual Outcomes. 2012;5:750–758. doi: 10.1161/CIRCOUTCOMES.112.967406. [DOI] [PMC free article] [PubMed] [Google Scholar]
- 209.Gordon L., McGrowder D.A., Pena Y.T., Cabrera E., Lawrence-Wright M. Effect of exercise therapy on lipid parameters in patients with end-stage renal disease on hemodialysis. J Lab Physicians. 2012;4:17–23. doi: 10.4103/0974-2727.98665. [DOI] [PMC free article] [PubMed] [Google Scholar]
- 210.Goldstein J.L., Brown M.S. Molecular medicine. The cholesterol quartet. Science. 2001;292:1310–1312. doi: 10.1126/science.1061815. [DOI] [PubMed] [Google Scholar]
- 211.Sacks F.M., Campos H. Clinical review 163: cardiovascular endocrinology: low-density lipoprotein size and cardiovascular disease: a reappraisal. J Clin Endocrinol Metab. 2003;88:4525–4532. doi: 10.1210/jc.2003-030636. [DOI] [PubMed] [Google Scholar]
- 212.Downs J.R., Clearfield M., Weis S. Primary prevention of acute coronary events with lovastatin in men and women with average cholesterol levels: results of afcaps/texcaps. Air force/Texas coronary atherosclerosis prevention study. JAMA. 1998;279:1615–1622. doi: 10.1001/jama.279.20.1615. [DOI] [PubMed] [Google Scholar]
- 213.Shepherd J., Cobbe S.M., Ford I. Prevention of coronary heart disease with pravastatin in men with hypercholesterolemia. West of Scotland coronary prevention study group. N Engl J Med. 1995;333:1301–1307. doi: 10.1056/NEJM199511163332001. [DOI] [PubMed] [Google Scholar]
- 214.Sever P.S., Dahlof B., Poulter N.R. Prevention of coronary and stroke events with atorvastatin in hypertensive patients who have average or lower-than-average cholesterol concentrations, in the anglo-scandinavian cardiac outcomes trial–lipid lowering arm (ascot-lla): a multicentre randomised controlled trial. Lancet. 2003;361:1149–1158. doi: 10.1016/S0140-6736(03)12948-0. [DOI] [PubMed] [Google Scholar]
- 215.Major outcomes in moderately hypercholesterolemic, hypertensive patients randomized to pravastatin vs usual care: the antihypertensive and lipid-lowering treatment to prevent heart attack trial (allhat-llt) JAMA. 2002;288:2998–3007. doi: 10.1001/jama.288.23.2998. [DOI] [PubMed] [Google Scholar]
- 216.Colhoun H.M., Betteridge D.J., Durrington P.N. Primary prevention of cardiovascular disease with atorvastatin in type 2 diabetes in the collaborative atorvastatin diabetes study (cards): multicentre randomised placebo-controlled trial. Lancet. 2004;364:685–696. doi: 10.1016/S0140-6736(04)16895-5. [DOI] [PubMed] [Google Scholar]
- 217.Wierzbicki A.S. Fibrates in the treatment of cardiovascular risk and atherogenic dyslipidaemia. Curr Opin Cardiol. 2009;24:372–379. doi: 10.1097/HCO.0b013e32832c0b3d. [DOI] [PubMed] [Google Scholar]
- 218.Chapman M.J., Redfern J.S., McGovern M.E., Giral P. Niacin and fibrates in atherogenic dyslipidemia: pharmacotherapy to reduce cardiovascular risk. Pharmacol Ther. 2010;126:314–345. doi: 10.1016/j.pharmthera.2010.01.008. [DOI] [PubMed] [Google Scholar]
- 219.Brinton E.A. Does the addition of fibrates to statin therapy have a favorable risk to benefit ratio? Curr Atheroscler Rep. 2008;10:25–32. doi: 10.1007/s11883-008-0005-3. [DOI] [PubMed] [Google Scholar]
- 220.Davidson M.H., Armani A., McKenney J.M., Jacobson T.A. Safety considerations with fibrate therapy. Am J Cardiol. 2007;99:3C–18C. doi: 10.1016/j.amjcard.2006.11.016. [DOI] [PubMed] [Google Scholar]
- 221.Keech A., Simes R.J., Barter P. Effects of long-term fenofibrate therapy on cardiovascular events in 9795 people with type 2 diabetes mellitus (the FIELD study): randomised controlled trial. Lancet. 2005;366:1849–1861. doi: 10.1016/S0140-6736(05)67667-2. [DOI] [PubMed] [Google Scholar]
- 222.Scott R., O'Brien R., Fulcher G. Effects of fenofibrate treatment on cardiovascular disease risk in 9,795 individuals with type 2 diabetes and various components of the metabolic syndrome: the fenofibrate intervention and event lowering in diabetes (FIELD) study. Diabetes Care. 2009;32:493–498. doi: 10.2337/dc08-1543. [DOI] [PMC free article] [PubMed] [Google Scholar]
- 223.Goldfine A.B., Kaul S., Hiatt W.R. Fibrates in the treatment of dyslipidemias–time for a reassessment. N Engl J Med. 2011;365:481–484. doi: 10.1056/NEJMp1106688. [DOI] [PubMed] [Google Scholar]
- 224.Bays H.E., Goldberg R.B. The 'forgotten' bile acid sequestrants: Is now a good time to remember? Am J Ther. 2007;14:567–580. doi: 10.1097/MJT.0b013e31815a69fc. [DOI] [PubMed] [Google Scholar]
- 225.Hou R., Goldberg A.C. Lowering low-density lipoprotein cholesterol: statins, ezetimibe, bile acid sequestrants, and combinations: comparative efficacy and safety. Endocrinol Metab Clin North Am. 2009;38:79–97. doi: 10.1016/j.ecl.2008.11.007. [DOI] [PubMed] [Google Scholar]
- 226.Lipid research clinics program. JAMA. 1984;252:2545–2548. [PubMed] [Google Scholar]
- 227.Watts G.F., Lewis B., Brunt J.N. Effects on coronary artery disease of lipid-lowering diet, or diet plus cholestyramine, in the st thomas' atherosclerosis regression study (stars) Lancet. 1992;339:563–569. doi: 10.1016/0140-6736(92)90863-x. [DOI] [PubMed] [Google Scholar]
- 228.Brensike J.F., Levy R.I., Kelsey S.F. Effects of therapy with cholestyramine on progression of coronary arteriosclerosis: results of the nhlbi type ii coronary intervention study. Circulation. 1984;69:313–324. doi: 10.1161/01.cir.69.2.313. [DOI] [PubMed] [Google Scholar]
- 229.Blankenhorn D.H., Nessim S.A., Johnson R.L., Sanmarco M.E., Azen S.P., Cashin-Hemphill L. Beneficial effects of combined colestipol-niacin therapy on coronary atherosclerosis and coronary venous bypass grafts. JAMA. 1987;257:3233–3240. [PubMed] [Google Scholar]
- 230.Kane J.P., Malloy M.J., Ports T.A., Phillips N.R., Diehl J.C., Havel R.J. Regression of coronary atherosclerosis during treatment of familial hypercholesterolemia with combined drug regimens. JAMA. 1990;264:3007–3012. [PubMed] [Google Scholar]
- 231.Brown G., Albers J.J., Fisher L.D. Regression of coronary artery disease as a result of intensive lipid-lowering therapy in men with high levels of apolipoprotein b. N Engl J Med. 1990;323:1289–1298. doi: 10.1056/NEJM199011083231901. [DOI] [PubMed] [Google Scholar]
- 232.Villines T.C., Kim A.S., Gore R.S., Taylor A.J. Niacin: the evidence, clinical use, and future directions. Curr Atheroscler Rep. 2012;14:49–59. doi: 10.1007/s11883-011-0212-1. [DOI] [PubMed] [Google Scholar]
- 233.Farmer J.A. Nicotinic acid: a new look at an old drug. Curr Atheroscler Rep. 2009;11:87–92. doi: 10.1007/s11883-009-0014-x. [DOI] [PubMed] [Google Scholar]
- 234.Wanders D., Judd R.L. Future of gpr109a agonists in the treatment of dyslipidaemia. Diabetes Obes Metab. 2011;13:685–691. doi: 10.1111/j.1463-1326.2011.01400.x. [DOI] [PubMed] [Google Scholar]
- 235.Karpe F., Chamas L. Hyperlipidaemia and cardiovascular disease: nonantilipolytic effects of nicotinic acid in adipose tissue. Curr Opin Lipidol. 2010;21:282–283. doi: 10.1097/MOL.0b013e32833965c5. [DOI] [PubMed] [Google Scholar]
- 236.Boden W.E., Probstfield J.L., Anderson T. Niacin in patients with low hdl cholesterol levels receiving intensive statin therapy. N Engl J Med. 2011;365:2255–2267. doi: 10.1056/NEJMoa1107579. [DOI] [PubMed] [Google Scholar]
- 237.Hps2-thrive randomized placebo-controlled trial in 25 673 high-risk patients of er niacin/laropiprant: trial design, pre-specified muscle and liver outcomes, and reasons for stopping study treatment. Eur Heart J. 2013;34:1279–1291. doi: 10.1093/eurheartj/eht055. [DOI] [PMC free article] [PubMed] [Google Scholar]
- 238.Saito Y., Yokoyama M., Origasa H. Effects of epa on coronary artery disease in hypercholesterolemic patients with multiple risk factors: sub-analysis of primary prevention cases from the japan epa lipid intervention study (jelis) Atherosclerosis. 2008;200:135–140. doi: 10.1016/j.atherosclerosis.2008.06.003. [DOI] [PubMed] [Google Scholar]
- 239.Jacobson T.A., Armani A., McKenney J.M., Guyton J.R. Safety considerations with gastrointestinally active lipid-lowering drugs. Am J Cardiol. 2007;99:47C–55C. doi: 10.1016/j.amjcard.2006.11.022. [DOI] [PubMed] [Google Scholar]
- 240.Yatskar L., Fisher E.A., Schwartzbard A. Ezetimibe: rationale and role in the management of hypercholesterolemia. Clin Cardiol. 2006;29:52–55. doi: 10.1002/clc.4960290203. [DOI] [PMC free article] [PubMed] [Google Scholar]
- 241.Kastelein J.J., Akdim F., Stroes E.S. Simvastatin with or without ezetimibe in familial hypercholesterolemia. N Engl J Med. 2008;358:1431–1443. doi: 10.1056/NEJMoa0800742. [DOI] [PubMed] [Google Scholar]
- 242.Standards of medical care in diabetes–2013. Diabetes Care. 2013;36:S11–66. doi: 10.2337/dc13-S011. [DOI] [PMC free article] [PubMed] [Google Scholar]
- 243.Wu C.C., Sy R., Tanphaichitr V., Hin A.T., Suyono S., Lee Y.T. Comparing the efficacy and safety of atorvastatin and simvastatin in asians with elevated low-density lipoprotein-cholesterol–a multinational, multicenter, double-blind study. J Formos Med Assoc. 2002;101:478–487. [PubMed] [Google Scholar]
- 244.Efficacy of atorvastatin in primary hypercholesterolemia. Japan cholesterol lowering atorvastatin study (j-clas) group. Am J Cardiol. 1997;79:1248–1252. [PubMed] [Google Scholar]
- 245.Yamamoto A., Arakawa K., Sasaki J. Clinical effects of rosuvastatin, a new hmg-coa reductase inhibitor, in japanese patients with primary hypercholesterolemia: an early phase ii study. J Atheroscler Thromb. 2002;9:48–56. doi: 10.5551/jat.9.48. [DOI] [PubMed] [Google Scholar]
- 246.Wang K.Y., Ting C.T. A randomized, double-blind, placebo-controlled, 8-week study to evaluate the efficacy and safety of once daily atorvastatin (10 mg) in patients with elevated ldl-cholesterol. Jpn Heart J. 2001;42:725–738. doi: 10.1536/jhj.42.725. [DOI] [PubMed] [Google Scholar]
- 247.Deedwania P.C., Gupta M., Stein M., Ycas J., Gold A. Comparison of rosuvastatin versus atorvastatin in south-asian patients at risk of coronary heart disease (from the iris trial) Am J Cardiol. 2007;99:1538–1543. doi: 10.1016/j.amjcard.2007.01.028. [DOI] [PubMed] [Google Scholar]
- 248.Tan C.E., Loh L.M., Tai E.S. Do singapore patients require lower doses of statins? The sgh lipid clinic experience. Singap Med J. 2003;44:635–638. [PubMed] [Google Scholar]
- 249.Matsuzawa Y., Kita T., Mabuchi H. Sustained reduction of serum cholesterol in low-dose 6-year simvastatin treatment with minimum side effects in 51,321 japanese hypercholesterolemic patients. Circ J. 2003;67:287–294. doi: 10.1253/circj.67.287. [DOI] [PubMed] [Google Scholar]
- 250.Kim K., Johnson J.A., Derendorf H. Differences in drug pharmacokinetics between east asians and caucasians and the role of genetic polymorphisms. J Clin Pharmacol. 2004;44:1083–1105. doi: 10.1177/0091270004268128. [DOI] [PubMed] [Google Scholar]
- 251.Grundy S.M., Cleeman J.I., Merz C.N. Implications of recent clinical trials for the national cholesterol education program adult treatment panel iii guidelines. Circulation. 2004;110:227–239. doi: 10.1161/01.CIR.0000133317.49796.0E. [DOI] [PubMed] [Google Scholar]
- 252.Nakamura H. Primary prevention of cardiovascular diseases among hypercholesterolemic japanese with a low dose of pravastatin. Atheroscler Suppl. 2007;8:13–17. doi: 10.1016/j.atherosclerosissup.2007.02.003. [DOI] [PubMed] [Google Scholar]
- 253.Neaton J.D., Blackburn H., Jacobs D. Serum cholesterol level and mortality findings for men screened in the multiple risk factor intervention trial. Multiple risk factor intervention trial research group. Arch Intern Med. 1992;152:1490–1500. [PubMed] [Google Scholar]
- 254.Iso H., Naito Y., Kitamura A. Serum total cholesterol and mortality in a japanese population. J Clin Epidemiol. 1994;47:961–969. doi: 10.1016/0895-4356(94)90110-4. [DOI] [PubMed] [Google Scholar]
- 255.Stemmermann G.N., Chyou P.H., Kagan A., Nomura A.M., Yano K. Serum cholesterol and mortality among japanese-american men. The honolulu (Hawaii) heart program. Arch Intern Med. 1991;151:969–972. [PubMed] [Google Scholar]
- 256.Cullen P., Schulte H., Assmann G. The munster heart study (procam): total mortality in middle-aged men is increased at low total and ldl cholesterol concentrations in smokers but not in nonsmokers. Circulation. 1997;96:2128–2136. doi: 10.1161/01.cir.96.7.2128. [DOI] [PubMed] [Google Scholar]
- 257.Matsuzaki M., Kita T., Mabuchi H. Large scale cohort study of the relationship between serum cholesterol concentration and coronary events with low-dose simvastatin therapy in japanese patients with hypercholesterolemia. Circ J. 2002;66:1087–1095. doi: 10.1253/circj.66.1087. [DOI] [PubMed] [Google Scholar]
- 258.Kaul U., Varma J., Kahali D. Post-marketing study of clinical experience of atorvastatin 80 mg vs 40 mg in Indian patients with acute coronary syndrome- a randomized, multi-centre study (cure-acs) J Assoc Physicians India. 2013;61:97–101. [PubMed] [Google Scholar]
- 259.Standards of medical care in diabetes–2014. Diabetes Care. 2014;37:S14–80. doi: 10.2337/dc14-S014. [DOI] [PubMed] [Google Scholar]
- 260.Boekholdt S.M., Arsenault B.J., Mora S. Association of ldl cholesterol, non-hdl cholesterol, and apolipoprotein b levels with risk of cardiovascular events among patients treated with statins: a meta-analysis. JAMA. 2012;307:1302–1309. doi: 10.1001/jama.2012.366. [DOI] [PubMed] [Google Scholar]
- 261.Jellinger P.S., Smith D.A., Mehta A.E. American association of clinical endocrinologists' guidelines for management of dyslipidemia and prevention of atherosclerosis. Endocr Pract. 2012;18:1–78. doi: 10.4158/ep.18.s1.1. (22522068) [DOI] [PubMed] [Google Scholar]
- 262.Libby P., Nathan D.M., Abraham K. Report of the national heart, lung, and blood institute-national institute of diabetes and digestive and kidney diseases working group on cardiovascular complications of type 1 diabetes mellitus. Circulation. 2005;111:3489–3493. doi: 10.1161/CIRCULATIONAHA.104.529651. [DOI] [PubMed] [Google Scholar]
- 263.Sattar N., Preiss D., Murray H.M. Statins and risk of incident diabetes: a collaborative meta-analysis of randomised statin trials. Lancet. 2010;375:735–742. doi: 10.1016/S0140-6736(09)61965-6. [DOI] [PubMed] [Google Scholar]
- 264.Yokote K., Saito Y. Influence of statins on glucose tolerance in patients with type 2 diabetes mellitus: subanalysis of the collaborative study on hypercholesterolemia drug intervention and their benefits for atherosclerosis prevention (Chiba study) J Atheroscler Thromb. 2009;16:297–298. doi: 10.5551/jat.e1008. [DOI] [PubMed] [Google Scholar]
- 265.Fonseca V.A., Handelsman Y., Staels B. Colesevelam lowers glucose and lipid levels in type 2 diabetes: the clinical evidence. Diabetes Obes Metab. 2010;12:384–392. doi: 10.1111/j.1463-1326.2009.01181.x. [DOI] [PMC free article] [PubMed] [Google Scholar]
- 266.Kalra S., Dhamija P., Sahay R. Pioglitazone: a prudent prescription. Indian J Endocrinol Metab. 2013;17:370–372. doi: 10.4103/2230-8210.111594. [DOI] [PMC free article] [PubMed] [Google Scholar]
- 267.Matikainen N., Manttari S., Schweizer A. Vildagliptin therapy reduces postprandial intestinal triglyceride-rich lipoprotein particles in patients with type 2 diabetes. Diabetologia. 2006;49:2049–2057. doi: 10.1007/s00125-006-0340-2. [DOI] [PubMed] [Google Scholar]
- 268.Nissen S.E., Tuzcu E.M., Schoenhagen P. Effect of intensive compared with moderate lipid-lowering therapy on progression of coronary atherosclerosis: a randomized controlled trial. JAMA. 2004;291:1071–1080. doi: 10.1001/jama.291.9.1071. [DOI] [PubMed] [Google Scholar]
- 269.Yokote K., Bujo H., Hanaoka H. Multicenter collaborative randomized parallel group comparative study of pitavastatin and atorvastatin in japanese hypercholesterolemic patients: collaborative study on hypercholesterolemia drug intervention and their benefits for atherosclerosis prevention (Chiba study) Atherosclerosis. 2008;201:345–352. doi: 10.1016/j.atherosclerosis.2008.02.008. [DOI] [PubMed] [Google Scholar]
- 270.Donaghue K., Chiarelli F., Trotta D., Allgrove J., Dahl-Jørgensen K. Microvascular and macrovascular complications. In: Hanas R.D.K., Klingensmith G., Swift P., Colagiuri S., editors. Global IDF/ISPAD Guideline for Diabetes in Childhood and Adolescence. International Diabetes Federation; Brussels: 2011. pp. 116–122. [Google Scholar]
- 271.Yilmaz Y. Is nonalcoholic fatty liver disease the hepatic expression of the metabolic syndrome? World J Hepatol. 2012;4:332–334. doi: 10.4254/wjh.v4.i12.332. [DOI] [PMC free article] [PubMed] [Google Scholar]
- 272.Wennberg P., Gustafsson P.E., Dunstan D.W., Wennberg M., Hammarstrom A. Television viewing and low leisure-time physical activity in adolescence independently predict the metabolic syndrome in mid-adulthood. Diabetes Care. 2013;36:2090–2097. doi: 10.2337/dc12-1948. [DOI] [PMC free article] [PubMed] [Google Scholar]
- 273.Grundy S.M., Cleeman J.I., Daniels S.R. Diagnosis and management of the metabolic syndrome: an American Heart Association/National Heart, Lung, and Blood Institute Scientific Statement. Circulation. 2005;112:2735–2752. doi: 10.1161/CIRCULATIONAHA.105.169404. [DOI] [PubMed] [Google Scholar]
- 274.Misra A., Wasir J.S., Pandey R.M. An evaluation of candidate definitions of the metabolic syndrome in adult Asian Indians. Diabetes Care. 2005;28:398–403. doi: 10.2337/diacare.28.2.398. [DOI] [PubMed] [Google Scholar]
- 275.Simmons R.K., Alberti K.G., Gale E.A. The metabolic syndrome: useful concept or clinical tool? Report of a WHO expert consultation. Diabetologia. 2010;53:600–605. doi: 10.1007/s00125-009-1620-4. [DOI] [PubMed] [Google Scholar]
- 276.Rosenson R.S. Myocardial injury: the acute phase response and lipoprotein metabolism. J Am Coll Cardiol. 1993;22:933–940. doi: 10.1016/0735-1097(93)90213-k. [DOI] [PubMed] [Google Scholar]
- 277.Fresco C., Maggioni A.P., Signorini S. Variations in lipoprotein levels after myocardial infarction and unstable angina: the Latin trial. Ital Heart J. 2002;3:587–592. [PubMed] [Google Scholar]
- 278.Henkin Y., Crystal E., Goldberg Y. Usefulness of lipoprotein changes during acute coronary syndromes for predicting postdischarge lipoprotein levels. Am J Cardiol. 2002;89:7–11. doi: 10.1016/s0002-9149(01)02154-3. [DOI] [PubMed] [Google Scholar]
- 279.Sacks F.M., Pfeffer M.A., Moye L.A. The effect of pravastatin on coronary events after myocardial infarction in patients with average cholesterol levels. Cholesterol and recurrent events trial investigators. N Engl J Med. 1996;335:1001–1009. doi: 10.1056/NEJM199610033351401. [DOI] [PubMed] [Google Scholar]
- 280.Prevention of cardiovascular events and death with pravastatin in patients with coronary heart disease and a broad range of initial cholesterol levels. The long-term intervention with pravastatin in ischaemic disease (lipid) study group. N Engl J Med. 1998;339:1349–1357. doi: 10.1056/NEJM199811053391902. [DOI] [PubMed] [Google Scholar]
- 281.Randomised trial of cholesterol lowering in 4444 patients with coronary heart disease: the scandinavian simvastatin survival study (4s) Lancet. 1994;344:1383–1389. [PubMed] [Google Scholar]
- 282.Mrc/bhf heart protection study of cholesterol lowering with simvastatin in 20,536 high-risk individuals: a randomised placebo-controlled trial. Lancet. 2002;360:7–22. doi: 10.1016/S0140-6736(02)09327-3. [DOI] [PubMed] [Google Scholar]
- 283.Stenestrand U., Wallentin L. Early statin treatment following acute myocardial infarction and 1-year survival. JAMA. 2001;285:430–436. doi: 10.1001/jama.285.4.430. [DOI] [PubMed] [Google Scholar]
- 284.Aronow H.D., Topol E.J., Roe M.T. Effect of lipid-lowering therapy on early mortality after acute coronary syndromes: an observational study. Lancet. 2001;357:1063–1068. doi: 10.1016/S0140-6736(00)04257-4. [DOI] [PubMed] [Google Scholar]
- 285.Schwartz G.G., Olsson A.G., Ezekowitz M.D. Effects of atorvastatin on early recurrent ischemic events in acute coronary syndromes: the miracl study: a randomized controlled trial. Jama. 2001;285:1711–1718. doi: 10.1001/jama.285.13.1711. [DOI] [PubMed] [Google Scholar]
- 286.Liem A.H., van Boven A.J., Veeger N.J. Effect of fluvastatin on ischaemia following acute myocardial infarction: a randomized trial. Eur Heart J. 2002;23:1931–1937. doi: 10.1053/euhj.2002.3291. [DOI] [PubMed] [Google Scholar]
- 287.Cannon C.P., Braunwald E., McCabe C.H. Intensive versus moderate lipid lowering with statins after acute coronary syndromes. N Engl J Med. 2004;350:1495–1504. doi: 10.1056/NEJMoa040583. [DOI] [PubMed] [Google Scholar]
- 288.de Lemos J.A., Blazing M.A., Wiviott S.D. Early intensive vs a delayed conservative simvastatin strategy in patients with acute coronary syndromes: phase z of the a to z trial. Jama. 2004;292:1307–1316. doi: 10.1001/jama.292.11.1307. [DOI] [PubMed] [Google Scholar]
- 289.Thompson P.L., Meredith I., Amerena J., Campbell T.J., Sloman J.G., Harris P.J. Effect of pravastatin compared with placebo initiated within 24 hours of onset of acute myocardial infarction or unstable angina: the pravastatin in acute coronary treatment (pact) trial. Am Heart J. 2004;148:e2. doi: 10.1016/j.ahj.2003.10.052. [DOI] [PubMed] [Google Scholar]
- 290.Preiss D., Seshasai S.R., Welsh P. Risk of incident diabetes with intensive-dose compared with moderate-dose statin therapy: a meta-analysis. JAMA. 2011;305:2556–2564. doi: 10.1001/jama.2011.860. [DOI] [PubMed] [Google Scholar]
- 291.Levey A.S., Beto J.A., Coronado B.E. Controlling the epidemic of cardiovascular disease in chronic renal disease: What do we know? What do we need to learn? Where do we go from here? National kidney foundation task force on cardiovascular disease. Am J Kidney Dis. 1998;32:853–906. doi: 10.1016/s0272-6386(98)70145-3. [DOI] [PubMed] [Google Scholar]
- 292.K/doqi clinical practice guidelines for chronic kidney disease: evaluation, classification, and stratification. Am J Kidney Dis. 2002;39:S1–266. [PubMed] [Google Scholar]
- 293.Levin A., Djurdjev O., Barrett B. Cardiovascular disease in patients with chronic kidney disease: getting to the heart of the matter. Am J Kidney Dis. 2001;38:1398–1407. doi: 10.1053/ajkd.2001.29275. [DOI] [PubMed] [Google Scholar]
- 294.Tonelli M., Bohm C., Pandeya S., Gill J., Levin A., Kiberd B.A. Cardiac risk factors and the use of cardioprotective medications in patients with chronic renal insufficiency. Am J Kidney Dis. 2001;37:484–489. [PubMed] [Google Scholar]
- 295.Landray M.J., Thambyrajah J., McGlynn F.J. Epidemiological evaluation of known and suspected cardiovascular risk factors in chronic renal impairment. Am J Kidney Dis. 2001;38:537–546. doi: 10.1053/ajkd.2001.26850. [DOI] [PubMed] [Google Scholar]
- 296.Jungers P., Massy Z.A., Nguyen Khoa T. Incidence and risk factors of atherosclerotic cardiovascular accidents in predialysis chronic renal failure patients: a prospective study. Nephrol Dial Transpl. 1997;12:2597–2602. doi: 10.1093/ndt/12.12.2597. [DOI] [PubMed] [Google Scholar]
- 297.Kasiske B.L. Hyperlipidemia in patients with chronic renal disease. Am J Kidney Dis. 1998;32:S142–156. doi: 10.1053/ajkd.1998.v32.pm9820472. [DOI] [PubMed] [Google Scholar]
- 298.Lowrie E.G., Lew N.L. Death risk in hemodialysis patients: the predictive value of commonly measured variables and an evaluation of death rate differences between facilities. Am J Kidney Dis. 1990;15:458–482. doi: 10.1016/s0272-6386(12)70364-5. [DOI] [PubMed] [Google Scholar]
- 299.Iseki K., Yamazato M., Tozawa M., Takishita S. Hypocholesterolemia is a significant predictor of death in a cohort of chronic hemodialysis patients. Kidney Int. 2002;61:1887–1893. doi: 10.1046/j.1523-1755.2002.00324.x. [DOI] [PubMed] [Google Scholar]
- 300.Liu Y., Coresh J., Eustace J.A. Association between cholesterol level and mortality in dialysis patients: role of inflammation and malnutrition. JAMA. 2004;291:451–459. doi: 10.1001/jama.291.4.451. [DOI] [PubMed] [Google Scholar]
- 301.Harris K.P.G., Wheeler D.C., Chong C.C. A placebo-controlled trial examining atorvastatin in dyslipidemic patients undergoing capd. Kidney Int. 2002;61:1469–1474. doi: 10.1046/j.1523-1755.2002.00262.x. [DOI] [PubMed] [Google Scholar]
- 302.Hufnagel G., Michel C., Vrtovsnik F., Queffeulou G., Kossari N., Mignon F. Effects of atorvastatin on dyslipidaemia in uraemic patients on peritoneal dialysis. Nephrol Dial Transpl. 2000;15:684–688. doi: 10.1093/ndt/15.5.684. [DOI] [PubMed] [Google Scholar]
- 303.Saltissi D., Morgan C., Rigby R.J., Westhuyzen J. Safety and efficacy of simvastatin in hypercholesterolemic patients undergoing chronic renal dialysis. Am J Kidney Dis. 2002;39:283–290. doi: 10.1053/ajkd.2002.30547. [DOI] [PubMed] [Google Scholar]
- 304.Chang J.W., Yang W.S., Min W.K., Lee S.K., Park J.S., Kim S.B. Effects of simvastatin on high-sensitivity c-reactive protein and serum albumin in hemodialysis patients. Am J Kidney Dis. 2002;39:1213–1217. doi: 10.1053/ajkd.2002.33393. [DOI] [PubMed] [Google Scholar]
- 305.Nishikawa O., Mune M., Miyano M. Effect of simvastatin on the lipid profile of hemodialysis patients. Kidney Int Suppl. 1999;71:S219–221. doi: 10.1046/j.1523-1755.1999.07157.x. [DOI] [PubMed] [Google Scholar]
- 306.van den Akker J.M., Bredie S.J.H., Diepenveen S.H.A., van Tits L.J.H., Stalenhoef A.F.H., van Leusen R. Atorvastatin and simvastatin in patients on hemodialysis: effects on lipoproteins, c-reactive protein and in vivo oxidized ldl. J Nephrol. 2003;16:238–244. [PubMed] [Google Scholar]
- 307.Sahu K., Sharma R., Gupta A. Effect of lovastatin, an hmg coa reductase inhibitor, on acute renal allograft rejection. Clin Transpl. 2001;15:173–175. doi: 10.1034/j.1399-0012.2001.150305.x. [DOI] [PubMed] [Google Scholar]
- 308.Kasiske B.L., Heim-Duthoy K.L., Singer G.G., Watschinger B., Germain M.J., Bastani B. The effects of lipid-lowering agents on acute renal allograft rejection. Transplantation. 2001;72:223–227. doi: 10.1097/00007890-200107270-00009. [DOI] [PubMed] [Google Scholar]
- 309.Holdaas H., Jardine A.G., Wheeler D.C. Effect of fluvastatin on acute renal allograft rejection: a randomized multicenter trial. Kidney Int. 2001;60:1990–1997. doi: 10.1046/j.1523-1755.2001.00010.x. [DOI] [PubMed] [Google Scholar]
- 310.Holdaas H., Fellstrom B., Jardine A.G. Effect of fluvastatin on cardiac outcomes in renal transplant recipients: a multicentre, randomised, placebo-controlled trial. Lancet. 2003;361:2024–2031. doi: 10.1016/S0140-6736(03)13638-0. [DOI] [PubMed] [Google Scholar]
- 311.Tonelli M., Moye L., Sacks F.M., Kiberd B., Curhan G. Pravastatin for secondary prevention of cardiovascular events in persons with mild chronic renal insufficiency. Ann Intern Med. 2003;138:98–9104. doi: 10.7326/0003-4819-138-2-200301210-00010. [DOI] [PubMed] [Google Scholar]
- 312.Seliger S.L., Weiss N.S., Gillen D.L. Hmg-coa reductase inhibitors are associated with reduced mortality in esrd patients. Kidney Int. 2002;61:297–304. doi: 10.1046/j.1523-1755.2002.00109.x. [DOI] [PubMed] [Google Scholar]
- 313.Fried L.F., Orchard T.J., Kasiske B.L. Effect of lipid reduction on the progression of renal disease: a meta-analysis. Kidney Int. 2001;59:260–269. doi: 10.1046/j.1523-1755.2001.00487.x. [DOI] [PubMed] [Google Scholar]
- 314.Tonelli M., Moye L., Sacks F.M., Cole T., Curhan G.C. Effect of pravastatin on loss of renal function in people with moderate chronic renal insufficiency and cardiovascular disease. J Am Soc Nephrol. 2003;14:1605–1613. doi: 10.1097/01.asn.0000068461.45784.2f. [DOI] [PubMed] [Google Scholar]
- 315.Bianchi S., Bigazzi R., Caiazza A., Campese V.M. A controlled, prospective study of the effects of atorvastatin on proteinuria and progression of kidney disease. Am J Kidney Dis. 2003;41:565–570. doi: 10.1053/ajkd.2003.50140. [DOI] [PubMed] [Google Scholar]
- 316.Broeders N., Knoop C., Antoine M., Tielemans C., Abramowicz D. Fibrate-induced increase in blood urea and creatinine: Is gemfibrozil the only innocuous agent? Nephrol Dial Transpl. 2000;15:1993–1999. doi: 10.1093/ndt/15.12.1993. [DOI] [PubMed] [Google Scholar]
- 317.Westphal S., Dierkes J., Luley C. Effects of fenofibrate and gemfibrozil on plasma homocysteine. Lancet. 2001;358:39–40. doi: 10.1016/S0140-6736(00)05271-5. [DOI] [PubMed] [Google Scholar]
- 318.Hottelart C., El Esper N., Rose F., Achard J.-M., Fournier A. Fenofibrate increases creatininemia by increasing metabolic production of creatinine. Nephron. 2002;92:536–541. doi: 10.1159/000064083. [DOI] [PubMed] [Google Scholar]
- 319.Dierkes J., Westphal S., Luley C. Serum homocysteine increases after therapy with fenofibrate or bezafibrate. Lancet. 1999;354:219–220. doi: 10.1016/S0140-6736(99)02153-4. [DOI] [PubMed] [Google Scholar]
- 320.Niacin in patients with low hdl cholesterol levels receiving intensive statin therapy. N Engl J Med. 2011;365:2255–2267. doi: 10.1056/NEJMoa1107579. [DOI] [PubMed] [Google Scholar]
- 321.Lins R.L., Matthys K.E., Verpooten G.A. Pharmacokinetics of atorvastatin and its metabolites after single and multiple dosing in hypercholesterolaemic haemodialysis patients. Nephrol Dial Transpl. 2003;18:967–976. doi: 10.1093/ndt/gfg048. [DOI] [PubMed] [Google Scholar]
- 322.Baggio G., Manzato E., Gabelli C. Apolipoprotein c-ii deficiency syndrome. Clinical features, lipoprotein characterization, lipase activity, and correction of hypertriglyceridemia after apolipoprotein c-ii administration in two affected patients. J Clin Invest. 1986;77:520–527. doi: 10.1172/JCI112332. [DOI] [PMC free article] [PubMed] [Google Scholar]
- 323.Brunzell J.D. Clinical practice. Hypertriglyceridemia. N Engl J Med. 2007;357:1009–1017. doi: 10.1056/NEJMcp070061. [DOI] [PubMed] [Google Scholar]
- 324.Benlian P., De Gennes J.L., Foubert L., Zhang H., Gagne S.E., Hayden M. Premature atherosclerosis in patients with familial chylomicronemia caused by mutations in the lipoprotein lipase gene. N Engl J Med. 1996;335:848–854. doi: 10.1056/NEJM199609193351203. [DOI] [PubMed] [Google Scholar]
- 325.van Himbergen T.M., Otokozawa S., Matthan N.R. Familial combined hyperlipidemia is associated with alterations in the cholesterol synthesis pathway. Arterioscler Thromb Vasc Biol. 2010;30:113–120. doi: 10.1161/ATVBAHA.109.196550. [DOI] [PMC free article] [PubMed] [Google Scholar]
- 326.Hopkins P.N., Wu L.L., Hunt S.C., Brinton E.A. Plasma triglycerides and type iii hyperlipidemia are independently associated with premature familial coronary artery disease. J Am Coll Cardiol. 2005;45:1003–1012. doi: 10.1016/j.jacc.2004.11.062. [DOI] [PubMed] [Google Scholar]
- 327.Gotoda T., Yamada N., Kawamura M. Heterogeneous mutations in the human lipoprotein lipase gene in patients with familial lipoprotein lipase deficiency. J Clin Invest. 1991;88:1856–1864. doi: 10.1172/JCI115507. [DOI] [PMC free article] [PubMed] [Google Scholar]
- 328.Tziomalos K., Athyros V.G., Wierzbicki A.S., Mikhailidis D.P. Lipoprotein a: where are we now? Curr Opin Cardiol. 2009;24:351–357. doi: 10.1097/HCO.0b013e32832ac21a. [DOI] [PubMed] [Google Scholar]
- 329.Maher V.M., Brown B.G., Marcovina S.M., Hillger L.A., Zhao X.Q., Albers J.J. Effects of lowering elevated ldl cholesterol on the cardiovascular risk of lipoprotein(a) Jama. 1995;274:1771–1774. [PubMed] [Google Scholar]
- 330.Assmann G., von Eckardstein A., Funke H. High density lipoproteins, reverse transport of cholesterol, and coronary artery disease. Insights from mutations. Circulation. 1993;87:28–34. [PubMed] [Google Scholar]
- 331.Cuchel M., Rader D.J. Genetics of increased hdl cholesterol levels: Insights into the relationship between hdl metabolism and atherosclerosis. Arterioscler Thromb Vasc Biol. 2003;23:1710–1712. doi: 10.1161/01.ATV.0000092947.15939.93. [DOI] [PubMed] [Google Scholar]
- 332.Linton M.F., Farese R.V., Young S.G. Familial hypobetalipoproteinemia. J Lipid Res. 1993;34:521–541. [PubMed] [Google Scholar]
- 333.Lee M.H., Lu K., Patel S.B. Genetic basis of sitosterolemia. Curr Opin Lipidol. 2001;12:141–149. doi: 10.1097/00041433-200104000-00007. [DOI] [PMC free article] [PubMed] [Google Scholar]
- 334.Kotze M.J., Loubser O., Thiart R. Cpg hotspot mutations at the ldl receptor locus are a frequent cause of familial hypercholesterolaemia among South African Indians. Clin Genet. 1997;51:394–398. doi: 10.1111/j.1399-0004.1997.tb02497.x. [DOI] [PubMed] [Google Scholar]
- 335.Ashavaid T.F., Kondkar A.A., Nair K.G. Identification of two ldl-receptor mutations causing familial hypercholesterolemia in Indian subjects by a simplified rapid pcr-heteroduplex method. Clin Chem. 2000;46:1183–1185. [PubMed] [Google Scholar]
- 336.Shepherd J., Blauw G.J., Murphy M.B. Pravastatin in elderly individuals at risk of vascular disease (prosper): a randomised controlled trial. Lancet. 2002;360:1623–1630. doi: 10.1016/s0140-6736(02)11600-x. [DOI] [PubMed] [Google Scholar]
- 337.LaRosa J.C., Grundy S.M., Waters D.D. Intensive lipid lowering with atorvastatin in patients with stable coronary disease. N Engl J Med. 2005;352:1425–1435. doi: 10.1056/NEJMoa050461. [DOI] [PubMed] [Google Scholar]
- 338.Pedersen T.R., Faergeman O., Kastelein J.J.P. High-dose atorvastatin vs usual-dose simvastatin for secondary prevention after myocardial infarction: the ideal study: a randomized controlled trial. JAMA. 2005;294:2437–2445. doi: 10.1001/jama.294.19.2437. [DOI] [PubMed] [Google Scholar]
- 339.Bansal M, Kasliwal RR, Trehan N. Comparative accuracy of different risk scores in assessing cardiovascular risk in Indians: A study in patients with first myocardial infarction. Indian Heart J. (in press) http://dx.doi.org/10.1016/j.ihj.2014.10.399. [DOI] [PMC free article] [PubMed]