

Abstract
The cytochrome P450 mixed function oxidase enzymes are the major catalysts involved in drug metabolism. There are many forms of P450. CYP2E1 metabolizes many toxicologically important compounds including ethanol and is active in generating reactive oxygen species. Since several of the contributions in the common theme series “Role of CYP2E1 and Oxidative/Nitrosative Stress in the Hepatotoxic Actions of Alcohol” discuss CYP2E1, this methodology review describes assays on how CYP2E1 catalytic activity and its induction by ethanol and other inducers can be measured using substrate probes such as the oxidation of para-nitrophenol to para-nitrocatechol and the oxidation of ethanol to acetaldehyde. Approaches to validate that a particular reaction e.g. oxidation of a drug or toxin is catalyzed by CYP2E1 or that induction of that reaction is due to induction of CYP2E1 are important and specific examples using inhibitors of CYP2E1, anti-CYP2E1 IgG or CYP2E1 knockout and knockin mice will be discussed.
Keywords: CYP2E1, Ethanol, Para-nitrophenol, Methodology, Assay, Microsomes
Graphical abstract

Highlights
Cytochrome P4502E1(CYP2E1) oxidizes ethanol and activates hepatoxins and procarcinogens.
CYP2E1 produces reactive oxygen species during its catalytic cycle.
Methodology to assay CYP2E1 via oxidation of ethanol and p-nitrophenol is reviewed.
Oxidation of these substrates is enhanced after induction of CYP2E1 by ethanol.
Oxidation of these substrates is lowered by CYP2E1 inhibitors, anti-CYP2E1 IgG and in CYP2E1 knockout mice.
Introduction
Cytochrome P450 enzymes (CYPs) are the major catalysts involved in drug metabolism [1,2]. The microsomal drug metabolism system refers to an electron transfer system in which electrons are transferred from NADPH via the flavin containing NADPH cytochrome P450 reductase to reduce the heme containing CYP to the ferrous redox state. Once reduced, the ferrous P-450 can bind and activate molecular oxygen to promote the metabolism of many substrates, depending on the specific form of P450 [3]. CYPs catalyze the metabolism of exogenous compounds as well as the oxidation of endogenous substrates such as steroids, bile acids, fatty acids, eicosanoids etc. [1]. While CYPs can catalyze many types of reactions, the basic reaction promoted by many CYPs is the mixed function oxidase or monooxygenase reaction whereby one atom of oxygen is inserted into the substrate and the other atom is reduced to water:
The catalytic activity of many CYPs can be determined from assays of such substrate hydroxylation reactions.
CYP2E1 is one member of the P450 super family. It metabolizes many toxicologically important substrates including ethanol, carbon tetrachloride, acetaminophen, and N-nitrosodimethylamine to more toxic products [4–7]. CYP2E1 is an inducible enzyme, and many of the substrates for CYP2E1 can induce their own metabolism. This was initially observed with ethanol, which is a substrate for CYP2E1 and elevates CYP2E1 levels [4,7]. Whereas most ethanol is oxidized by alcohol dehydrogenase, CYP2E1 assumes a more important role in ethanol oxidation at elevated concentrations of ethanol and after chronic consumption of ethanol [4,8]. CYP2E1 can oxidize ethanol, and generate reactive products from ethanol oxidation, for example acetaldehyde and the 1-hydroxyethyl radical, can activate various agents (CCl4, acetaminophen, benzene, halothane, halogenated alkanes, alcohols) to reactive products, and can generate ROS, such as the superoxide anion radical and H2O2 [9,10]. Since CYP2E1 catalyzed reactions can generate ROS, and CYP2E1 is inducible by alcohol, CYP2E1 has been suggested to be a major contributor to ethanol-induced oxidant stress, and to ethanol-induced liver injury. In recent years, in vitro and in vivo studies on cell lines over-expressing CYP2E1, or on CYP2E1 knockout or CYP2E1 overexpression mice, have been major tools for studying the mechanism of alcoholic liver diseases [11–19]. For example, CYP2E1 knockout mice were developed by Gonzalez and colleagues to determine the role of CYP2E1 in xenobiotic metabolism and toxicity [10,15]. The development of the CYP2E1 knockout mouse has been of great value in establishing the role of CYP2E1 in the metabolism and toxicity of various hepatotoxins. Studies using CYP2E1 KO mice [16] showed that CYP2E1 plays a role in experimental alcoholic fatty liver in an oral ethanol-feeding model. A CYP2E1 transgenic mouse model containing human CYP2E1 cDNA was developed that overexpressed CYP2E1. When treated with ethanol, the CYP2E1 overexpressing mice displayed higher transaminase levels and histological damage compared with the control mice [17]. Humanized CYP2E1 knockin mice were developed in which the human CYP2E1 transgene was introduced into the corresponding CYP2E1 null mouse background [18]. This CYP2E1 knockin mouse allows functional activities of the human CYP2E1 to be studied and validates that decreased actions by ethanol in CYP2E1 knockout mice can be restored by reintroduction of the human CYP2E1 [18,19]. Although CYP2E1 is located in the endoplasmic reticulum, CYP2E1 can also be present in the mitochondria [20,21]. The relative contributions of microsomal versus mitochondrial CYP2E1 in promoting drug and alcohol toxicity remain to be clarified.
Since several of the contributions in this common theme series “Roles of CYP2E1 and Oxidative/Nitrosative Stress in the Hepatotoxic Actions of Alcohol”, discuss CYP2E1, it was thought that a brief discussion on how to assay CYP2E1 catalytic activity would be informative. Many substrates can be effectively oxidized or activated by CYP2E1. Table 1, adapted from Koop [6], Lieber [7], Raucy et al. [22], Tanaka et al. [23], Bolt et al. [24] and summarized in [25] describes some of the substrates which are effectively metabolized by CYP2E1. Perhaps the most important physiological substrate for CYP2E1 is acetone, which is oxidized to acetol and methylglyoxal and eventually to glucose [26]. Other endogenous compounds that can be metabolized by CYP2E1 include fatty acids such as linoleic and arachidonic acids [27]. With respect to exogenous compounds, CYP2E1 metabolizes a wide variety of hydrophobic compounds such as solvents, aromatic hydrocarbons, alcohols, halogenated anesthetics, nitrosamines, and drugs such as acetaminophen and chlorzoxazone (Table 1). Of interest, the ratio of 6-hydroxychlorzoxazone/chlorzoxazone can be used to estimate levels of CYP2E1 in humans, including alcoholics [28]. Similar to other CYPs, CYP2E1 can be induced by its substrates such as ethanol, pyrazole, 4-methylpyrazole, benzene, imidazole, pyridine, acetone and isoniazid [6–8]. The oxidation of para-nitrophenol (PNP) to para nitrocatechol has been shown to be a rapid, easy and relatively specific assay to determine catalytic activity dependent on CYP2E1 and has been widely used in the literature [29–31]. As mentioned above, initial interest in CYP2E1 reflected its involvement in the microsomal oxidation of ethanol pathway (MEOS) as a secondary pathway for the oxidation of ethanol [4,7,8]. Assays for PNP and ethanol oxidation by liver microsomes as typically used in our laboratory are described below.
Table 1.
Substrates metabolized/activated by CYP2E1.
| Alcohols, aldehydes, ketones | Acetaldehyde, ethanol, butanol, glycerol, isopropanol, methanol, propanol, pentanol, 2-butanone, acetone, acetol |
| Aromatic compounds | Acetaminophen, aniline, benzene, chlorzoxazone, isonoazid, phenol, pyridine, p-nitrophenol, pyrazole, toluene |
| Fatty acids | Arachidonic acid ω-1 and ω-2 hydroxylation, lauric acid ω-1 hydroxylation |
| Alkanes and alkenes | Acetoacetate, acrylonitrile, 1,3 butadiene, chloroform, N,N-dimethylacetamide, N,N-dimethylformamide, enflurane, ethane, ethyl carbamate, halothane, thioacetamide, trichloroethylene, vinyl chloride |
| Nitrosamines | Azoxymethane, N,N-diethylnitrosamine, N,N-dimethylnitroamine, methylazoxymethanol, N-Nitrosopyrrolidine |
| Reducible substrates | Oxygen, chromium VI, t-butylhydroperoxide, carbon tetrachloride |
Methods
Preparation of microsomes
Liver homogenates, 1:10 dilutions in 125 mM KCl–10 mM potassium phosphate, pH 7.4, are centrifuged at 600g for 10 min. The supernatant is removed and centrifuged at 8500g for 10 min. The supernatant is removed and centrifuged again at 8500g for 10 min. The supernatant is then centrifuged at 100,000g for 60 min to pellet the microsomes. The microsomes are resuspended in 125 mM KCl–10 mM KPi, pH 7.4 and centrifuged again at 100,000g for 60 min and the pellet is resuspended at a concentration of 1 g initial liver/ml of 125 mM KCl–10 mM KPi. The protein concentration is determined by the method Lowry et al. [32].
Preparation of microsomes from cell lines e.g. HepG2 cell lines expressing human CYP2E1 [33]. Once cells approach confluence, the medium is removed and the cells are washed with cold phosphate-buffered saline. The cells are harvested with a cell scraper and resuspended at a concentration of about 10 million cells in 8–10 ml of 100 mM KPi buffer, pH 7.4. The suspension is sonicated for 10–15 s in an ice bath e.g. using a 40% duty cycle at 4 output. The suspension is centrifuged at 12,000g for 15 min and the supernatant is removed and centrifuged at 100,000g for 45 min. The microsomal pellet is suspended in 0.1 ml of 125 mM KCl–10 mM KPi, pH 7.4 and protein determined on an aliquot.
Oxidation of PNP
Reactions are typically carried out in 1.5 ml Eppendorf tubes. Stock solutions are prepared and include 1 M KPi buffer, pH 7.2; 10 mM PNP; 10 mM NADPH; 30% wt/vol TCA; 10 N NaOH. Reactions are carried out at 37 °C in a shaking water bath in a final incubation volume of 0.1 ml containing 100 mM KPi, pH 7.2, 0.2 mM PNP, and about 0.2–1 mg microsomal protein (depending on whether CYP2E1 is induced or basal activities are being assayed). Reactions are initiated by the addition of NADPH to a final concentration of 1 mM and terminated after 10–20 (liver microsomes) or 45–60 (cell line microsomes) min by addition of TCA to a final concentration of 1%. The mixture is centrifuged at 5000g for 10 min to remove precipitated protein and the supernatant is transferred to a clean tube and 10 µl of NaOH is added. The absorbance of the pink–yellow p-nitrocatechol product is determined within a few minutes at 510 nm in a microcuvet in a spectrophotometer. The concentration of p-nitrocatechol is determined either from the extinction coefficient 9.53 mM−1 cm−1 or from a standard curve of p-nitrocatechol added to zero time controls. Controls include omission of microsomes or PNP or NADPH or adding the TCA before the NADPH (zero time control). A NADPH-generating system consisting of 10 mM MgCl2–0.3 mM NADP–10 mM glucose 6-phosphate–7 units of glucose 6-phosphate dehydrogenase can be used in place of the NADPH.
Oxidation of ethanol
Two different procedures can be used to assay the production of acetaldehyde from ethanol. Reactions can be carried out in stoppered 25 ml center well flasks which contain 0.6 ml of semicarbazide HCl in 180 mM KPi buffer, pH 7.4, in the center well (to trap the volatile acetaldehyde). The basic reaction mixture in the flask contains 100 mM KPi, pH 7.4, ethanol at concentrations ranging from 25 to 100 mM, 1 mM sodium azide (to inhibit microsomal contaminating catalase since ethanol can be oxidized to acetaldehyde via the peroxidatic activity of catalase-H2O2), about 3–5 mg microsomal protein in a final volume of 3 ml. Reactions are initiated by the addition of NADPH to a final concentration of 1 mM and terminated after 5–15 min by the addition of TCA to a final concentration of 4.5%. Flasks can be left overnight at room temperature or placed in a 37° water bath for 3 h to allow the acetaldehyde to diffuse into the center well. Aliquots of the center well e.g., 0.2 ml are diluted with water to 3 ml and the absorbance of the acetaldehyde–semicarbazone complex is determined at 224 nm. Standard curves can be prepared by adding known amounts of acetaldehyde to zero time controls or using an extinction coefficient of 9.4 mM−1 cm−1. Controls include deletion of microsomes or NADPH or ethanol or adding the TCA before the NADPH. A second procedure involving headspace gas chromatography can also be used. Reactions are carried out in regular 25 ml flasks sealed with tight fitting serum caps. The reaction mixture described above is used. Reactions are terminated by injecting perchloric acid (final concentration of 0.5 N) through the serum cap and the flasks are incubated for 60 min at 60° to allow the acetaldehyde to diffuse into the gas phase. A 1 ml sample of the headspace is removed with a gas tight 1 ml syringe. The syringe plunger is drawn back and forth 10 times to ensure adequate mixing of the gas phase. The sample is injected into a gas chromatograph equipped with a flame ionization detector e.g. a Hewlett-Packard Model 5840A. A 6 ft column of porapak N, 50–80 mesh or of carbowax 20 M-Haloport F, 30–36 mesh, can be used to detect the acetaldehyde. Operating conditions are column: 50°, inlet 100°, detector 150°, nitrogen carrier flow of 35 ml/min. Under these conditions, the retention times for acetaldehyde and ethanol are 0.4 and 1.1 min respectively. Relative peak areas are quantitated by using standard curves prepared by adding known amounts of acetaldehyde to zero time controls.
Induction of CYP2E1 by ethanol or pyrazole
SV129 male wild type or CYP2E1 knockout mice were initially fed a control liquid dextrose diet (Bio-Serv, Frenchtown, NJ) for 3 days to acclimate them to Lieber and DeCarli liquid diets [16,34]. Afterward, the mice were fed either the liquid ethanol diet or the control liquid dextrose diet for 4 weeks. The content of ethanol was gradually increased every 7 days from 10% (1.77% vol/vol) of total calories to 20% (3.54% vol/vol), 30% (5.31% vol/vol), and finally 35% (6.2% vol/vol) of total calories. The control mice were pair-fed with control dextrose diet on an isoenergetic basis. After 4 weeks, mouse serum and liver were collected. Liver was rapidly excised into fragments and washed with ice-cold saline. All samples were stored at −80 °C and various assays, including CYP2E1 catalytic activity were carried out. Chlormethiazole (CMZ), an inhibitor of CYP2E1 [35], was used to validate a role for CYP2E1 in the various activities being measured. CMZ, 50 mg/kg body wt, was injected ip every other day over the last 3 weeks of ethanol feeding. For acute ethanol experiments, the mice were gavaged with 30% ethanol, 3 g/kg body wt twice a day for 4 days. Controls were gavaged with saline. In other experiments, pyrazole and 4-methylpyrazole were used to induce CYP2E1 in rats [36,37]. Male Sprague-Dawley rats weighing about 150–200 g were injected with either saline or pyrazole, 200 mg/kg body wt or 4-methylpyrazole, 200 mg/kg body wt, once a day for 1–3 days, and after an overnight fast, liver microsomes were prepared. Polyclonal anti-CYP2E1 IgG was raised in rabbits against CYP2E1 purified from pyrazole-treated rats [38].
Results
The oxidation of PNP to p-nitrocatchol by rat liver microsomes in a NADPH-dependent manner was first reported in 1975 [39]. Reinke and Moyer [29] showed that PNP hydroxylation was a microsomal oxidation which can be highly induced by ethanol. Much smaller increases were produced by inducers of other CYPs such as phenobarbital or β-naphthoflavone. They concluded that PNP may be a useful substrate for studying changes in drug metabolic reactions caused by ethanol. Koop [30] clearly demonstrated that in rabbits, it was the ethanol-inducible P450 isozyme 3a (older terminology for CYP2E1) that was responsible for the increase in PNP oxidation after ethanol treatment. Antibody to P450 3a inhibited PNP oxidation by microsomes from untreated and ethanol-treated rabbits by 95% [30]. In subsequent studies, Koop et al. [31] extended these studies in rabbits to rats, mice, hamsters and deer mice, showing that in all these species, PNP oxidation and the increase in this oxidation by ethanol were highly sensitive to inhibition by anti-CYP2E1 IgG.
After some initial controversy, the pioneering studies of Lieber and colleagues showed that the oxidation of ethanol to acetaldehyde by liver microsomes was catalyzed by a CYP-dependent reaction and this Microsomal Ethanol Oxidizing System was subsequently well characterized [4,7,8]. Using reconstituted systems containing purified isozymes of different CYPs and antibody inhibition experiments, it was shown that CYP2E1 (P450 isozyme 3a, P450 j) was the most effective P450 catalyst for ethanol oxidation. Described below are assays using either PNP or ethanol to indicate catalytic activity of CYP2E1 and its induction by ethanol and other inducers of CYP2E1.
Fig. 1 shows general characteristics of the oxidation of PNP by microsomes isolated from untreated male rats. Formation of p-nitrocatechol was linear over a 30 min time course (A) and with microsomal protein up to about 3 mg/ml reaction mixture (B). A PNP substrate concentration curve is shown in Fig. 1C. The Km value for PNP was about 0.11 mM. Similar experiments with ethanol as the substrate to assay for CYP2E1 catalytic activity showed reactions were linear for 20 min and with microsomal protein up to 3 mg/ml. The Km for ethanol by control rat microsomes was about 13 mM and Vmax about 8 nmol acetaldehyde formed per min/mg protein. Fig. 2 shows the effect of anti-CYP2E1 IgG on the oxidation of PNP by control rat liver microsomes. Oxidation of PNP was inhibited more than 80% by the anti-CYP2E1 IgG indicating the effectiveness of PNP as a substrate for CYP2E1.
Fig 1.

Oxidation of PNP by rat liver microsomes isolated from male untreated Sprague-Dawley rats. (A) Time course; (B) microsomal protein concentration curve; (C) PNP concentration curve.
Fig. 2.

Effect of anti-CYP2E1 IgG on the rat liver microsomal oxidation of PNP. Anti-CYP2E1 IgG was raised against CYP2E1 purified from pyrazole-treated rats. closed circles refer to preimmune IgG, closed squares refer to anti-CYP2E1 IgG.
Fig. 3 shows the utility of inhibitors of CYP2E1 to evaluate the role of CYP2E1 in a microsomal drug oxidation reaction. Mice were fed the Lieber–DeCarli ethanol liquid diet for 4 weeks or fed the control diet in which dextrose replaces ethanol calories. Liver microsomes were isolated and oxidation of PNP determined. The protein level of CYP2E1 was assayed by Western blot. Some ethanol-fed mice were also treated with the CYP2E1 inhibitor, chlormethiazole, 50 mg/body wt, for the last 3 weeks of the ethanol treatment. The chronic ethanol feeding elevated the levels of CYP2E1 by about 2.5-fold (Fig. 3D, CYP2E1/β-actin ratio). This elevation was lowered after the CMZ treatment. The chronic ethanol feeding elevated CYP2E1 catalytic activity as reflected by the 6-fold increase in oxidation of PNP (Fig. 3C). This increase in PNP oxidation was lowered by the CMZ treatment. Fatty liver is a common consequence of ethanol administration. Liver triglyceride levels were elevated 2.5 fold after ethanol feeding (Fig. 3A). The addition of CMZ to the ethanol-fed mice abolished the ethanol elevation of TG in association with the decrease in CYP2E1 (Fig. 3A). Fatty liver induced by chronic ethanol feeding was also demonstrated by histopathology (H&E staining) and by Oil Red O staining for lipid droplets (Fig. 3B). These increases in fat accumulation were attenuated by CMZ (Fig. 3B). CMZ is a valuable tool to validate the participation of CYP2E1 in a reaction and in the increase by ethanol of CYP2E1 in that reaction.
Fig. 3.

Effect of the CYP2E1 inhibitor chlormethiazole (CMZ) on CYP2E1 content and activity and on chronic ethanol-induced fatty liver. SV129 wild type mice were fed the dextrose or ethanol-containing Lieber–DeCarli liquid diet for 4 weeks. Some of the ethanol-fed mice were also treated with the CYP2E1 inhibitor, chlormethiazole, CMZ, for the last 3 weeks. Liver microsomes were isolated and immunochemical assays to detect levels of CYP2E1 (D) and oxidation of PNP (C) were carried out. Hepatic levels of triglycerides in the 3 groups was determined as one index of fat accumulation (A). In (B), liver histopathology was assayed by H&E staining and lipid droplet formation evaluated by Oil Red O staining.
Another approach to evaluate the role of CYP2E1 in a reaction and in the increase produced by ethanol or other CYP2E1 inducers is by use of CYP2E1 knockout mice, as developed by Gonzalez and co-workers [18,19]. Wild type (WT) mice, CYP2E1 knockout (KO) mice and CYP2E1 knockin (KI) mice (in which CYP2E1 was restored in the KO mice) were kindly provided by Dr. Frank Gonzalez, NCI./NIH and fed the chronic ethanol liquid diet or dextrose control diet for 4 weeks. Liver microsomes were isolated and oxidation of PNP determined. Immunoblots showed that the ethanol feeding elevated levels of CYP2E1 2-fold in wild type mice and about 4-fold in the KI mice (Fig. 4B) as compared to the dextrose-fed controls. As expected, CYP2E1 levels were very low or not detectable in the CYP2E1 KO mice with or without ethanol feeding. The ethanol feeding produced a 2-fold increase in PNP oxidation compared to the dextrose controls in the WT mice. Rates of PNP oxidation were low in the dextrose and the ethanol-fed KO mice; no increase in PNP oxidation by ethanol was observed in the KO mice (Fig. 4A). Reintroduction of CYP2E1 into the KO mice restored PNP oxidation as well as the increase in this oxidation by the chronic ethanol feeding. Levels of CYP2E1 are about 2-fold higher in the KI mice than the WT mice which accounts for the higher PNP oxidation in the KI compared the KO mice. Oil Red O staining confirmed increased fat accumulation in the ethanol-fed wild type (Fig. 4C). Lower fat accumulation was found with the ethanol-fed KO mice but was “restored” in the ethanol-fed KI mice (Fig. 4C).
Fig. 4.
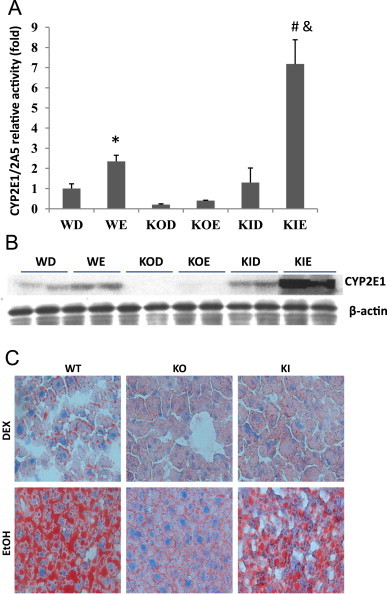
Chronic ethanol feeding of WT, CYP2E1 KO and CYP2E1 KI mice. SV129 WT, CYP2E1 KO and CYP2E1 KI mice were fed the Lieber–DeCarli liquid dextrose or ethanol diets for 4 weeks. (A) Liver microsomes were isolated and oxidation of PNP determined or (B) content of CYP2E1 assayed by immunoblot. WD and WE=wild type dextrose and wild type ethanol: KOD and KOE=CYP2E1 knockout fed dextrose or ethanol: KID and KIE=CYP2E1 knockin fed dextrose or ethanol. (C) Triglyceride levels were determined by Oil Red O staining as an index of fat accumulation.
A similar approach was used to demonstrate the induction of CYP2E1 by acute ethanol treatment. The WT, KO and KI mice were gavaged with either ethanol or saline and oxidation of PNP determined. As shown in Fig. 5, the acute ethanol gavage elevated PNP oxidation 3-fold in WT mice and in the KI mice. However, rates of PNP oxidation were very low in the KO mice and no increase by acute ethanol was observed. Rates of PNP oxidation paralleled the levels of CYP2E1 as determined by immunoblots (Fig. 5).
Fig. 5.

Acute ethanol treatment of WT, CYP2E1 KO and CYP2E1 KI mice. SV129 WT, CYP2E1 KO and CYP2E1KI mice were treated acutely by gavage with ethanol, 3 g/kg body wt twice a day for 4 days, followed by isolation of liver microsomes and assay of PNP oxidation (top) or immunoblots to determine levels of CYP2E1. * P<0.05; ** P<0.01.
CYP2E1 can be induced by other compounds besides ethanol e.g. pyrazole or 4-methylpyrazole [36,37]. Table 2 shows an experiment using rats instead of mice. Rats were treated with either saline, or IP injection of pyrazole (200 mg/kg) once per day for 3 days or 4-methylpyrazole (200 mg/kg) once per day for 3 days followed by isolation of liver microsomes. Immunoblots (not shown) indicated that the levels of CYP2E1 were increased about 3-fold after the pyrazole and 4-methylpyrazole treatments. As shown in Table 2, oxidation of PNP was increased about 3-fold after treatment with pyrazole or 4-methylpyrazole as compared to the saline controls. The oxidation of another effective substrate for CYP2E1, N,N-dimethylnitrosamine to formaldehyde was also increased by pyrazole or 4-methylpyrazole. As mentioned in Introduction, production of ROS is elevated after induction of CYP2E1. Although not the focus of this Methodology Review, Table 2 shows that associated with the increase in CYP2E1 as reflected by the oxidation of substrates is an increase in the microsomal production of superoxide anion radical, H2O2 and lipid peroxidation after treatment with pyrazole or 4-methylpyrazole. Importantly, all these elevated activities (substrate oxidation, ROS production) were blunted by anti-CYP2E1 IgG.
Table 2.
Induction of CYP2E1 by Pyr and 4-MP.
| Reaction | Rate (nmol/min/mg protein) |
||
|---|---|---|---|
| Saline | Pyrazole | 4-MP | |
| PNP | 1.5 | 4.7 | 5 |
| DMN | 1.8 | 7.3 | 5.9 |
| 2.4 | 7.5 | 7.6 | |
| H2O2 | 2.2 | 4.3 | 4.2 |
| CCL4-LP | 0.5 | 1.5 | 1.1 |
| FeATP-LP | 0.5 | 1 | 0.9 |
HepG2 cells which express human CYP2E1 were developed to study the biochemical and toxicological properties of CYP2E1 in vitro [11,12,33]. The oxidation of PNP was used to assay for the ability of ethanol added in vitro to these cells to induce CYP2E1. The CYP2E1-expressing HepG2 cells were incubated in the absence or presence of 2–100 mM ethanol for 2 days. Microsomes were isolated and the oxidation of 0.2 mM PNP determined. As shown in Table 3, experiment A, the rate of oxidation of PNP was increased 2–3 fold when the cells were incubated in the presence of 2–20 mM ethanol. HepG2 cells not transfected with the CYP2E1 construct did not metabolize PNP (data not shown). Immunoblot analysis showed that the incubation with ethanol elevated the levels of CYP2E1. Experiment B of Table 3 validates that the oxidation of PNP by HepG2 clone MV2E1-9 under basal conditions and the increase in this oxidation when the cells were incubated in the presence of 5 mM ethanol are due to CYP2E1. Both the basal and the elevated rates of PNP oxidation were lowered when inhibitors of CYP2E1 such as pyrazole or diethyldithiocarbamate (DDC) or a competitive substrate for CYP2E1 such as ethanol or when anti-CYP2E1 (but not preimmune) IgG were added to the microsomal incubation assay.
Table 3.
Oxidation of PNP by HepG2 cell microsomes.
| Concentration of ethanol (mM) | PNP oxidation (nmol/min/mg protein) | Addition | PNP oxidation |
|||
|---|---|---|---|---|---|---|
| Basel | 5 mM ethanol | |||||
| A: | 0 | 0.061 | B: | None | 0.061 | 0.133 |
| 2 | 0.115 | 1 mM pyrazole | 0.021 | 0.015 | ||
| 5 | 0.137 | 0.1 mM DDC | 0.022 | 0.005 | ||
| 20 | 0.169 | 100 mM ethanol | 0.019 | 0.013 | ||
| 100 | 0.094 | 4 mg/mg pre-immune IgG | 0.059 | 0.110 | ||
| 4 mg/mg anti-2E1 IgG | 0.016 | 0.012 | ||||
AHepG2 cells expressing human CYP2E1 (clone MV2E-9) were grown for 2 days in the absence or presence of the indicated concentrations of ethanol. Microsomes were isolated and oxidation of PNP assayed.
BClone MV2E1-9 was grown for two days in the absence or presence of 5 mM ethanol. Microsomes were prepared and the oxidation of PNP was assayed in the presence of the indicated additions.
Ethanol is also an effective substrate for oxidation by CYP2E1 and is frequently used as a probe to detect the presence and induction of CYP2E1. Table 4 shows that the oxidation of ethanol to acetaldehyde by liver microsomes is increased 5-fold after chronic ethanol administration, analogous to the increase in levels of CYP2E1. Inhibitors of CYP2E1 such as pyrazole or 4-methylpyrazole when added to the in vitro microsomal incubation system decreased the rate of ethanol oxidation by the dextrose-fed control microsomes and the increased oxidation by the microsomes found after the chronic ethanol feeding. Note, pyrazole and 4-methylpyrazole were more effective inhibitors of the ethanol oxidation by the microsomes from the chronic ethanol-fed rats since CYP2E1 is elevated in these microsomes. Kinetic analyses indicated that pyrazole and 4-methylpyrazole elevated the Km for ethanol but lowered the Vmax reflective of a mixed type of inhibition; Ki values for pyrazole were about 1 mM in control microsomes but decreased to about 0.3 mM in the microsomes from the ethanol-fed rats [36,37].
Table 4.
Microsomal oxidation of ethanol. The oxidation of 55 mM ethanol by microsomes from chronic ethanol-fed rats and their pair-fed controls was determined in the absence and presence of the indicated concentrations of pyrazole and 4-methylpyrazole.
| Addition | Concen(mM) | Rate of ethanol oxidation (nmol/min/mg microsomal protein) |
Effect of addition (%) |
||
|---|---|---|---|---|---|
| Chronic ethanol | Pair-fed control | Chronic ethanol | Control | ||
| None | 13.0±1.9 | 2.7±0.4 | |||
| Pyrazole | 0.25 | 8.9±0.8# | ND* | −32 | ND |
| 0.5 | 7.3±1.2# | 2.8±0.2 | −44 | 4 | |
| 1 | 6.8±0.7# | 2.7±0.3 | −48 | 0 | |
| 3 | ND | 1.9±0.6 | ND | −30 | |
| 4-Methylpyrazole | 0.25 | 5.6±0.8& | 2.3±0.1 | −57 | −15 |
| 0.5 | 5.2±0.7& | 2.2±0.3 | −60 | −19 | |
| 1 | 4.1±0.4& | 2.1±0.3 | −68 | −22 | |
| 3 | ND | 2.0±0.4 | ND | −24 | |
ND=not determined.
Discussion, pitfalls and troubleshooting
Since CYP2E1 is discussed in several articles in this Common Theme, this brief review describes methodology for assays of microsomal mixed function oxidase activity using PNP or ethanol as probe substrates for CYP2E1. Other effective substrates such as chlorzoxazone, aniline and N,N-dimethylnitrosamine are also frequently used in the literature. PNP, as mentioned previously [29–31] is especially useful since the assay is rapid, rather simple, requires no special equipment and is relatively sensitive. PNP can also be used in studies with intact hepatocytes or cell lines to reflect CYP2E1 activity [40], whereas this is more difficult with ethanol as substrate since the product acetaldehyde is rapidly metabolized by aldehyde dehydrogenases. Oxidation of PNP is pH sensitive [30] so the final pH should be between 6.8 and 7.2, and is subject to substrate inhibition so the final substrate concentration should not exceed 0.2–0.5 mM. With respect to ethanol as substrate, both ethanol and especially acetaldehyde are volatile therefore evaporation needs to be minimized by using closed flasks. For the center well assay, care is required to avoid getting any TCA into the center well since it interferes with the absorbance of the acetaldehyde–semicarbazone complex. Microsomes contain contaminating catalase and ethanol can be oxidized by catalase-H2O2 to acetaldehyde; microsomes generate H2O2 (e.g. Table 2) and therefore azide should be added to inhibit catalase (this was part of the initial controversies over the nature of MEOS; [4,7,8]).
Induction of CYP2E1 can, and should be, also measured by immunoblot assays to accompany the PNP or probe substrate assay. Induction of CYP2E1 is frequently not associated with corresponding increases in CYP2E1 mRNA levels as the induction mechanism is complex and may involve increases in gene transcription or mRNA translation or stability or in many cases, increased protein stability against proteosome-mediated degradation depending on the chemical inducer, the concentration of the inducer e.g. ethanol, or the nutritional or pathophysiological state.
While effective substrates for CYP2E1, PNP and ethanol can also be oxidized by other CYPs such as CYP1A2 and 3A4 [41] although activity with these CYPs is lower than with CYP2E1. It is therefore important to validate that an increase in metabolism of a probe such as PNP is indeed due to CYP2E1. Several approaches can be used for this such as inhibition by anti-CYP2E1 IgG [30,31], by known inhibitors of CYP2E1 such as pyrazole, 4-methylpyrazole, DDC, diallyl disulfide or especially chlormethiazole, or by use of CYP2E1 KO mice. Recently, SiRNA has been used in cell cultures to specifically inhibit CYP2E1 [42]. The utility of many of these approaches has been described in this Methodological review which hopefully will be informative and valuable to the reader.
Acknowledgements
Original data were supported by grants from the National Institute on Alcohol Abuse and Alcoholism, AA021362 and AA018790.
References
- 1.Guengerich F.P. Cytochrome p450 and chemical toxicology. Chemical Research in Toxicology. 2008;21(1):70–83. doi: 10.1021/tx700079z. 18052394 [DOI] [PubMed] [Google Scholar]
- 2.Guengerich F.P. Cytochrome P450s and other enzymes in drug metabolism and toxicity. AAPS Journal. 2006;8(1):E101–E111. doi: 10.1208/aapsj080112. 16584116 [DOI] [PMC free article] [PubMed] [Google Scholar]
- 3.Rendic S., Guengerich F.P. Contributions of human enzymes in carcinogen metabolism. Chemical Research in Toxicology. 2012;25(7):1316–1383. doi: 10.1021/tx300132k. 22531028 [DOI] [PMC free article] [PubMed] [Google Scholar]
- 4.Lieber C.S. Cytochrome P-4502E1: its physiological and pathological role. Physiological Reviews. 1997;77(2):517–544. doi: 10.1152/physrev.1997.77.2.517. 9114822 [DOI] [PubMed] [Google Scholar]
- 5.Guengerich F.P., Kim D.H., Iwasaki M. Role of human cytochrome P-450 IIE1 in the oxidation of many low molecular weight cancer suspects. Chemical Research in Toxicology. 1991;4(2):168–179. doi: 10.1021/tx00020a008. 1664256 [DOI] [PubMed] [Google Scholar]
- 6.Koop D.R. Oxidative and reductive metabolism by cytochrome P450 2E1. FASEB Journal: Official Publication of the Federation of American Societies for Experimental Biology. 1992;6(2):724–730. doi: 10.1096/fasebj.6.2.1537462. 1537462 [DOI] [PubMed] [Google Scholar]
- 7.Lieber C.S. Microsomal ethanol-oxidizing system (MEOS): the first 30 years (1968–1998)—a review. Alcoholism, Clinical and Experimental Research. 1999;23(6):991–1007. 10397283 [PubMed] [Google Scholar]
- 8.Lieber C.S., Rubin E., DeCarli L.M. Hepatic microsomal ethanol oxidizing system (MEOS): differentiation from alcohol dehydrogenase and NADPH oxidase. Biochemical and Biophysical Research Communications. 1970;40(4):858–865. doi: 10.1016/0006-291x(70)90982-4. 4395603 [DOI] [PubMed] [Google Scholar]
- 9.Cederbaum A.I. Introduction-serial review: alcohol, oxidative stress and cell injury. Free Radical Biology & Medicine. 2001;31(12):1524–1526. doi: 10.1016/s0891-5849(01)00741-9. 11744324 [DOI] [PubMed] [Google Scholar]
- 10.Gonzalez F.J. Role of cytochromes P450 in chemical toxicity and oxidative stress: studies with CYP2E1. Mutation Research. 2005;569(1–2):101–110. doi: 10.1016/j.mrfmmm.2004.04.021. 15603755 [DOI] [PubMed] [Google Scholar]
- 11.Chen Q., Cederbaum A.I. Cytotoxicity and apoptosis produced by cytochrome P450 2E1 in Hep G2 cells. Molecular Pharmacology. 1998;53(4):638–648. doi: 10.1124/mol.53.4.638. 9547353 [DOI] [PubMed] [Google Scholar]
- 12.Dai Y., Rashba-Step J., Cederbaum A.I. Stable expression of human cytochrome P4502E1 in HepG2 cells: characterization of catalytic activities and production of reactive oxygen intermediates. Biochemistry. 1993;32(27):6928–6937. doi: 10.1021/bi00078a017. 7687464 [DOI] [PubMed] [Google Scholar]
- 13.Osna N.A., Clemens D.L., Donohue T.M., Jr. Interferon gamma enhances proteasome activity in recombinant HepG2 cells that express cytochrome P4502E1: modulation by ethanol. Biochemical Pharmacology. 2003;66(5):697–710. doi: 10.1016/s0006-2952(03)00252-1. 12948850 [DOI] [PubMed] [Google Scholar]
- 14.Osna N.A., Clemens D.L., Donohue T.M., Jr. Ethanol metabolism alters interferon gamma signaling in recombinant HepG2 cells. Hepatology. 2005;42(5):1109–1117. doi: 10.1002/hep.20909. 16250053 [DOI] [PubMed] [Google Scholar]
- 15.Gonzalez F.J. The 2006 Bernard B. Brodie award lecture. Cyp2e1. Drug Metabolism and Disposition: The Biological Fate of Chemicals. 2007;35(1):1–8. doi: 10.1124/dmd.106.012492. 17020953 [DOI] [PubMed] [Google Scholar]
- 16.Lu Y., Zhuge J., Wang X., Bai J., Cederbaum A.I. Cytochrome P450 2E1 contributes to ethanol-induced fatty liver in mice. Hepatology. 2008;47(5):1483–1494. doi: 10.1002/hep.22222. 18393316 [DOI] [PubMed] [Google Scholar]
- 17.Morgan K., French S.W., Morgan T.R. Production of a cytochrome P450 2E1 transgenic mouse and initial evaluation of alcoholic liver damage. Hepatology. 2002;36(1):122–134. doi: 10.1053/jhep.2002.33720. 12085356 [DOI] [PubMed] [Google Scholar]
- 18.Cheung C., Gonzalez F.J. Humanized mouse lines and their application for prediction of human drug metabolism and toxicological risk assessment. Journal of Pharmacology and Experimental Therapeutics. 2008;327(2):288–299. doi: 10.1124/jpet.108.141242. 18682571 [DOI] [PMC free article] [PubMed] [Google Scholar]
- 19.Cheung C., Yu A.M., Ward J.M., Krausz K.W., Akiyama T.E., Feigenbaum L., Gonzalez F.J. The cyp2e1-humanized transgenic mouse: Role of cyp2e1 in acetaminophen hepatotoxicity. Drug Metabolism and Disposition: The Biological Fate of Chemicals. 2005;33(3):449–457. doi: 10.1124/dmd.104.002402. 15576447 [DOI] [PubMed] [Google Scholar]
- 20.Robin M.A., Anandatheerthavarada H.K., Biswas G., Sepuri N.B., Gordon D.M., Pain D., Avadhani N.G. Bimodal targeting of microsomal CYP2E1 to mitochondria through activation of an N-terminal chimeric signal by cAMP-mediated phosphorylation. Journal of Biological Chemistry. 2002;277(43):40583–40593. doi: 10.1074/jbc.M203292200. 12191992 [DOI] [PMC free article] [PubMed] [Google Scholar]
- 21.Bansal S., Liu C.P., Sepuri N.B., Anandatheerthavarada H.K., Selvaraj V., Hoek J., Milne G.L., Guengerich F.P., Avadhani N.G. Mitochondria-targeted cytochrome P450 2E1 induces oxidative damage and augments alcohol-mediated oxidative stress. Journal of Biological Chemistry. 2010;285(32):24609–24619. doi: 10.1074/jbc.M110.121822. 20529841 [DOI] [PMC free article] [PubMed] [Google Scholar]
- 22.Raucy J.L., Kraner J.C., Lasker J.M. Bioactivation of halogenated hydrocarbons by cytochrome P4502E1. Critical Reviews in Toxicology. 1993;23(1):1–20. doi: 10.3109/10408449309104072. 8471158 [DOI] [PubMed] [Google Scholar]
- 23.Tanaka E., Terada M., Misawa S. Cytochrome P4502E1: its clinical and toxicological role. Journal of Clinical Pharmacy and Therapeutics. 2000;25(3):165–175. doi: 10.1046/j.1365-2710.2000.00282.x. 10886461 [DOI] [PubMed] [Google Scholar]
- 24.Bolt H.M., Roos P.H., Thier R. The cytochrome P-450 isoenzyme CYP2E1 in the biological processing of industrial chemicals: consequences for occupational and environmental medicine. International Archives of Occupational and Environmental Health. 2003;76(3):174–185. doi: 10.1007/s00420-002-0407-4. 12690492 [DOI] [PubMed] [Google Scholar]
- 25.Jimenez-Lopez J.M., Cederbaum A.I. CYP2E1-dependent oxidative stress and toxicity: role in ethanol-induced liver injury. Expert Opinion on Drug Metabolism & Toxicology. 2005;1(4):671–685. doi: 10.1517/17425255.1.4.671. 16863432 [DOI] [PubMed] [Google Scholar]
- 26.Koop D.R., Casazza J.P. Identification of ethanol-inducible P-450 isozyme 3a as the acetone and acetol monooxygenase of rabbit microsomes. Journal of Biological Chemistry. 1985;260(25):13607–13612. 4055750 [PubMed] [Google Scholar]
- 27.Laethem R.M., Balazy M., Falck J.R., Laethem C.L., Koop D.R. Formation of 19(S)-, 19(R)-, and 18(R)-hydroxyeicosatetraenoic acids by alcohol-inducible cytochrome P450 2E1. Journal of Biological Chemistry. 1993;268(17):12912–12918. 8509425 [PubMed] [Google Scholar]
- 28.Girre C., Lucas D., Hispard E., Menez C., Dally S., Menez J.F. Assessment of cytochrome P4502E1 induction in alcoholic patients by chlorzoxazone pharmacokinetics. Biochemical Pharmacology. 1994;47(9):1503–1508. doi: 10.1016/0006-2952(94)90524-x. 7910460 [DOI] [PubMed] [Google Scholar]
- 29.Reinke L.A., Moyer M.J. P-Nitrophenol hydroxylation. A microsomal oxidation which is highly inducible by ethanol. Drug Metabolism and Disposition: The Biological Fate of Chemicals. 1985;13(5):548–552. 2865101 [PubMed] [Google Scholar]
- 30.Koop D.R. Hydroxylation of p-nitrophenol by rabbit ethanol-inducible cytochrome P-450 isozyme 3a. Molecular Pharmacology. 1986;29(4):399–404. 3702859 [PubMed] [Google Scholar]
- 31.Koop D.R., Laethem C.L., Tierney D.J. The utility of p-nitrophenol hydroxylation in P450IIE1 analysis. Drug Metabolism Reviews. 1989;20(2–4):541–551. doi: 10.3109/03602538909103560. 2680397 [DOI] [PubMed] [Google Scholar]
- 32.Lowry O.H., Rosebrough N.J., Faar A.L., Randall R.J. Protein measurements with the Folin phenol reagent. Journal of Biological Chemistry. 1951;193(1):266–275. [PubMed] [Google Scholar]
- 33.Wu D., Cederbaum A.I. Development and properties of HepG2 cells that constitutively express CYP2E1. In: Nagy L., editor. vol. 447. Humana Press; Clifton, N.J.: 2008. pp. 137–150. (Methods in Molecular Biology). Pubmed: 18369917. [DOI] [PubMed] [Google Scholar]
- 34.Lu Y., Wu D., Wang X., Ward S.C., Cederbaum A.I. Chronic alcohol-induced liver injury and oxidant stress are decreased in cytochrome P4502E1 knockout mice and restored in humanized cytochrome P4502E1 knock-in mice. Free Radical Biology and Medicine. 2010;49(9):1406–1416. doi: 10.1016/j.freeradbiomed.2010.07.026. [DOI] [PMC free article] [PubMed] [Google Scholar]
- 35.Gouillon Z., Lucas D.J., Li J., Hagbjork A.L., French B.A., Fu P., Fang C., Ingelman-Sundberg M., Donohue T.M., Jr, French S.W. Inhibition of ethanol-induced liver disease in the intragastric feeding rat model by chlormethiazole. Proceedings of the Society for Experimental Biology and Medicine. 2000;224(4):302–308. doi: 10.1046/j.1525-1373.2000.22435.x. 10964266 [DOI] [PubMed] [Google Scholar]
- 36.Feierman D.E., Cederbaum A.I. Increased sensitivity of the microsomal oxidation of ethanol to inhibition by pyrazole and 4-methylpyrazole after chronic ethanol treatment. Biochemical Pharmacology. 1987;36(19):3277–3283. doi: 10.1016/0006-2952(87)90645-9. 3663241 [DOI] [PubMed] [Google Scholar]
- 37.Feierman D.E., Cederbaum A.I. Inhibition of microsomal oxidation of ethanol by pyrazole and 4-methylpyrazole in vitro. Increased effectiveness after induction by pyrazole and 4-methylpyrazole. Biochemical Journal. 1986;239(3):671–677. doi: 10.1042/bj2390671. 3827819 [DOI] [PMC free article] [PubMed] [Google Scholar]
- 38.Palakodety R.B., Clejan L.A., Krikun G., Feierman D.E., Cederbaum A.I. Characterization and identification of a pyrazole-inducible form of cytochrome P-450. Journal of Biological Chemistry. 1988;263(2):878–884. 3335529 [PubMed] [Google Scholar]
- 39.Chrastil J., Wilson J.T. 4-Nitrocatechol production from para-nitrophenol by rat liver. Journal of Pharmacology and Experimental Therapeutics. 1975;193(2):631–638. 238027 [PubMed] [Google Scholar]
- 40.Dicker E., McHugh T.M., Cederbaum A.I. Increased oxidation of p-nitrophenol and aniline by intact hepatocytes isolated from pyrazole-treated rats. Biochimica et Biophysica Acta. 1990;1035(3):249–256. doi: 10.1016/0304-4165(90)90086-c. 2207123 [DOI] [PubMed] [Google Scholar]
- 41.Salmela K.S., Kessova I.G., Tsyrlov I.B., Lieber C.S. Respective roles of human cytochrome P-4502E1, 1A2, and 3A4 in the hepatic microsomal ethanol oxidizing system. Alcoholism: Clinical and Experimental Research. 1998;22(9):2125–2132. [PubMed] [Google Scholar]
- 42.Swaminathan K., Kumar S.M., Clemens D.L., Dey A. Inhibition of CYP2E1 leads to decreased advanced glycated end product formation in high glucose treated ADH and CYP2E1 over-expressing VL-17A cells. Biochimica et Biophysica Acta. 2013;1830(10):4407–4416. doi: 10.1016/j.bbagen.2013.05.022. 23707663 [DOI] [PubMed] [Google Scholar]