

Abstract
Wolbachia are maternally inherited bacterial endosymbionts that naturally infect a diverse array of arthropods. They are primarily known for their manipulation of host reproductive biology, and recently, infections with Wolbachia have been proposed as a new strategy for controlling insect vectors and subsequent human-transmissible diseases. Yet, Wolbachia abundance has been shown to vary greatly between individuals and the magnitude of the effects of infection on host life-history traits and protection against infection is correlated to within-host Wolbachia abundance. It is therefore essential to better understand the factors that modulate Wolbachia abundance and effects on host fitness. Nutrition is known to be one of the most important mediators of host–symbiont interactions. Here, we used nutritional geometry to quantify the role of macronutrients on insect–Wolbachia relationships in Drosophila melanogaster. Our results show fundamental interactions between diet composition, host diet selection, Wolbachia abundance and effects on host lifespan and fecundity. The results and methods described here open a new avenue in the study of insect–Wolbachia relationships and are of general interest to numerous research disciplines, ranging from nutrition and life-history theory to public health.
Keywords: Drosophila, macronutrient, nutrition, nutritional geometry, Wolbachia
1. Introduction
The use of managed Wolbachia infections has been proposed as a new strategy for controlling vector-transmitted diseases, motivated by abundant evidence that insect vectors show modifications in several traits directly linked to their vectorial competence when infected either naturally or unnaturally (i.e. transfected) with Wolbachia [1–11]. However, Wolbachia abundance varies between individuals in both natural and laboratory-reared populations [12–14]. Explaining sources of such variation is important, because the magnitude of the effects of infection on host life-history traits and populations is often correlated to within-host Wolbachia abundance [7,14–17] and this could have substantial population-level consequences for disease dynamics [13,14,18]. Better understanding the factors that modulate Wolbachia abundance and the impacts of infection on host fitness is, therefore, an important ecological, evolutionary and public health issue.
The availability of nutrients is a fundamental constraint on symbiont populations [19] as it can directly influence the abundance and development of symbionts [20–24] and shape virulence of parasitic infections [25–30]. While the specific nutritional components influencing infection dynamics have not always been clearly identified, recent research on gut microbiota has shown that dietary macronutrients, notably protein (P) and carbohydrate (C), have a major impact on bacterial species composition and abundance [31–35]. The dietary balance of P and C has also been found to have profound impacts on host lifespan, ageing, reproduction and immunity (see review in reference [36]), and it is now well established that both vertebrates and invertebrates strongly regulate their macronutrient intake [37–43]. In this study, we hypothesized that the balance of P to C in the diet is a key mediator of the Drosophila–Wolbachia relationship and that Wolbachia-infected hosts are able to modify their food selection to ameliorate the effects of infection on their fitness.
To tease apart the effects of host nutrition on Wolbachia abundance, we used protocols from Nutritional Geometry [36] to systematically vary the sugar and yeast composition of the host diet. Because yeast is the only source of dietary protein, as well as containing carbohydrate and various micronutrients, the nutrient space can be decomposed into two principal axes: C versus P (plus correlated micronutrients). We quantified the effects of dietary P : C ratio on Wolbachia abundance in the midgut and ovaries of naturally infected Drosophila melanogaster. The gut is usually one of the first tissues to come into contact with both food and orally ingested infectious pathogens, and it is therefore important to gain a better understanding of the factors influencing the abundance of endosymbionts in this body region. Because Wolbachia infection and diet have both been reported to influence host reproduction and longevity (Wolbachia: [44–46]; diet: [37]), we also explored the functional significance of this interaction by measuring the reproductive rate and lifespan of Wolbachia-infected and non-infected flies confined to diets differing in their P : C ratio. Finally, it has previously been shown that infected hosts can adjust their macronutrient intake to compensate for the extra nutritional demands of being infected [47–50]. We therefore measured dietary selection by Wolbachia-infected and non-infected flies and considered the consequences for lifetime reproductive output. This study provides the first investigation of the effects of dietary macronutrient balance on the relationships between Wolbachia and Drosophila. The results and methods will more generally open up new avenues for the study of host–symbiont relationships and emphasize the importance of host nutrition as a key mediator of symbiotic interactions.
2. Material and methods
(a). Nutritional treatments
In a first set of experiments, newly eclosed female Canton S flies (Bloomington centre, colony started in 2008) were provided with one of 21 agar-based foods varying in sucrose (S) and hydrolysed yeast (Y) content. The seven Y : S ratios used were 1 : 14, 1 : 7, 1 : 3.5, 1 : 1.6, 1 : 0.7, 1 : 0.2 or 1 : 0; yielding protein (P) to carbohydrate (C) ratios of P : C = 1 : 32, 1 : 16, 1 : 8, 1 : 4, 1 : 2, 1 : 1 and 1.9 : 1, respectively. The three Y + S concentrations were 90, 180 or 270 g l−1. Macronutrient compositions were calculated based on autolysed yeast (MP Biomedicals, catalogue no. 103304 containing 45% protein, 24% carbohydrate (as glucose equivalents), 21% indigestible fibre, 8% water and the remaining 2% fatty acids, minerals and vitamins). Each diet contained 0.01% phosphoric acid and 0.1% proprionic acid as antimould agents and were prepared in sterile, distilled water. Flies were killed and dissected after four days of feeding, a period for which mortality on high-protein diets was less than 50% (see [37]). The experimental room was maintained at 26°C under a 12 L : 12 D photoregime.
(b). Antibiotic treatment
To obtain Wolbachia-free flies, insects were treated with tetracycline (0.25 mg ml−1 of food) for two generations. After the treatment period, flies were transferred to culture food without tetracycline for at least five generations (‘recovering lines’). The absence of Wolbachia was checked using PCRs (target genes: wsp and U16S, reference gene: RPII215 (RNA polymerase II 215 kD subunit); see the electronic supplementary material, table S1) in midguts and ovaries for five pools of 20 tissues for each treatment.
(c). Measuring host nutritional state
Six fly bodies per diet (i.e. P : C 1 : 32, 1 : 16, 1 : 8, 1 : 4, 1 : 2, 1 : 1, 1.9 : 1, Y + S concentrations = 90, 180 or 270 g l−1) were dissected to remove the eggs. Bodies were freeze-dried and individually weighed (i.e. dry weight, ±0.01 mg), and the nutritional body reserves were quantified for each individual. The insect carcasses were lipid-extracted in three 24 h changes of chloroform. At the end of the third chloroform wash, insects were freeze-dried and reweighed. Lipid content was calculated from their mass change. The lipid-free carcasses were ground and individually analysed for protein content using the Bradford method [51].
(d). Measuring midgut morphology
Ten midguts per diet (i.e. P : C 1 : 32, 1 : 16, 1 : 8, 1 : 4, 1 : 2, 1 : 1, 1.9 : 1, Y + S concentrations = 90, 180 or 270 g l−1) were dissected, fixed in Bouin's fluid for 24 h and stored in 70% ethanol at 4°C. Fixed midguts were photographed under a binocular microscope and pictures analysed using the software ImageJ (Rasband, W.S., ImageJ, US National Institutes of Health, Bethesda, MD, http://imagej.nih.gov/ij/, 1997–2012). Length of midguts was measured.
(e). Identifying Wolbachia strains
The Wolbachia strain in midguts and ovaries was identified using the multiple locus VNTR analysis (MLVA) [52]. Length of VNTR amplicons (i.e. VNTR-105 and VNTR-141) was checked on agarose gel for both ovary and gut samples with amplicons representing wMel strain. Sequences were confirmed by sequencing (see electronic supplementary material, table S2 for sequences).
(f). Genomic DNA extraction
Twenty fly midguts per diet (i.e. P : C 1 : 32, 1 : 16, 1 : 8, 1 : 4, 1 : 2, 1 : 1, 1.9 : 1, Y + S concentrations = 90, 180 or 270 g l−1) were dissected, pooled and stored in TE buffer at −20°C. Twenty ovaries were also dissected from another group of flies, pooled and stored in TE buffer at −20°C. Total genomic DNA was extracted for dissected midguts and ovaries using the DNeasy blood and tissue kit (Qiagen, Valencia, CA) following a protocol modified from the manufacturer's instructions for Gram-positive bacteria (see also [53]). Briefly, midguts and ovaries were transferred to 2 ml Eppendorf containing 180 µl of lysis buffer (20 mM Tris–HCl; 2 mM sodium-EDTA, 1.2% Triton X-100) supplemented with lysozyme (20 mg ml−1). Midguts were incubated at 37°C for 1.5 h with a 5 min bead-beating at 45 min using 0.1 mm glass beads (Scientific Industries). All other steps were performed according to the manufacturer's protocol.
(g). Pyrosequencing
The purified metagenomic DNA samples were sent to a sequence service provider (Research and Testing Laboratory, Lubbock, TX) and tag-encoded amplicon pyrosequencing performed using the Roche 454 FLX instrument with titanium reagents, with protocols based on versions of the primer pair 28F 5′TTTGATCNTGGCTCAG and 519r 5′GTNTTACNGCGGCKGCTG incorporating domains for 454 sequencing and sample-specific identification tags. Data were filtered to exclude all failed, short or low-quality reads, assembled into clusters at 95%, 97% and 99% threshold and classified by query against a database of 16S bacterial sequences [54]. The final dataset from the dissected midguts of D. melanogaster contained 165090 reads, with more than 2000 reads per sample (average of 7500 per sample). Operational taxonomic units (OTUs) that were represented by just one or two reads in experimental samples were interpreted as contaminants and excluded from diversity analyses.
(h). Measuring DNA levels of bacteria and Wolbachia
Triplicate DNA aliquots for each sample served as templates for quantitative PCR using SYBR Green PCR master mix (Applied Biosystems). Amplification reactions were performed in 10 µl total volumes with 4.5 µl of gDNA (diluted 1 : 100) and 150 nM of each primer, in 384-well optical plates under the following sequential conditions: incubation at 50°C for 2 min, 95°C for 10 min, followed by 45 cycles of 95°C for 15 s and 60°C for 1 min. Quantitative RT-PCR efficiency was determined for each gene and each treatment using the second derivative method. Relative standard curves for the gene transcripts were generated with serial (5×) dilutions of DNA (i.e. 1/10, 1/30, 1/90, 1/270 and 1/810). Stock DNA used for the relative standard curves was constituted as a pool of DNA from the different samples.
(i). Measuring reproductive output
Newly eclosed Wolbachia-infected and Wolbachia-free male and female flies were maintained for four days on seven solid diets varying in the protein-to-carbohydrate ratio (i.e. P : C = 1 : 32, 1 : 16, 1 : 8, 1 : 4, 1 : 2, 1 : 1, 1.9 : 1, Y + S = 180 g l−1). At day four, females were transferred onto normal culture food (10 females per cage, three biological replicates per diet). Twenty-four hours later, females were removed from the cages. Cages with dead females were not considered in the analysis. Cages were then checked every day for 20 days and newly eclosed adults were counted and sexed.
(j). Measuring lifespan
Newly eclosed Wolbachia-infected and Wolbachia-free female flies were collectively maintained (n = 100, three replicate cages per treatment) on two solid dietary treatments varying in the protein-to-carbohydrate ratio (i.e. P : C = 1 : 1 (Y + S = 180 g l−1), or P : C = 1 : 16 (Y + S = 180 g l−1)), or given a choice between two complementary foods (pure yeast versus sucrose solution, Y or S = 180 g l−1). Dietary treatments were chosen to extend across the nutritional landscape. Cages were checked every two days, dead flies were counted and removed, and food was changed. We stopped the experiment when all flies were dead.
(k). Measuring dietary macronutrient selection
The capacity of flies to maintain a target P–C intake trajectory was measured by providing them simultaneously with two liquid foods, one containing autolysed yeast (MP Biomedicals, catalogue no. 103304) at 180 g l−1 and the other containing sucrose at 180 g l−1. The two solutions were prepared in sterile distilled water. Thirty Wolbachia-infected and Wolbachia-free newly eclosed female flies were individually provided with two 5 µl microcapillary tubes (Drummond Microcaps) filled with the two liquid diets. Intake was measured against a scale bar by height difference in the column of liquid within the microcapillary every two days (see [37,55]). Evaporation was measured for each solution using four blank test tubes and used to correct volume consumed.
(l). Statistical analyses and constructing response landscapes
A general additive model was implemented using the mgcv package (1.7-22) in R (v. 2.10.1) to test variable responses to dietary macronutrient composition. Main effects and two-way interactions for protein and carbohydrate were tested, and non-significant interactions between the main effects were removed from the final model [56]. When a significant effect of carbohydrate and/or protein intake was detected, surface plots using the fields package were created (http://www.image.ucar.edu/GSP/software/fields/index.shtml). Mantel–Haenszel log-rank tests were used to compare longevity of Wolbachia-infected and Wolbachia-free flies fed different diets. Survival curves were constructed using Kaplan–Meier survival estimates with the survfit function in R. All other statistical analyses (ANOVA and two-way ANOVA) were performed using SPSS (IBM Corp. released 2012. IBM SPSS Statistics for Windows, v. 21.0. Armonk, NY: IBM Corp.). Difference in reproductive output between Wolbachia-infected and Wolbachia-free flies fed seven P : C ratios was assessed in a two-way ANOVA (infection × diet) followed by planned contrasts between the reproductive output of Wolbachia-infected and Wolbachia-free flies fed the same diet. Macronutrient intakes were compared between Wolbachia-infected and Wolbachia-free flies using one-way ANOVA. All results were considered significant at the 5% level. Outliers in body reserve and midgut length datasets were identified and removed for statistical analyses.
3. Results and discussion
(a). Macronutrients and body composition in Drosophila
Mated female Canton–S D. melanogaster were confined to one of the 21 diets (n = 180 flies per treatment cage, three cages per treatment). After four days of feeding, the flies were randomly selected from the replicate cages and killed. Body mass and body fat were measured, and midguts and ovaries dissected for separate analysis. Most flies fed P : C = 2 : 1 at 180 g l−1 died within the first three days of the experiment and so were excluded from the analysis. To visualize the response to dietary macronutrients, response landscapes for total body dry mass and percentage of body fat were constructed based on dietary P and C concentrations (see §2a).
Total body dry mass was influenced by diet composition, with significant main effects of P and C concentration (electronic supplementary material, table S3). Total body dry mass decreased in response to increasing P concentration (figure 1a). The principal reason for this was a decline in body fat mass. The percentage of body fat was significantly influenced by P (electronic supplementary material, table S3): the higher the dietary concentration of P, the leaner flies were (figure 1b, see also [57]). In parallel, response landscapes were constructed using estimated food intake previously measured on 1000 flies that were individually fed from microcapillary tubes containing one of 28 diet solutions differing in yeast and sugar ratio and concentration [37] (electronic supplementary material, table S4). Total body dry mass and percentage of body fat were significantly influenced only by estimated P intake (electronic supplementary material, table S5), both measures declining with increased P consumption (electronic supplementary material, figures S1a,b).
Figure 1.

Effects of dietary protein (P) and carbohydrate (C) on (a) body dry mass (numbered contour lines show body dry mass (mg)) and (b) percentage of body fat recorded for flies confined for four days to one of 21 diets varying in both the ratio and the total amount of P and C (numbered contour lines show percentage of body fat). Plots show thin-plate splines colour-coded according to trait value, with ‘hot’ colours (oranges and reds) reflecting high trait values and ‘cold’ colours (green and blues) reflecting low values.
(b). Dietary P : C ratio modulates Wolbachia abundance relative to other gut microbes
We used next-generation sequencing (454 pyrosequencing) to measure the effects of macronutrients on the bacterial diversity in total midgut samples (including bacteria in tissue and midgut lumen). This revealed low bacterial diversity. Although the diversity of the gut microbiota is classically low in Drosophila [53,58–61], this was almost certainly exacerbated by the fact that, in this experiment, the food was sterile and changed every two days (see also [62]). In all flies, the majority of sequence reads were Rickettsiales, especially the endosymbiont Wolbachia, with relative abundance ranging from 65% to near 100% (electronic supplementary material, table S6). When a response surface for the abundance of Wolbachia relative to other taxa was fitted over the dietary P–C composition array, we found a significant interactive effect of P and C (electronic supplementary material, table S7), with the relative abundance of Wolbachia being positively associated with both macronutrients but more particularly with C (figure 2). Similar results were obtained when the relative abundance of Wolbachia was fitted over the estimated P–C consumption array (electronic supplementary material, table S8 and figure S2).
Figure 2.
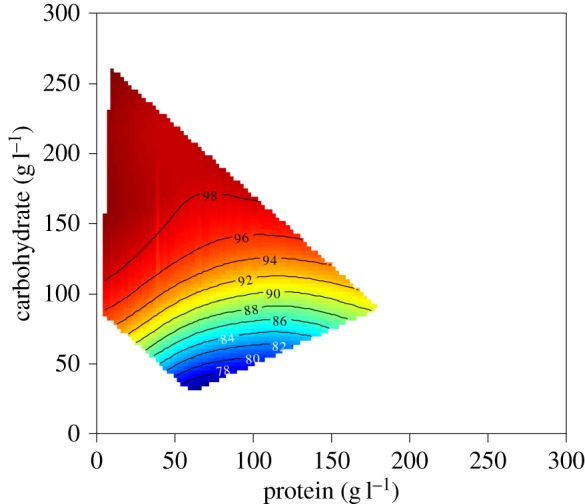
Effects of dietary protein (P) and carbohydrate (C) on the relative abundance of Wolbachia in the midgut of flies confined for four days to one of 21 diets varying in both the ratio and the total amount of P and C. Plots show thin-plate splines colour-coded according to trait value, with ‘hot’ colours (oranges and reds) reflecting high trait values and ‘cold’ colours (green and blues) reflecting low values. Numbered contour lines show relative abundance of Wolbachia.
In order to establish whether the pattern in relative abundance of Wolbachia in the midgut resulted from differences in the density of bacteria (i.e. number per quantity of tissue) [34] or in the total abundance of bacteria (i.e. total number in the tissue), mediated via changes in gut morphology in response to diet, a separate experiment was conducted with female flies fed the 21 dietary treatments for four days (n = 180 flies per treatment cage). DNA was extracted from 20 pooled midguts for each dietary treatment, and the copy numbers of U16S (16S ribosomal DNA) and wsp (Wolbachia surface protein) were measured, using levels of the host gene RPII215 (electronic supplementary material, table S1) as a proxy for the quantity of host midgut tissue. The analysis showed that there was no significant effect of dietary P and/or C on the level of wsp and U16S when normalized by the quantity of host tissue (electronic supplementary material, table S9 and figures S3 and S4). Similarly, we did not find any effect of P and C intake (electronic supplementary material, table S10).
Rather than directly affecting the density of bacteria in gut lumen and tissue, diet may impact total bacterial loads by modifying the morphology of the digestive tract. Previous studies on other insect species have shown that gut size is related to dietary nutrients [63]; larger digestive tracts might help to deal with higher levels of protein intake, facilitate the absorption of other limiting nutrients [64] and/or increase the net nutrient uptake [65]. To test whether dietary P : C ratio affected midgut morphology in D. melanogaster, we measured the effects of macronutrients on midgut length of flies fed the 21 diets (see §2a). Midgut length was significantly influenced by the interaction between P and C concentration (electronic supplementary material, table S11). When data were analysed using estimated macronutrient intakes, we did not find any significant interactive effect of P and C but a significant main effect of estimated P intake (electronic supplementary material, table S12). Midgut length was maximized for a P : C ratio between 1 : 1 and 1 : 2 (figure 3a, see also electronic supplementary material, figure S5). Moreover, the amount of bacterial DNA was significantly correlated with midgut length, i.e. flies with larger digestive tracts hosted more bacteria (R2 = 0.348, n = 21, p = 0.005, figure 3b), including Wolbachia (R2 = 0.251, n = 21, p = 0.021, figure 3c). These results are consistent with the hypothesis that the impact of macronutrients, particularly P, on total bacterial load occurs through changes in the morphology of the gut, such that increased gut length drives both the increase in Wolbachia load within midgut cells and in luminal bacterial load. The notion that Wolbachia load increases owing to increased gut length rather than tissue-specific symbiont carrying capacity is further supported by the observation that there was no change in wsp abundance (normalized by the quantity of host tissue) in the ovaries (electronic supplementary material, tables S13 and S14, electronic supplementary material, figure S6).
Figure 3.

Relationships between dietary protein (P) and carbohydrate (C) and midgut morphology and bacterial loads for flies confined for four days to one of 21 diets varying in both the ratio and the total amount of P and C. (a) Effects of P and C on midgut length. Plots show thin-plate splines colour-coded according to trait value, with ‘hot’ colours (oranges and reds) reflecting high trait values and ‘cold’ colours (green and blues) reflecting low values. Grey dashed lines represent P : C = 1 : 2 and P : C = 1 : 1. Numbered contour lines show gut length (mm). (b) Correlation between midgut length and level of U16S. (c) Correlation between midgut length and level of wsp genes.
(c). Dietary P : C ratio modulates the effects of Wolbachia infection on host reproductive output and lifespan
Diet-induced changes in gut morphology influence total Wolbachia load. Because both Wolbachia infection and host diet have been reported to influence reproductive output (Wolbachia: [44,45]; diet: [37]), we next explored the functional significance of this interaction. Pools of 10 infected and non-infected flies were fed one of seven diets varying in P : C ratio (P : C = 1 : 32, 1 : 16, 1 : 8, 1 : 4, 1 : 2, 1 : 1 and 1.9 : 1, Y + S = 180 g l−1, three replicate cages per diet) for four days, and their reproductive rate was measured at the end of this period by counting the number of newly eclosed adults arising from eggs deposited over a 24 h period (see §2i). There was a significant effect of the interaction between infection status (with or without Wolbachia) and diet composition (P : C ratio) on the total number of newly eclosed adults (two-way ANOVA, infection: F1,40 = 3.715, p = 0.065; diet: F6,40 = 27.940, p < 0.001; infection × diet: F6,40 = 4.593, p = 0.003). Non-infected female flies had highest rate of reproductive output on a P : C ratio between 1 : 4 and 1 : 2, whereas flies infected with Wolbachia maximized their reproductive rate on a more protein-rich diet, P : C = 1 : 1 (figure 4). Although the magnitude of Wolbachia effects on host reproduction has generally been shown to be modest in D. melanogaster [66–70], our results suggest that Wolbachia impose a significant nutritional demand on the host that limits egg production when hosts are fed intermediate P : C diets. Wolbachia-infected and non-infected flies had low reproductive rate on high-carbohydrate diets (i.e. P : C = 1 : 32), presumably owing to shortage of dietary protein. We did not detect any effect of diet composition or Wolbachia infection status on the sex ratio of newly eclosed adults (two-way ANOVA, infection: F1,168 = 1.350, p = 0.254; diet: F6,168 = 0.719, p = 0.638, electronic supplementary material, table S15).
Figure 4.
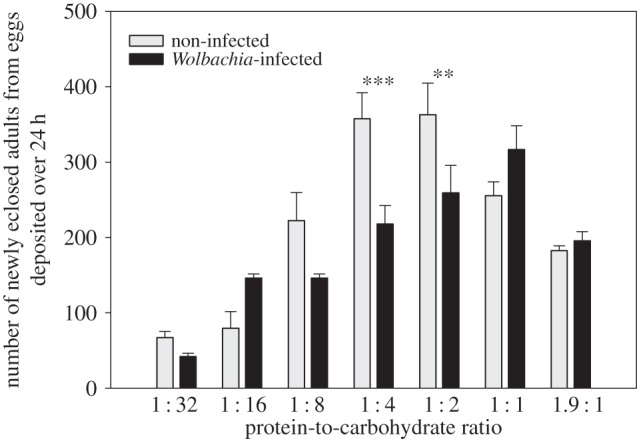
Effects of Wolbachia infection and dietary protein (P) and carbohydrate (C) on the reproductive output of flies confined for four days to one of seven diets varying in P : C ratio. ***p < 0.001, **p < 0.005.
To further disentangle the interactive effect of nutrition and Wolbachia on life-history traits, we investigated how the balance of dietary macronutrients and infection status influenced longevity. Wolbachia infection has been shown to affect longevity in Drosophila, either increasing or decreasing lifespan depending on context [46,71–73]. The ratio of macronutrients in the diet is also an important driver of lifespan variation [36,37] and is likely to modulate the effects of Wolbachia. Flies (n = 100) were either fed one of two foods that differed in their macronutrient composition (P : C = 1 : 1 (180 g l−1) or P : C = 1 : 16 (180 g l−1)), or given a choice between two complementary foods (pure yeast versus sucrose solution, 180 g l−1). Lifespan was measured for three replicate cages per diet. We found a significant effect of diet composition on survivorship (log-rank test, χ2 = 1091.101, d.f. = 5, p < 0.001), with flies fed P : C = 1 : 16 living longer than flies fed P : C = 1 : 1 (figure 5), and flies offered the dietary choice having an intermediate lifespan (figure 5). This is consistent with results previously obtained by Lee et al. [37], showing that when flies were offered a choice of complementary foods they regulated intake of macronutrients to maximize lifetime egg production rather than longevity. Survivorship curves were not significantly different between infected and non-infected flies both for those fed P : C = 1 : 16 (pairwise comparisons, p = 0.125, median lifespan (mean ± s.e.): Wolbachia-infected = 27.1 ± 0.6 days, non-infected = 24.2 ± 0.6 days, figure 5), and for those given a food choice (pairwise comparisons, p = 0.074, median lifespan (mean ± s.e.): Wolbachia-infected = 21.9 ± 0.6 days, non-infected = 20.5 ± 0.7 days, figure 5). However, survivorship curves of infected flies fed P : C = 1 : 1 were significantly different from those of non-infected insects, with non-infected flies living longer than infected flies (pairwise comparisons, p < 0.001, median lifespan (mean ± s.e.): Wolbachia-infected = 7.6 ± 0.6 days, non-infected = 8.2 ± 0.7 days, figure 5). These results might reflect some nutritional competition for carbohydrate between the host and the endobacterium on low-C diets. Wolbachia possesses only a limited number of metabolic pathways [74], and largely depends on its host for metabolic support [2,74,75]. For instance, Wolbachia uses host sugars for glycolysis [76] and to synthesize lipid II, a vital molecule for the bacterium to divide [77,78]. Carbohydrate is limited in P : C = 1 : 1, and this may explain why the infection has a negative effect on host longevity. This result is particularly relevant for other arthropod species that feed on diets that are naturally low in sugars, such as blood-feeding insects.
Figure 5.
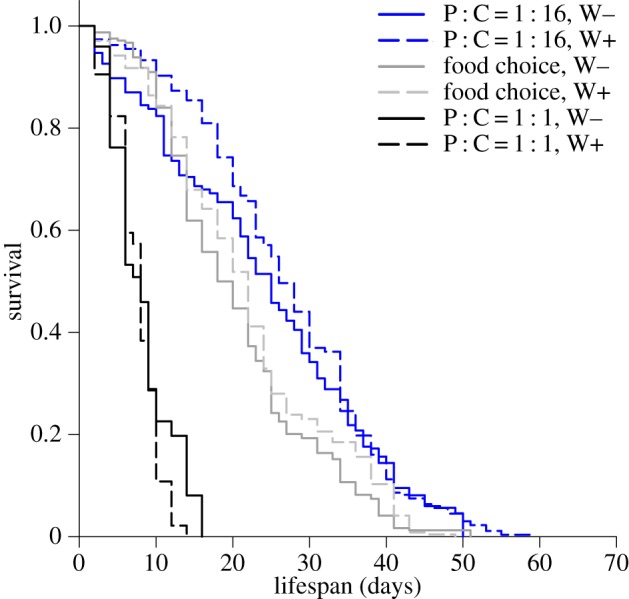
Effects of Wolbachia infection and dietary protein (P) and carbohydrate (C) on lifespan. Kaplan–Meier survival curves for flies fed P : C = 1 : 16 (blue), P : C = 1 : 1 (black) and a choice between complementary foods (grey). Data are presented for flies infected with Wolbachia (W+, dashed lines) as well as for Wolbachia-free insects (W−, solid lines).
(d). Wolbachia-infected flies show modified diet selection to protect lifetime reproductive rate
Symbionts and parasites divert host energy and nutrients towards their own growth and might cause the host to invest resources in immune function. Infected hosts, however, have the capacity to adjust their dietary intake to recoup the extra nutritional demands of being infected [47–50]. We tested whether Wolbachia infection also affects host diet selection by examining the feeding behaviour of Wolbachia-infected and non-infected Drosophila offered a choice of two microcapillaries, one containing a yeast solution (180 g l−1) and the other a sucrose solution (180 g l−1; protocol from references [37,55]). Flies were fed individually for eight days, a period long enough to allow flies to balance their macronutrient intake. Dietary intake was recorded every two days. We analysed total food consumption over the entire eight days, excluding from the analysis insects that died before the end of the experiment. Infected and non-infected flies mixed diets of different compositions. Wolbachia-infected flies ingested less protein than non-infected individuals (ANOVA, F1,44 = 6.46, p = 0.015, figure 6) but similar quantities of carbohydrate (ANOVA, F1,44 = 0.05, p = 0.82, figure 6). Mean selected P : C ratio after eight days was 1 : 20 for infected flies and 1 : 9 for non-infected individuals (figure 6). Therefore, Wolbachia-infected flies ingested a relatively lower P : C diet, thereby mitigating the life-shortening effects of infection but at a cost of lowered rate of reproduction. These results suggest that Wolbachia-infected flies adjust their diet composition to ameliorate the life-shortening consequences of infection for reproductive output.
Figure 6.
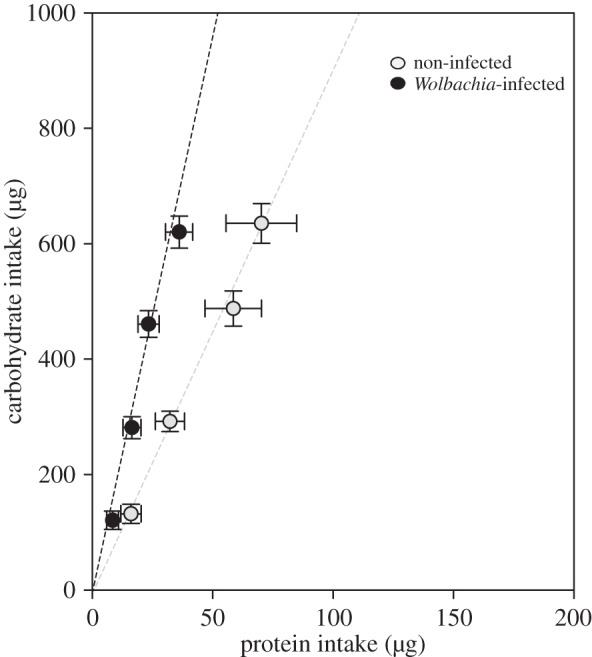
Cumulative protein–carbohydrate intake (mean ± s.e.m.) trajectories at two-day intervals over eight days for flies provided with two 5 µl glass capillaries containing a yeast solution (180 g l−1) and a sucrose solution (180 g l−1). The dashed lines indicate the protein–carbohydrate intake trajectories for Wolbachia-infected and non-infected flies.
Wolbachia infection is used as a biocontrol strategy to reduce the transmission of vector-borne disease, and some of the effects of the nutritional competition between the host and its symbionts might contribute to the phenotype observed in infected hosts, such as decreased fecundity and an increased protection against viral development [75]. Others have shown that different strains of Wolbachia impose specific nutritional costs for cholesterol and amino acids [75,79], and differences in blood source influence the effects of Wolbachia infection in mosquitoes [80]. Our results further emphasize the essential role of macronutrients, and are likely to be pertinent to a diverse range of research disciplines spanning from host nutrition and life-history theory to public health.
Supplementary Material
Supplementary Material
Acknowledgements
The authors acknowledge the Australian Research Council for support through DP130103222.
Funding statement
S.J.S. was additionally supported by an Australian Research Council Laureate Fellowship. F.P. was additionally supported by the University of Sydney. K.W. received additional funding from the UK's Biotechnology and Biological Sciences Research Council (BB/I02249X/1), and from a Royal Society Leverhulme Trust Senior Research Fellowship. D.R. was part-supported by Gravida, The National Research Centre for Growth and Development, New Zealand.
References
- 1.McMeniman CJ, Lane RV, Cass BN, Fong AWC, Sidhu M, Wang Y-F, O'Neill SL. 2009. Stable introduction of a life-shortening Wolbachia infection into the mosquito Aedes aegypti. Science 323, 141–144. ( 10.1126/science.1165326) [DOI] [PubMed] [Google Scholar]
- 2.Moreira LA, et al. 2009. A Wolbachia symbiont in Aedes aegypti limits infection with dengue, chikungunya, and Plasmodium. Cell 139, 1268–1278. ( 10.1016/j.cell.2009.11.042) [DOI] [PubMed] [Google Scholar]
- 3.Cook PE, McMeniman CJ, O'Neill SL. 2008. Modifying insect population age structure to control vector-borne disease. Adv. Exp. Med. Biol. 627, 126–140. ( 10.1007/978-0-387-78225-6_11) [DOI] [PubMed] [Google Scholar]
- 4.Hedges LM, Brownlie JC, O'Neill SL, Johnson KN. 2008. Wolbachia and virus protection in insects. Science 322, 702 ( 10.1126/science.1162418) [DOI] [PubMed] [Google Scholar]
- 5.Teixeira L, Ferreira Á, Ashburner M. 2008. The bacterial symbiont Wolbachia induces resistance to RNA viral infections in Drosophila melanogaster. PLoS Biol. 6, e1000002 ( 10.1371/journal.pbio.1000002) [DOI] [PMC free article] [PubMed] [Google Scholar]
- 6.Walker T, et al. 2011. The wMel Wolbachia strain blocks dengue and invades caged Aedes aegypti populations. Nature 476, 450–453. ( 10.1038/nature10355) [DOI] [PubMed] [Google Scholar]
- 7.Osborne SE, Leong YS, O'Neill SL, Johnson KN. 2009. Variation in antiviral protection mediated by different Wolbachia strains in Drosophila simulans. PLoS Pathog. 5, e1000656 ( 10.1371/journal.ppat.1000656) [DOI] [PMC free article] [PubMed] [Google Scholar]
- 8.Hoffmann AA, et al. 2011. Successful establishment of Wolbachia in Aedes populations to suppress dengue transmission. Nature 476, 454–457. ( 10.1038/nature10356) [DOI] [PubMed] [Google Scholar]
- 9.Bian G, Xu Y, Lu P, Xie Y, Xi Z. 2010. The endosymbiotic bacterium Wolbachia induces resistance to dengue virus in Aedes aegypti. PLoS Pathog. 6, e1000833 ( 10.1371/journal.ppat.1000833) [DOI] [PMC free article] [PubMed] [Google Scholar]
- 10.Glaser RL, Meola MA. 2010. The native Wolbachia endosymbionts of Drosophila melanogaster and Culex quinquefasciatus increase host resistance to west Nile virus infection. PLoS ONE 5, e11977 ( 10.1371/journal.pone.0011977) [DOI] [PMC free article] [PubMed] [Google Scholar]
- 11.Wong ZS, Hedges LM, Brownlie JC, Johnson KN. 2011. Wolbachia-mediated antibacterial protection and immune gene regulation in Drosophila. PLoS ONE 6, e25430 ( 10.1371/journal.pone.0025430) [DOI] [PMC free article] [PubMed] [Google Scholar]
- 12.Ahantarig A, Trinachartvanit W, Kittayapong P. 2008. Relative Wolbachia density of field-collected Aedes albopictus mosquitoes in Thailand. J. Vect. Ecol. 33, 173–177. ( 10.3376/1081-1710(2008)33[173:rwdofa]2.0.co;2) [DOI] [PubMed] [Google Scholar]
- 13.Unckless RL, Boelio LM, Herren JK, Jaenike J. 2009. Wolbachia as populations within individual insects: causes and consequences of density variation in natural populations. Proc. R. Soc. B 276, 2805–2811. ( 10.1098/rspb.2009.0287) [DOI] [PMC free article] [PubMed] [Google Scholar]
- 14.Martinez J, Longdon B, Bauer S, Chan Y-S, Miller WJ, Bourtzis K, Teixeira L, Jigginset FM. 2014. Symbionts commonly provide broad spectrum resistance to viruses in insects: a comparative analysis of Wolbachia strains. PLoS Pathog. 10, e1004369 ( 10.1371/journal.ppat.1004369) [DOI] [PMC free article] [PubMed] [Google Scholar]
- 15.Jaenike J. 2009. Coupled population dynamics of endosymbionts within and between hosts. Oikos 118, 353–362. ( 10.1111/j.1600-0706.2008.17110.x) [DOI] [Google Scholar]
- 16.McGraw EA, Merritt DJ, Droller JN, O'Neill SL. 2002. Wolbachia density and virulence attenuation after transfer into a novel host. Proc. Natl Acad. Sci. USA 99, 2918–2923. ( 10.1073/pnas.052466499) [DOI] [PMC free article] [PubMed] [Google Scholar]
- 17.Sinkins SP, Braig HR, Oneill SL. 1995. Wolbachia pipientis: bacterial density and unidirectional cytoplasmic incompatibility between infected populations of Aedes albopictus. Exp. Parasitol. 81, 284–291. ( 10.1006/expr.1995.1119) [DOI] [PubMed] [Google Scholar]
- 18.Hurst L. 1991. The evolution of cytoplasmic incompatibility or when spite can be successful. J. Theor. Biol. 148, 269–277. ( 10.1016/S0022-5193(05)80344-3) [DOI] [PubMed] [Google Scholar]
- 19.Hall SR, Knight CJ, Becker CR, Duffy MA, Tessier AJ, Cáceres CE. 2009. Quality matters: resource quality for hosts and the timing of epidemics. Ecol. Lett. 12, 118–128. ( 10.1111/j.1461-0248.2008.01264.x) [DOI] [PubMed] [Google Scholar]
- 20.Ebert D, Zschokke-Rohringer CD, Carius HJ. 2000. Dose effects and density-dependent regulation of two microparasites of Daphnia magna. Oecologia 122, 200–209. ( 10.1007/pl00008847) [DOI] [PubMed] [Google Scholar]
- 21.Bedhomme S, Agnew P, Sidobre C, Michalakis Y. 2004. Virulence reaction norms across a food gradient. Proc. R. Soc. Lond. B 271, 739–744. ( 10.1098/rspb.2003.2657) [DOI] [PMC free article] [PubMed] [Google Scholar]
- 22.Ryder JJ, Hathway J, Knell RJ. 2007. Constraints on parasite fecundity and transmission in an insect-STD system. Oikos 116, 578–584. ( 10.1111/j.0030-1299.2007.15574.x) [DOI] [Google Scholar]
- 23.De Roode JC, Pedersen AB, Hunter MD, Altizer S. 2008. Host plant species affects virulence in monarch butterfly parasites. J. Anim. Ecol. 77, 120–126. ( 10.1111/j.1365-2656.2007.01305.x) [DOI] [PubMed] [Google Scholar]
- 24.Vale PF, Choisy M, Little TJ. 2013. Host nutrition alters the variance in parasite transmission potential. Biol. Lett. 9, 20121145 ( 10.1098/rsbl.2012.1145) [DOI] [PMC free article] [PubMed] [Google Scholar]
- 25.Brown MJF, Loosli R, Schmid-Hempel P. 2000. Condition-dependent expression of virulence in a trypanosome infecting bumblebees. Oikos 91, 421–427. ( 10.1034/j.1600-0706.2000.910302.x) [DOI] [Google Scholar]
- 26.Hodgson DJ, Vanbergen AJ, Hartley SE, Hails RS, Cory JS. 2002. Differential selection of baculovirus genotypes mediated by different species of host food plant. Ecol. Lett. 5, 512–518. ( 10.1046/j.1461-0248.2002.00338.x) [DOI] [Google Scholar]
- 27.Tseng M. 2006. Interactions between the parasite's previous and current environment mediate the outcome of parasite infection. Am. Nat. 168, 565–571. ( 10.1086/507997) [DOI] [PubMed] [Google Scholar]
- 28.Frost PC, Ebert D, Smith VH. 2008. Responses of a bacterial pathogen to phosphorus limitation of its aquatic invertebrate host. Ecology 89, 313–318. ( 10.1890/07-0389.1) [DOI] [PubMed] [Google Scholar]
- 29.Seppälä O, Liljeroos K, Karvonen A, Jokela J. 2008. Host condition as a constraint for parasite reproduction. Oikos 117, 749–753. ( 10.1111/j.0030-1299.2008.16396.x) [DOI] [Google Scholar]
- 30.Lefèvre T, Vantaux A, Dabiré KR, Mouline K, Cohuet A. 2013. Non-genetic determinants of mosquito competence for malaria parasites. PLoS Pathog. 9, e1003365 ( 10.1371/journal.ppat.1003365) [DOI] [PMC free article] [PubMed] [Google Scholar]
- 31.Wu GD, et al. 2011. Linking long-term dietary patterns with gut microbial enterotypes. Science 334, 105–108. ( 10.1126/science.1208344) [DOI] [PMC free article] [PubMed] [Google Scholar]
- 32.Walker AW, et al. 2011. Dominant and diet-responsive groups of bacteria within the human colonic microbiota. ISME J. 5, 220–230. ( 10.1038/ismej.2010.118) [DOI] [PMC free article] [PubMed] [Google Scholar]
- 33.Turnbaugh PJ, Ridaura VK, Faith JJ, Rey FE, Knight R, Gordon JI. 2009. The effect of diet on the human gut microbiome: a metagenomic analysis in humanized gnotobiotic mice. Sci. Trans. Med. 1, 6ra14 ( 10.1126/scitranslmed.3000322) [DOI] [PMC free article] [PubMed] [Google Scholar]
- 34.Faith JJ, McNulty NP, Rey FE, Gordon JI. 2011. Predicting a human gut microbiota's response to diet in gnotobiotic mice. Science 333, 101–104. ( 10.1126/science.1206025) [DOI] [PMC free article] [PubMed] [Google Scholar]
- 35.Chandler JA, Morgan Lang J, Bhatnagar S, Eisen JA, Kopp A. 2011. Bacterial communities of diverse Drosophila species: ecological context of a host–microbe model system. PLoS Genet. 7, e1002272 ( 10.1371/journal.pgen.1002272) [DOI] [PMC free article] [PubMed] [Google Scholar]
- 36.Simpson SJ, Raubenheimer D. 2012. The nature of nutrition: a unifying framework from animal adaptation to human obesity. Princeton, NJ: Princeton University Press. [Google Scholar]
- 37.Lee KP, Simpson SJ, Clissold FJ, Brooks R, Ballard JW, Taylor PW, Soran N, Raubenheimer D. 2008. Lifespan and reproduction in Drosophila: new insights from nutritional geometry. Proc. Natl Acad. Sci. USA 105, 2498–2503. ( 10.1073/pnas.0710787105) [DOI] [PMC free article] [PubMed] [Google Scholar]
- 38.Chambers PG, Simpson SJ, Raubenheimer D. 1995. Behavioural mechanisms of nutrient balancing in Locusta migratoria nymphs. Anim. Behav. 50, 1513–1523. ( 10.1016/0003-3472(95)80007-7) [DOI] [Google Scholar]
- 39.Raubenheimer D, Jones SA. 2006. Nutritional imbalance in an extreme generalist omnivore: tolerance and recovery through complementary food selection. Anim. Behav. 71, 1253–1262. ( 10.1016/j.anbehav.2005.07.024) [DOI] [Google Scholar]
- 40.Raubenheimer D, Simpson SJ. 2003. Nutrient balancing in grasshoppers: behavioural and physiological correlates of dietary breadth. J. Exp. Biol. 206, 1669–1681. ( 10.1242/jeb.00336) [DOI] [PubMed] [Google Scholar]
- 41.Simpson SJ, Sibly RM, Lee KP, Behmer ST, Raubenheimer D. 2004. Optimal foraging when regulating intake of multiple nutrients. Anim. Behav. 68, 1299–1311. ( 10.1016/j.anbehav.2004.03.003) [DOI] [Google Scholar]
- 42.Fanson BG, Weldon CW, Perez-Staples D, Simpson SJ, Taylor PW. 2009. Nutrients, not caloric restriction, extend lifespan in Queensland fruit flies (Bactrocera tryoni). Aging Cell 8, 514–523. ( 10.1111/j.1474-9726.2009.00497.x) [DOI] [PubMed] [Google Scholar]
- 43.Mayntz D, Toft S, Vollrath F. 2009. Nutrient balance affects foraging behaviour of a trap-building predator. Biol. Lett. 5, 735–738. ( 10.1098/rsbl.2009.0431) [DOI] [PMC free article] [PubMed] [Google Scholar]
- 44.Karr T. 1994. Cytoplasmic incompatibility: giant steps sideways. Curr. Biol. 4, 537–540. ( 10.1016/S0960-9822(00)00118-4) [DOI] [PubMed] [Google Scholar]
- 45.Werren J. 1997. Biology of Wolbachia. Annu. Rev. Entomol. 42, 587–609. ( 10.1146/annurev.ento.42.1.587) [DOI] [PubMed] [Google Scholar]
- 46.Fry AJ, Rand DM. 2002. Wolbachia interactions that determine Drosophila melanogaster survival. Evolution 56, 1976–1981. ( 10.1111/j.0014-3820.2002.tb00123.x) [DOI] [PubMed] [Google Scholar]
- 47.Lee KP, Cory JS, Wilson K, Raubenheimer D, Simpson SJ. 2006. Flexible diet choice offsets protein costs of pathogen resistance in a caterpillar. Proc. R. Soc. B 273, 823–829. ( 10.1098/rspb.2005.3385) [DOI] [PMC free article] [PubMed] [Google Scholar]
- 48.Povey S, Cotter SC, Simpson SJ, Lee KP, Wilson K. 2009. Can the protein costs of bacterial resistance be offset by altered feeding behaviour? J. Anim. Ecol. 78, 437–446. ( 10.1111/j.1365-2656.2008.01499.x) [DOI] [PubMed] [Google Scholar]
- 49.Povey S, Cotter SC, Simpson SJ, Wilson K. 2013. Dynamics of macronutrient self-medication and illness-induced anorexia in virally infected insects. J. Anim. Ecol. 83, 245–255. ( 10.1111/1365-2656.12127) [DOI] [PMC free article] [PubMed] [Google Scholar]
- 50.Ponton F, Lalubin F, Fromont C, Wilson K, Behm C, Simpson SJ. 2011. Hosts use altered macronutrient intake to circumvent parasite-induced reduction in fecundity. Int. J. Parasitol. 41, 43–50. ( 10.1016/j.ijpara.2010.06.007) [DOI] [PubMed] [Google Scholar]
- 51.Bradford MM. 1976. A rapid and sensitive method for the quantitation of microgram quantities of protein utilizing the principle of protein-dye binding. Anal. Biochem. 72, 248–254. ( 10.1016/0003-2697(76)90527-3) [DOI] [PubMed] [Google Scholar]
- 52.Riegler M, Iturbe-Ormaetxe I, Woolfit M, Miller W, O'Neill S. 2012. Tandem repeat markers as novel diagnostic tools for high resolution fingerprinting of Wolbachia. BMC Microbiol. 12, S12 ( 10.1186/1471-2180-12-S1-S12) [DOI] [PMC free article] [PubMed] [Google Scholar]
- 53.Cox CR, Gilmore MS. 2007. Native microbial colonization of Drosophila melanogaster and its use as a model of Enterococcus faecalis pathogenesis. Infect. Immun. 75, 1565–1576. ( 10.1128/iai.01496-06) [DOI] [PMC free article] [PubMed] [Google Scholar]
- 54.Andreotti R, Perez de Leon AA, Dowd SE, Guerrero FD, Bendele KG, Scoles GA. 2011. Assessment of bacterial diversity in the cattle tick Rhipicephalus (Boophilus) microplus through tag-encoded pyrosequencing. BMC Microbiol. 11, 6 ( 10.1186/1471-2180-11-6) [DOI] [PMC free article] [PubMed] [Google Scholar]
- 55.Ja WW, Carvalho GB, Mak EM, de la Rosa NN, Fang AY, Liong JC, Brummel T, Benzer S. 2007. Prandiology of Drosophila and the CAFE assay. Proc. Natl Acad. Sci. USA 104, 8253–8256. ( 10.1073/pnas.0702726104) [DOI] [PMC free article] [PubMed] [Google Scholar]
- 56.Engqvist L. 2005. The mistreatment of covariate interaction terms in linear model analyses of behavioural and evolutionary ecology studies. Anim. Behav. 70, 967–971. ( 10.1016/j.anbehav.2005.01.016) [DOI] [Google Scholar]
- 57.Skorupa DA, Dervisefendic A, Zwiener J, Pletcher SD. 2008. Dietary composition specifies consumption, obesity, and lifespan in Drosophila melanogaster. Aging Cell 7, 478–490. ( 10.1111/j.1474-9726.2008.00400.x) [DOI] [PMC free article] [PubMed] [Google Scholar]
- 58.Wong CNA, Ng P, Douglas AE. 2011. Low-diversity bacterial community in the gut of the fruitfly Drosophila melanogaster. Environ. Microbiol. 13, 1889–1900. ( 10.1111/j.1462-2920.2011.02511.x) [DOI] [PMC free article] [PubMed] [Google Scholar]
- 59.Corby-Harris V, Pontaroli AC, Shimkets LJ, Bennetzen JL, Habel KE, Promislow DEL. 2007. The geographical distribution and diversity of bacteria associated with natural populations of Drosophila melanogaster. Appl. Environ. Microbiol. 73, 3470–3479. ( 10.1128/aem.02120-06) [DOI] [PMC free article] [PubMed] [Google Scholar]
- 60.Ren C, Webster P, Finkel SE, Tower J. 2007. Increased internal and external bacterial load during Drosophila aging without life-span trade-off. Cell Metab. 6, 144–152. ( 10.1016/j.cmet.2007.06.006) [DOI] [PubMed] [Google Scholar]
- 61.Ryu J-H, et al. 2008. Innate immune homeostasis by the homeobox gene caudal and commensal-gut mutualism in Drosophila. Science 319, 777–782. ( 10.1126/science.1149357) [DOI] [PubMed] [Google Scholar]
- 62.Blum JE, Fischer CN, Miles J, Handelsman J. 2013. Frequent replenishment sustains the beneficial microbiome of Drosophila melanogaster. mBio 4, 300860-13 ( 10.1128/mBio.00860-13) [DOI] [PMC free article] [PubMed] [Google Scholar]
- 63.Raubenheimer D, Bassil K. 2007. Separate effects of macronutrient concentration and balance on plastic gut responses in locusts. J. Comp. Physiol. B 177, 849–855. ( 10.1007/s00360-007-0180-5) [DOI] [PubMed] [Google Scholar]
- 64.Sorensen A, Mayntz D, Simpson SJ, Raubenheimer D. 2010. Dietary ratio of protein to carbohydrate induces plastic responses in the gastrointestinal tract of mice. J. Comp. Physiol. B 180, 259–266. ( 10.1007/s00360-009-0402-0) [DOI] [PubMed] [Google Scholar]
- 65.Clissold FJ, Brown ZP, Simpson SJ. 2013. Protein-induced mass increase of the gastrointestinal tract of locusts improves net nutrient uptake via larger meals rather than more efficient nutrient absorption. J. Exp. Biol. 216, 329–337. ( 10.1242/jeb.076489) [DOI] [PubMed] [Google Scholar]
- 66.Hoffmann A, Hercus M, Dagher H. 1998. Population dynamics of the Wolbachia infection causing cytoplasmic incompatibility in Drosophila melanogaster. Genetics 148, 221–231. [DOI] [PMC free article] [PubMed] [Google Scholar]
- 67.Cook PE, McGraw EA. 2010. Wolbachia pipientis: an expanding bag of tricks to explore for disease control. Trends Parasitol. 26, 373–375. ( 10.1016/j.pt.2010.05.006) [DOI] [PubMed] [Google Scholar]
- 68.Reynolds KT, Hoffmann AA. 2002. Male age, host effects and the weak expression or non-expression of cytoplasmic incompatibility in Drosophila strains infected by maternally transmitted Wolbachia. Genetics Res. 80, 79–87. ( 10.1017/S0016672302005827) [DOI] [PubMed] [Google Scholar]
- 69.Yamada R, Floate KD, Riegler M, O'Neill SL. 2007. Male development time influences the strength of Wolbachia-induced cytoplasmic incompatibility expression in Drosophila melanogaster. Genetics 177, 801–808. ( 10.1534/genetics.106.068486) [DOI] [PMC free article] [PubMed] [Google Scholar]
- 70.Hoffmann AA. 1988. Partial cytoplasmic incompatibility between two Australian populations of Drosophila melanogaster. Entomol. Exp. Appl. 48, 61–67. ( 10.1111/j.1570-7458.1988.tb02299.x) [DOI] [Google Scholar]
- 71.Fry AJ, Palmer MR, Rand DM. 2004. Variable fitness effects of Wolbachia infection in Drosophila melanogaster. Heredity 93, 379–389. ( 10.1038/sj.hdy.6800514) [DOI] [PubMed] [Google Scholar]
- 72.Min KT, Benzer S. 1997. Wolbachia, normally a symbiont of Drosophila, can be virulent, causing degeneration and early death. Proc. Natl Acad. Sci. USA 94, 10 792–10 796. ( 10.1073/pnas.94.20.10792) [DOI] [PMC free article] [PubMed] [Google Scholar]
- 73.Foster J, et al. 2005. The Wolbachia genome of Brugia malayi: endosymbiont evolution within a human pathogenic nematode. PLoS Biol. 3, e121 ( 10.1371/journal.pbio.0030121) [DOI] [PMC free article] [PubMed] [Google Scholar]
- 74.Wu M, et al. 2004. Phylogenomics of the reproductive parasite Wolbachia pipientis wMel: a streamlined genome overrun by mobile genetic elements. PLoS Biol. 2, 327–341. ( 10.1371/journal.pbio.0020069) [DOI] [PMC free article] [PubMed] [Google Scholar]
- 75.Caragata EP, Rancès E, Hedges LM, Gofton AW, Johnson KN, O'Neill SL, McGraw EA. 2013. Dietary cholesterol modulates pathogen blocking by Wolbachia. PLoS Pathog. 9, e1003459 ( 10.1371/journal.ppat.1003459) [DOI] [PMC free article] [PubMed] [Google Scholar]
- 76.Markov AV, Zakharov IA. 2006. The parasitic bacterium Wolbachia and the origin of the eukaryotic cell. Paleontol. J. 40, 115–124. ( 10.1134/s0031030106020018) [DOI] [Google Scholar]
- 77.Henrichfreise B, et al. 2009. Functional conservation of the lipid II biosynthesis pathway in the cell wall-less bacteria Chlamydia and Wolbachia: why is lipid II needed? Mol. Microbiol. 73, 913–923. ( 10.1111/j.1365-2958.2009.06815.x) [DOI] [PubMed] [Google Scholar]
- 78.Vollmer J, Schiefer A, Schneider T, Jülicher K, Johnston KL, Taylor MJ, Sahl H-G, Hoerauf A, Pfarr K. 2013. Requirement of lipid II biosynthesis for cell division in cell wall-less Wolbachia, endobacteria of arthropods and filarial nematodes. Int. J. Med. Microbiol. 303, 140–149. ( 10.1016/j.ijmm.2013.01.002) [DOI] [PubMed] [Google Scholar]
- 79.Caragata EP, Rances E, O'Neill SL, McGraw EA. 2014. Competition for amino acids between Wolbachia and the mosquito host, Aedes aegypti. Microb. Ecol. 67, 205–218. ( 10.1007/s00248-013-0339-4) [DOI] [PubMed] [Google Scholar]
- 80.McMeniman CJ, Hughes GL, O'Neill SL. 2011. A Wolbachia symbiont in Aedes aegypti disrupts mosquito egg development to a greater extent when mosquitoes feed on nonhuman versus human blood. J. Med. Entomol. 48, 76–84. ( 10.1603/ME09188) [DOI] [PubMed] [Google Scholar]
Associated Data
This section collects any data citations, data availability statements, or supplementary materials included in this article.