

Abstract
BACKGROUND
Time trends in cancer incidence rates (IR) are important to measure the changing burden of cancer on a population over time. The overall IR of cancer in the United States is declining. Although central nervous system tumors (CNST) are rare, they contribute disproportionately to mortality and morbidity. In this analysis, the authors examined trends in the incidence of the most common cancers and CNST between 2000 and 2010.
METHODS
The current analysis used data from the United States Cancer Statistics publication and the Central Brain Tumor Registry of the United States. Age-adjusted IR per 100,000 population with 95% confidence intervals and the annual percent change (APC) with 95% confidence intervals were calculated for selected common cancers and CNST overall and by age, sex, race/ethnicity, selected histologies, and malignancy status.
RESULTS
In adults, there were significant decreases in colon (2000-2010: APC, −3.1), breast (2000-2010: APC, −0.8), lung (2000-2010: APC, −1.1), and prostate (2000-2010: APC, −2.4) cancer as well as malignant CNST (2008-2010: APC, −3.1), but a significant increase was noted in nonmalignant CNST (2004-2010: APC, 2.7). In adolescents, there were significant increases in malignant CNST (2000-2008: APC, 1.0) and nonmalignant CNST (2004-2010: APC, 3.9). In children, there were significant increases in acute lymphocytic leukemia (2000-2010: APC, 1.0), non-Hodgkin lymphoma (2000-2010: APC, 0.6), and malignant CNST (2000-2010: APC, 0.6).
CONCLUSIONS
Surveillance of IR trends is an important way to measure the changing public health and economic burden of cancer. In the current study, there were significant decreases noted in the incidence of adult cancer, whereas adolescent and childhood cancer IR were either stable or increasing. Cancer 2015;121:102–112. © 2014 The Authors. Cancer published by Wiley Periodicals, Inc. on behalf of American Cancer Society.
Time trends in cancer incidence rates are important to measure the changing burden of cancer on a population over time. In adults, there were significant decreases noted in the incidence of colon, breast, lung, prostate, and malignant central nervous system tumors (CNST), but a significant increase in nonmalignant CNST. There were significant increases observed in malignant CNST and nonmalignant CNST among adolescents and significant increases in acute lymphocytic leukemia, non-Hodgkin lymphoma, and malignant CNST noted in children.
Keywords: time trends, incidence rates, annual percent change (APC), central nervous system tumors, United States Cancer Statistics (USCS), Central Brain Tumor Registry of the United States (CBTRUS)
INTRODUCTION
Recent cancer surveillance reports have documented a significant decrease in incidence rates (IR) of adult cancer overall, as well as significant declines in the most common adult cancers (female breast, colon, lung, and prostate).1 This is not the case in childhood cancers, in which IR have been increasing, driven largely by increases in leukemia and central nervous system tumors (CNST).2
CNST are rare in adults, and are either malignant (age-adjusted IR of 8.85 per 100,000 population) or nonmalignant (age-adjusted IR of 18.53 per 100,000 population).3 Malignant CNST (MCNST) contribute disproportionately to cancer mortality: they are the second leading cause of cancer mortality in men aged 20 to 39 years and the fifth leading cause in women aged 20 to 39 years.3 They are the most common solid tumor and the second most common cancer diagnosed overall among children aged <15 years,4 as well as the second leading cause of cancer mortality in individuals aged <20 years.1,2
Although overall time trends in cancer incidence are important to measure the economic and public health impact of cancer in the United States, these measures may underestimate the burden imposed by rare cancers. In the current study, we examined the incidence time trends in the most common cancers diagnosed in adults (female breast, colon, lung, and prostate)1 and other common cancers in children/adolescents (acute lymphocytic leukemia [ALL], acute myeloid leukemia [AML], Hodgkin lymphoma [HL], and non-Hodgkin lymphoma [NHL])2 in comparison with the incidence of CNST between 2000 and 2010.
MATERIALS AND METHODS
Data Collection
The current study was conducted under approval from the University Hospitals Case Medical Center Institutional Review Board. The Central Brain Tumor Registry of the United States (CBTRUS) is to our knowledge the largest aggregation of population-based incidence data on primary CNST in the United States.3 The CBTRUS contains incidence data from 50 central cancer registries (45 National Program of Cancer Registries and 5 Surveillance, Epidemiology, and End Results [SEER] registries), representing approximately 98% of the US population.3 The current study used the CBTRUS analytic file to examine trends in the incidence of malignant CNST (MCNST) from 2000 to 2010 and nonmalignant CNST (NMCNST) from 2004 to 2010. NMCNST were not routinely collected in the United States until January 2004 with the passing of the Benign Brain Tumor Cancer Registries Amendment Act,5 when the definition of cancer was expanded to include nonmalignant brain tumors having International Classification of Diseases for Oncology 3rd Edition (ICD-O-3) codes. Incidence rates from the entire United States for all other cancers were obtained from the United States Cancer Statistics (USCS) publication, which is produced by the Centers for Disease Control and Prevention and the National Cancer Institute via the Centers for Disease Control and Prevention Wide-ranging Online Data for Epidemiologic Research (WONDER), which includes data for all 50 states and the District of Columbia.6 All IR were adjusted to the 2000 US standard population.
Statistical Analysis
SEER*Stat 8.1.5 statistical software (seer.cancer.gov/seerstat/) was used to calculate the age-adjusted IR per 100,000 population with 95% confidence intervals (95% CIs) for brain and CNS tumors overall, and by race/ethnicity, sex, age groups (children [aged birth to 14 years], adolescents [aged 15-19 years], and adults [aged ≥20 years]), site in the brain, malignancy (malignancy indicated by an ICD-O, 3rd edition [ICD-O-3] behavior code of 3; nonmalignant indicated by an ICD-O-3 behavior code of 0-2), and selected CNST histologies. The Joinpoint regression program (surveillance.cancer.gov/joinpoint/) was used to calculate the annual percent change (APC) with 95% CIs to generate and test time trends in IR. The Joinpoint program chooses the smallest number of joinpoints such that if one more joinpoint is added, the improvement is not statistically significant.7 For adults, the incidence of CNST (ICD-O-3 site codes C70.0-C72.9, C75.1-C75.3, and C30.0 and ICD-O-3 histology codes 9522-9523 only) were compared with trends in breast (females only), lung and bronchus, prostate (males only), and colon and rectal cancer (per ICD-O-3 codes as outlined at the following Web site: http://wonder.cdc.gov/wonder/help/cancer-v2010.html#Leading%20Cancer%20Sites), and trends in CNST in adolescents and children were compared with trends in ALL, AML, HL, and NHL (as per ICD-O-3 codes as at the following Web site: http://wonder.cdc.gov/wonder/help/cancer-v2010.html#Leading%20Cancer%20Sites). CNST histologies were defined according to the CBTRUS histology groupings3 based on the 2007 World Health Organization (WHO) classification for CNS tumors,8 with the addition of low-grade glioma (ICD-O-3 site codes C71.0-C71.9 and ICD-O-3 histology codes 9140, 9380 [site C72.3 only], 9384, 9400, 9411, 9420, 9421, 9424, and 9450; behavior code 3) and high-grade glioma (ICD-O-3 site codes C71.0-C71.9 and ICD-O-3 histology codes 9380 [site C71.7 only], 9381, 9401, 9440-9442, 9451, and 9460; behavior code 3).
RESULTS
The most common cancers diagnosed in adults between 2000 and 2010 were those of the prostate (IR, 215.96 per 100,000 population), breast (IR, 173.65 per 100,000 population), lung/bronchus (IR, 95.40 per 100,000 population), and colon and rectum (IR, 68.52 per 100,000 population), which all exceeded the IR of MCNST (IR, 8.93 per 100,000 population) (Fig. 1). The IR of cancers of the prostate, lung, breast, and colon all decreased over the entire study period (Table1). In adults, the IR of MCNST was stable, but decreased significantly at the end of the period (2008-2010: APC, −3.1) (Table1) (Fig. 2A). However, the IR of NMCNST significantly increased (2004-2010: APC, 2.7) (Table1) (Fig. 3A).
Figure 1.
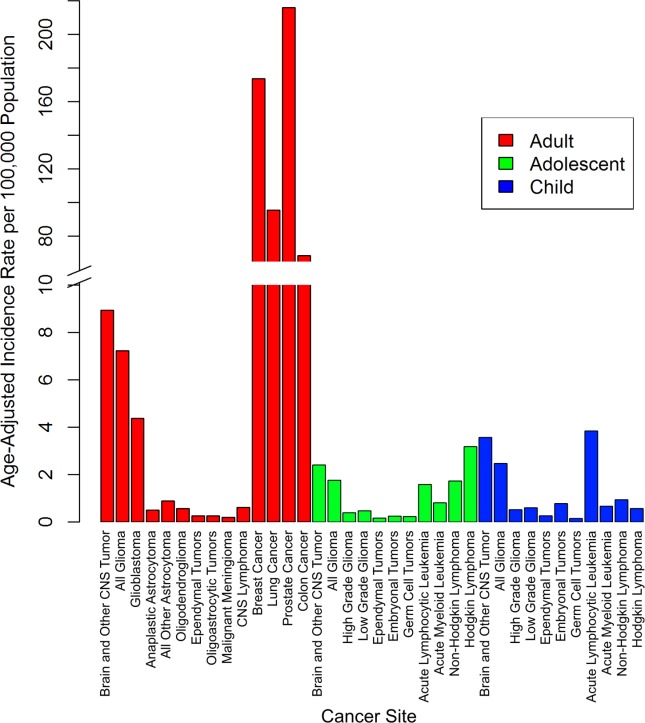
Incidence rates from 2000 through 2010 are shown for selected cancers in adults, adolescents, and children, based on the United States Cancer Statistics (USCS) publication for 2000 to 2010 and the Central Brain Tumor Registry of the United States (CBTRUS) for 2000 through 2010. Overall age-adjusted incidence rates per 100,000 population from 2000 through 2010 are presented for selected common cancers and selected brain and central nervous system (CNS) histologies in adults, adolescents, and children.
Table 1.
Trends in Selected Cancers in Adults (Aged ≥20 Years) by Age Group, Sex, and Race/Ethnicity: USCS 2000 to 2010 and CBTRUS 2000 to 2010
| Colon | Breast (Female Only) | Lung and Bronchus | Prostate (Male Only) | Malignant CNST | Nonmalignant CNST | |||||||||||||
|---|---|---|---|---|---|---|---|---|---|---|---|---|---|---|---|---|---|---|
| Years | APC | 95% CI | Years | APC | 95% CI | Years | APC | 95% CI | Years | APC | 95% CI | Years | APC | 95% CI | Years | APC | 95% CI | |
| Age group, y | ||||||||||||||||||
| Adults (≥20) | 2000-2010 | −3.1a | (−3.4 to −2.7) | 2000-2010 | −0.8a | (−1.4 to −0.3) | 2000-2010 | −1.1a | (−1.5 to −0.6) | 2000-2010 | −2.4a | (−3.5 to −1.3) | 2000-2008 | 0.1 | (−0.2 to 0.5) | 2004-2010 | 2.7a | (0.3 to 5.1) |
| 2008-2010 | −3.1a | (−6.1 −0.1) | ||||||||||||||||
| 20-44 | 2000-2006 | 2.5a | (2.1 to 2.9) | 2000-2010 | 0.1 | (−0.2 to 0.4) | 2000-2004 | −2.0a | (−3.9 to 0.0) | 2000-2008 | 5.4a | (3.2 to 7.7) | 2000-2008 | −0.4 | (−0.9 to 0.1) | 2004-2010 | 3.5a | (0.9 to 6.1) |
| 2006-2010 | 0.4 | (−0.3 to 1.2) | 2004-2010 | −5.9a | (−7.1 to −4.7) | 2008-2010 | −7.0 | (−23.0 to 12.5) | 2008-2010 | −3.5 | (−8.2 to 1.5) | |||||||
| 45-54 | 2000-2008 | 0.7a | (0.5 to 1.0) | 2000-2010 | −0.8a | (−1.3 to −0.4) | 2000-2008 | −0.3 | (−0.7 to 0.2) | 2000-2010 | 1.0 | (−0.2 to 2.2) | 2000-2010 | −0.8a | (−1.2 to −0.4) | 2004-2010 | 2.2a | (0.2 to 4.2) |
| 2008-2010 | −1.7 | (−3.8 to 0.4) | 2008-2010 | −4.3a | (−8.0 to −0.6) | |||||||||||||
| 55-64 | 2000-2007 | −2.7a | (−3.0 to −2.3) | 2000-2004 | −3.7a | (−6.3 to −1.1) | 2000-2006 | −2.5a | (−3.0 to −2.0) | 2000-2010 | −1.1 | (−2.3 to 0.2) | 2000-2004 | 1.1a | (0.1 to 2.1) | 2004-2010 | 1.6 | (−0.4 to 3.7) |
| 2007-2010 | −5.1a | (−6.2 to −4.0) | 2004-2010 | −0.7 | (−2.0 to 0.6) | 2006-2010 | −4.3a | (−5.2 to −3.4) | 2004-2010 | −1.1a | (−1.6 to −0.7) | |||||||
| 65-74 | 2000-2007 | −3.4a | (−3.7 to −3.1) | 2000-2004 | −3.4a | (−5.9 to −0.8) | 2000-2008 | −0.8a | (−1.0 to −0.6) | 2000-2010 | −2.2a | (−3.3 to −1.1) | 2000-2006 | 0.8 | (−0.2 to 1.9) | 2004-2010 | 2.1 | (−0.5 to 4.6) |
| 2007-2010 | −6.2a | (−7.5 to −5.0) | 2004-2010 | 1.4a | (0.1 to 2.8) | 2008-2010 | −4.7a | (−6.3 to −3.1) | 2006-2010 | −1.4 | (−3.3 to 0.4) | |||||||
| ≥75 | 2000-2008 | −3.5a | (−3.8 to −3.1) | 2000-2004 | −2.6a | (−4.4 to −0.7) | 2000-2008 | 1.0a | (0.7 to 1.3) | 2000-2007 | −3.1a | (−4.4 to −1.9) | 2000-2010 | 0.4 | (−0.5 to 1.3) | 2004-2010 | 3.6a | (0.8 to 6.6) |
| 2008-2010 | −7.2a | (−10.3 to −4.1) | 2004-2010 | 0.0 | (−1.0 to 1.0) | 2008-2010 | −3.5a | (−6.1 to −0.8) | 2007-2010 | −10.2a | (−14.9 to −5.2) | |||||||
| Sex | ||||||||||||||||||
| Male | 2000-2008 | −3.0a | (−3.3 to −2.8) | — | — | — | 2000-2008 | −1.4a | (−1.7 to −1.2) | 2000-2010 | −2.4a | (−3.5 to −1.3) | 2000-2008 | 0.0 | (−0.3 to 0.4) | 2004-2010 | 2.8a | (0.7 to 4.9) |
| 2008-2010 | −6.2a | (−8.6 to −3.7) | 2008-2010 | −5.1a | (−7.1 to −3.1) | 2008-2010 | −3.2a | (−6.1 to −0.3) | ||||||||||
| Female | 2000-2008 | −2.4a | (−2.6 to −2.2) | 2000-2004 | −2.5a | (−4.5 to −0.5) | 2000-2008 | 0.3a | (0.1 to 0.6) | — | — | — | 2000-2008 | 0.2 | (−0.3 to 0.8) | 2004-2010 | 2.8a | (0.3 to 5.4) |
| 2008-2010 | −5.7a | (−7.4 to −3.9) | 2004-2010 | 0.1 | (−0.9 to 1.2) | 2008-2010 | −3.7a | (−6.0 to −1.5) | 2008-2010 | −3.1 | (−7.8 to 1.7) | |||||||
| Race/ethnicity | ||||||||||||||||||
| White non-Hispanic | 2000-2008 | −2.9a | (−3.1 to −2.7) | 2000-2004 | −2.7a | (−4.7 to −0.7) | 2000-2008 | −0.4a | (−0.6 to −0.1) | 2000-2010 | −2.7a | (−3.9 to −1.5) | 2000-2008 | 0.4a | (0.1 to 0.8) | 2004-2010 | 2.6a | (0.4 to 4.8) |
| 2008-2010 | −5.9a | (−7.4 to −4.4) | 2004-2010 | 0.1 | (−0.9 to 1.2) | 2008-2010 | −4.3a | (−6.2 to −2.3) | 2008-2010 | −2.7 | (−6.1 to 0.9) | |||||||
| White Hispanic | 2000-2008 | −1.7a | (−2.2 to −1.3) | 2000-2010 | −0.8a | (−1.3 to −0.2) | 2000-2007 | −1.1a | (−1.9 to −0.4) | 2000-2008 | −2.3a | (−3.4 to −1.1) | 2000-2010 | −1.1a | (−1.3 to −0.8) | 2004-2010 | 2.2 | (−1.3 to 5.8) |
| 2008-2010 | −6.9a | (−10.5 to −3.2) | 2007-2010 | −4.0a | (−6.5 to −1.5) | 2008-2010 | −9.2 | (−17.9 to 0.3) | ||||||||||
| Black | 2000-2003 | 0.3a | (−2.5 to 3.2) | 2000-2010 | 0.6a | (0.2 to 1.0) | 2000-2005 | −0.5 | (−1.3 to 0.4) | 2000-2010 | −2.4a | (−3.2 to −1.6) | 2000-2010 | −0.4 | (−1.2 to 0.4) | 2004-2010 | 4.7a | (2.4 to 7.1) |
| 2003-2010 | −3.0a | (−3.7 to −2.3) | 2005-2010 | −2.2a | (−3.0 to −1.4) | |||||||||||||
Abbreviations: 95% CI, 95% confidence interval; —, group was excluded because of low numbers; APC, annual percent change; CBTRUS, Central Brain Tumor Registry of the United States; CNST, central nervous system tumor; USCS, United States Cancer Statistics.
APC was statistically significant at the 0.05 level.
Figure 2.
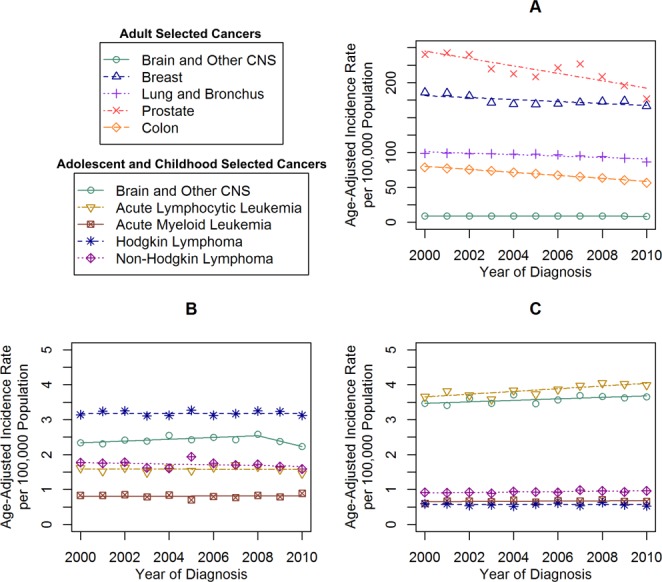
Malignant incidence time trends for selected cancers in (A) adults, (B) adolescents, and (C) children are shown based on the United States Cancer Statistics (USCS) publication for 2000 to 2010 and the Central Brain Tumor Registry of the United States (CBTRUS) for 2000 through 2010. Age-adjusted incidence rates per 100,000 population were plotted annually from 2000 through 2010 for selected common cancers in adults, adolescents, and children. Each time trend is accompanied by its respective Joinpoint trend line(s). CNS, central nervous system.
Figure 3.
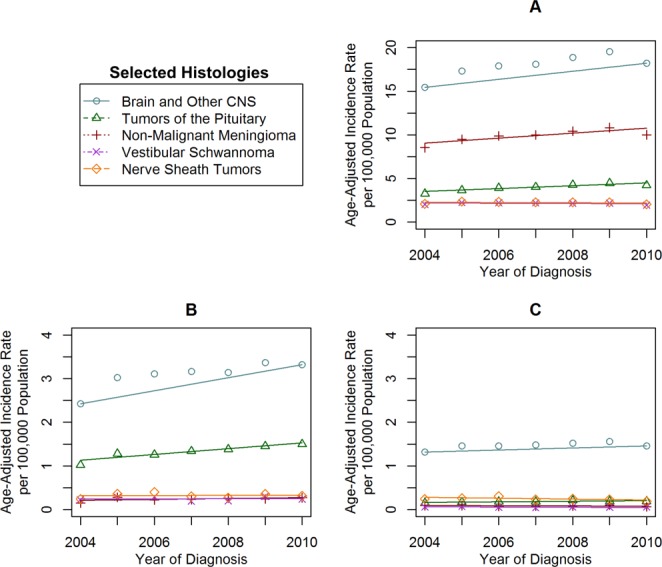
Incidence time trends for selected nonmalignant brain and central nervous system (CNS) histologies are shown in (A) adults, (B) adolescents, and (C) children based on the Central Brain Tumor Registry of the United States (CBTRUS) for 2004 through 2010. Age-adjusted incidence rates per 100,000 population were plotted annually from 2004 through 2010 for selected nonmalignant brain and CNS histologies in adults, adolescents, and children. Each time trend is accompanied by its respective Joinpoint trend line(s).
Among the selected histologies, those with the highest incidence in adolescents between 2000 and 2010 were HL (IR, 3.18 per 100,000 population), MCNST (IR, 2.41 per 100,000 population), and NHL (IR, 1.72 per 100,000 population) (Fig. 1). There were significant increases noted in the IR of MCNST (Table2) (Fig. 2B) and NMCNST (Table2) (Fig. 3B), whereas the other cancers remained stable.
Table 2.
Trends in Selected Cancers in Children (Aged Birth to 14 Years) and Adolescents (Aged 15 to 19 Years) by Age Group, Sex, and Race/Ethnicity: USCS 2000 to 2010 and CBTRUS 2000 to 2010
| Acute Lymphocytic Leukemia | Acute Myeloid Leukemia | Non-Hodgkin Lymphoma | Hodgkin Lymphoma | Malignant CNST | Nonmalignant CNST | |||||||||||||
|---|---|---|---|---|---|---|---|---|---|---|---|---|---|---|---|---|---|---|
| Years | APC | 95% CI | Years | APC | 95% CI | Years | APC | 95% CI | Years | APC | 95% CI | Years | APC | 95% CI | Years | APC | 95% CI | |
| Children (aged birth to 14 y) | 2000-2010 | 1.0a | (0.5 to 1.5) | 2000-2010 | 0.5 | (−0.4 to 1.5) | 2000-2010 | 0.6a | (0.1 to 1.0) | 2000-2010 | −0.1 | (−1.5 to 1.3) | 2000-2010 | 0.6a | (0.0 to 1.1) | 2004-2010 | 1.6 | (−0.3 to 3.6) |
| Birth to 4 y | 2000-2010 | 0.5 | (−0.3 to 1.3) | 2000-2010 | 1.0a | (0.1 to 1.8) | 2000-2010 | 1.9a | (0.0 to 3.8) | — | — | — | 2000-2010 | 0.8 | (−0.1 to 1.8) | 2004-2006 | 12.1 | (−19.5 to 56.1) |
| 2006-2010 | −3.4 | (−12.5 to 6.7) | ||||||||||||||||
| 5-9 y | 2000-2010 | 1.4a | (0.8 to 2.0) | 2000-2010 | −1.0 | (−2.9 to 1.0) | 2000-2010 | 0.5 | (−0.9 to 1.9) | 2000-2010 | 0.4 | (−2.0 to 2.8) | 2000-2010 | 0.5 | (−0.2 to 1.2) | 2004-2010 | −0.5 | (−2.4 to 1.5) |
| 10-14 y | 2000-2010 | 1.9a | (0.5 to 3.3) | 2000-2010 | 0.5 | (−1.8 to 2.8) | 2000-2010 | 0.0 | (−1.8 to 1.8) | 2000-2010 | −0.3 | (−1.6 to 1.0) | 2000-2010 | 0.3 | (−0.4 to 1.0) | 2004-2010 | 3.9a | (0.4 to 7.5) |
| Sex | ||||||||||||||||||
| Male | 2000-2010 | 1.3a | (0.8 to 1.7) | 2000-2010 | −0.7 | (−2.7 to 1.3) | 2000-2010 | 0.6a | (0.1 to 1.1) | 2000-2010 | −0.2 | (−1.7 to 1.3) | 2000-2010 | 0.3 | (−0.5 to 1.2) | 2004-2010 | 1.8 | (−0.9 to 4.7) |
| Female | 2000-2010 | 0.8 | (−0.1 to 1.7) | 2000-2010 | 1.6 | (−0.1 to 3.2) | 2000-2010 | 0.3 | (−0.8 to 1.5) | 2000-2010 | 0.1 | (−1.8 to 2.0) | 2000-2010 | 0.8a | (0.2 to 1.5) | 2004-2007 | 4.2 | (−1.3 to 9.9) |
| 2007-2010 | −1.2 | (−6.1 to 3.9) | ||||||||||||||||
| Race/ethnicity | ||||||||||||||||||
| White non-Hispanic | 2000-2010 | 0.7a | (0.1 to 1.4) | 2000-2010 | −0.3 | (−1.2 to 0.7) | 2000-2010 | 0.3 | (−0.2 to 0.9) | 2000-2010 | −0.5 | (−2.0 to 1.0) | 2000-2010 | 0.8a | (0.1 to 1.5) | 2004-2010 | 2.0a | (0.4 to 3.7) |
| White Hispanic | 2000-2010 | 0.9 | (−0.1 to 1.9) | 2000-2010 | 1.9 | (−0.5 to 4.3) | 2000-2010 | −0.6 | (−2.7 to 1.5) | 2000-2010 | −0.3 | (−2.8 to 2.2) | 2000-2010 | −0.5 | (−1.4 to 0.5) | 2004-2010 | 0.3 | (−4.9 to 5.8) |
| Black | 2000-2010 | 2.3a | (0.6 to 4.0) | 2000-2010 | −0.4 | (−5.5 to 5.0) | 2000-2010 | 2.4a | (0.1 to 4.7) | 2000-2010 | 2.5 | (−1.0 to 6.0) | 2000-2010 | 1.7a | (0.3 to 3.1) | 2004-2010 | 0.1 | (−3.4 to 3.7) |
| Adolescents (15-19 y) | 2000-2010 | −0.1 | (−1.1 to 1.0) | 2000-2010 | 0.2 | (−1.2 to 1.6) | 2000-2010 | −0.6 | (−1.8 to 0.7) | 2000-2010 | 0.0 | (−0.5 to 0.5) | 2000-2008 | 1.0a | (0.0 to 2.1) | 2004-2010 | 3.9a | (0.7 to 7.2) |
| 2008-2010 | −6.3 | (−14.2 to 2.2) | ||||||||||||||||
| Sex | ||||||||||||||||||
| Male | 2000-2010 | 0.6 | (−0.9 to 2.0) | 2000-2010 | −0.7 | (−3.1 to 1.8) | 2000-2010 | −0.1 | (−1.4 to 1.1) | 2000-2010 | 0.3 | (−0.5 to 1.2) | 2000-2008 | 1.4a | (0.2 to 2.6) | 2004-2010 | 3.0 | (−1.9 to 8.2) |
| 2008-2010 | −4.3 | (−13.7 to 6.2) | ||||||||||||||||
| Female | 2000-2010 | −1.2 | (−4.4 to 2.1) | 2000-2002 | −15.0a | (−27.6 to −0.2) | 2000-2010 | −1.5 | (−3.3 to 0.4) | 2000-2010 | −0.4 | (−1.1 to 0.4) | 2000-2010 | −0.6 | (−2.4 to 1.1) | 2004-2010 | 4.5a | (0.6 to 8.5) |
| 2002-2010 | 3.2a | (1.4 to 5.1) | ||||||||||||||||
| Race/ethnicity | ||||||||||||||||||
| White non-Hispanic | 2000-2010 | −1.4a | (−2.5 to −0.3) | 2000-2010 | 0.1 | (−2.2 to 2.5) | 2000-2010 | 0.0 | (−1.5 to 1.6) | 2000-2010 | 0.2 | (−0.6 to 0.9) | 2000-2008 | 1.7a | (0.5 to 2.9) | 2004-2010 | 4.8a | (0.8 to 8.9) |
| 2008-2010 | −7.0 | (−16.8 to 4.0) | ||||||||||||||||
| White Hispanic | 2000-2010 | 2.0 | (−0.5 to 4.7) | 2000-2010 | −1.1 | (−4.3 to 2.3) | 2000-2010 | −3.4 | (−8.4 to 1.8) | 2000-2010 | −0.4 | (−2.0 to 1.2) | 2000-2010 | −2.1 | (−4.5 to 0.3) | 2004-2010 | 1.0 | (−5.7 to 8.3) |
| Black | 2000-2010 | −0.5 | (−4.7 to 3.8) | — | — | — | 2000-2010 | 0.4 | (−4.0 to 5.0) | 2000-2010 | 1.1 | (−1.6 to 3.9) | 2000-2010 | 1.9 | (−0.3 to 4.2) | 2004-2010 | 6.0a | (1.0 to 11.2) |
Abbreviations: 95% CI, 95% confidence interval; —, group was excluded because of low numbers; APC, annual percent change; CBTRUS, Central Brain Tumor Registry of the United States; CNST, central nervous system tumor; USCS, United States Cancer Statistics.
APC was statistically significant at the 0.05 level
Among the selected histologies, those with the highest incidence in children between 2000 and 2010 were ALL (IR, 3.84 per 100,000 population), MCNST (IR, 3.57 per 100,000 population), and NHL (IR, 0.93 per 100,000 population) (Fig. 1). There were significant increases in the IR of ALL, NHL, and MCNST, whereas the IR of the other cancers remained stable (Table2) (Fig. 2C). There were no significant increases or decreases noted in NMCNST (Table2) (Fig. 3C).
Incidence Trends by Age Groups
For individuals aged 20 to 44 years, the IR of colon and rectal cancer (2000-2006: APC, 2.5), prostate cancer (2000-2008: APC, 5.4), and NMCNST (2004-2010: APC, 2.7) significantly increased, whereas that of lung and bronchus cancer (2000-2004: APC, −2.0; and 2004-2010: APC, −5.9) significantly decreased (Table1). For those adults aged 45 to 54 years, colon cancer (2000-2008: APC, 0.7) and NMCNST (2004-2010: APC, 2.2) increased significantly, whereas breast cancer, lung and bronchus cancer, and MCNST significantly decreased. Colon, breast, and lung cancer decreased significantly among those aged 55 to 64 years. MCNST increased significantly from 2000 through 2004 (APC, 1.1) but then decreased significantly from 2004 through 2010 (APC, −1.1) in this age group. For adults aged 65 to 74 years, IR for all 4 common cancers also decreased significantly. For adults aged ≥75 years, colon (2000-2008: APC, −3.5 and 2008-2010: APC, −7.2), breast (2000-2004: APC, −2.6), and prostate cancer (2000-2007: APC, −3.1 and 2007-2010: APC, −10.2) decreased significantly, whereas NMCNST (2004-2010: APC, 3.6) increased significantly.
For adolescents (those aged 15-19 years), the IR of MCNST and NMCNST increased significantly (Table2). The incidence of AML (2000-2010: APC, 1.0) and NHL (2000-2010: APC, 1.9) increased significantly in children aged ≤4 years. For children aged 5 to 9 years, the IR for ALL increased significantly (2000-2010: APC, 1.4) whereas all other IR remained stable. Only the incidence of NMCNST increased significantly in children ages 10 to 14 years.
Incidence Trends by Sex
Incidence trends in adults varied significantly by sex (Table1). The incidence of colon and lung/bronchus cancer decreased significantly in both men and women, although the magnitude of the decrease was found to be larger in men. The incidence of MCNST decreased significantly in men (2008-2010: APC, −3.2) but remained stable in women. The incidence of NMCNST increased significantly in both men and women (2004-2010: APC for men, 2.8; APC for women, 2.8).
Incidence trends for adolescents also varied by sex. AML decreased significantly for females but not for males (2000-2002: APC, −15.0 and 2002-2010: APC, −3.2) (Table2). MCNST increased significantly in males only (2000-2008: APC, 1.4). NMCNST increased significantly in females only (2004-2010: APC, 4.5). Male children experienced increases in ALL (2000-2010: APC, 1.3) and NHL (2000-2010: APC, 0.6), whereas MCNST was found to increase significantly in females only (2000-2010: APC, 0.8).
Incidence Trends by Race/Ethnicity
The incidence of colon, lung/bronchus, and prostate cancer decreased for all race/ethnicity groups. Breast cancer decreased significantly in white non-Hispanics and white Hispanics, but increased in blacks (2000-2010: APC, 0.6). In adults, MCNST increased significantly in white non-Hispanics (2000-2008: APC, 0.4), decreased significantly in white Hispanics (2000-2010: APC, −1.1), and remained stable in blacks. Adult NMCNST increased significantly in white non-Hispanics (2004-2010: APC, 2.6) and blacks (2004-2010: APC, 4.7), but was not significantly increased in white Hispanics.
Incidence trends in adolescents varied significantly by race/ethnicity. White non-Hispanics had a significant decrease in the IR of ALL (2000-2010: APC, −1.4), MCNST (2000-2008: APC, 1.7), and NMCNST (2004-2010: APC, 4.8) (Table2). Black adolescents had significant increases in the IR of NMCNST (2004-2010: APC, 6.0). No other significant changes in cancer incidence were found for this age group across race/ethnicity.
The IR of ALL increased significantly in black (2000-2010: APC, 2.3) and white non-Hispanic (2000-2010: APC, 0.7) children, but remained stable in white Hispanic children (Table2). NHL also increased significantly in black children (2000-2010: APC, 2.4). MCNST increased significantly in white non-Hispanics (2000-2010: APC, 0.8) and blacks (2000-2010: APC, 1.7), and NMCNST increased significantly in white non-Hispanics (2004-2010: APC, 2.0). No other significant changes in cancer incidence were found for this age group across race/ethnicity.
Incidence Trends in Specific CNST Histologies
The most common MCNST histology in adults was glioblastoma (IR, 4.37 per 100,000 population) (Fig. 1). There were significant decreases in anaplastic astrocytoma (2000-2010: APC, −1.6), all other astrocytomas (2000-2010: APC, −1.2), oligodendroglioma (2000-2005: APC, −4.9 and 2005-2010: APC, −2.3), and malignant meningioma (2000-2007: APC, −3.6 and 2007-2010: APC, −14.4) (see online supporting information). There were significant increases in glioblastoma (2000-2007: APC, 0.9), ependymal tumors (2000-2010: APC, 2.1), and oligoastrocytic tumors (2000-2010: APC, 2.6) (Fig. 3A). Low-grade glioma was the most common MCNST noted in adolescents (IR, 0.46 per 100,000 population), and embryonal tumors were most common in children (IR, 0.78 per 100,000 population) (Fig. 1). All MCNST histologies remained stable in adolescents (Fig. 3B) and children (Fig. 3C) from 2000 through 2010 (see online supporting information). There were significant increases noted in nonmalignant meningioma (2004-2010: APC, 3.0) and tumors of the pituitary in adults (2004-2010: APC, 4.2) (Fig. 4A). There was a significant increase in the IR of tumors of the pituitary in adolescents (2004-2010: APC, 5.2) (Fig. 4B), but the IR in children were stable for the entire period (Fig. 4C).
Figure 4.
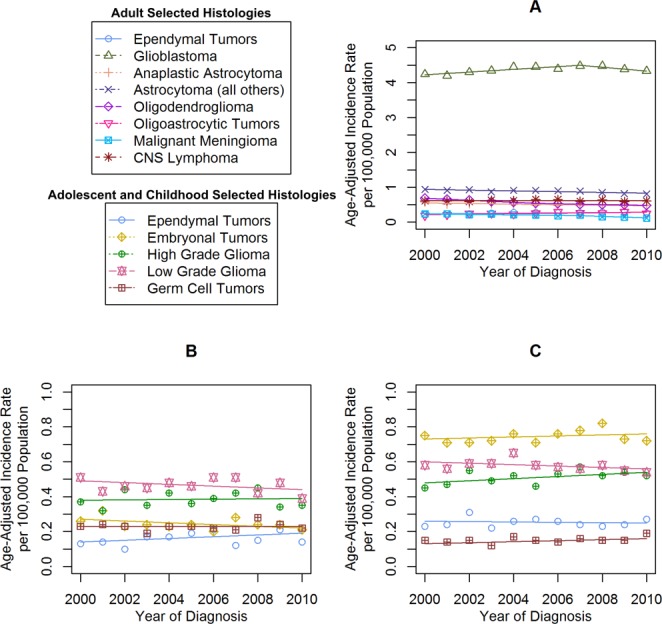
Incidence time trends for selected malignant brain and central nervous system (CNS) histologies are shown in (A) adults, (B) adolescents, and (C) children based on the Central Brain Tumor Registry of the United States (CBTRUS) for 2000 through 2010. Age-adjusted incidence rates per 100,000 population were plotted annually from 2000 through 2010 for selected malignant brain and CNS histologies in adults, adolescents, and children. Each time trend is accompanied by its respective Joinpoint trend line(s).
DISCUSSION
Incidence Trends in Adult Cancers
The 4 most common types of cancer diagnosed in the United States from 2000 through 2010 were prostate (14.8% of new cases among individuals aged ≥20 years from 2000-2010), lung and bronchus (14.4%), breast (14.2%), and colorectal cancer (10.3%).6 In comparison, CNST comprised approximately 1.2% of new cancer cases within the same period. Although there were significant changes in cancer incidence noted between 2000 and 2010, there was significant heterogeneity in these trends based on tumor site, histology, and demographic factors. Many of the common cancers in adults experienced significant declines, whereas the magnitude of changes in the incidence of CNST was generally small.
Overall, IR of cancer in the United States are decreasing; an analysis of the North American Association of Central Cancer Registries data set (which covers approximately 100% of the US population) found an overall APC of −0.4% between 2006 and 2010 (P<0.05).1 This decline was driven mostly by decreases in the incidence of colorectal, prostate, and lung cancer.4 Although these broader trends can be interpreted as a sign of success in cancer prevention programs, they can also obscure the potential burden caused by rarer cancers. Changes in incidence trends of CNST overall and by specific subtypes were present when analyzing data from 2000 through 2010, although significant trends were generally not present over the entire time period examined. At the end of the time period examined, there were significant decreases observed in the CNST incidence overall, as well as in the incidence of gliomas and malignant meningioma. There were significant increases in the incidence of NMCNST overall. Several recent analyses have attempted to determine whether there have been significant changes in the incidence of CNST. Some of these have worked to assess trends that may be associated with the popularization of cellular telephones.9,10 These analyses have compared IR time trends with incidence projections based on risk estimates derived from case-control studies of cellular telephone use and CNST; however, neither of these studies found a significant increase in the incidence of glioma.11,12 An analysis of Israeli cancer registry data demonstrated a significant decrease in low-grade glioma (WHO grade 2) and a significant increase in high-grade glioma (WHO grade 3-4) from 1980 through 2009.13
Time trends in CNST incidence appear to be similar in the United States, Australia, and England. Other analyses of CNST trends have also found negative trends. A SEER-based analysis found small but statistically significant decreases in the incidence of all CNST in both men (APC, −0.6) and women (APC, −0.2) from 1992 through 2007.10 Another analysis found no significant change in the incidence of glioma or astrocytoma from 1992 through 2007, but did find a small but statistically significant increase in high-grade glioma (APC, 0.64) and a significant decrease in low-grade glioma (APC, −3.02).12 An analysis of the English cancer registry data found no significant increase in the incidence of CNST from 1998 through 2007.12 An analysis of CNST cases collected from one state and one territory in Australia from 2000 through 2008 found a significant increase in the incidence of glioblastoma (APC, 2.5), and a significant decrease in the incidence of vestibular schwannoma (APC, −3.5).14 Taken together, these studies do not provide consistent evidence of an increase in the incidence over time for CNST.
Incidence Trends in Childhood Cancers
US cancer incidence for individuals aged <20 years has increased slightly since 1975 (APC, 0.6).2 Analyses of childhood cancer incidence in other countries have demonstrated similar increases in Australia and Europe.15,16 We found a significant increase in the incidence of ALL, NHL, and MCNST in children from 2000 through 2010, but no significant change in incidence was noted for AML, HL, or NMCNST. A recent analysis of the SEER 9 registries from 1973 to 200917 found a much larger increase in childhood brain tumor IR overall between 1983 and 1986 for children aged birth to 14 years, and a nonsignificant increase between 1987 and 2009. This analysis also found an increase in the incidence of gliomas across the entire period examined.
Because the incidence of CNST peaks among young children (those aged <5 years) and then again in the fifth to seventh decades of life,3 CNST among adolescents and young adults is rarely examined. The incidence of MCNST and NMCNST increased in adolescents, but there were no significant changes in the incidence of lymphoma or leukemia noted from 2000 through 2010. The rarity of cancer in this age group may make it difficult to detect statistically significant differences over time. An analysis of data collected using the Automated Childhood Cancer Information System (ACCIS) found significant increases in CNST among adolescents aged 15 to 19 years (APC, 1.4; P<0.0001) between 1970 and 1999, but it is difficult to assess whether these increases may have been influenced by the popularization of new imaging technology during this time.18
Incidence Trends in NMCNST
Reporting of NMCNST became mandatory in 2004 with the passage of the Benign Brain Tumor Cancer Registries Amendment Act, although several state registries had collected these data both actively and passively before the mandate.5 Due to the short period that NMCNST reporting has been mandated, it is difficult to determine whether apparent increases in these tumor types are due to improvements in case ascertainment over time. A previous CBTRUS analysis examined NMCNST cases collected from 1997 through 2008 from 11 population-based cancer registries5 and found a significant increase in incidence from 1997 through 2002 (APC, 7.0) and from 2002 through 2004 (APC, 12.2), but no significant change in IR was noted from 2005 through 2008. In addition, a recent study of Nordic cancer registry data also found a significant increase in the incidence of meningioma in women from 1990 through 2003 and in men from 1974 through 2003.11
Effect of Potential Bias on Incidence Trends
When examining cancer incidence trends, it is important to take into account other factors that can obscure incidence. The incidence of female breast and prostate cancer has previously been shown to be significantly affected by screening bias,19,20 and changes in the screening recommendations for these 2 cancers may be related to the decline in their IR.21 Previous reports documented a dramatic increase in CNST incidence in the 1970s and 1980s,22,23 which has been attributed to improvements in diagnostic imaging techniques such as magnetic resonance imaging and computed tomography. The majority of analyses that examined diagnoses made since the early 1980s (when computed tomography became widely available) and the early 1990s (when magnetic resonance imaging became widely available) have found no significant increases in CNST incidence over time.14,22
Previous analyses have examined the incidence of CNST in the US population.23 However, significant differences exist between CNST histologies, making the examination of individual tumor types important. In particular, the diagnosis of oligodendroglioma is somewhat subjective and thus varies significantly between pathologists. Hence, the incidence of oligodendroglioma and oligoastrocytoma (mixed glioma) also can vary considerably,24,25 as shown in the current study. The changes over time in the incidence of these 2 glioma subtypes likely reflect the increased use by pathologists of molecular markers to supplement morphological data to yield more precise and objective diagnoses among these tumor subtypes (eg, chromosomal loss at 1p and/or 19q).26–28 CBTRUS represents approximately 98% of all brain tumor diagnoses in the United States and distinguishes between CNST histologies. The current study analyzed incident cancer cases from 2000 through 2010, a time period during which diagnostic imaging technology was widely established and universally available for all cancers and during which time pathological diagnosis became increasingly supplemented by molecular information in an attempt to improve the precision and objectivity of the histopathological diagnosis of specific subtypes of CNST and other cancers.
Conclusions
The incidence of the most common cancers in adults decreased between 2000 and 2010, as did the incidence of MCNST. However, the incidence of NMCNST increased significantly. In comparison, adolescents had increasing rates of MCNST and NMCNST, and children had increasing rates of AML, NHL, and MCNST. Cancer in adolescents, especially CNST, is an understudied topic and deserves further individual examination to characterize the burden of CNST on adolescents and young adults in the United States. Surveillance of cancer incidence trends is an important measure of the changing public health and economic burden of cancer in the United States, as well as a tool with which to assess the success of cancer prevention programs. It is important to assess rare cancer types separately and compare their incidence with that of other common cancers.
FUNDING SUPPORT
The following organizations contributed to the maintenance of the CBTRUS database in 2014: the Centers for Disease Control and Prevention (CDC) under Agreement 5U58DP00383, The Sontag Foundation (www.sontagfoundation.org), the Pediatric Brain Tumor Foundation (www.curethekids.org), along with the Musella Foundation (www.virtualtrials.com), Novocure, Inc. (www.novocure.com), Voices Against Brain Cancer (www.voicesagainstbraincancer.org), as well as private and in kind donations. Contents are solely the responsibility of the authors and do not necessarily represent the official views of the CDC.
CONFLICT OF INTEREST DISCLOSURES
Dr. de Blank was supported by a National Institutes of Health/National Cancer Institute grant (CA076917-15), the Dana Foundation David Mahoney Neuroimaging grant, and a grant from NTAP (Francis S. Collins Scholars Program in Neurofibromatosis) for work performed as part of the current study. Dr. Selman holds stock options in Surgical Theater LLC and Osteoplastics LLC.
Supporting Information
Additional Supporting Information may be found in the online version of this article.
Supplementary Information Table 1.
Supplementary Information Table 2.
REFERENCES
- Siegel R, Ma J, Zou Z, Jemal A. Cancer statistics, 2014. CA Cancer J Clin. 2014;64:9–29. doi: 10.3322/caac.21208. [DOI] [PubMed] [Google Scholar]
- Ward E, Esantis C, Robbins A, Kohler B, Jemal A. Childhood and adolescent cancer statistics, 2014. CA Cancer J Clin. 2014;64:83–103. doi: 10.3322/caac.21219. [DOI] [PubMed] [Google Scholar]
- Ostrom QT, Gittleman H, Farah P. CBTRUS statistical report: primary brain and central nervous system tumors diagnosed in the United States in 2006-2010. Neuro Oncol. 2013;15(suppl 2):ii1–ii56. doi: 10.1093/neuonc/not151. [DOI] [PMC free article] [PubMed] [Google Scholar]
- Howlader N, Noone AM, Krapcho M. SEER Cancer Statistics Review, 1975-2010. Bethesda, MD: National Cancer Institute; 2013. [Google Scholar]
- McCarthy BJ, Kruchko C, Dolecek TA. The impact of the Benign Brain Tumor Cancer Registries Amendment Act (Public Law 107-260) on non-malignant brain and central nervous system tumor incidence trends. J Registry Manag. 2013;40:32–35. [PubMed] [Google Scholar]
- Centers for Disease Control and Prevention (CDC) 2014. United States Cancer Statistics: 1999-2010 Incidence, WONDER Online Database. wonder.cdc.gov/cancer-v2010.html. Accessed May 30.
- National Cancer Institute. 2014. Joinpoint Regression Program, Version 4.1.0. Bethesda, MD: Statistical Methodology and Applications Branch, Surveillance Research Program, National Cancer Institute.
- Louis DN, Ohgaki H, Wiestler OD, Cavanee WK. WHO Classification of Tumours of the Central Nervous System. Lyon, France: International Agency for Research on Cancer; 2007. [Google Scholar]
- Baan R, Grosse Y, Lauby-Secretan B. Carcinogenicity of radiofrequency electromagnetic fields. Lancet Oncol. 2011;12:624–626. doi: 10.1016/s1470-2045(11)70147-4. [DOI] [PubMed] [Google Scholar]
- Ostrom QT, Bauchet L, Davis F. The epidemiology of glioma in adults: a “state of the science” review. Neuro Oncol. doi: 10.1093/neuonc/nou087. published online ahead of print May 19, 2014. [DOI] [PMC free article] [PubMed] [Google Scholar]
- Deltour I, Auvinen A, Feychting M. Mobile phone use and incidence of glioma in the Nordic countries 1979-2008: consistency check. Epidemiology. 2012;23:301–307. doi: 10.1097/EDE.0b013e3182448295. [DOI] [PubMed] [Google Scholar]
- Little MP, Rajaraman P, Curtis RE. Mobile phone use and glioma risk: comparison of epidemiological study results with incidence trends in the United States. BMJ. 2012;344:e1147. doi: 10.1136/bmj.e1147. [DOI] [PMC free article] [PubMed] [Google Scholar]
- Barchana M, Margaliot M, Liphshitz I. Changes in brain glioma incidence and laterality correlates with use of mobile phones–a nationwide population based study in Israel. Asian Pac J Cancer Prev. 2012;13:5857–5863. doi: 10.7314/apjcp.2012.13.11.5857. [DOI] [PubMed] [Google Scholar]
- Dobes M, Khurana VG, Shadbolt B. Increasing incidence of glioblastoma multiforme and meningioma, and decreasing incidence of Schwannoma (2000-2008): findings of a multicenter Australian study. Surg Neurol Int. 2011;2:176. doi: 10.4103/2152-7806.90696. [DOI] [PMC free article] [PubMed] [Google Scholar]
- Baade PD, Youlden DR, Valery PC. Trends in incidence of childhood cancer in Australia, 1983-2006. Br J Cancer. 2010;102:620–626. doi: 10.1038/sj.bjc.6605503. [DOI] [PMC free article] [PubMed] [Google Scholar]
- Kaatsch P, Steliarova-Foucher E, Crocetti E, Magnani C, Spix C, Zambon P. Time trends of cancer incidence in European children (1978-1997): report from the Automated Childhood Cancer Information System project. Eur J Cancer. 2006;42:1961–1971. doi: 10.1016/j.ejca.2006.05.014. [DOI] [PubMed] [Google Scholar]
- McKean-Cowdin R, Razavi P, Barrington-Trimis J. Trends in childhood brain tumor incidence, 1973-2009. J Neurooncol. 2013;115:153–160. doi: 10.1007/s11060-013-1212-5. [DOI] [PMC free article] [PubMed] [Google Scholar]
- Steliarova-Foucher E, Stiller C, Kaatsch P. Geographical patterns and time trends of cancer incidence and survival among children and adolescents in Europe since the 1970s (the ACCIS project): an epidemiological study. Lancet. 2004;364:2097–2105. doi: 10.1016/S0140-6736(04)17550-8. [DOI] [PubMed] [Google Scholar]
- Independent UK Panel on Breast Cancer Screening. The benefits and harms of breast cancer screening: an independent review. Lancet. 2012;380:1778–1786. doi: 10.1016/S0140-6736(12)61611-0. http://www.ncbi.nlm.nih.gov/pubmed?term= Independent%20UK%20Panel%20on%20Breast%20Cancer%20 Screening%5BCorporate%20Author%5D. [DOI] [PubMed] [Google Scholar]
- Brawley OW. Prostate cancer screening: biases and the need for consensus. J Natl Cancer Inst. 2013;105:1522–1524. doi: 10.1093/jnci/djt266. [DOI] [PubMed] [Google Scholar]
- DeSantis C, Siegel R, Bandi P, Jemal A. Breast cancer statistics, 2011. CA Cancer J Clin. 2011;61:409–418. doi: 10.3322/caac.20134. [DOI] [PubMed] [Google Scholar]
- Legler JM, Ries LA, Smith MA. Cancer surveillance series [corrected]: brain and other central nervous system cancers: recent trends in incidence and mortality. J Natl Cancer Inst. 1999;91:1382–1390. doi: 10.1093/jnci/91.16.1382. [DOI] [PubMed] [Google Scholar]
- Kohler BA, Ward E, McCarthy BJ. Annual report to the nation on the status of cancer, 1975-2007, featuring tumors of the brain and other nervous system. J Natl Cancer Inst. 2011;103:714–736. doi: 10.1093/jnci/djr077. [DOI] [PMC free article] [PubMed] [Google Scholar]
- McCarthy BJ, Propp JM, Davis FG, Burger PC. Time trends in oligodendroglial and astrocytic tumor incidence. Neuroepidemiology. 2008;30:34–44. doi: 10.1159/000115440. [DOI] [PubMed] [Google Scholar]
- Coons SW, Johnson PC, Scheithauer BW, Yates AJ, Pearl DK. Improving diagnostic accuracy and interobserver concordance in the classification and grading of primary gliomas. Cancer. 1997;79:1381–1393. doi: 10.1002/(sici)1097-0142(19970401)79:7<1381::aid-cncr16>3.0.co;2-w. [DOI] [PubMed] [Google Scholar]
- Cairncross JG, Ueki K, Zlatescu MC. Specific genetic predictors of chemotherapeutic response and survival in patients with anaplastic oligodendrogliomas. J Natl Cancer Inst. 1998;90:1473–1479. doi: 10.1093/jnci/90.19.1473. [DOI] [PubMed] [Google Scholar]
- Huse JT, Aldape KD. The molecular landscape of diffuse glioma and prospects for biomarker development. Expert Opin Med Diagn. 2013;7:573–587. doi: 10.1517/17530059.2013.846321. [DOI] [PubMed] [Google Scholar]
- Weller M, van den Bent M, Hopkins K for the European Association for Neuro-Oncology (EANO) Task Force on Malignant Glioma. EANO guideline for the diagnosis and treatment of anaplastic gliomas and glioblastoma. Lancet Oncol. 2014;15:e395–403. doi: 10.1016/S1470-2045(14)70011-7. [DOI] [PubMed] [Google Scholar]
Associated Data
This section collects any data citations, data availability statements, or supplementary materials included in this article.
Supplementary Materials
Supplementary Information Table 1.
Supplementary Information Table 2.