Figure 6.
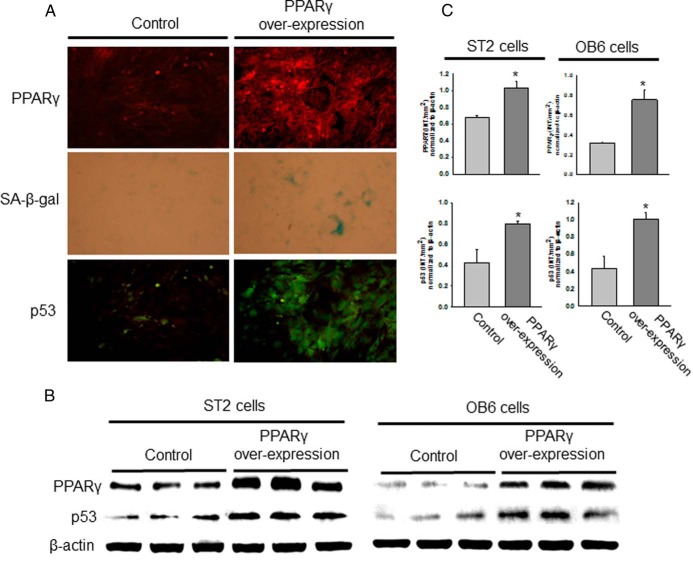
PPARγ stimulates osteoblastic cell senescence. A, ST2 cells were transfected with a PPARγ overexpression construct or a control vector, and after 48 hours, PPARγ and p53 antibody immunostaining and SA-β-gal staining was performed. Blue cells represent positive senescent cells. PPARγ is shown in red and p53 expression in green. B, OB6 and ST2 cells were transfected with a PPARγ overexpression construct or a control vector, and after 48 hours, Western blots were performed for PPARγ and p53 expression. β-Actin expression was used as a control. C, The bar graphs represent the ratio of intensity of the band of PPARγ and p53 protein expression normalization to β-actin protein for 3 samples each from control and PPARγ overexpressed cells using Quantity One software (Bio-Rad). *, P < .05, control vs PPARγ overexpressed cells.

