Abstract
Prolamins from grains have attracted intensive attention in recent years due to their potential in satisfying the demand for environmentally friendly (biodegradable), abundantly available (sustainable), and cost-effective biomaterials. However, for kafirin, the prolamin from sorghum, its composition, structure, morphology, and self-assembly behaviors have not been fully characterized. In this paper, kafirin was extracted from the whole sorghum grain and found to contain 68, 14, 6, and 12% of α-, β-, and γ-fractions and cross-linked kafirin, respectively. Freeze-dried kafirin contained ∼49% α-helix in the solid state. When dissolved in 65% (v/v) isopropanol, 60% (v/v) tert-butanol, and 85% (v/v) ethanol aqueous solvents, the relative α-helix content in kafirin increased with the decrease of solvent polarity. Structural analysis using small-angle X-ray scattering (SAXS) indicated that kafirin (2 mg/mL) took stretched and extended conformations with dimensions of 118 × 15 × 15 and 100 × 11 × 11 Å in 60% tert-butanol and 65% isopropanol, respectively. More elongated conformation of individual kafirin with high-order assembly was observed in 85% ethanol. Protein aggregation occurred as protein concentration increased in its good solvent. The morphology of kafirin assemblies captured by atomic force microscopy (AFM) revealed that kafirin protein took uniform particle morphology at low concentration, and disk-like or rod-like structures resulting from solvent evaporation induced particle interactions emerged at high concentrations. These results suggest that both protein concentration and solvent polarity can effectively regulate kafirin assemblies from thick rod-like to slim rod-like structures, a convenient way to tune the fibrillation of prolamin-based biomaterials.
Keywords: kafirin, SDS-PAGE, secondary structure, morphology, self-assembly, SAXS
Introduction
Growing research interest in protein-based biomaterials has been stimulated by the demand for alternatives to traditional synthetic polymers that have expanded functional properties to accommodate a broader spectrum of applications.1 Among various protein candidates, zein, the prolamin protein in maize, has received increasing research attention.2,3 The composition, structure, dissolution, and gelation behavior of zein have been extensively studied.4−7 Due to its unique properties, such as its solubility in aqueous alcohol, highly hydrophobic and nonallergenic nature, excellent oxygen barrier property, reduced susceptibility to proteolytic degradation, and ability to withstand gastric pH, zein is considered superior to other proteins, especially in the food packaging and drug delivery applications. Currently, research projects intended to explore its applications in tissue scaffolding, active ingredient encapsulation, and drug delivery are in full swing.8−10
Kafirin, the sorghum prolamin protein, resembles zein in its solubility, molecular weight, amino acid composition, and structure of polypeptides.11,12 Compared to zein, kafirin is relatively more hydrophobic and less digestible,13,14 which enables more stable films with superior gas and water vapor barrier characteristics. It is a more effective encapsulation vehicle with stronger protective function.15 Therefore, kafirin has the potential to be an alternative to zein in biomaterial applications. Nevertheless, the effort to fulfill its potential is still seriously lacking. Of all the available research papers, only a few report kafirin’s satisfying performance in film casting application.16−19
Many factors, such as protein composition, purity, concentration, secondary and tertiary structures, morphology, and self-assembly behavior, are known to affect the processing performance and functional properties of protein-based biomaterials.20 To develop biomaterials from kafirin, it is necessary to understand the physical properties of kafirin in the first place. Although extraction methods and digestibility of kafirin received adequate research attentions, a clear view of the secondary structure, morphology, and self-assembly phenomena of kafirin and their relationship with processing properties is still absent.
In this presented work, we carried out a detailed investigation of kafirin on its composition, structure, morphology, and self-assembly behavior. The components of kafirin extracted from sorghum grain using 60% tert-butanol were identified on the basis of sodium dodecyl sulfate–polyacrylamide gel electrophoresis (SDS-PAGE). The secondary structure was characterized using Fourier transform infrared (FTIR) and circular dichroism (CD) in solid and liquid states. The morphology and self-assembly behavior of kafirin in different alcohol solutions were studied by synchrotron small-angle X-ray scattering (SAXS) and atomic force microscopy (AFM). Key parameters affecting kafirin structure based on these measurements were obtained, and the results are very relevant in guiding future investigation of kafirin-based biomaterials with designed quality.
Materials and Methods
Materials
Whole food-grade retail sorghum grain (Sorghum bicolor Moench) was purchased from Northern Food Inc. (Hicksville, NY, USA). Commercial zein (260-01283) was purchased from Wako Pure Chemical Industries, Ltd. (New York, NY, USA). Tris-alkali, sodium dodecyl sulfate (SDS), N,N,N′,N′-tetramethylethylenediamine (TEMED), 2-mercaptoethanol (2-ME), bromophenol blue, Coomassie brilliant blue G-250, and prestained protein markers (broad range protein maker) were purchased from Bio-Rad Laboratories, Inc. (Hercules, CA, USA). Milli-Q water was used throughout the experiments.
Preparation of Kafirin by Ultrasound-Assisted tert-Butanol Extraction
Whole sorghum grain was milled to 40 mesh, and lipid was first removed from milled grain with n-hexane. The defatted flour was then extracted at room temperature with water followed by 0.5 M NaCl (the ratio of raw material to extract solution is 1:10) three times each (1 h each). At the end of each extraction cycle, the dispersion was centrifuged at 8000 rpm for 10 min and the supernatant was discarded to fully separate out the albumin and globulin proteins. The residue was then washed with distilled water three times in a similar way to remove salt. The remnants were then extracted by using 60% tert-butanol twice for 2 h each and 10 min of ultrasonication using an FS-28 solid-state ultrasonicator (bath type with sonic power, 225 W; sweep frequency, 40 kHz) (Fisher Scientific, Pittsburgh, PA, USA) at the interval of 30 min. The extract fraction was then centrifuged at 8000 rpm for 15 min, and the supernatant was then freeze-dried directly. Because the first extraction fraction contains pink color due to the coextraction of alcohol-soluble impurities, only the second extraction fraction was kept for further analysis. The second extract fraction powder has a white color, and the protein content was determined as 87% by combustion method with a nitrogen analyzer (FP-428, Leco Corp., St. Joseph, MI, USA) calibrated with analytical reagent grade EDTA (a factor of 6.25 was used to convert the nitrogen to protein).
Sodium Dodecyl Sulfate–Polyacrylamide Gel Electrophoresis (SDS-PAGE)
Three milligrams of protein was denatured and reduced by heating samples at 95 °C for 5 min in 1 mL of loading buffer containing 0.01 mol/L Tris-HCl buffer (pH 6.8), 2% (w/v) SDS, 10%(v/v) glycerol, and 5% (v/v) β-mercaptoethanol (2-ME). The prestained protein marker (molecular weights ranging from 6.5 to 110.3 kDa) was used. Commercial zein was run under reducing condition as a control. Each sample solution (10 μL) or protein marker was loaded onto discontinuous sodium dodecyl sulfate polyacrylamide gel with 4% stacking gel and 12% separating gel. Migration was done in a Bio-Rad Mini-Protean II system under 90 V for 2 h. Gel was stained with 0.1% Coomassie brilliant blue G 250 in 45% methanol and 10% acetic acid and destained in solution with the composition ratio of methanol/acetic acid/water = 1:1:8, v/v/v. Gel was scanned by Bio-Rad Universal Hood II gel imaging system, and densitometry analysis was performed using Image J 2.1.4.7 software.
Amino Acid Composition Analysis
Seventy-five milligrams of kafirin was placed in a 20 mL ampule and mixed with 10 mL of 6 M HCl. After sealing, the protein was hydrolyzed at 110 °C for 22 h under vacuum. The hydrolysate was then dried under vacuum at 60 °C. The dried sample was dissolved in 3–5 mL of 0.2 M sodium citrate buffer (pH 2.2) to yield an amino acid concentration of 50–250 nmol/mL. The protein solution was filtered through a 0.2 μm syringe filter and loaded onto a Hitachi L-8800 amino acid analyzer (Tokyo, Japan) equipped with a Hitachi 2622SC ion-exchange column for amino acid composition analysis.
Attenuated Total Reflectance Fourier Transform Infrared (ATR-FTIR) Spectroscopy
ATR-FTIR spectra were collected by a Thermal Nicolet Nexus 670 FTIR spectrometer (Thermo Electron Corp., Madison, WI, USA). Kafirin protein powder was wrapped in aluminum foil and pressed into a flat pellet by hand to ensure good contact with the ATR crystal. Each spectrum was collected at wavenumber range from 4000 to 600 cm–1 and averaged over 256 scans with 4 cm–1 resolution. With the aid of OMNIC 7.2 software, the original FTIR spectrum was then smoothed with smoothing points (11, 21.213 cm–1). Second-derivative (Savitsky–Golay derivative) analysis in the wavenumber ranging from 1700 to 1520 cm–1, which covered the typical amide I and amide II peaks, was then conducted to identify positions of individual component peaks. With the assistance of Origin 9.0 software, multiple-peak fitting was conducted by fitting peak positions obtained from second-derivative to Gaussian functions. On the basis of the attribution relationship between component peaks and types of secondary structure, the ratio of secondary structure was determined by calculating the peak area ratio.
Circular Dichroism (CD) Spectroscopy
CD spectra were collected at 25 °C using an AVIV model 400 circular dichroism spectrometer equipped with 0.1 cm path length quartz cuvettes (model 110-OS, Hellma, USA). Wavelength scans were conducted from 190 to 260 nm with a bandwidth of 1 nm. Samples, with protein concentration of 0.2 mg/mL, were filtered by 0.45 μm membrane (Millipore, Ireland) before testing. Three scanning acquisitions were gathered, and one representative set of spectra was collected. For each spectrum, the medium baseline was subtracted and mean residue ellipticity (MRE) (mdeg·cm2/dmol) versus wavelength was plotted.21 It was calculated as [θ]λ = MRWθλ/10dc, where the average molecular weight of an amino acid residue is 109.867 g/mol, θλ is the measured ellipticity at the specific wavelength in mdeg, c is the concentration of protein in g/mL, and d is the path length in cm. Secondary structure estimation was processed by curve fitting with reference CD curves of α-helix, β-sheet, random coil, and β-turn conformations.
Synchrotron Small-Angle X-ray Scattering
SAXS data were collected at Bio-CAT, 18-ID beam line section, at the Advanced Photon Source, Argonne National Laboratory. Freshly prepared kafirin (2 mg/mL) in 60% (v/v) tert-butanol, 65% isopropanol, and 85% ethanol aqueous solutions was examined. The X-ray wavelength was 1.033 Å, and the experimental setup included a 3 m sample-to-detector length camera and another 0.3 m sample-to-detector length camera with the high-sensitivity CCD detector. A quartz capillary flow cell of 1.5 mm diameter was fitted to a brass block; this sample holder was maintained at 25 °C in all experiments. A Microlab 500 Hamilton pump was used to load samples into the flow cell at a constant rate (10 mL/s) during X-ray exposure to minimize radiation damage. A single exposure of 1 s was used to acquire the scattering data, 15 curves were collected for each sample, and their averaged curves were utilized for further analysis. Identical measurement configurations were used for solvent backgrounds and sample solutions for proper background subtraction.
Small-Angle X-ray Scattering Data Analysis
The total scattering intensity, I(Q), for a monodisperse protein can be expressed as22
| 1 |
where np is the number density of colloidal particles per unit volume in the solution, v is the specific volume of protein that can be predicted through the empirical equation proposed by Fischer et al.,23Q = (4π/λ) sin(θ/2) is the scattering vector, where λ is the wavelength of the X-ray beam, θ is the scattering angle, and Δρ is the contrast of electron densities between proteins and solvent, P(Q) is the form factor of a given protein that reflects the shape of individual protein, and S(Q) is the structure factor that probes the structure of proteins in the solution. For an ellipsoidal particle with a parallel radius a and a perpendicular radius b of the equivalent ellipsoid of protein, the form factor can be expressed as24,25
| 2 |
The protein aggregation and protein–protein interaction upon concentration increase in solutions can be described by using the effective structure factor S(Q,C):26
| 3 |
Here I(Q,C) is the scattering intensity profile from a protein solution with concentration C, and C0 corresponds to dilute solution in which protein aggregation is negligible.
Guinier analysis and pair distribution function (PDF) were used to obtain the radius of gyration Rg, cross-section radius of gyration (Rc), and size distribution, respectively. The Guinier approximation was given by
| 4 |
where α = 0 for a solid sphere, α = 1 for a rod-like object, and α = 2 for a sheet-like object. When the classic Guinier fit (α = 0) was performed, A was equal to I(0), the scattering intensity at Q = 0, and Rg equaled Rα. When rod-like Guinier fit was performed, Rc was equivalent to √2Rα. When sheet-like Guinier fit was performed, T, the thickness, was equivalent to (12)1/2Rα.
GNOM package was used to generate the PDF P(r), which displayed the probability of finding one point within the particle dimension Dm at a distance r from a given point.27 The low-resolution structures (2–3 nm–1) of kafirin in aqueous medium were restored by using the algorithm DAMMIN.28,29 The program DAMMIN produced the model as an ensemble of densely packed beads inside a spherical search volume with a diameter Dmax. The simulated annealing was utilized to find a compact conformation that had a minimum discrepancy between the experimental and calculated scattering curves. For each model body, five independent DAMMIN restorations were performed. Then, the program DAMAVER was used to generate the averaged model that represented the common features of all restorations at low resolution.
Atomic Force Microscopy (AFM)
Tapping mode AFM images were collected with a NanoScope IIIA Multimode AFM (Veeco Instruments Inc., Santa Barbara, CA, USA) equipped with a silicon-etched RTESP7 cantilever (Veeco Nanoprobe, Camarillo, CA, USA). A silicon tip with nominal spring constant of 40 N/m was used. Before tip engagement, the drive frequency of the silicon tip was tuned to a frequency range of 300–320 kHz. Kafirin solutions (0.2 mL, dissolved in 60% butanol) with different initial concentrations of 0.1, 0.2, and 0.5 mg/mL were dripped onto a freshly cleaved mica surface; after 30 min of absorption, samples were dried under a stream of nitrogen gas. All of the collected images were flattened before further analysis. Section and bearing analyses, which were incorporated in the Nanoscope 5.30 software, were utilized to obtain the quantitative information of kafirin protein self-assembly morphology.
Results and Discussion
Kafirin Composition
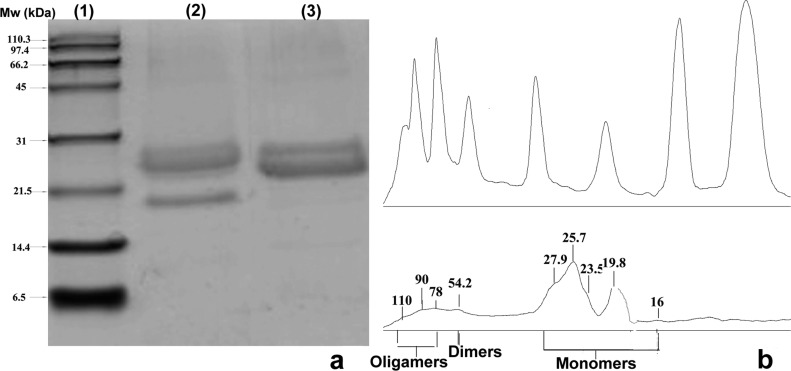
Kafirin and zein showed typical electrophoretic patterns as described by previous researchers30,31 (Figure 1a). Under reducing conditions, kafirin showed major bands with Mr of 23.8 and 25.1 kDa, indicating the presence of α1-, α2-kafirin polypeptides. Bands at 19.8 and 27.9 kDa were identified as β- and γ-kafirin polypeptides. In addition, one light band was found at 54.2 kDa, suggesting the presence of stable dimers. A few faint bands of higher molecular weight were also present, indicating soluble oligomers. As a comparison, commercial zein showed predominately α1- and α2-zein bands at Mw of 22.1 and 25.4 kDa.
Figure 1.
(a) Electrophoretic pattern of kafirin and zein under reducing conditions. Lanes: 1, protein marker; 2, kafirin under reducing condition; 3, commercial zein under reducing condition. (b) Plot fit curves for protein standard (upper) and kafirin (lower) under reducing conditions.
According to the calculated peak areas from the gel run under reducing conditions (Figure 1b), α-, β-, and γ-fractions and cross-linked kafirin (dimer and oligomers) account for 68, 14, 6, and 12% of the total detected kafirin, respectively. As a percent of total monomers this is equivalent to 77, 16, and 7% of α-, β-, and γ-fractions, respectively. Previous studies indicated that α-kafirin comprised 80–84%, whereas β- and γ-kafirin constituted 7–8 and 9–12% of the total monomers, respectively.32−34 The main differences in the results, namely, decreased proportion in α- and γ-kafirin fractions and increased presence of β-kafirin, may have been due to the higher extraction yield of oligomers, which were composed of γ- and α- kafirins linked together by disulfide bonds.35 Because γ- and β-kafirins and protein oligomers encapsulated α-kafirin in a disulfide-bound polymeric network in the protein body,36 the ultrasound treatment with intense agitation and friction forces may effectively disrupt the cross-linked matrix, leading to a higher dissolution yield of cross-linked kafirin and soluble oligomers.37
Amino acid compositions of the extracted kafirin protein together with previously reported results of kafirin obtained by similar extraction procedures38,39 are presented in Table 1. Paired two-tail t tests showed p values of 0.88 and 0.78 compared with Jones’s and Jambunathan’s papers, respectively, indicating our sample has no significant difference with those reported samples. The uncharged or nonpolar neutral amino acids, namely, glycine, alanine, valine, methionine, leucine, tyrosine, phenylalanine, proline, and isoleucine, made up 60.1% of the total amino acids, which contributed to the highly hydrophobic nature of prolamin. Glutamic acid, leucine, alanine, and proline were the most abundant amino acids, accounting for about 28.2, 17.5, 11.8, and 10.2%, respectively, of the total amino acids. The protein contained low levels of lysine, glycine, and histidine. Although most of the amino acid contents of our extracted kafirin were consistent with previous results, the contents of methionine and cysteine were found to be much higher than their counterparts. These differences may be related to the higher fractions of β- and γ- kafirins and their disulfide cross-linked oligomers, all containing rich amounts of cysteine and methionine.40,41 Therefore, this peculiar property could render a greater propensity to form intermolecular disulfide cross-linking and possibly additional protein aggregates.42
Table 1. Amino Acid Composition (g/100 g Protein) of Kafirin.
| amino acid | Ia | IIb | IIIc |
|---|---|---|---|
| aspartic | 6.0 | 6.5 | 7.3 |
| threonine | 2.9 | 2.6 | 2.8 |
| serine | 4.3 | 4.1 | 3.9 |
| glutamic acid | 28.2 | 30.0 | 30.5 |
| glycine | 1.4 | 1.1 | 1.2 |
| alanine | 11.8 | 12.4 | 12.5 |
| half-cysteine | 3.2 | 0.4 | 0.7 |
| valine | 3.8 | 5.0 | 5.1 |
| methionine | 2.1 | 1.0 | 1.1 |
| leucine | 17.5 | 19.2 | 18.8 |
| tyrosine | 3.6 | 5.5 | 5.3 |
| phenylalanine | 6.6 | 6.4 | 4.6 |
| lysine | 0.1 | 0.1 | 0.3 |
| proline | 10.2 | 10.0 | 10.1 |
| histidine | 1.6 | 0.9 | 1.3 |
| arginine | 3.8 | 1.0 | 2 |
| isoleucine | 3.0 | 4.8 | 4.2 |
Analysis results reported by work of our laboratory.
Analysis results reported by work of R. W. Jones
Analysis results reported by work of R. Jambunathan.
Secondary Structure of Kafirin
Because changes in secondary structure affect the properties of kafirin, such as surface hydrophobicity and film-forming properties,43 the FTIR spectrum of kafirin in solid state (Figure 2a) was collected and analyzed. Typical amide I and amide II absorption peaks appeared at 1653 and 1541 cm–1, respectively. Stretching vibrations of the C=O bond of the amide together with the weakly coupled in-plane N–H bending and C–N stretching contribute to the amide I absorption.44 Because both C=O and N—H bonds were involved in the hydrogen bonding between different elements contributing to secondary structure, amide I bond was an ideal wavenumber range for secondary structure analysis of protein. Previous studies have systematically correlated proteins of known secondary structure with the shape of the amide I band, and the following secondary structure in this band has been suggested:45,46 β-turn, 1678–1682 cm–1; α-helix, 1648–1659 cm–1; random coil, 1638–1640 cm–1; and β-sheet, 1625–1635 cm–1. Figure 2b shows the second-derivative plot of the amide I peak of kafirin. Four major components of kafirin were identified in the amide I region at 1681, 1658, 1644, and 1627 cm–1, respectively. The most prominent bands at 1658 and 1644 cm–1 originated from α-helical structures, followed by those in the 1681 and 1627 cm–1 regions, which correspond to β-turn and β-sheets, respectively. Figure 2c shows the multiple peak fitting at the four wavelengths using Gaussian function. By calculation of the individual component peak areas, the composition of kafirin secondary structure was determined as 49% α-helix, 27% β-turn, and 24% β-sheet, respectively.
Figure 2.
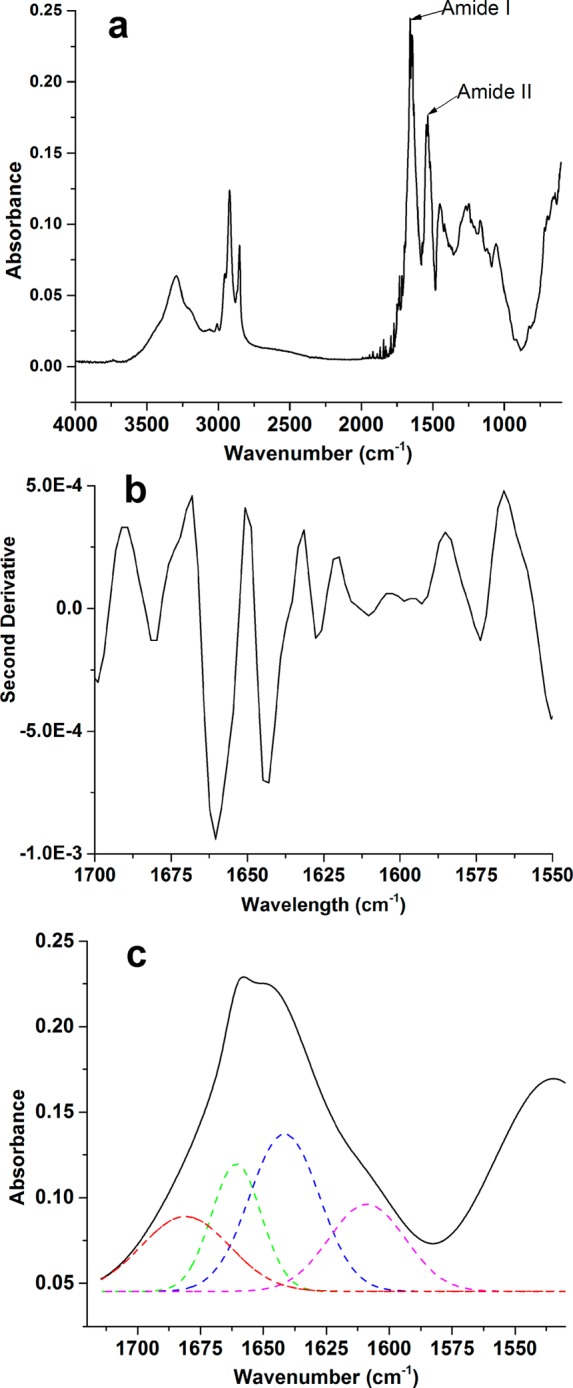
(a) FTIR spectrum of kafirin; (b) second-derivative FTIR spectrum of amide I and II bands of kafirin; (c) best fit for the FTIR spectrum using Gaussian multiple peaking fitting analysis for the peaks associated with protein secondary structure.
The secondary structure contents of kafirin in liquid solutions with different polarities were then determined via far-UV CD spectra. The CD profiles of kafirin in 60% tert-butanol, 65% isopropanol, and 85% ethanol are shown in Figure 3. In all cases, the CD spectra of kafirin exhibited the characteristics of α-helix with two strong negative ellipticity values at 208 and 222 nm. CD ellipticity at 222 nm has been widely used to estimate α-helix content in proteins.47 The CD profiles of kafirin in different solvents show that the unshifted band at 222 nm has noticeable changes in the ellipticity. Consensus values of the relative α-helix content in 65% isopropanol, 60% tert-butanol, and 85% ethanol are 53.1, 57.9, and 68.4%, respectively. The change in α-helix content suggested that kafirin underwent solvent-induced conformational transformations as a combination result of differences in polarity index and proton-accepting ability of different solvents. Dielectric constants of these solvents were then calculated as 40.0, 39.5, and 32.7 by linear combination of dielectric constants of organic solvents and water (dielectric constants of tert-butanol, isopropanol, ethanol, and water are 12.4, 18.3, 24.3, and 80.1, respectively, under ambient condition). Because the polarity of a solvent is proportional to the value of the dielectric constant, it can be seen that the α-helix content increases as solvent polarity decreases. Furthermore, the α-helix content is in agreement with early study that reported the α-helix content of native kafirin to be 50–60%.42 Compared with the value measured in dry state, the α-helix contents were higher in solutions. This result may be either due to the difference in sensitivities to α-helix structures under different analyzing techniques or further evidence of the solvent polarity induced conformational changes. Dry powder form is the extreme circumstance of polarity changes: the tert-butanol evaporated before water during the lyophilization process, causing kafirn to undergo a media change from a highly hydrophobic to a highly hydrophilic environment. Because water is more polar than tert-butanol, it, again, suggested that increasing the polarity of kafirin surrounding media could decrease the α-helix content. In-depth understanding of changes in the secondary structure of kafirin with processing conditions can help develop new methodologies to optimize properties of kafirin-based materials.
Figure 3.
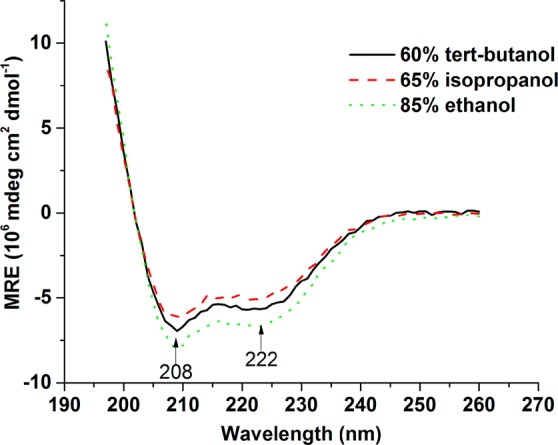
Far-UV CD spectra of kafirin in 60% tert-butanol, 65% isopropanol, and 85% ethanol.
Structure and Self-Assembly Behavior of Kafirin in Solutions
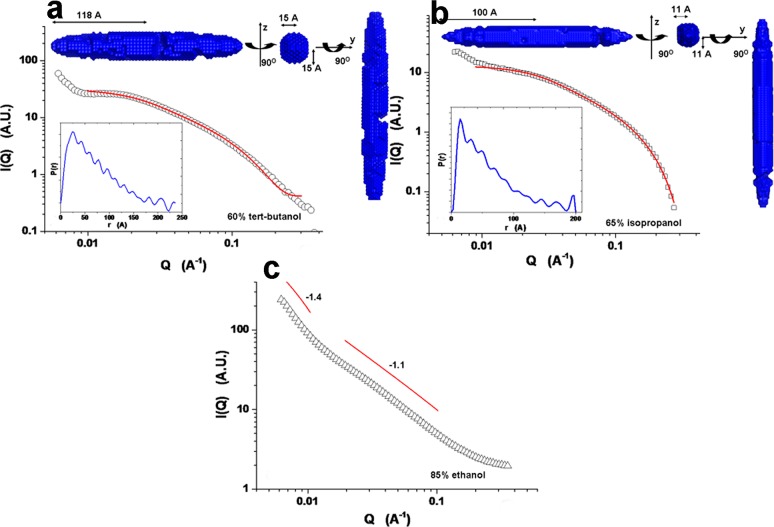
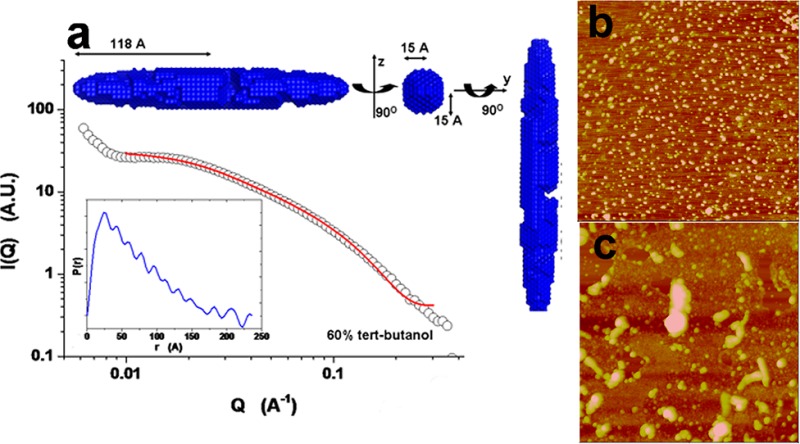
The shape and size of kafirin in different solvents were extracted on the basis of the SAXS data via form factor fitting, pair distribution function, and ab initio modeling. Figure 4 presents the SAXS profiles of 2 mg/mL kafirin in 60% tert-butanol, 65% isopropanol, and 85% ethanol aqueous solutions, respectively. Among the fittings using solid sphere, cylinder, and ellipsoid models, the last delivered the best fit, and we only discuss it later. Kafirin in 60% tert-butanol and 65% isopropanol showed prolate ellipsoid, with dimensions of 118 × 15 × 15 and 100 × 11 × 11 Å, respectively (Figure 4a,b). The slightly skewed PDF curve also verified this elongated conformation with a typical fingerprint of a maximum at small distance, and the location of the maximum is corresponding to the radius of the cross-section (insets, below).26 On the basis of the PDF curve, ab initio modeling of kafirin showed a stretched and extended conformation (insets, above). Compared with 60% tert-butanol, kafirin in 65% isopropanol aqueous solution exhibited a more compact structure with a smoother surface (insets, above). Different from 60% tert-butanol and 65% isopropanol, kafirin in 85% ethanol showed a straighter profile (Figure 4c). Thus, only the power-law relationship was used to fit the low and intermediate Q regions. The exponents of −1.4 at low Q region and −1.1 at intermediate Q region suggested that either the individual kafirin or its assembly has extended conformation with a high-order elongated structure.
Figure 4.
Small-angle X-ray scattering (SAXS) profiles of 2 mg/mL kafirin in (a) 60% tert-butanol, (b) 65% isopropanol, and (c) 85% ethanol. The SAXS data of kafirin in (a) 60% tert-butanol and (b) 65% isopropanol were best fitted with ellipsoidal form factor. The insets of panels a and b are corresponding pair distribution function (PDF) curve (below) and ab initio modeling performed by DAMMIN. Power law was used to fit both the low and intermediate Q regions of (c) kafirin in 85% ethanol.
Figure 5 shows the scattering profile of kafirin in 60% tert-butanol at concentrations of 2, 5, 10, and 15 mg/mL, respectively. On the basis of Guinier plots of globular and rod-like particles (Supporting Information, Figures S1 and S2), the radius of gyration (Rg) and cross-section radius of gyration (Rc) of kafirin in 60% tert-butanol were extracted and plotted against kafirin concentration in Figure 6a. As protein concentration increased from 2 to 5 mg/mL, Rg increased from 46 to 50 Å and Rc slightly decreased from 9.4 to 8.8 Å. Further increase of kafirin concentration to 15 mg/mL resulted in Rg increase to 60.3 Å, and Rc slightly decreased to 5.8 Å, respectively. The increase of Rg and decrease of Rc resulted in a dramatic increase of axial ratio [calculated by 4/3(Rg/Rc)3] from 155.2 to 1498.3 upon protein concentration increasing from 2 to 15 mg/mL, which clearly indicated the aggregation of kafirin at high concentration with an elongated format.
Figure 5.
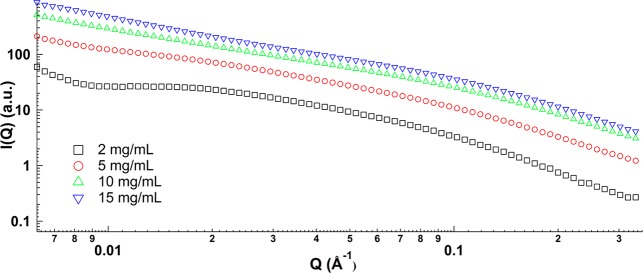
SAXS profiles of kafirin in aqueous 60% tert-butanol at different concentrations.
Figure 6.
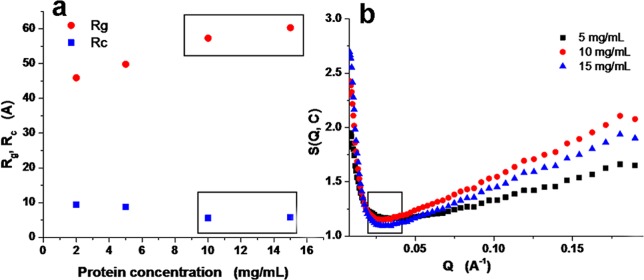
(a) Radius of gyration (Rg) and cross-section radius of gyration (Rc) of kafirin in 60% tert-butanol; (b) effective structure factor of 5–15 mg/mL kafirin in 60% tert-butanol.
The aggregation behavior of kafirin in 60% tert-butanol upon concentration increase was further analyzed via effective structure factor. The effective structure factors S(Q,C) of kafirin in 60% tert-butanol, calculated on the basis of eq 3, are shown in Figure 6b by taking the scattering intensity profile at C0 = 2 mg/mL as dilute condition. The values of S(Q,C) in the entire Q region were >1, suggesting an aggregation of kafirin in a given correlation length range. An inverted peak was found at low Q region, which reciprocally corresponded to correlation length (d = 2π/Q*, the average separation of proteins). When kafirin concentration increased from 5 to 10 mg/mL, the correlation length was kept at 249 Å. However, further increase of kafirin concentration to 15 mg/mL resulted in a decrease of correlation length to 213 Å due to the concentration-dependent aggregation of kafirin. It is unlike concentration-independent correlation length of zein in aqueous ethanol solution,48 but similar to the case of zein in acetic acid,49 which indicates this solvent is good enough to fully dissolve karfirin.
Morphology and Solvent Evaporation Induced Self-Assembly of Kafirin
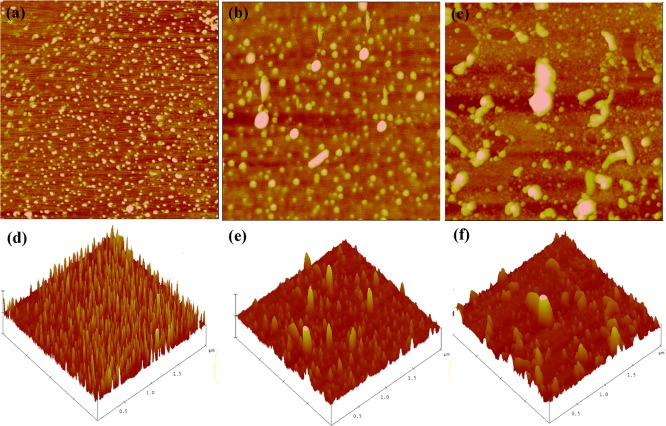
AFM is an effective tool to capture the morphology and self-assembly of either individual proteins or their aggregates. Figure 7 exhibits the height and 3D images of kafirin casting from 60% tert-butanol solution with different initial protein concentrations. During solvent evaporation, kafirin concentration in solution increased dramatically, and the remaining solvent became increasingly hydrophilic due to the lower boiling temperature of tert-butanol. Protein particles were expected as results of the intramolecular contact of individual proteins, and butanol evaporation triggered hydrophobic protein–protein interactions.
Figure 7.
Morphology of kafirin on mica using tapping mode–atomic force microscopy (AFM) height images with casting solutions of 0.1 mg/mL (a), 0.2 mg/mL (b) and 0.5 mg/mL (c) and their corresponding 3D images in panels d, e, and f. The scale size is 2 μm × 2 μm, and the z scales for each concentration are 10, 20, and 80 nm, respectively.
It was observed that kafirin dispersed well in forms of either ellipsoidal or disk-like particles at initial protein concentrations of 0.1 mg/mL, as shown in Figure 7a,d. On the basis of section analysis and statistical bearing analysis, most of individual proteins self-assembled into uniform particles with vertical size between 12 and 17 nm and horizontal size between 20 and 40 nm. Further dilution did not change the particle size (data not shown), which indicated that kafirin presented a rather stable aggregation state when prepared from dilute alcohol solution. This finding is analogous to the observation reported by Yamada et al (50) in the case of zein. The uniformly distributed protein aggregates had also been reported by McMaster et al.51 using AFM. When the initial protein concentration was increased to 0.2 mg/mL, apart from the presence of individual spherical particles, large disk-like and rod-like particles began to emerge as shown in Figure 7b,e. Under section analysis, a typical disk-like particle had the three axis lengths of 115 nm (x-axis), 106 nm (y-axis), 13 nm (z-axis), and a typical rod-like particle had three axis lengths of 246 nm (x-axis), 86 nm (y-axis), 12 nm (z-axis), respectively. Significant protein aggregation continued, and even larger disk or rod-like structures were formed when the initial protein concentration was further increased to 0.5 mg/mL, as shown in Figure 7c,f. Additionally, the standard deviation for particle size was much larger at 0.5 mg/mL than at 0.2 mg/mL, indicating a more heterogeneous distribution of kafirin aggregates. Combining the results of both SAXS and AFM, the observed morphology of kafirin in dry state may be explained as individual protein with quite prolate dimension in the dilute solution aggregated into stable ellipsoid particles as the concentration increased and the hydrophobicity of the solvent decreased during the solvent evaporation process. As the initial protein concentration continued to increase, chances for individual prolate protein to interact with neighboring proteins enhanced, and small aggregates grew into disk or rod-like aggregates in a larger scale.
Key parameters affecting kafirin structure based on our investigations included the chemical compositions, solvent polarity, protein concentration, and solvent-induced evaporation process. Results gained in this work are relevant in guiding the development of kafirin-based biomaterials. The high propensity of protein aggregation due to the higher proportion of β- and γ-fractions and cross-linked kafirin is the basis for understanding its physical nature and rheological property in solution state. Clarification of the conformational changes of kafirin protein along with changes in protein concentration and solvent polarity is vital for designing the sample preparation and formulation process for kafirin-based biomaterials. The self-assembly behavior of kafirin under solvent-induced evaporation process lays the foundation for the understanding of its film-forming properties and the preparation of kafirin-based fibrillar materials.
Acknowledgments
We thank Drs. Avanish Parmarand and Fei Xu at CABM, Rutgers University, for their assistance in using CD.
Supporting Information Available
Guinier plots for compact spherical particles and rod-likeparticles for the scattering intensity profiles of 2, 5, 10, and 15 mg/mL kafirin in 60% tert-butanol solution. This material is available free of charge via the Internet at http://pubs.acs.org.
This research used resources of the Advanced Photon Source, a U.S. Department of Energy (DOE) Office of Science User Facility operated for the DOE Office of Science by Argonne National Laboratory under Contract DE-AC02-06CH11357. This project was supported by Grant 9 P41 GM103622 from the National Institute of General Medical Sciences of the National Institutes of Health. The content is solely the responsibility of the authors and does not necessarily reflect the official views of the National Institute of General Medical Sciences or the National Institutes of Health.
The authors declare no competing financial interest.
Funding Statement
National Institutes of Health, United States
Supplementary Material
References
- Krochta J. M.Proteins as raw materials for films and coatings: definitions, current status and opportunities. In Protein-Based Films and Coatings; Gennadios A., Ed.; CRC Press: Boca Raton, FL, USA, 2002. [Google Scholar]
- Anderson T. J.; Lamsal B. P. Zein extraction from corn, corn products, and coproducts and modifications for various applications: a review. Cereal Chem. 2011, 88, 159–173. [Google Scholar]
- Lawton J. W. Zein: a history of processing and use. Cereal Chem. 2002, 79, 1–18. [Google Scholar]
- Anderson T. J.; Lamsal B. P. Development of new method for extraction of α-zein from corn gluten meal using different solvents. Cereal Chem. 2011, 88, 356–362. [Google Scholar]
- Nonthanum P.; Lee Y.; Padua G. W. Effect of γ-zein on the rheological behavior of concentrated zein solutions. J. Agric. Food Chem. 2012, 60, 1742–1747. [DOI] [PubMed] [Google Scholar]
- Selling G. W.; Hamaker S. A. H.; Sessa D. J. Effect of solvent and temperature on secondary and tertiary structure of zein by circular dichroism. Cereal Chem. 2007, 84, 265–270. [Google Scholar]
- Argos P.; Pedersen K.; Marks M. S.; Larkins B. A. A structural model for maize zein proteins. J. Biol. Chem. 1982, 257, 9984–9990. [PubMed] [Google Scholar]
- Wang Q.; Padua G. W. Controlled self-organization of zein nanostructures for encapsulation of active food ingredients. Abstr. Pap. Am. Chem. Soc. 2007, 233, 46–46. [Google Scholar]
- Luo Y. C.; Teng Z.; Wang Q. Development of zein nanoparticles coated with carboxymethyl chitosan for encapsulation and controlled release of vitamin D3. J. Agric. Food Chem. 2012, 60, 836–843. [DOI] [PubMed] [Google Scholar]
- Kayaci F.; Uyar T. Electrospun zein nanofibers incorporating cyclodextrins. Carbohydr. Polym. 2012, 90, 558–568. [DOI] [PubMed] [Google Scholar]
- Shull J. M.; Watterson J. J.; Kirleis A. W. Proposed nomenclature for the alcohol-soluble proteins (kafirins) of sorghum-bicolor (L Moench) based on molecular-weight, solubility, and structure. J. Agric. Food Chem. 1991, 39, 83–87. [Google Scholar]
- Derose R. T.; Ma D. P.; Kwon I. S.; Hasnain S. E.; Klassy R. C.; Hall T. C. Characterization of the kafirin gene family from sorghum reveals extensive homology with zein from maize. Plant Mol. Biol. 1989, 12, 245–256. [DOI] [PubMed] [Google Scholar]
- Taylor J. R. N.; Schober T. J.; Bean S. R. Novel food and non-food uses for sorghum and millets. J. Cereal Sci. 2006, 44, 252–271. [Google Scholar]
- Duodu K. G.; Taylor J. R. N.; Belton P. S.; Hamaker B. R. Factors affecting sorghum protein digestibility. J. Cereal Sci. 2003, 38, 117–131. [Google Scholar]
- Taylor J.; Taylor J. R. N.; Dutton M. F.; de Kock S. Identification of kafirin film casting solvents. Food Chem. 2005, 90, 401–408. [Google Scholar]
- Buffo R. A.; Weller C. L.; Gennadios A. Films from laboratory-extracted sorghum kafirin. Cereal Chem. 1997, 74, 473–475. [Google Scholar]
- Emmambux M. N.; Stading M.; Taylor J. R. N. Sorghum kafirin film property modification with hydrolysable and condensed tannins. J. Cereal. Sci. 2004, 40, 127–135. [Google Scholar]
- Taylor J.; Taylor J. R. N.; Belton P. S.; Minnaar A. Preparation of free-standing films from kafirin protein microparticles: mechanism of formation and functional properties. J. Agric. Food Chem. 2009, 57, 6729–6735. [DOI] [PubMed] [Google Scholar]
- da Silva L. S.; Taylor J. R. N. Physical, mechanical, and barrier properties of kafirin films from red and white sorghum milling fractions. Cereal Chem. 2005, 82, 9–14. [Google Scholar]
- Musigakun P.; Thongngam M. Characteristics and functional properties of sorghum protein (kafirin). Kasetsart J. (Nat. Sci.) 2007, 313–318. [Google Scholar]
- Petrella E. C.; Machesky L. M.; Kaiser D. A.; Pollard T. D. Structural requirements and thermodynamics of the interaction of proline peptides with profilin. Biochemistry 1996, 35, 16535–16543. [DOI] [PubMed] [Google Scholar]
- Huang Q. R.; Dubin P. L.; Lal J.; Moorefield C. N.; Newkome G. R. Small-angle neutron scattering studies of charged carboxyl-terminated dendrimers in solutions. Langmuir 2005, 21, 2737–2742. [DOI] [PubMed] [Google Scholar]
- Fischer H.; Polikarpov I.; Craievich A. F. Average protein density is a molecular-weight-dependent function. Protein Sci. 2004, 13, 2825–2828. [DOI] [PMC free article] [PubMed] [Google Scholar]
- Li Y.; Li J.; Xia Q.; Zhang B.; Wang Q.; Huang Q. Understanding the dissolution of α-zein in aqueous ethanol and acetic acid solutions. J. Phys. Chem. B 2012, 116, 12057–12064. [DOI] [PubMed] [Google Scholar]
- Zhang F.; Skoda M. W. A.; Jacobs R. M. J.; Martin R. A.; Martin C. M.; Schreiber F. Protein interactions studied by SAXS: effect of ionic strength and protein concentration for BSA in aqueous solutions. J. Phys. Chem. B. 2006, 111, 251–259. [DOI] [PubMed] [Google Scholar]
- Svergun D. I.; Koch M. H. J. Small-angle scattering studies of biological macromolecules in solution. Rep. Prog. Phys. 2003, 66, 1735–1782. [Google Scholar]
- Semenyuk A. V.; Svergun D. I. GNOM – a program package for small-angle scattering data-processing. J. Appl. Crystallogr. 1991, 24, 537–540. [Google Scholar]
- Volkov V. V.; Svergun D. I. Uniqueness of ab initio shape determination in small-angle scattering. J. Appl. Crystallogr. 2003, 36, 860–864. [DOI] [PMC free article] [PubMed] [Google Scholar]
- Svergun D. I. Restoring low resolution structure of biological macromolecules from solution scattering using simulated annealing. Biophys. J. 1999, 76, 2879–2886. [DOI] [PMC free article] [PubMed] [Google Scholar]
- Beckwith A. C.; Jones R. M. Physical chemical properties of grain sorghum prolamine fractions and components. J. Agric. Food Chem. 1972, 20, 259–261. [Google Scholar]
- Nunes A.; Correia I.; Barros A.; Delgadillo I. Characterization of kafirin and zein oligomers by preparative sodium dodecyl sulfate–polyacrylamide gel electrophoresis. J. Agric. Food Chem. 2005, 53, 639–643. [DOI] [PubMed] [Google Scholar]
- Hamaker B. R.; Mohamed A. A.; Habben J. E.; Huang C. P.; Larkins B. A. Efficient procedure for extracting maize and sorghum kernel proteins reveals higher prolamin contents than the conventional method. Cereal Chem. 1995, 72, 583–588. [Google Scholar]
- Watterson J. J.; Shull J. M.; Kirleis A. W. Quantitation of α-karafins, β-karafins, and γ-kafirins in vitreous and opaque endosperm of sorghum-bicolor. Cereal Chem. 1993, 70, 452–457. [Google Scholar]
- De Mesa-Stonestreet N. J.; Alavi S.; Bean S. R. Sorghum proteins: the concentration, isolation, modification, and food applications of kafirins. J. Food Sci. 2010, 75, R90–R104. [DOI] [PubMed] [Google Scholar]
- El Nour I. N. A.; Peruffo A. D. B.; Curioni A. Characterisation of sorghum kafirins in relation to their cross-linking behaviour. J. Cereal Sci. 1998, 28, 197–207. [Google Scholar]
- Bean S. R.; Loerger B. P.; Smith B. M.; Blackwell D. L.. Sorghum protein structure and chemistry: implications for nutrition and functionality. In Advances in Cereal Science: Implications to Food Processing and Health Promotion; Awika1 M. J., Piironen V., Bean S., Eds.; American Chemical Society: Washington, DC, USA, 2011; Vol. 1089, pp 131–147. [Google Scholar]
- Bean S. R.; Ioerger B. P.; Park S. H.; Singh H. Interaction between sorghum protein extraction and precipitation conditions on yield, purity, and composition of purified protein fractions. Cereal Chem. 2006, 83, 99–107. [Google Scholar]
- Jones R. W.; Beckwith A. C. Proximate composition and proteins of three grain sorghum hybrids and their dry-mill fractions. J. Agric. Food Chem. 1970, 33–36. [DOI] [PubMed] [Google Scholar]
- Jambunathan R.; Mertz E. T.. Amino acid compositions of whole kernel and endosperm protein fractions of sorghum. In Research Progress Report on Inheritance and Improvement of Protein Quality in Sorghum bicolor L. Moench.; Axtell J. D., Oswalt D. L., Eds.; Purdue University: West Lafeyette, IN, USA, 1972; p 43. [Google Scholar]
- Chamba E. B.; Halford N. G.; Forsyth J.; Wilkinson M.; Shewry P. R. Molecular cloning of β-kafirin, a methionine-rich protein of sorghum grain. J. Cereal Sci. 2005, 41, 381–383. [Google Scholar]
- Shull J. M.; Watterson J. J.; Kirleis A. W. Purification and immunocytochemical localization of kafirins in Sorghum bicolor (L. Moench) endosperm. Protoplasma 1992, 171, 64–74. [Google Scholar]
- Belton P. S.; Delgadillo I.; Halford N. G.; Shewry P. R. Kafirin structure and functionality. J. Cereal Sci. 2006, 44, 272–286. [Google Scholar]
- Gao C. L.; Taylor J.; Wellner N.; Byaruhanga Y. B.; Parker M. L.; Mills E. N. C.; Belton P. S. Effect of preparation conditions on protein secondary structure and biofilm formation of kafirin. J. Agric. Food Chem. 2005, 53, 306–312. [DOI] [PubMed] [Google Scholar]
- Renugopalakrishnan V.; Chandrakasan G.; Moore S.; Hutson T. B.; Berney C. V.; Bhatnagar R. S. Bound water in collagen: evidence from Fourier-transform infrared and Fourier-transform infrared photoacoustic spectroscopic study. Macromolecules 1989, 22, 4121–4124. [Google Scholar]
- Zhang B. C.; Luo Y. C.; Wang Q. Effect of acid and base treatments on structural, rheological, and antioxidant properties of α-zein. Food Chem. 2011, 124, 210–220. [Google Scholar]
- Singh N.; Georget D. M. R.; Belton P. S.; Barker S. A. Zein-iodine complex studied by FTIR spectroscopy and dielectric and dynamic rheometry in films and precipitates. J. Agric. Food Chem. 2009, 57, 4334–4341. [DOI] [PubMed] [Google Scholar]
- Wang Y.; Padua G. W. Nanoscale characterization of zein self-assembly. Langmuir 2012, 28, 2429–2435. [DOI] [PubMed] [Google Scholar]
- Li Y.; Li J.; Xia Q.; Zhang B.; Wang Q.; Huang Q. Understanding the dissolution of α-zein in aqueous ethanol and acetic acid solutions. J. Phys. Chem. B 2012, 116, 12057–12064. [DOI] [PubMed] [Google Scholar]
- Li Y. Q.; Xia Q. Y.; Shi K.; Huang Q. R. Scaling behaviors of α-zein in acetic acid solutions. J. Phys. Chem. B 2011, 115, 9695–9702. [DOI] [PubMed] [Google Scholar]
- Yamada K.; Takahashi H.; Noguchi A. Improved water resistance in edible zein films and composites for biodegradable food packaging. Int. J. Food Sci. Technol. 1995, 30, 599–608. [Google Scholar]
- McMaster T. J.; Miles M. J.; Wannerberger L.; Eliasson A. C.; Shewry P. R.; Tatham A. S. Identification of microphases in mixed α- and ω-gliadin protein films investigated by atomic force microscopy. J. Agric. Food Chem. 1999, 47, 5093–5099. [DOI] [PubMed] [Google Scholar]
Associated Data
This section collects any data citations, data availability statements, or supplementary materials included in this article.


