Abstract
The role of NOD-like receptor family (NLRP3) has been confirmed in various inflammatory diseases. The association between NLRP3 and hyper-bileacidaemia during the sepsis remains unclear. We aimed to investigate whether NLRP3 silencing protects against the sepsis-induced hyper-bileacidaemia. Sepsis was induced by caecum ligation and puncture (CLP). Gene silencing of NLRP3 was performed by injecting rats with NLRP3 short hairpin RNA plasmids (NLRP3 shRNA) 48 h before surgery. Rats were divided into four groups: group 1: sham; group 2: sepsis; group 3: NLRP3 shRNA + sepsis (called the ‘NLRP3 shRNA’ group); and group 4: scrambled shRNA + sepsis (called the ‘scrambled shRNA’ group). The serum levels of bile acids, hepatic expression of hepatocyte membrane transporters, hepatic cytokine levels and behaviours of immune cells were compared among the groups. Hepatic NLRP3 expression was increased dramatically during the sepsis, but was suppressed by pretreatment with NLRP3 shRNA. Compared with rats in the sepsis and the scrambled shRNA groups, rats in the NLRP3 shRNA group exhibited significantly decreased serum levels of glycine and taurine conjugated-bile acids, with rehabilitated expression of hepatocyte transporters, suppressed hepatic cytokine levels, decreased hepatic neutrophils infiltration and attenuated macrophages pyroptosis. Gene silencing of NLRP3 ameliorates sepsis-induced hyper-bileacidaemia by rehabilitating hepatocyte transporter expression, reducing hepatic cytokine levels, neutrophil infiltration and macrophages pyroptosis. NLRP3 may be a pivotal target for sepsis management.
Keywords: hyper-bileacidaemia, liver injury, NLRP3 inflammasome, sepsis
Introduction
Sepsis is the 11th leading cause of death in the United States, while liver is the second most commonly affected organ during the sepsis 1. Given its metabolic, regulatory and immunological functions, liver dysfunction has widespread pathophysiological implications. Recent studies indicated that liver injury is an early event, as reflected by elevated serum bile acid concentrations 15 h after sepsis 2. Due to the detergent properties of bile acids, hyper-bileacidaemia may lead to hepatocellular damage, inflammation, fibrosis and cancer 3. The serum levels of bile acids predict mortality in critically ill patients with high sensitivity and specificity 2. The severity of hyper-bileacidaemia in early sepsis prompts clinicians to investigate the underlying mechanisms and potential therapies.
Bile acids are synthesized in hepatocytes, then secreted into bile across the canalicular membrane transporters or into blood across the basolateral membrane transporters 4. Therefore, hepatocyte transporters may participate in the development of hyper-bileacidaemia. Among all the transporters, there are several major transporters. The bile salt export pump (Bsep) and multi-drug resistance-associated protein 2 (Mrp2) are rate-limiting canalicular transporters for bile acids excretion. The multi-drug resistance-associated protein 3 (Mrp3) and multi-drug resistance-associated protein 4 (Mrp4) are principal basolateral transporters 5. Previous clinical studies suggested that these transporters changed more obviously than others during the critical illness 6. It has been recognized that interleukin (IL)-1β and IL-18 impair hepatocyte transporters 7. These cytokines have a highly preserved manner of activation by inflammasomes, predominantly the non-obese diabetic (NOD)-like receptor family (NLRP3) inflammasome 8. The NLRP3 inflammasome is a cytosolic complex for early inflammatory responses. It is constituted of NLRP3, apoptosis-associated speck-like protein containing a caspase recruitment domain (ASC) and caspase-1. NLRP3 is involved in the recognition of exogenous and host ligands, then activating the downstream caspase-1. Activated caspase-1 cleaves pro-IL-1β, pro-IL-18 and pro-IL-33 to their active forms 9. NLRP3 inflammasome plays a crucial role in liver diseases, including fatty liver disease, drug-induced hepatotoxicity, ischaemia/reperfusion injury and fibrosis 10–12.
Activation of the NLRP3 inflammasome results in neutrophil accumulation in the organs. Neutrophil-mediated liver injury has been established 13. Pyroptosis is an inflammasome-activated process. The resident macrophages in the liver, namely Kupffer cells (KCs), consist of a major part of the liver cell population 14. Macrophages undergo pyroptosis via inflammasome activation in sepsis. Pyroptosis correlates with the degree of hepatic damage 15. Ganz . demonstrated that NLRP3 expression was increased significantly in the liver during sepsis 16. Therefore, targeting NLRP3 may be a promising strategy for sepsis-induced hyper-bileacidaemia. Notably, studies have suggested that IL-1β and IL-18 are required for host defence against infections. Mice lacking the NOD-like-receptor NLRP3 exhibited increased susceptibility to infections 17. Accordingly, we hypothesized that partial knock-down of NLRP3 with small interfering RNA (siRNA) may be beneficial.
Until now, the association between NLRP3 and sepsis-induced hyper-bileacidaemia has remained unclear. Additionally, the effects of neutrophil and macrophage pyroptosis on hepatocyte transporters are largely unknown. Hence, we attempted to determine whether gene silencing of NLRP3 protects against sepsis-induced hyper-bileacidaemia. The underlying mechanisms were also investigated.
Methods
Ethics statement
This study was approved by the Science and Technology Department of Jiangsu Province [Permit number: SYXK (Su) 2013-0003]. All experimental procedures were performed according to the guidelines of the animal research committee of Nanjing University.
Materials and reagents
Sprague–Dawley rats (Animal Model Institute of Xi'an, China); NLRP3 shRNA and scrambled shRNA plasmids (OriGene Technologies, Rockville, MD, USA); anti-NLRP3 antibody (Abcam, Cambridge, UK); horseradish peroxidase (HRP)-conjugated goat anti-rabbit immunoglobulin (Ig)G (Santa Cruz Biotechnology, Santa Cruz, CA, USA); anti-Bsep antibody (Sigma-Aldrich, St Louis, MO, USA); anti-Mrp2 antibody (Sigma-Aldrich); anti-Mrp3 antibody (Sigma-Aldrich); anti-Mrp4 antibody (Sigma-Aldrich); anti-CD68 antibody (Santa Cruz Biotechnology); anti-myeloperoxidase (MPO) antibody (Santa Cruz Biotechnology); IL-1β and IL-1β enzyme-linked immunosorbent assays (ELISA) (R&D Systems, Minneapolis, MN, USA); transmission electron microscopy (Phillips, Amsterdam, the Netherlands); high-performance liquid chromatography (LKB Bromma, Bromma, Sweden); bile acid standards (Sigma-Aldrich); RAW 264·7 cells (Cell Resource Center of Shanghai, Shanghai, China); lipopolysaccharide (LPS) (Sigma-Aldrich); propidium iodide (PI) (Invitrogen, Carlsbad, CA, USA); and 6-carboxyfluorescein-YVAD-fluoro-methylketone (Kamiya Biomedical Company, Seattle, WA, USA).
Experimental protocols
One hundred and twenty 8-week-old Sprague–Dawley male rats (weight between 220 ± 10 g, obtained from the Animal Model Institute of Xi'an, China) were used in the experiments. The animals were maintained in an environment with 50–60% humidity and 12-h light/dark cycle at 25 ± 2°C. All animals had free access to water and standard food. All rats were fasted for 12 h before surgery. The rats were divided randomly into four groups (rats were killed at 0, 6, 12, 24 and 48 h after surgery for sample collections, six for each time-point). Group 1 was the sham group; group 2 was subjected to caecal ligation and puncture (CLP), group 3 was administrated with NLRP3 shRNA and subjected to CLP and group 4 was administered with scrambled shRNA and subjected to CLP.
Pretreatment with NLRP3 shRNA plasmids in vivo
Two sequences of siRNA targeting NLRP3 were pooled; (a) sense: 5′-GAUCCUAUUUGAAGAGUGU-3′, anti-sense: 5′-ACACUCUUCAAAUAGGAUC-3′; (b) sense: 5′-GAUCAACCUCUCUACCAGA-3′, anti-sense: 5′-UCUGGUAGAGAGGUUGAUC-3′. The scrambled siRNA sequence was sense: 5′-UUCUCCGAACGUGUCACGUTT-3′, anti-sense: 5′-ACGUGACACGUUCGGAGAATT-3′. Next, we used the NLRP3 siRNA and scrambled siRNA sequences to construct NLRP3 shRNA and scrambled shRNA plasmids (OriGene Technologies). The scrambled shRNA plasmids were used as negative controls. The rats in the NLRP3 shRNA and scrambled shRNA groups were injected via the tail vein with 8 μg/g NLRP3 shRNA or scrambled shRNA plasmids, respectively (dissolved in 1·8 ml of saline) within 10 s, 48 h before surgery 18.
Surgical procedures
Rats were anaesthetized with ketamine (80 mg/kg injected intraperitoneally (i.p) and xylazine (5 mg/kg i.p.). Subsequently, they were placed in the supine position and a midline laparotomy incision was made. In the sham group, the caecum was not ligated or punctured. In other groups, the caecum was exposed, ligated 25% distally to the ileocaecal valve and perforated twice with an 18-gauge needle. The caecum was squeezed to extrude faecal contents that were spread around the caecum. All procedures were performed by the same investigators. At indicated time-points, rats were killed through cervical dislocation and liver tissues (0·3 g) were harvested and stored in a −80°C freezer.
Quantitative real-time–polymerase chain reaction (qRT–PCR) measurements for NLRP3 in the liver
RNA was isolated from liver tissues with the RNeasy Kit (Qiagen, Valencia, CA, USA) and used to synthesize cDNA with the Invitrogen Superscript III reverse transcriptase system. The Stratagene Mx3000P real-time polymerase chain reaction (PCR) system (Stratagene, La Jolla, CA, USA) and real-time SYBR Green PCR technology (Takara Bio, Inc., Shiga, Japan) were used for amplification. The reactions were prepared with 2 μl cDNA, 10 μl SYBR Green, 0·4 μl ROX reference dye, 0·4 μl forward and reverse primers (1 mol/l) and 6·8 μl nuclease-free water to a final volume of 20 μl. The forward and reverse primers of NLRP3 were: forward: 5′-GCTGTGTGAGGCACTCCAG-3′, reverse: 5′-GAAACAGCATTGATGGTCA-3′. Amplification conditions were: 50°C (2 min), 95°C (5 min), followed by 40 cycles of 95°C for 30 s, 60°C for 32 s and 72°C for 30 s. The NLRP3 expression was calculated by their ratios to the housekeeping gene hypoxanthine-guanine phosphoribosyltransferase (HPRT).
NLRP3 immunohistochemistry
Liver tissues were fixed in 4% paraformaldehyde, dehydrated, embedded in paraffin and sectioned according to standard procedures. The 5-μm serial sections were reacted with affinity-purified anti-NLRP3 polyclonal antibody (Abcam). The slides were washed in phosphate-buffered saline (PBS) and subsequently incubated with the second antibody, HRP-conjugated goat anti-rabbit IgG (Santa Cruz Biotechnology) for 1 h at room temperature. The numbers of positive-stained cells were counted blindly in 10 high-power field (HPF) sections (magnification ×100).
Immunofluorescent double-labelling for NLRP3 and macrophages/immunofluorescent labelling for neutrophils in the liver
The livers were fixed in Z-Fix (Anatech Ltd, Battle Creek, MI, USA) for 24 h and embedded in paraffin, cut at 3 μm. For immunofluorescence staining, samples were incubated in blocking buffer [1% bovine serum albumin (BSA), 0·01% saponin, PBS] for 1 h. Sections were incubated with primary antibodies: anti-NLRP3 (1:200 dilution; Abcam) and anti-CD68 (1:600 dilution; Santa Cruz Biotechnology) overnight at 4°C. After washing with PBS, Alexa Fluor-conjugated secondary antibody (1:200 dilution; Santa Cruz Biotechnology) was used to detect NLRP3 and macrophages. Samples were preserved in Fluoromount-G mounting medium (SouthernBiotech, Birmingham, AL, USA) at 4°C until analysed. Negative controls were prepared by omitting the primary antibodies. Studies have suggested detecting neutrophils by immunofluorescent labelling 19. The immunofluorescence staining of neutrophils was performed in standard procedures. The primary antibody was anti-MPO (1:200 dilution; Santa Cruz Biotechnology). Samples were analysed with a Zeiss LSM 710 laser scanning confocal microscope (LSCM) attached to a Zeiss Observer Z1 microscope. Images were collected using ZEN-LSM software.
Histological analysis
The livers were harvested, fixed in 10% formaldehyde, embedded in paraffin and cut serially into 5 μm-thick sections. The haematoxylin and eosin (H&E)-stained sections were evaluated using an optical microscopy (Olympus Optical, Tokyo, Japan) at ×100 and ×400 magnification. Histological damage was semi-quantified based on the methodology from previous studies 20. Briefly, at least 1000 cells per slide were analysed in a blinded fashion by two specialists to review the severity of following parameters: (i) oedema, cytoplasmic vacuolation or cellular degeneration; (ii) inflammatory cell infiltration; (iii) necrotic zones or tissue disorganization; and (iv) congestion or haemorrhage. Each parameter was scored from 0 (absent) to 3 (intense). Scoring of each sample represented the mean score of five different microscopic HPF.
Electron microscopy
The liver slices of 1 × 3 mm2 were plunged into 2·5% glutaraldehyde fixative in phosphate buffer (pH 7·3). The liver was fixed for 48 h before being washed in phosphate buffer, postfixed in 1% osmium tetroxide in phosphate buffer for 1 h and then immersed in propylene oxide, embedded in epoxy resin and polymerized at 60°C overnight. The suitable section was sliced to a thickness of 100 nm and then contrasted by staining with 2% uranyl acetate before being photographed in a CM40 transmission electron microscopy (Phillips).
High-performance liquid chromatography for serum bile acids
The serum was lyophilized with a Speed Vac Plus SC 110 A (Savant Instruments, Inc., Holbrook, NY, USA) and solubilized in 1 ml of the starting buffer (buffer A: 59% methanol, 41% KH2PO4 at 30 mM, pH 4·80; buffer B: 66% methanol, 4% KH2 PO 4 at 30 mM, pH 5·6). Approximately 200 μl of buffer-solved sample was injected into the LC-system (Rheodyne 7125; Rheodyne, Cotati, CA, USA). After vortexing, the elution was filtered through 0·22 μm Millex GV4 sterile filters (Millipore, Bedford, MA, USA) and administered high-performance liquid chromatography (LKB Bromma). For the first 10 min of chromatography, 100% of buffer A was used at a flow rate of 2 ml/min. Then, the mixer driver was switched to 100% of buffer B running for 8 min at the same flow rate. Bile acid reference standards (Sigma-Aldrich) were dissolved separately in methanol to prepare stock solutions. These stock solutions were mixed and then serially diluted to produce calibration standard solutions (25, 15, 10, 5, 3, 1, 0·5, 0·3, 0·1, 0·05, 0·03, 0·01, 0·005 and 0·003 μg/ml for each compound). Quantification of serum bile acids concentrations was achieved by comparison with bile acid reference standards 21.
Assessment of liver function
Blood samples were obtained from the inferior vena cava and centrifuged immediately for 15 min at 2761 g (Laborzentrifugen Sigma-Aldrich 3 K10, Osterode am Harz, Germany). The liver function parameters were measured with an autoanalyser (Antech Diagnostics, Los Angeles, CA, USA).
RT–PCR analysis
Total RNA was isolated from the liver tissues (30–50 mg) with Trizol reagent (Invitrogen), treated with RNase-free DNase (Promega, Madison, WI, USA) and reverse-transcribed to cDNA. The cDNA was then amplified by RT–PCR. The primers were as follows: NLRP3: forward: 5′-GCTGTGTGAGGCACTCCAG-3′, reverse: 5′-GAAACAGCATTGATGGTCA-3′; Mrp2: forward: 5′-GCGAGGAGAGCATTATGGAC-3′, reverse: 5′-CAGGAGGAACTGTGGCTTGT-3′; Mrp3: forward: 5′-ACACCGAGCCAGCCATATAC-3′, reverse: 5′-ACATTGGCTCCGATAGCAAC-3″; Mrp4: forward: 5′-TAAAATGGACACTGAACTAG-3′, reverse: 5′-AATGGTGAGAACAGTGCA-3′; Bsep: forward: 5′-GAGGTTACTTAATAGCCTACG-3′, reverse: 5′-CATCTATCATCACAGTTCCC-3′; IL-1β: forward: 5′-TGGCAACTGTCCCTGAACT-3′, reverse: 5′-GCTTGGGTCCTCATCCTG-3′; IL-18: forward: 5′-TGGAGACTTGGAATCAGACC-3′, reverse: 5′-GGCAAGCTAGAAAGTGTCCT-3′; and housekeeping gene glyceraldehyde-3-phosphate dehydrogenase (GAPDH): forward: 5′-CAGTGCCAGCCTCGTCTCAT-3′, reverse: 5′-AGGGGCCATCCACAGTCTTC-3′. PCR amplifications were performed for 2 min at 94°C, followed by 40 cycles with 1 min at 94°C, 30 s at 58°C (for NLRP3)/1 min at 54°C (for Mrp2 and Mrp4)/1 min at 61°C (for Mrp3)/30 s at 56°C (for Bsep)/ 30 s at 58°C (for IL-1β)/ 45 s at 60°C (for IL-18), 1 min at 72°C and a final 10 min at 72°C. Following amplification, PCR products were analysed on 2% agarose gels and band intensities were quantified by densitometry (Syngene gel-documentation system). The mRNA level for each gene was normalized to GAPDH mRNA.
Western blot analysis
The liver tissues (100 mg) were washed and lysed using a buffer (250 mM/l sucrose, 95 mM/l NaCl, 45 mM/l Tris-HCl, pH 7·6, with protease inhibitor), and then homogenized with QIAshredder Homogenizer (Qiagen). Protein concentrations were determined using a Bradford kit (Bio-Rad, Richmond, CA, USA). Samples (25 μg) were separated by 10% sodium dodecyl sulphate-polyacrylamide gel electrophoresis (SDS-PAGE) and transferred to nitrocellulose membranes. Membranes were blocked with Tris-buffered 5% non-fat milk overnight at 4°C and then incubated with the following antibodies: anti-NLRP3 (1:2000 dilution; Abcam), anti-Bsep (1:2000 dilution; Sigma-Aldrich), anti-Mrp2 (1:5000 dilution; Sigma-Aldrich), anti-Mrp3 (1:2000 dilution; Sigma-Aldrich), anti-Mrp4 (1:1500 dilution; Sigma-Aldrich) or β-actin (1:3000 dilution; Sigma-Aldrich) for 2 h at room temperature. The blots were then washed three times in a TBS–Tween solution (10 mM Tris, pH 7·5, 150 mM NaCl, 0·05% Tween-20) and incubated with the secondary antibodies (peroxidase-conjugated goat anti-rabbit IgG; Santa Cruz Biotechnology) for 2 h. The blots were visualized using the enhanced chemiluminescence detection system (ECL Plus; Amersham Pharmacia Biotech, Little Chalfont, UK) and scanned using a Molecular Dynamics phosphorimager. Data were normalized based on densitometry readings.
Liver myeloperoxidase (MPO) content assay
The liver tissues were homogenized and MPO levels were assessed using spectrophotometry (655 nm). The MPO levels (U/g) were defined as the quantity of enzyme degrading 1 μmol peroxide per minute per gram of tissue at 25°C.
NLRP3 knock-down in-vitro cell experiments and determination of pyroptosis
RAW264·7 cells (a murine macrophage cell line; Cell Resource Center of Shanghai, Shanghai, China) were seeded in six-well plates (1 × 10⁶ cells/well). Stable cell transfections were performed with 40 μg NLRP3 shRNA plasmids or 40 μg scrambled shRNA plasmids per well, using a Nucleofector kit (Santa Cruz Biotechnology). The stably transfected cells were selected and expanded. Cells were stimulated or not with LPS (100 ng/ml) from Escherichia coli serotype O111:B4 (Sigma-Aldrich) for different periods (0, 6, 12, 24 and 48 h) at 37°C, with subsequent adenosine triphosphate (ATP) (5 mM, Sigma-Aldrich) for 30 min. The cell lysates were collected and NLRP3 protein levels were measured by Western blot. The primary antibody was anti-NLRP3 (1:2000 dilution; Abcam). The supernatants in cell culture media from the four groups were analysed for IL-1β and IL-18 by ELISA (R&D Systems, Minneapolis, MN, USA). In another set of studies, RAW264·7 cells were stained with 6-carboxyfluorescein–YVAD–fluoro-methylketone (Kamiya Biomedical Company) to indicate caspase-1. After incubation with PI (20 μg/ml in RPMI; Invitrogen) for 30 min at 37°C 22, cells were visualized by fluorescence microscopy (Olympus). The percentage of caspase-1 and PI double-positive cells was calculated by dividing the number of positive-stained cells over the total cells (100–300 cells/field). Each sample was counted for at least five fields.
Statistical analysis
Data were expressed as mean ± standard deviation (s.d.). Comparisons between the groups were made by one-way analysis of variance (anova) or Student's t-test. All statistical analyses were performed by GraphPad Prism software (version 5·01; GraphPad, San Diego, CA, USA). A P-value below 0·05 was considered significant.
Results
All CLP-operated rats developed signs of sepsis (piloerection, lethargy, tachypnea and weight loss), whereas sham-operated rats remained normal.
NLRP3 is involved in the septic liver injury
Preliminary experiments found that NLRP3 mRNA levels in the liver were lowest at 48 h after administration of NLRP3 shRNA (Supporting information, Fig. S1c). Because we aimed to determine the therapeutic efficacy of knock-down NLRP3 we chose 48 h after administration of NLRP3 shRNA to perform surgery, which was consistent with previous studies 10. The NLRP3 shRNA plasmids located themselves mainly in the liver (Supporting information, Fig. S2).
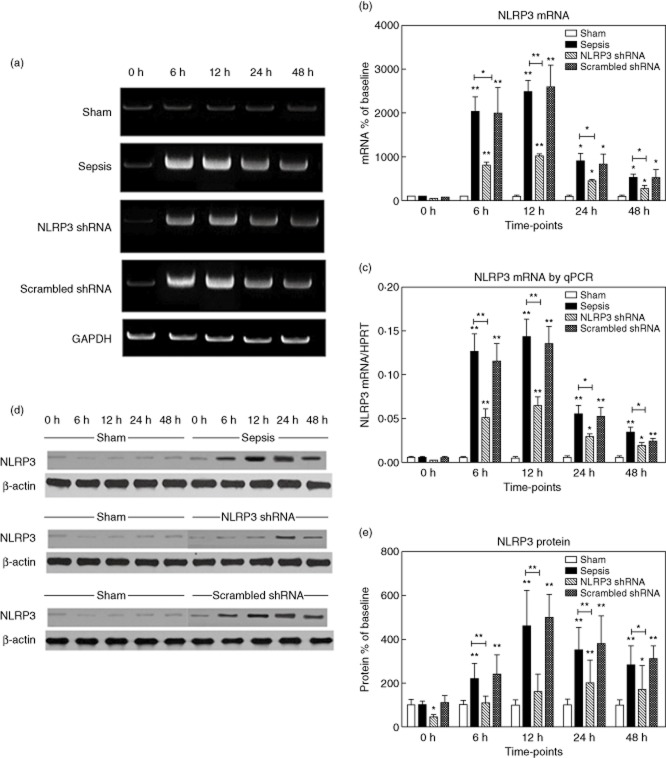
The hepatic expression of NLRP3 was virtually absent in the sham group. After sepsis, NLRP3 mRNA levels increased dramatically (20·4-fold versus baseline at 6 h, 24·9-fold at 12 h, 9·1-fold at 24 h, 5·4-fold at 48 h versus baseline, respectively, P < 0·001) (Fig. 1a,b), which was confirmed by quantitative (q)RT–PCR (Fig. 1c). NLRP3 protein levels increased in parallel (2·2-fold versus baseline at 6, 4·6-fold at 12 h, 3·5-fold at 24 h, 2·8-fold at 48 h versus baseline, respectively, P < 0·001) (Fig. 1d,e). We found that macrophages stained strongly positive for NLRP3, as reflected by the immunohistochemistry and immunofluorescent double stainings. The NLRP3 shRNA inhibited the expression of NLRP3 significantly at corresponding time-points, whereas the scrambled shRNA had no effects (Fig. 2).
Figure 1.
The hepatic expression of non-obese diabetic-like receptor family (NLRP3). (a,b) The representative images of NLRP3 mRNA expression by real-time–polymerase chain reaction (RT–PCR) from the four groups at indicated time-points and the quantitative analysis of mRNA density. (c) NLRP3 mRNA levels in the four groups were also evaluated by quantitative (q)RT–PCR. (d,e) The representative images of NLRP3 protein expression by Western blot from the four groups and the quantitative analysis of protein density. NLRP3 shRNA represents the group administrated with NLRP3 shRNA and then subjected to caecal ligation and puncture (CLP); scrambled shRNA represents the group administered with scrambled NLRP3 shRNA and then subjected to CLP (the same throughout the paper). Data are expressed as percentages of the baseline value in the sham group. Data represent mean ± standard error of the mean, six per group; the experiments were repeated three times. *P < 0·05 versus baseline value in the sham group; **P < 0·001 versus baseline value in the sham group.
Figure 2.
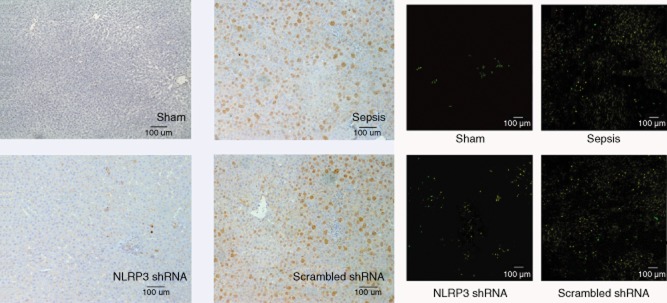
The left panel shows the representative immunohistochemical staining for non-obese diabetic-like receptor family (NLRP3) in the four groups at 12 h after surgery (original magnification ×100). Cells which are positive-stained are shown in brown. The right panel shows the representative immunofluorescent double labelling for NLRP3 (green) and macrophages (red) in the four groups at 12 h after surgery (original magnification ×100). Double-positive cells are shown in yellow.
NLRP3 shRNA attenuates sepsis-induced hyper-bileacidaemia
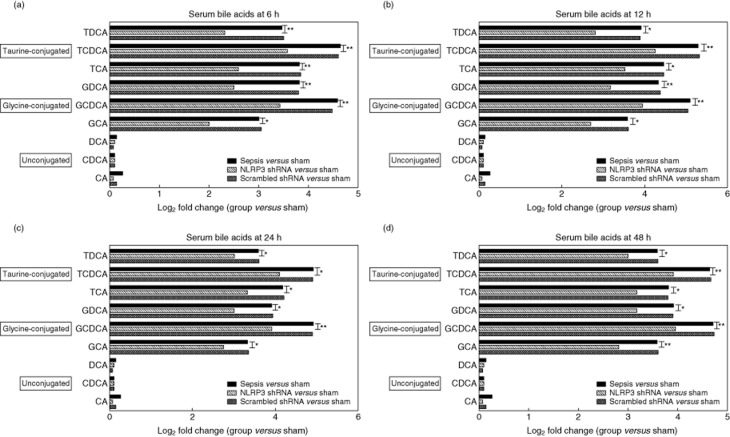
The major components of serum bile acids were measured by high-performance liquid chromatography. The rats developed hyper-bileacidaemia from 6 h after sepsis. Among the bile acid components, glycine and taurine-conjugates of chenodeoxycholic acid (CDCA) had the greatest elevation. The log2 fold change (the sepsis group versus the sham group) for taurochenodeoxycholic acid (TCDCA) was 4·64 at 6 h, 5·29 at 12 h, 4·91 at 24 h and 4·64 at 48 h, respectively. The log2 fold change (the sepsis group versus the sham group) for glycochenodeoxycholic acid (GCDCA) was 4·58 at 6 h, 5·09 at 12 h, 4·91 at 24 h and 4·70 at 48 h, respectively. Serum levels of unconjugated deoxycholic acid (DCA), CDCA and cholic acid (CA) did not change statistically during the whole experimental period. Pretreatment with NLRP3 shRNA reduced serum levels of glycine- or taurine-conjugated DCA, CDCA and CA at all indicated time-points (P < 0·001 or P < 0·05), with the greatest inhibition efficacy at 6 h (Fig. 3).
Figure 3.
The graph depicts log2 fold changes (comparing each group to the sham group) of serum unconjugated as well as glycine- and taurine-conjugated bile acids levels at the indicated time-points, six per group; the experiments were repeated three times. *P < 0·05 the sepsis group versus the non-obese diabetic-like receptor family (NLRP3) shRNA group; **P < 0·001 the sepsis group versus the NLRP3 shRNA group. TDCA: taurodeoxycholic acid; TCDCA: taurochenodeoxycholic acid; TCA: taurocholic acid; GDCA: glycodeoxycholic acid; GCDCA, glycochenodeoxycholic acid; GCA: glycocholic acid; DCA, deoxycholic acid; CDCA: chenodeoxycholic acid; CA: cholic acid.
Histological assessment
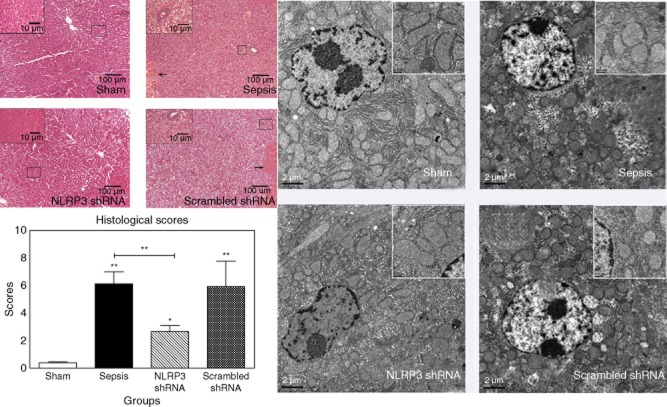
The rats in the sham group showed normal liver architecture with a low score. Sepsis induced dramatic histological changes, including ballooning degeneration, oedema, extensive necrosis, haemorrhage and sinusoidal congestion, as well as infiltration of inflammatory cells (score = 6·2 ± 1·2 at 48 h). The scrambled shRNA-pretreated group showed a similar severity of liver injury (score = 6·0 ± 1·4 at 48 h). By contrast, the morphological changes were less pronounced in the NLRP3 shRNA-pretreated group (score = 2·5 ± 0·5 at 48 h, the sepsis group versus the NLRP3 shRNA group, P < 0·001), with infrequent spotty necrosis, focal cell ballooning and mild infiltration of inflammatory cells (Fig. 4, left panel).
Figure 4.
The left panel shows representative histological images at 48 h after surgery (haematoxylin and eosin staining, original magnification ×100 or ×400). The large black box indicates the amplification of the zone marked with the small box. Arrows point to the necrosis area. The right panel shows representative electron microscopy images at 48 h after surgery (scale bars: 2 μm). The large white box indicates the enlarged images of local area. Data represent mean ± standard deviation, six per group; the experiments were repeated three times.*P < 0·05 versus the sham group; **P < 0·001 versus the sham group.
The transmission electronmicroscopy assessment provided additional information. In the sham group, mitochondria were ultrastructurally normal with smooth membrane. In the sepsis and the scrambled shRNA groups, mitochondria were damaged with a swelling appearance and vague cristae. The populations of mitochondria were also decreased. The architecture of mitochondria was well preserved with NLRP3 shRNA pretreatment (Fig. 4, right panel).
Hepatocyte transporters are rehabilitated with NLRP3 shRNA
We performed RT–PCR and Western blot to measure the expression of hepatocyte transporters. The expressions were expressed as fold changes relative to the baseline values in the sham group.
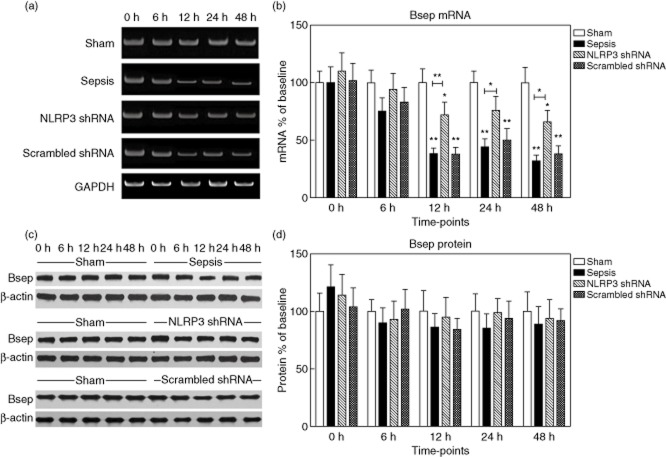
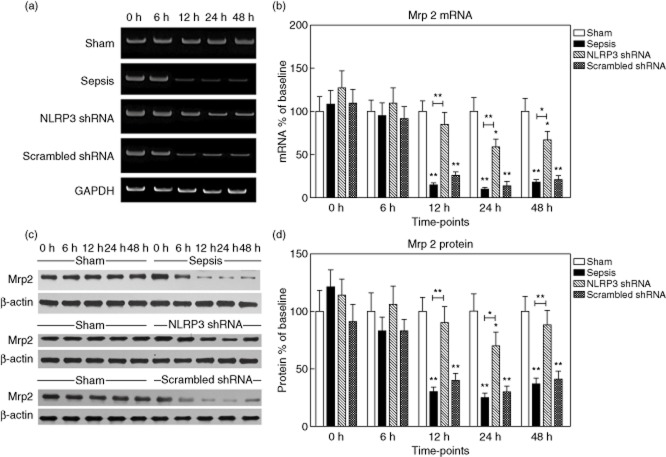
Bsep mRNA levels were decreased significantly at 12, 24 and 48 h after sepsis to 38·3 ± 12·2%, 44·5 ± 9·6% and 32·3 ± 6·8% of the baseline value, respectively, P < 0·001). Conversely, Bsep protein levels remained almost constant (Fig. 5). During the first 6 h after sepsis, no changes in Mrp2 expression could be detected. Nevertheless, sepsis profoundly suppressed Mrp2 mRNA levels to 15·1 ± 2·0% of baseline at 12 h, 10·4 ± 3·5% at 24 h and 18·5 ± 4·2% at 48 h (P < 0·001). Similarly, Mrp2 protein levels decreased progressively to 30·3 ± 4·7% of baseline (12 h), 25·6 ± 7·2% (24 h) and 37·3 ± 8·0% (48 h) (P < 0·001) (Fig. 6).
Figure 5.
Expression of bile salt export pump (Bsep) in the liver tissues. (a,b) The representative images of Bsep mRNA expression by real-time–polymerase chain reaction (RT–PCR) from the four groups at the indicated time-points and the quantitative analysis of mRNA density. (c,d) The representative images of Bsep protein expression by Western blot from the four groups and the quantitative analysis of protein density. Data are expressed as percentages of the baseline value in the sham group. Data represent mean ± standard deviation, six per group; the experiments were repeated three times. *P < 0·05 versus baseline value in the sham group; **P < 0·001 versus baseline value in the sham group.
Figure 6.
Expression of multi-drug resistance-associated protein 2 (Mrp2) in the liver tissues. (a,b) The representative images of Mrp2 mRNA expression by real-time–polymerase chain reaction (RT–PCR) from the four groups at the indicated time-points and the quantitative analysis of mRNA density. (c,d) The representative images of Mrp2 protein expression by Western blot from the four groups and the quantitative analysis of protein density. Data are expressed as percentages of the baseline value in the sham group. Data represent mean ± standard deviation, six per group; the experiments were repeated three times. *P < 0·05 versus baseline value in the sham group; **P < 0·001 versus baseline value in the sham group.
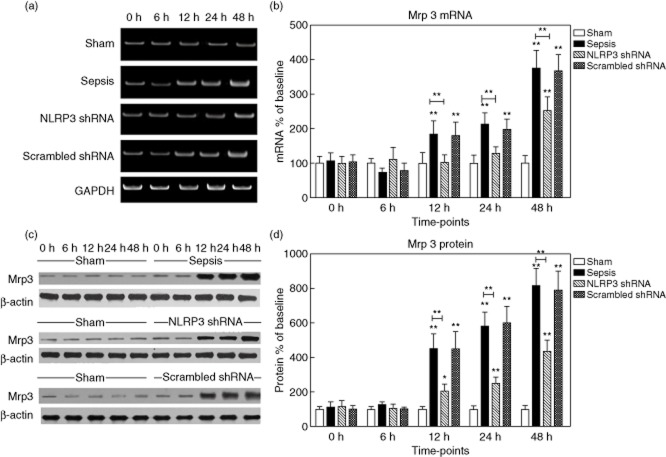
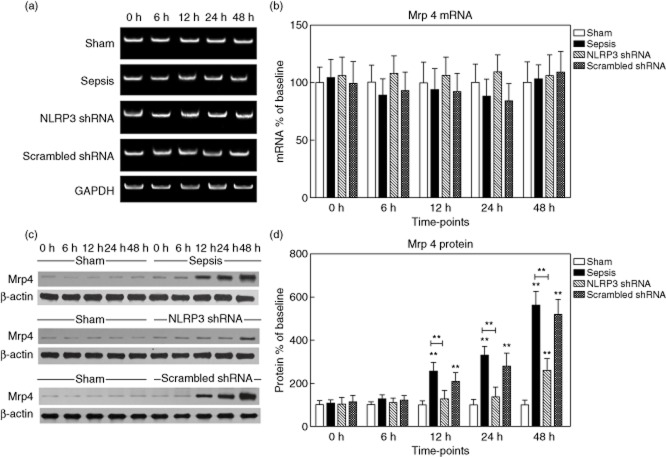
Mrp3 protein levels initially remained low. Enhanced expression of Mrp3 occurred early after sepsis (451·3 ± 86·2% of baseline at 12 h, 580·4 ± 121·7% at 24 h and 816·8 ± 160·5% at 48 h, respectively, P < 0·05). A similar pattern was observed for Mrp3 mRNA expression (Fig. 7). Mrp4 protein levels were barely detectable at baseline, then increased progressively (approximately 5·6-fold versus baseline at 48 h, P < 0·05), whereas the mRNA levels remained unchanged (Fig. 8).
Figure 7.
Expression of multi-drug resistance-associated protein 3 (Mrp3) in the liver tissues. (a,b) The representative images of Mrp3 mRNA expression by real-time–polymerase chain reaction (RT–PCR) from the four groups at the indicated time-points and the quantitative analysis of mRNA density. (c,d) The representative images of Mrp3 protein expression by Western blot from the four groups and the quantitative analysis of protein density. Data are expressed as percentages of the baseline value in the sham group. Data represent mean ± standard deviation, six per group; the experiments were repeated three times. *P < 0·05 versus baseline value in the sham group; **P < 0·001 versus baseline value in the sham group.
Figure 8.
Expression of multi-drug resistance-associated protein 4 (Mrp4) in the liver tissues. (a,b) The representative images of Mrp4 mRNA expression by real-time–polymerase chain reaction (RT–PCR) from the four groups at the indicated time-points and the quantitative analysis of mRNA density. (c,d) The representative images of Mrp4 protein expression by Western blot from the four groups and the quantitative analysis of protein density. Data are expressed as percentages of the baseline value in the sham group. Data represent mean ± standard deviation, six per group; the experiments were repeated three times. *P < 0·05 versus baseline value in the sham group; **P < 0·001 versus baseline value in the sham group.
Notably, NLRP3 shRNA counteracted the effect of sepsis. Pretreatment with NLRP3 shRNA restored the expression of Mrp2, Bsep, Mrp3 and Mrp4 to a degree comparable to the sham group (at both mRNA and protein levels).
NLRP3 shRNA decreases neutrophil infiltration in the liver
We measured the amount of liver neutrophil infiltration by determining the content of MPO. Livers from the sham group had very low levels of MPO. The hepatic MPO levels increased from 0·08 ± 0·02 U/g in sham rats to a peak level of 6·0 ± 1·3 U/g at 12 h in septic rats. Notably, we observed that pretreatment with NLRP3 shRNA decreased MPO levels markedly, with the greatest reduction at 6 h (from 4·5 ± 0·9 U/g in the sepsis group to 1·5 ± 0·3 U/g in the NLRP3 shRNA group, P < 0·001), corresponding to a 67% reduction (Fig. 9a). We also examined the distribution of hepatic neutrophils with immunofluorescence staining, demonstrating the efficacy of NLRP3 shRNA (Fig. 9b).
Figure 9.
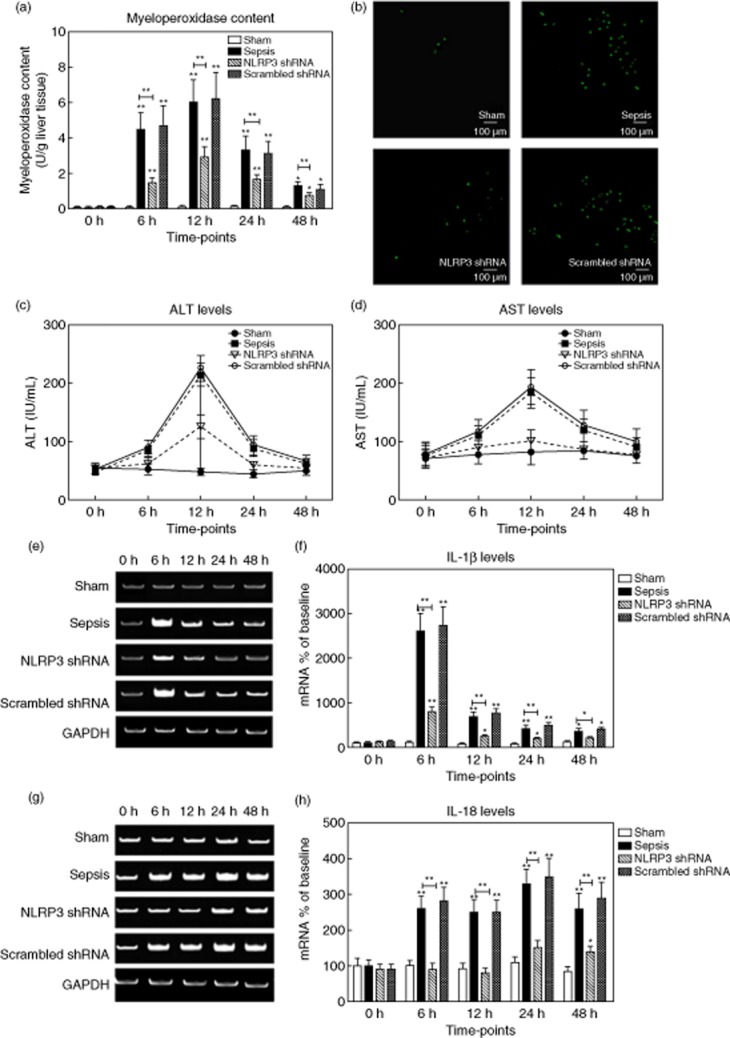
(a,b) Hepatic neutrophil infiltration was determined by myeloperoxidase (MPO) levels. The representative immunofluorescent stainings for neutrophils (green) at 12 h after surgery (original magnification ×100). (c,d) Serum alanine aminotransferase (ALT) and aspartate aminotransferase (AST) levels (IU/ml) were measured in rats from the four groups. (e,f) The representative images of interleukin (IL)-1β mRNA expression by real-time–polymerase chain reaction (RT–PCR) from the four groups at the indicated time-points and the quantitative analysis of mRNA density. (g,h) The representative images of IL-18 mRNA expression by RT–PCR from the four groups and the quantitative analysis of mRNA density. Data are expressed as percentages of the baseline value in the sham group. Data represent mean ± standard deviation, six per group; the experiments were repeated three times. *P < 0·05 versus baseline value in the sham group; **P < 0·001 versus baseline value in the sham group.
The serum aspartate aminotransferase (AST) levels began to increase from 6 h after sepsis, peaking at 245·2 ± 35·3 IU/ml at 12 h, followed by a gradual decrease. The alterations of ALT levels showed a similar pattern. Pretreatment with NLRP3 shRNA exhibited a dramatic reduction in liver enzymes (Fig. 9c,d).
NLRP3 shRNA down-regulates hepatic cytokines
As local cytokines play a key role in liver injury, we evaluated the hepatic levels of IL-1β and IL-18 by RT–PCR. Hepatic IL-1β levels in the sham group were low. The IL-1β levels peaked at 6 h after sepsis (2615·4 ± 406·8% of the baseline value), followed by a gradual decrease. Similarly, IL-18 levels increased progressively (250·6 ± 35·2% of baseline at 12 h, 334·6 ± 40·1% at 24 h and 263·5 ± 45·7% at 48 h, respectively, P < 0·001). Rats pretreated with NLRP3 shRNA exhibited significantly reduced hepatic IL-1β and IL-18 levels compared with the rats in the sepsis and the scrambled shRNA groups at corresponding time-points (P < 0·001) (Fig. 9e–h).
NLRP3 shRNA alleviates RAW264·7 cell pyroptosis
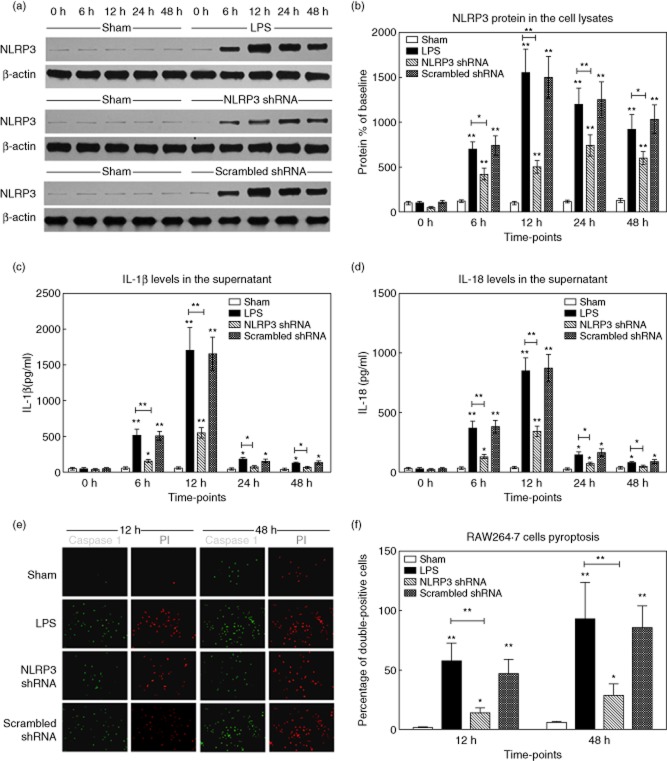
LPS resulted in a time-dependent alteration of NLRP3 protein levels in RAW264·7 cells (710·5 ± 84·5% of baseline at 6 h, 1552·6 ± 265·7% at 12 h, 1207·6 ± 183·8% at 24 h, 923·4 ± 165·0% at 48 h, respectively, versus the sham group, P < 0·001) (Fig. 0a,b). With regard to cytokine levels in cell supernatants, a dramatic increase of IL-1β was observed from 6 h after LPS stimulation (523·4 ± 81·6 pg/ml), and peaked at 12 h. The IL-18 levels changed similarly, which peaked at 855·1 ± 107·6 pg/ml (12 h) (Fig. 0c,d). The NLRP3 protein and IL-1β/IL-18 levels were markedly inhibited in LPS-stimulated RAW264·7 cells transfected with NLRP3 shRNA.
Figure 10.
Gene silencing of non-obese diabetic-like receptor family (NLRP3) in-vitro cell experiments. RAW264·7 cells were transfected with NLRP3 shRNA or scrambled shRNA. The stably transfected cells were stimulated or not with lipopolysaccharide (LPS) (100 ng/ml) for different periods. (a,b) The cell lysates were collected and NLRP3 protein levels were measured by Western blot. The representative images of NLRP3 protein expression and the quantitative analysis of protein density. (c,d) The supernatants in cells culture media from the four groups were analysed for IL-1β and IL-18 by enzyme-linked immunosorbent assay (ELISA). (e) The representative fluorescence microscopy images of pyroptic cells (original magnification ×200). The caspase-1 (green) and propidium iodide (PI) (red) signals were captured, respectively. (f) The percentages of caspase-1 and PI double-positive cells from the four groups at 12 h and 48 h after stimulation. Data are expressed as percentages of the baseline value in the sham group. Data represent mean ± standard deviation; the experiments were repeated three times. *P < 0·05 versus baseline value in the sham group; **P < 0·001 versus baseline value in the sham group.
The extent of pyroptosis in KCs stimulated with LPS was determined by caspase-1 and PI double-staining. In response to LPS, the percentage of caspase-1 and PI double-positive cells increased from 12 h after sepsis, and reached a maximum level at 48 h (93·0 ± 31·2% in group 2 versus 6·0 ± 0·9% in group 1, P < 0·001). Notably, KCs transfected with NLRP3 shRNA (group 3) had a statistically lower frequency of pyroptosis in response to LPS, compared with groups 2 and 4 (P < 0·001) (Fig. 0e,f).
Discussion
In the present study, we demonstrated that gene silencing of NLRP3 protected against sepsis-induced hyper-bileacidaemia. The therapeutic effects were attributed to rehabilitated expression of hepatocyte transporters and reduced neutrophil accumulation, as well as attenuated macrophages pyroptosis and hepatic cytokine levels. To the best of our knowledge, this is the first study to bridge NLRP3 and sepsis-induced hyper-bileacidaemia.
Bile acids are secreted into blood or bile via hepatocyte transporters. When homeostasis is dysregulated, hepatocytes are exposed continuously to high concentrations of bile acid in the sinusoidal blood. Too many bile acids weaken cellular junctions and damage basement membranes, leading to oxidative stress, inflammation and hepatotoxicity 23. The hepatocellular damage is also related to the types of bile acid. GCDCA and TCDCA are the most toxic bile acids, which induce hepatocyte apoptosis by stimulating lipid peroxidation and mitochondrial dysfunction 6. We found that septic rats exhibited significantly higher serum levels of conjugated bile acids than the sham group. Unconjugated bile acids levels did not differ between the groups. This indicates that hepatocytes are still able to conjugate bile acids. The transporter-mediated excretory dysfunction may be responsible for the development of sepsis-induced hyper-bileacidaemia.
After sepsis, we detected elevated NLRP3 at both mRNA and protein levels. The role of NLRP3 has been demonstrated in liver diseases 16, thus targeting that it may be beneficial. Gene silencing with shRNA is more stable than siRNA in vivo 24. Gene transfer into the liver by plasmids can be achieved efficiently 25. Therefore, we applied NLRP3 shRNA plasmids. Compared with gene knock-out, the partial blockade of NLRP3 with shRNA maintains a necessary host defence.
We observed that the expression of basolateral and canalicular transporters altered statistically after sepsis.
There are abundant Mrp2 and Bsep transporters on the hepatocyte canalicular membrane. They mainly transport glycine and taurine-conjugated CA, CDCA and DCA into the bile 26. We observed a down-regulation of Mrp2 (at both mRNA and protein levels) from 12 h after sepsis. However, at 6 h there was only a moderate decrease in Mrp2 mRNA levels. The Mrp2 transporter could be impaired by endotoxin, oxidative stress and cytokines 27. After sepsis, we noted a dramatic decrease in Bsep mRNA levels, but a moderate alteration in protein levels. This was in accordance with previous studies showing that down-regulation of Bsep protein was much less pronounced than Mrp2 protein 28. It is suggested that endotoxin induces the retrieval of Mrp2/Bsep from the canalicular membrane into cytoplasmic vesicles. The retrieval occurs even before down-regulation of mRNA and protein levels 29. Therefore, we speculated that the early phase of hyper-bileacidaemia is due primarily to retrieval of transporters, whereas hyper-bileacidaemia at a later time is due to the synergistic effects of retrieval and down-regulation of transporters.
We observed down-regulation of Mrp2/Bsep expression, but up-regulation of Mrp3/Mrp4 expression during sepsis. Mrp3 and Mrp4 are the main basolateral transporters for glycine and taurine-CA, CDCA and DCA 5. This is in keeping with the selective increase in serum levels of glycine and taurine-conjugated bile acids. Mrp3 and Mrp4 serve as alternative escape routes for cytotoxic compounds from hepatocytes into sinusoidal blood 30.The up-regulation of Mrp3/Mrp4 expression may compensate for the down-regulation of Mrp2/Bsep expression. Compared to the drastically elevated levels of Mrp4 protein, Mrp4 mRNA levels were relatively preserved, indicating a post-transcriptional regulation.
Reduction of Mrp2/Bsep and the concomitant increase of Mrp3/Mrp4 may account for sepsis-induced hyper-bileacidaemia. The expression of canalicular transporters was decreased by sepsis but almost restored to normal levels by NLRP3 shRNA. Additionally, rehabilitated canalicular transporters maintain enterohepatic circulation, which plays a critical role in excretion of cholesterol, clearance of toxic molecules, absorption of nutrients and inhibition of intestine bacteria 31. We inferred that, with pretreatment of NLRP3 shRNA, the rehabilitation of canalicular transporters and inhibition of compensatory elevation of basolateral transporters protect against sepsis-induced hyper-bileacidaemia.
The NLRP3 shRNA mediated a rehabilitation of canalicular transporters. There are several explanations for this effect.
First, NLRP3 shRNA reduces the production of NLRP3 inflammasome-originated IL-1β/IL-18. IL-1β and IL-18 are capable of activating neutrophils and macrophages, promoting the recruitment of neutrophils to the organs, thus further inducing NLRP3 inflammasome activation 32. More importantly, IL-1β and IL-18 predominate in the dysfunction of canalicular transporters. The anti-IL-1β treatment prevented down-regulation of hepatic Mrp2 expression in septic rats 33. As shown in the Supporting information, Fig. S3, liver histology demonstrated that pretreatment with anti-IL-1β blockade attenuated liver injury induced by IL-1β. We speculated that IL-1β impairs hepatocytes directly and IL-1β is the real proof of concept of why NLRP3 gene silencing works. Additionally, when IL-18 was neutralized, hepatic Mrp2 protein levels were preserved in patients with enterocolitis 34. We noted that hepatic levels of IL-1β and IL-18 increased dramatically after sepsis, but declined significantly with the pretreatment of NLRP3 shRNA. It has been recognized that transporters (Mrp2 and Bsep) are located on hepatocyte canalicular membranes 26. Taken together, gene silencing of NLRP3 protects canalicular transporters through reducing IL-1β levels.
Secondly, NLRP3 shRNA ameliorates hepatic neutrophil accumulation. McDonald . reported that NLRP3-deficiency significantly reduced the quantity of recruited neutrophils by decreasing cytokines and chemokines 35. In the present study, MPO analysis revealed extensive hepatic neutrophils accumulation in septic rats. The influx of neutrophils was greatly reduced by NLRP3 shRNA. Activated neutrophils kill invading bacteria. However, the lysozyme, myeloperoxidase, elastase, cathepsin G and cationic proteins released from neutrophils impair expression and function of hepatocyte canalicular transporters directly 36. Apart from NLRP3 inflammasome, other proteinases are able to cleave pro-IL-1β and pro-IL-18 to their active forms. Proteinase 3 and granzyme B, which are present principally in neutrophils, could cleave pro-IL-1β and pro-IL-18 efficiently 37. Cumulatively, NLRP3 shRNA rehabilitates the canalicular transporters via decreasing the neutrophil-originated IL-1β/IL-18, as well as attenuating the direct injury on transporters exerted by neutrophils.
Thirdly, NLRP3 shRNA reduces macrophages pyroptosis. Pyroptosis is a caspase-1-dependent and proinflammatory process. Pyroptosis develops pore formation in cell membranes, resulting in caspase-1 and PI double-positive staining. Pyroptosis is the hallmark of inflammasome activation 15. Pyroptosis could limit bacteria replication and remove intoxicated cells. However, it also leads to the breakdown of cell membranes and release of proinflammatory contents, including ATP, reactive oxygen species (ROS), heat shock proteins, DNA fragments and inflammatory cytokines. Pyroptosis is also responsible for hepatic neutrophil infiltration 38. Pyroptosis, in turn, activates NLRP3 inflammasome, amplifying the inflammation cascades 39. Detailed analysis revealed principal NLRP3 expression in hepatic macrophages; thus, pyroptosis mainly occurs in these cells during sepsis. Nominally, hepatic macrophages are the primary source of IL-1β/IL-18 40. Taken together, it is conceivable that profound cytokines released from pyroptic macrophages impair hepatocyte transporters. The isolation of macrophages from the liver may damage cells and interfere with results. Therefore, we investigated the effect of NLRP3 shRNA on macrophage in-vitro experiments by using a macrophage cell line (RAW264·7 cells). Challenge with LPS resulted in increased expression of NLRP3 in RAW264·7 cells. Similar to in-vivo experiments, NLRP3 protein levels in cell lysates were suppressed in the NLRP3 shRNA group, as well as IL-1β/IL-18 levels in cell supernatants. We found extensive RAW264·7 cells pyroptosis in response to LPS stimulation. Gene silencing of NLRP3 significantly depressed RAW264·7 cells pyroptosis, but pyroptosis in this group was still greater than the sham group. The absent in melanoma 2 (AIM2), NLRP1, NLR family CARD domain-containing protein 4 (NLRC4) and neuronal apoptosis inhibitory protein (NAIP) inflammasomes could also induce pyroptosis in macrophages, which may explain this partial inhibition effect 41. Complete inhibition of pyroptosis may be deleterious. Maintaining pyroptosis at suitable levels is essential to protect against infections.
Further investigations are warranted. First, gene-silencing plasmids are not applicable in clinics. More valid methods, such as viral vector carriers or targeted nanodrugs, should be explored. The pretreatment protocol applies to people who are at high risk of developing sepsis. Notably, we detected time-dependent effectiveness of NLRP3 shRNA. Whether NLRP3 shRNA application after sepsis is effective remains to be seen. Secondly, hepatocyte transporter-based therapies should be considered. Ursodeoxycholic acid and tauroursodeoxycholic acid could increase the expression of Mrp2/Bsep by extending their half-life time 42. The 4-phenylbutyrate could also increase Bsep expression 43.Thirdly, the underlying signal pathways need to be clarified. Toll/IL-1R resistance (TIR) domain-containing adapter-inducing interferon (IFN)-β (TRIF) signalling is essential for NLRP3 inflammasome activation, especially in enteric infections 44. The phosphatidylinositol-3-kinase has been shown to regulate canalicular transporters 2.
In conclusion, gene silencing of NLRP3 ameliorates sepsis-induced hyper-bileacidaemia. The protective efficacy is correlated with rehabilitated hepatocyte transporters and inhibited hepatic neutrophil accumulation, as well as attenuated macrophage pyroptosis. These results provide the rationale for designing therapeutic strategies in clinics.
Acknowledgments
This work was supported by grants from the National Nature Science Foundation of China (30872456/ H1502).
Disclosure
None of the authors had any conflicts of interest regarding the study, nor do any of the authors have anything to disclose.
Supporting Information
Fig. S1. (a) The non-obese (NOD) diabetic-like receptor family (NLRP3) mRNA levels in various organs of normal rats. (b–f) Time–course of NLRP3 mRNA expression in major organs after injection of NLRP3 shRNA plasmids (in normal rats). The NLRP3 mRNA levels were determined by quantitative real-time–polymerase chain reaction (qRT–PCR). Data are expressed as percentages of the baseline value. Data represent as mean ± standard deviation; n = 6 per group; the experiments were repeated three times. *P < 0·05 versus baseline value.
Fig. S2. The fluorescence microscopy images of non-obese diabetic (NOD)-like receptor family (NLRP3) shRNA plasmids distribution in major organs. Normal rats were injected via the tail vein with 8 μg/g NLRP3 shRNA plasmids carrying green fluorescent protein (Clontech, Palo Alto, CA, USA). Organs were harvested 48 h after injection.
Fig. S3. The representative histological images of the liver (haematoxylin and eosin staining, original magnification ×100 or ×400). The large black box indicates the amplification of the zone marked with the small box. (a) Liver tissues of the sham group. (b) Rats were infused with interleukin (IL)-1β [2 μg/kg injected intravenously (i.v.); Abcam, Cambridge, UK]. The liver tissues were collected 48 h after infusion. Blue arrow points to necrosis; yellow arrow points to steatosis; black arrow points to haemorrhage. (c) Rats were infused with anti-IL-1β antibody (200 μg/body i.v.; Abcam, Cambridge, UK) immediately prior to IL-1β infusion (2 μg/kg i.v.; Abcam). Black arrow points to congestion. The liver tissues were collected 48 h after infusion; six per group; the experiments were repeated three times.
References
- Marshall JC. The liver in sepsis: shedding light on the cellular basis of hepatocyte dysfunction. Crit Care. 2013;17:153–154. doi: 10.1186/cc12731. [DOI] [PMC free article] [PubMed] [Google Scholar]
- Recknagel P, Gonnert FA, Westermann M. Liver dysfunction and phosphatidylinositol-3-kinase signalling in early sepsis: experimental studies in rodent models of peritonitis. PLOS Med. 2012;9:e1001338. doi: 10.1371/journal.pmed.1001338. [DOI] [PMC free article] [PubMed] [Google Scholar]
- Sturm E, Wagner M, Trauner M. Nuclear receptor ligands in therapy of cholestatic liver disease. Front Biosci (Landmark edn) 2009;14:4299–4325. doi: 10.2741/3529. [DOI] [PubMed] [Google Scholar]
- Muller M, Jansen PL. Molecular aspects of hepatobiliary transport. Am J Physiol. 1997;272:G1285–1303. doi: 10.1152/ajpgi.1997.272.6.G1285. [DOI] [PubMed] [Google Scholar]
- Mennone A, Soroka CJ, Cai SY. Mrp4–/– mice have an impaired cytoprotective response in obstructive cholestasis. Hepatology. 2006;43:1013–1021. doi: 10.1002/hep.21158. [DOI] [PubMed] [Google Scholar]
- Vanwijngaerden YM, Wauters J, Langouche L. Critical illness evokes elevated circulating bile acids related to altered hepatic transporter and nuclear receptor expression. Hepatology. 2011;54:1741–1752. doi: 10.1002/hep.24582. [DOI] [PubMed] [Google Scholar]
- Geier A, Dietrich CG, Voigt S. Cytokine-dependent regulation of hepatic organic anion transporter gene transactivators in mouse liver. Am J Physiol Gastrointest Liver Physiol. 2005;289:G831–841. doi: 10.1152/ajpgi.00307.2004. [DOI] [PubMed] [Google Scholar]
- Mariathasan S, Monack DM. Inflammasome adaptors and sensors: intracellular regulators of infection and inflammation. Nat Rev Immunol. 2007;7:31–40. doi: 10.1038/nri1997. [DOI] [PubMed] [Google Scholar]
- Negash AA, Ramos HJ, Crochet N. IL-1beta production through the NLRP3 inflammasome by hepatic macrophages links hepatitis C virus infection with liver inflammation and disease. PLOS Pathog. 2013;9:e1003330. doi: 10.1371/journal.ppat.1003330. [DOI] [PMC free article] [PubMed] [Google Scholar]
- Zhu P, Duan L, Chen J. Gene silencing of NALP3 protects against liver ischemia–reperfusion injury in mice. Hum Gene Ther. 2011;22:853–864. doi: 10.1089/hum.2010.145. [DOI] [PubMed] [Google Scholar]
- Henao-Mejia J, Elinav E, Jin C. Inflammasome-mediated dysbiosis regulates progression of NAFLD and obesity. Nature. 2012;482:179–185. doi: 10.1038/nature10809. [DOI] [PMC free article] [PubMed] [Google Scholar]
- Artlett CM. The role of the NLRP3 inflammasome in fibrosis. Open Rheumatol J. 2012;6:80–86. doi: 10.2174/1874312901206010080. [DOI] [PMC free article] [PubMed] [Google Scholar]
- Iyer SS, Pulskens WP, Sadler JJ. Necrotic cells trigger a sterile inflammatory response through the Nlrp3 inflammasome. Proc Natl Acad Sci USA. 2009;106:20388–20393. doi: 10.1073/pnas.0908698106. [DOI] [PMC free article] [PubMed] [Google Scholar]
- Boaru SG, Borkham-Kamphorst E, Tihaa L, Haas U, Weiskirchen R. Expression analysis of inflammasomes in experimental models of inflammatory and fibrotic liver disease. J Inflamm (Lond) 2012;9:49–64. doi: 10.1186/1476-9255-9-49. [DOI] [PMC free article] [PubMed] [Google Scholar]
- Bergsbaken T, Fink SL, Cookson BT. Pyroptosis: host cell death and inflammation. Nat Rev Microbiol. 2009;7:99–109. doi: 10.1038/nrmicro2070. [DOI] [PMC free article] [PubMed] [Google Scholar]
- Ganz M, Csak T, Nath B, Szabo G. Lipopolysaccharide induces and activates the Nalp3 inflammasome in the liver. World J Gastroenterol. 2011;17:4772–4778. doi: 10.3748/wjg.v17.i43.4772. [DOI] [PMC free article] [PubMed] [Google Scholar]
- Liu Z, Zaki MH, Vogel P. Role of inflammasomes in host defense against Citrobacter rodentium infection. J Biol Chem. 2012;287:16955–16964. doi: 10.1074/jbc.M112.358705. [DOI] [PMC free article] [PubMed] [Google Scholar]
- Meixenberger K, Pache F, Eitel J. Listeria monocytogenes-infected human peripheral blood mononuclear cells produce IL-1beta, depending on listeriolysin O and NLRP3. J Immunol. 2010;184:922–930. doi: 10.4049/jimmunol.0901346. [DOI] [PubMed] [Google Scholar]
- Johnson JL, Hong H, Monfregola J, Catz SD. Increased survival and reduced neutrophil infiltration of the liver in Rab27a- but not Munc13-4-deficient mice in lipopolysaccharide-induced systemic inflammation. Infect Immun. 2011;79:3607–3618. doi: 10.1128/IAI.05043-11. [DOI] [PMC free article] [PubMed] [Google Scholar]
- Camargo CA, Jr, Madden JF, Gao W, Selvan RS, Clavien PA. Interleukin-6 protects liver against warm ischemia/reperfusion injury and promotes hepatocyte proliferation in the rodent. Hepatology. 1997;26:1513–1520. doi: 10.1002/hep.510260619. [DOI] [PubMed] [Google Scholar]
- Scherer M, Gnewuch C, Schmitz G, Liebisch G. Rapid quantification of bile acids and their conjugates in serum by liquid chromatography–tandem mass spectrometry. J Chromatogr B Analyt Technol Biomed Life Sci. 2009;877:3920–3925. doi: 10.1016/j.jchromb.2009.09.038. [DOI] [PubMed] [Google Scholar]
- Lilo S, Zheng Y, Bliska JB. Caspase-1 activation in macrophages infected with Yersinia pestis KIM requires the type III secretion system effector YopJ. Infect Immun. 2008;76:3911–3923. doi: 10.1128/IAI.01695-07. [DOI] [PMC free article] [PubMed] [Google Scholar]
- Allen K, Jaeschke H, Copple BL. Bile acids induce inflammatory genes in hepatocytes: a novel mechanism of inflammation during obstructive cholestasis. Am J Pathol. 2011;178:175–186. doi: 10.1016/j.ajpath.2010.11.026. [DOI] [PMC free article] [PubMed] [Google Scholar]
- Lee SK, Kumar P. Conditional RNAi: towards a silent gene therapy. Adv Drug Deliv Rev. 2009;61:650–664. doi: 10.1016/j.addr.2009.03.016. [DOI] [PubMed] [Google Scholar]
- Jacobs F, Wisse E, De Geest B. The role of liver sinusoidal cells in hepatocyte-directed gene transfer. Am J Pathol. 2010;176:14–21. doi: 10.2353/ajpath.2010.090136. [DOI] [PMC free article] [PubMed] [Google Scholar]
- Halilbasic E, Claudel T, Trauner M. Bile acid transporters and regulatory nuclear receptors in the liver and beyond. J Hepatol. 2013;58:155–168. doi: 10.1016/j.jhep.2012.08.002. [DOI] [PMC free article] [PubMed] [Google Scholar]
- Hartmann G, Cheung AK, Piquette-Miller M. Inflammatory cytokines, but not bile acids, regulate expression of murine hepatic anion transporters in endotoxemia. J Pharmacol Exp Ther. 2002;303:273–281. doi: 10.1124/jpet.102.039404. [DOI] [PubMed] [Google Scholar]
- Lee JM, Trauner M, Soroka CJ, Stieger B, Meier PJ, Boyer JL. Expression of the bile salt export pump is maintained after chronic cholestasis in the rat. Gastroenterology. 2000;118:163–172. doi: 10.1016/s0016-5085(00)70425-2. [DOI] [PubMed] [Google Scholar]
- Dombrowski F, Kubitz R, Chittattu A, Wettstein M, Saha N, Haussinger D. Electron-microscopic demonstration of multidrug resistance protein 2 (Mrp2) retrieval from the canalicular membrane in response to hyperosmolarity and lipopolysaccharide. Biochem J. 2000;348:183–188. [PMC free article] [PubMed] [Google Scholar]
- Bhogal HK, Sanyal AJ. The molecular pathogenesis of cholestasis in sepsis. Front Biosci (Elite edn) 2013;5:87–96. doi: 10.2741/e598. [DOI] [PMC free article] [PubMed] [Google Scholar]
- Hofmann AF. The enterohepatic circulation of bile acids in mammals: form and functions. Front Biosci (Landmark edn) 2009;14:2584–2598. doi: 10.2741/3399. [DOI] [PubMed] [Google Scholar]
- Lemos HP, Grespan R, Vieira SM. Prostaglandin mediates IL-23/IL-17-induced neutrophil migration in inflammation by inhibiting IL-12 and IFNgamma production. Proc Natl Acad Sci USA. 2009;106:5954–5959. doi: 10.1073/pnas.0812782106. [DOI] [PMC free article] [PubMed] [Google Scholar]
- Geier A, Dietrich CG, Voigt S. Effects of proinflammatory cytokines on rat organic anion transporters during toxic liver injury and cholestasis. Hepatology. 2003;38:345–354. doi: 10.1053/jhep.2003.50317. [DOI] [PubMed] [Google Scholar]
- Cherrington NJ, Estrada TE, Frisk HA. The hepatic bile acid transporters Ntcp and Mrp2 are downregulated in experimental necrotizing enterocolitis. Am J Physiol Gastrointest Liver Physiol. 2013;304:G48–56. doi: 10.1152/ajpgi.00317.2012. [DOI] [PMC free article] [PubMed] [Google Scholar]
- McDonald B, Pittman K, Menezes GB. Intravascular danger signals guide neutrophils to sites of sterile inflammation. Science. 2010;330:362–366. doi: 10.1126/science.1195491. [DOI] [PubMed] [Google Scholar]
- Laschke MW, Menger MD, Wang Y, Lindell G, Jeppsson B, Thorlacius H. Sepsis-associated cholestasis is critically dependent on P-selectin-dependent leukocyte recruitment in mice. Am J Physiol Gastrointest Liver Physiol. 2007;292:G1396–1402. doi: 10.1152/ajpgi.00539.2006. [DOI] [PubMed] [Google Scholar]
- Omoto Y, Yamanaka K, Tokime K. Granzyme B is a novel interleukin-18 converting enzyme. J Dermatol Sci. 2010;59:129–135. doi: 10.1016/j.jdermsci.2010.05.004. [DOI] [PubMed] [Google Scholar]
- Martin-Murphy BV, Holt MP, Ju C. The role of damage associated molecular pattern molecules in acetaminophen-induced liver injury in mice. Toxicol Lett. 2010;192:387–394. doi: 10.1016/j.toxlet.2009.11.016. [DOI] [PMC free article] [PubMed] [Google Scholar]
- Fink SL, Cookson BT. Caspase-1-dependent pore formation during pyroptosis leads to osmotic lysis of infected host macrophages. Cell Microbiol. 2006;8:1812–1825. doi: 10.1111/j.1462-5822.2006.00751.x. [DOI] [PubMed] [Google Scholar]
- Taylor PR, Martinez-Pomares L, Stacey M, Lin HH, Brown GD, Gordon S. Macrophage receptors and immune recognition. Annu Rev Immunol. 2005;23:901–944. doi: 10.1146/annurev.immunol.23.021704.115816. [DOI] [PubMed] [Google Scholar]
- Fernandes-Alnemri T, Yu JW, Juliana C. The AIM2 inflammasome is critical for innate immunity to Francisella tularensis. Nat Immunol. 2010;11:385–393. doi: 10.1038/ni.1859. [DOI] [PMC free article] [PubMed] [Google Scholar]
- Kagawa T, Orii R, Hirose S. Ursodeoxycholic acid stabilizes the bile salt export pump in the apical membrane in MDCK II cells. J Gastroenterol. 2013;49:890–899. doi: 10.1007/s00535-013-0833-y. [DOI] [PubMed] [Google Scholar]
- Hayashi H, Sugiyama Y. 4-phenylbutyrate enhances the cell surface expression and the transport capacity of wild-type and mutated bile salt export pumps. Hepatology. 2007;45:1506–1516. doi: 10.1002/hep.21630. [DOI] [PubMed] [Google Scholar]
- Rathinam VA, Vanaja SK, Waggoner L. TRIF licenses caspase-11-dependent NLRP3 inflammasome activation by gram-negative bacteria. Cell. 2012;150:606–619. doi: 10.1016/j.cell.2012.07.007. [DOI] [PMC free article] [PubMed] [Google Scholar]
Associated Data
This section collects any data citations, data availability statements, or supplementary materials included in this article.
Supplementary Materials
Fig. S1. (a) The non-obese (NOD) diabetic-like receptor family (NLRP3) mRNA levels in various organs of normal rats. (b–f) Time–course of NLRP3 mRNA expression in major organs after injection of NLRP3 shRNA plasmids (in normal rats). The NLRP3 mRNA levels were determined by quantitative real-time–polymerase chain reaction (qRT–PCR). Data are expressed as percentages of the baseline value. Data represent as mean ± standard deviation; n = 6 per group; the experiments were repeated three times. *P < 0·05 versus baseline value.
Fig. S2. The fluorescence microscopy images of non-obese diabetic (NOD)-like receptor family (NLRP3) shRNA plasmids distribution in major organs. Normal rats were injected via the tail vein with 8 μg/g NLRP3 shRNA plasmids carrying green fluorescent protein (Clontech, Palo Alto, CA, USA). Organs were harvested 48 h after injection.
Fig. S3. The representative histological images of the liver (haematoxylin and eosin staining, original magnification ×100 or ×400). The large black box indicates the amplification of the zone marked with the small box. (a) Liver tissues of the sham group. (b) Rats were infused with interleukin (IL)-1β [2 μg/kg injected intravenously (i.v.); Abcam, Cambridge, UK]. The liver tissues were collected 48 h after infusion. Blue arrow points to necrosis; yellow arrow points to steatosis; black arrow points to haemorrhage. (c) Rats were infused with anti-IL-1β antibody (200 μg/body i.v.; Abcam, Cambridge, UK) immediately prior to IL-1β infusion (2 μg/kg i.v.; Abcam). Black arrow points to congestion. The liver tissues were collected 48 h after infusion; six per group; the experiments were repeated three times.


