Abstract
Recent increases in deciduous shrub cover are a primary focus of terrestrial Arctic research. This study examined the historic spatial patterns of shrub expansion on the North Slope of Alaska to determine the potential for a phase transition from tundra to shrubland. We examined the historic variability of landscape-scale tall shrub expansion patterns on nine sites within river valleys in the Brooks Range and North Slope uplands (BRNS) between the 1950s and circa 2010 by calculating percent cover (PCTCOV), patch density (PADENS), patch size variability (CVSIZE), mean nearest neighbor distance (MEDIST) and the multi-scale information fractal dimension (dI) to assess spatial homogeneity for shrub cover. We also devised conceptual models for trends in these metrics before, during, and after a phase transition, and compared these to our results. By developing a regression equation between PCTCOV and dI and using universal critical dI values, we derived the PCTCOV required for a phase transition to occur. All nine sites exhibited increases in PCTCOV. Five of the nine sites exhibited an increase in PADENS, seven exhibited an increase in CVSIZE, and five exhibited a decrease in MEDIST. The dI values for each site exceeded the requirements necessary for a phase transition. Although fine-scale heterogeneity is still present, landscape-scale patterns suggest our study areas are either currently in a state of phase transition from tundra to shrubland or are progressing towards spatial homogeneity for shrubland. Our results indicate that the shrub tundra in the river valleys of the north slope of Alaska has reached a tipping point. If climate trends observed in recent decades continue, the shrub tundra will continue towards homogeneity with regard to the cover of tall shrubs.
Keywords: Alaska, Arctic, landscape analysis, phase transition, shrub expansion, tundra
Introduction
Recent increases in productivity and shifts in tundra vegetation composition are attributable to an increase in deciduous shrub cover (e.g. Salix, Betula, and Alnus spp.) within the shrub-tundra ecotone. This shift and its resulting biotic and abiotic feedbacks are now a primary focus of terrestrial Arctic research (Sturm et al. 2001, 2005; Chapin et al. 2005; Tape et al. 2006; Loranty et al. 2011; Myers-Smith et al. 2011). Generally, studies have focused on shrub expansion and its environmental drivers at circumpolar and regional or plot-level scales (Naito and Cairns 2011a). Circumpolar or regional scale studies have utilised the normalised difference vegetation index derived from satellite data to infer changes in productivity. These increases in productivity correlate with increases in temperature (Goetz et al. 2005; Jia et al. 2006; Pouliot et al. 2008; Verbyla 2008; Beck and Goetz 2011). Recently, regional satellite-based maps of shrub cover changes using a combination of satellite products have become available (Forbes et al. 2010; Beck and Goetz 2011; Beck et al. 2011; Frost et al. 2013). Observational and experimental work at fine spatial scales suggest that shrub development is influenced by a host of interacting factors, including temperature, hydrology, biogeochemical cycling, edaphic characteristics, disturbance, and herbivory (Walker et al. 2003; Olofsson et al. 2004; DeMarco et al. 2011; Myers-Smith et al. 2011). Also, plot-level studies have revealed that warming has promoted increases in mean canopy height and shrub height (Elmendorf et al. 2012b).
Observed patterns of shrub expansion are heterogeneous (Lantz et al. 2010b; Raynolds et al. 2012, 2013; Tape et al. 2012; Walker et al. 2012). Analysis of 202 pairs of repeat photographs across the northern Brooks Range and North Slope uplands (BRNS) of Alaska indicated increases in shrub cover ranging from 3% to 80%, with the greatest increases occurring in floodplains and along valley slopes and only minimal changes on interfluves (Tape et al. 2006). In addition, shrub expansion patterns manifest themselves as an increase in the size (areal extent and height) and number of patches, in-filling of patches, and latitudinal and altitudinal advances (Tape et al. 2006; Hallinger et al. 2010; Myers-Smith et al. 2011). Tape et al. (2012) note both expanding and stable patches are present in Northern Alaska. Expanding patches are associated with higher resource environments (e.g., floodplains, stream corridors), while stable patches are associated with low-resource environments (e.g., shallow permafrost). Naito and Cairns (2011b) suggested that shrub expansion is promoted in areas where the potential for water throughflow and accumulation is greater. These findings collectively suggest that landscape features are important considerations when predicting the future state of the Arctic vegetation cover. Interactions between climate and landscape features may also promote nonlinear ecological responses (Burkett et al. 2005).
Although we are beginning to understand some of the processes involved in the observed changes in the Arctic shrub-tundra, the patterns of shrub change are not yet well understood, especially at the landscape scale. Landscape pattern can inform us about the trajectory of shifts between vegetation types, especially when it is considered within the context of ecological phase transition theory. Loehle et al. (1996) proposed ecological phase transition theory to explain ecotone dynamics in response to environmental change. A vegetation phase refers to the state of a dominant life-form (e.g., trees, shrubs, grasslands) that is different from other possible states in the ecosystem (Uzunov 1993; Li 2002). Uzunov (1993) defines a phase transition as “a qualitative change in the state of a system under a continuous infinitesimal change in external parameters.” Therefore, shifts between vegetation phases are roughly analogous to the changes that occur between different phases of matter (Milne et al. 1996; Li 2002). In a biological system, a phase is susceptible to transition if biological or environmental variability exceeds its range of self-regulation (Gillson and Ekblom 2009). Combinations of extreme events and/or biotic and abiotic factors may cause a reorganization of ecosystem structure and function, initiating a phase transition. In such a transition, interactions are reorganised, and a new phase can emerge (Gillson and Ekblom 2009). In the context of tundra ecosystems, climatic warming is a primary external forcing that could override finer-scale processes (Chapin et al. 2005; McGuire et al. 2006; Lawrence and Swenson 2011), thereby resulting in a phase transition.
Ecological phase transition theory is based on percolation processes in thermodynamic models and employs fractal analysis to characterise ecosystem heterogeneity and ecotonal dynamics (Milne et al. 1996; Li 2000; Alados et al. 2005), making it well-suited to studying plant invasion. Critical values derived from percolation theory can be used to evaluate the potential for ecotone migration (Loehle et al. 1996). These critical values can be universally applied to detect a phase transition regardless of the spatial configuration of the invading phase or scale of analysis. As a result, they can be applied to a variety of ecotones. Phase transitions have been observed in a number of ecosystems, including the North American savannas, Mediterranean scrubland, boreal forests, and alpine treeline (Rocchini et al. 2006; Zeng and Malanson 2006; Danby and Hik 2007; Alados et al. 2009; Gillson and Ekblom 2009; Scheffer et al. 2012). Phase transition theory has not yet been applied to Arctic ecosystems.
An ecotone is a transitional area between individual phases (Loehle et al. 1996; Milne et al. 1996). Ecotones are typically situated on environmental gradients that can affect key ecological processes or organism distribution or on more gradual gradients where thresholds or nonlinear responses to these gradients can lead to significant changes in ecosystem dynamics and dominant species distribution. If environmental conditions change such that it is beneficial for one of the phases, the patch size of the focal phase will increase in the ecotone system (Risser 1995). This will lead to the invasion of previously unsuitable habitats. Since many ecotones already occur at the physiological limits of species in the adjacent communities, an external forcing like climate change could promote the invasion of one species by another (Risser 1995).
Loehle et al. (1996) used the multi-scale information fractal dimension (dI) to characterise spatial patterns of forest spread into prairie in eastern Kansas. The dI is a measure of deviation from spatial homogeneity used to detect phase transitions at multiple spatial scales. The median dI describes the state of the entire landscape, and the dI profiles provide an interpretation of landscape heterogeneity as scale changes. The dI values range between 0 and 2, where dI < 1 indicates a fragmented landscape, 1 < dI < 2 indicates a heterogeneous landscape, and dI = 2 indicates a homogenous landscape (Loehle and Li 1996). Loehle et al. (1996) propose that an ecotone is present on a landscape for critical values 1.56 ≤ dI ≤ 1.8958; at 1.7951 ≤ dI ≤ 1.8285, the invading phase can spread to the entire landscape and initiate a phase transition. These critical values used in interpreting landscapes are based on percolation theory and can be related to percent cover using linear regression to derive critical forest percent cover values needed to initiate a phase transition (Loehle et al. 1996). In the Kansas case, forest cover could spread to the entire landscape after reaching a critical value of 18.5%. Since their data indicated that forest cover was approaching 20%, Loehle et al. (1996) argued that their landscape was undergoing a phase transition. Our goal, here, is to apply phase transition theory to an Arctic tundra landscape to evaluate if a phase transition is occurring.
In this study, we characterised landscape patterns of Arctic shrub expansion throughout the BRNS of northern Alaska and evaluated the potential of a local-scale phase transition from tundra to shrubland. Specifically, we examined the historic variability of tall (Alnus, Betula, and Salix spp.) shrub expansion patterns in nine river valleys using vertical imagery at two or three dates between the 1950s and c. 2010 using pattern metric analysis and the dI. We sought sites that encompassed both floodplains and upslope areas that include valley slopes and higher elevation interfluves. This provided an opportunity to examine previously reported patterns of expansion (Tape et al. 2006; Myers-Smith et al. 2011) within the context of phase transition theory. We focused on transition areas between shrub tundra and other tundra types on hillslopes believed to be sensitive to environmental changes (e.g., Epstein et al. 2004) and therefore susceptible to phase transition.
Methods
Study area
The BRNS comprise approximately 220,000 km2 of land area in northern Alaska. Broad river valleys separated by interfluves are a key constituent of this landscape. The mean summer (June, July, August) temperature at Bettles Airport, Alaska is 8.02°C (SD 0.99), while the mean annual precipitation is 311 mm (National Climatic Data Center, 1955–2010 observations; available online). Vegetation assemblages are characteristic of the Arctic Bioclimate Subzone E (Walker et al. 2005). Dominant species include Alnus spp., Betula glandulosa, B. nana, and Salix spp. (Viereck et al. 1992; Walker et al. 2005; Tape et al. 2006). We focused on nine river valleys in the BRNS (Ayiyak, Chandler, Colville, Killik, Kurupa, Nanushuk, Nigu, and Nimiuktuk) (Fig.1). Five of these sites correspond to ones examined in a previous study (Naito and Cairns 2011b); however, that study investigated the influence of river dynamics and topographic controls on hydrology on general patterns of shrub development.
Figure 1.
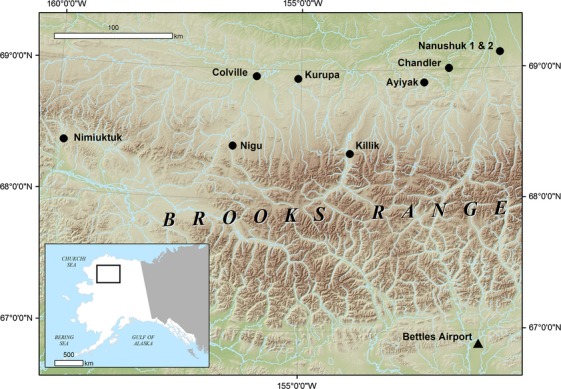
Location of the nine landscapes used in this study across the Brooks Range and North Slope uplands (indicated with a black circle) and the location of Bettles Airport weather station which served as the source of climate data in this study (indicated with a black triangle).
We calculated mean annual summer air temperature values for the 55-year period for Bettles from the NCDC data air temperature values for the 55-year period for Bettles from the NCDC data and used least-squares regression to develop a linear temperature trend line. We then calculated air temperature anomalies from this trend line (Fig.2). This trend line indicated an annual temperature increase of 0.013°C.
Figure 2.
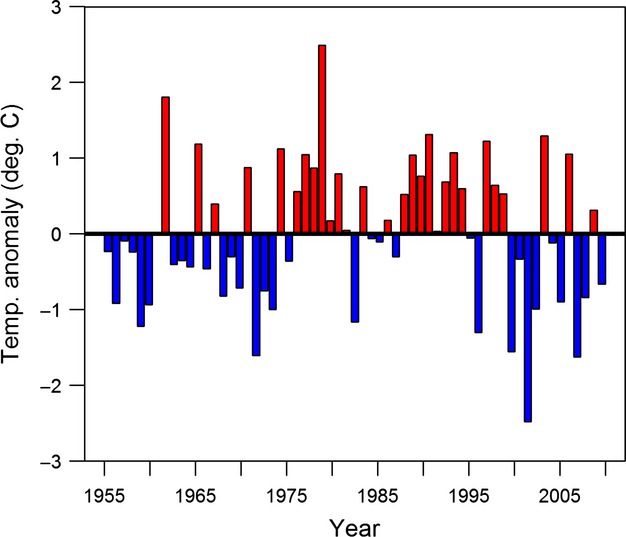
Anomalies from least squares trend line for averaged June-July-August (JJA) mean monthly temperatures from Bettles Airport, Alaska from 1955 to 2010. Blue bars indicate negative temperature anomalies and red bars indicated positive temperature anomalies.
Image processing and vegetation mapping
We acquired digital scans of historic vertical aerial photographs (true colour, colour infrared, and panchromatic) of the BRNS sites from the United States Geological Survey Earth Resources Observation and Science (USGS EROS) website. These images were taken in the mid-1950s, 1970s, and 1980s (Table1). These are the best data available over the period of known changes in shrub cover. We also acquired nine geographically referenced and terrain-corrected archival Quick Bird-2 (QB), WorldView-1 (WV), GeoEye-1 (GE), and IKONOS 2 (IK) images of these areas dating from the late 2000s (Table1). The QB and GE images were pan-sharpened to a horizontal resolution of 0.5 m prior to purchase. The panchromatic (0.8 m native resolution) and multispectral (3.2 m native resolution) bands of the IK products were delivered separately. We pan-sharpened the IK images using the Gram-Schmidt transformation algorithm in ENVI 4.7 (Exelis Visual Information Solutions, Boulder, Colorado, USA 2009). We then co-registered the EROS imagery to the QB/WV/GE/IK imagery (satellite imagery) using ENVI 4.7. All imagery was then resampled to a common pixel resolution of 1 m.
Table 1.
Description and source of the images used for study sites Ayiyak, Chandler, Colville, Killik, Kurupa, Nanushuk 1, Nanushuk 2, and Nimiuktuk
| Site specifications | Image specification | ||||||
|---|---|---|---|---|---|---|---|
| Site | Location | Dimensions (m) | Area (ha) | Source | Type | Acquisition date | Native resolution |
| Ayiyak | 68° 54′ 33″ N | 1534 × 2048 | 314 | USGS1 | CIR2 | 13 Jul, 1979 | 0.92 |
| 152° 27′ 59″ W | USGS | CIR | 2 Aug, 1985 | 0.93 | |||
| GE3 | Pan4 | 2 Jul, 2010 | 0.50 | ||||
| Chandler | 69° 0′ 53″ N | 2500 × 2560 | 640 | USGS | CIR | 28 Jun, 1978 | 0.91 |
| 151° 56′ 5″ W | USGS | CIR | 19 Aug, 1985 | 0.90 | |||
| WV5 | Pan | 7 Jul, 2010 | 0.50 | ||||
| Colville | 68° 57′ 17″ N | 2048 × 4068 | 944 | USGS | Pan | 19 Jul, 1977 | 0.96 |
| 155° 57′ 20″ W | USGS | CIR | 19 Aug, 1985 | 0.91 | |||
| QB6 | Pan MS7 | 17 Aug, 2008 | 0.50 | ||||
| Killik | 68° 22′ 15″ N | 7168 × 2048 | 1468 | USGS | CIR | 1 Jun, 1978 | 0.88 |
| 154° 0′ 54″ W | USGS | CIR | 1 Aug, 1982 | 0.88 | |||
| IK28 | Pan MS | 20 May, 2009 | 0.50 | ||||
| Kurupa | 68° 55′ 53″ N | 3000 × 5100 | 1530 | USGS | CIR | 26 Jul, 1977 | 1.00 |
| 155° 4′ 56″ W | USGS | CIR | 2 Aug, 1985 | 0.91 | |||
| USGS | CIR | 6 Jul, 2007 | 0.56 | ||||
| Nanushuk 1 | 69° 9′ 12″ N | 1024 × 1536 | 157 | USGS | Pan | 1 Jun, 1955 | 0.70 |
| 150° 52′ 50″ W | USGS | CIR | 28 Jun, 1978 | 0.91 | |||
| GE | Pan MS | 14 Aug, 2010 | 0.50 | ||||
| Nanushuk 2 | 69° 7′ 21″ N | 1997 × 1536 | 306 | USGS | Pan | 1 Jun, 1955 | 0.70 |
| 150° 51′ 29″ W | USGS | CIR | 28 Jun, 1978 | 0.91 | |||
| GE | Pan MS | 14 Aug, 2010 | 0.50 | ||||
| Nigu | 68° 25′ 38″ N | 3072 × 2048 | 629 | USGS | CIR | 19 Jul, 1977 | 3.19 |
| 156° 25′ 27″ W | USGS | CIR | 19 Aug, 1985 | 1.60 | |||
| QB | Pan | 5 Sep, 2008 | 0.50 | ||||
| Nimiuktuk | 68° 23′ 37″ N | 2560 × 2560 | 655 | USGS | Pan | 19 Jul, 1977 | 0.94 |
| 159° 51′ 12″ W | GE | Pan | 27 Jun, 2010 | 0.80 | |||
USGS Earth Explorer archive image.
Colour infrared image.
GeoEye-1 image.
Panchromatic image.
WorldView 01 image.
QuickBird 02 image.
Panchromatic multispectral image.
IKONOS 2 image.
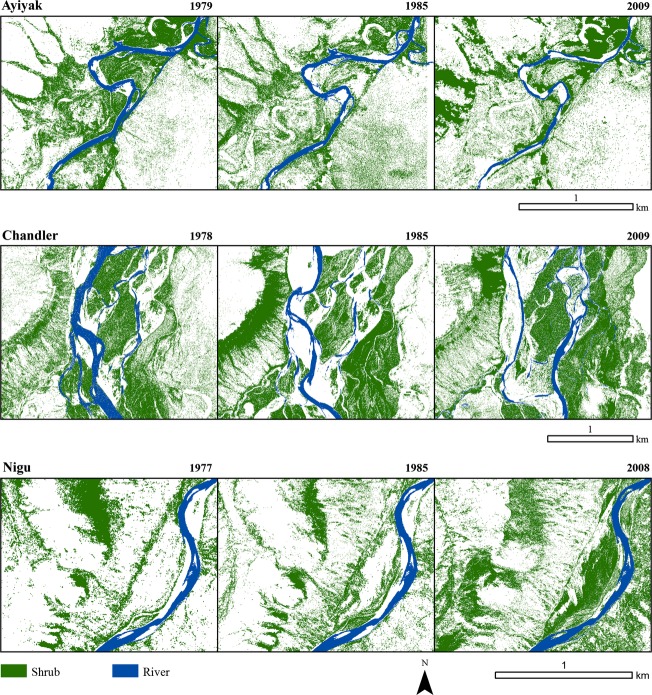
We identified tall (>0.5 m in height) shrub patches by applying a semi-automated image classification approach to the resampled satellite imagery. Each processed image was classified using the ISODATA algorithm in ENVI 4.7 using a maximum of 20 classes and 20 iterations (cf. Naito and Cairns 2011b). The spectral classes in the resulting image were reclassified to informational classes designated as either 1 (“shrub”) or 0 (“not-shrub”). This new classified image was overlaid on the original imagery using ArcGIS 10.1 (ESRI, 2012). Classes that most closely match shrub patches were isolated and converted to polygons that maintained the original raster boundaries at the 1 m resolution. This conversion process facilitated editing of the resulting information classes. Using visual interpretation of the original aerial image, polygons were checked for agreement with shrubs. This was particularly important because the ISODATA procedure usually identified dark shrubs and water bodies as the same spectral class. Individual polygons representing shadows and water could then be removed. In situ field observations to validate the classification of the satellite imagery were not possible. However, the repeat oblique aerial photographs from Tape et al.'s (2006) study were used as a substitute for ground validation for the most recent imagery. This process was repeated for all available imagery at each site, resulting in 26 maps of shrub cover (Fig.3).
Figure 3.
Shrub cover change maps for the Ayiyak, Chandler, and Nigu sites from the 1970s, 1980s and late 2000s.
Development of a conceptual model
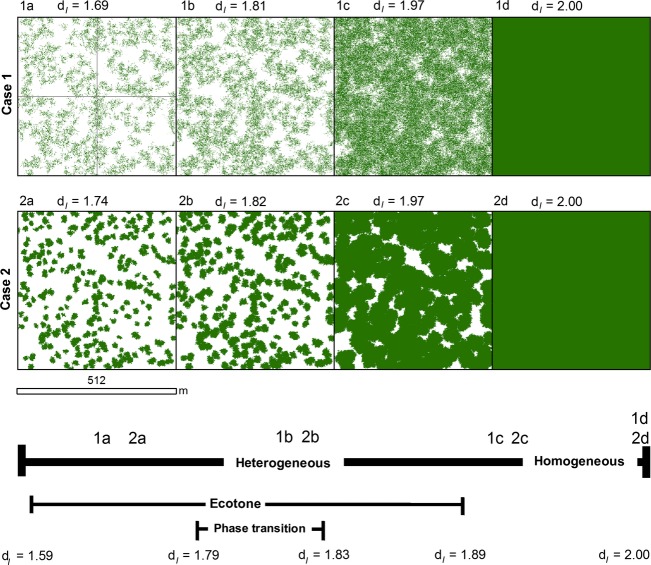
We conceptualised two possible cases of landscape configurations undergoing phase transition in a 512 × 512 m quadrat (Fig.4). These conceptual landscapes help illustrate changes in dI and pattern metrics over time and provide a basis for comparison with the observed landscapes.
Figure 4.
Conceptual maps of shrub patch dynamics at two landscapes (Case 1 and Case 2) categorized as ecotones with different configurations of the invading phase (gray pixels). As time increases from Step a to Step d, the median information fractal dimension (dI) increases to a value of 2.00. 1a and 2a are representative of landscapes in an ecotone. 1b and 2b are representative of the landscapes in an ecological phase transition. 1c and 2c represent landscapes approaching spatial homogeneity for the invading phase. 1d and 2d represent landscapes completely homogenous for the invading phase.
Four pattern metrics provide a means for assessing the presence and trends of the types of shrub expansion at landscape scales. These include PCTCOV (percent area covered by shrubs), PADENS (shrub patch density per ha), CVSIZE (coefficient of variation of patch size expressed as a percent), and MEDIST (mean Euclidean nearest neighbour distance between patches). CVSIZE is an indicator of variability about the mean patch size and facilitates greater comparability of patch size between landscapes of different sizes over mean patch size alone (McGarigal and Marks 1995). Based upon our results from the conceptual landscapes and previously published descriptions of shrub expansion patterns (Tape et al. 2006; Myers-Smith et al. 2011), we expected to observe an increase in PCTCOV, a variety of PADENS responses, a continual decrease in MEDIST, and an inflection of the trend in CVSIZE sometime during or after a local-scale phase transition.
Pattern metric and dI analysis of shrub expansion maps
We rasterised the shrub maps of both the observed and conceptual landscapes to a resolution of 1 m and used FRAGSTATS 4.1 (McGarigal et al. 2012) to calculate PCTCOV, PADENS, CVSIZE, and MEDIST. We also calculated the mediandI and dI profiles for each landscape by generating grids containing equal-sized square cells using Geospatial Modelling Environment 0.7.2.1 (Beyer 2012) and overlaying them on each landscape. Each grid consists of successively larger cell sizes, and sizes are based on a geometric sequence (e.g., 1, 2, 4, 8, …). Each pixel in the landscape is assigned a 0 or 1 for absence or presence of the invading shrub phase. These values are divided by the total number of shrub pixels in the entire landscape, resulting in a probability value of occupation. These probabilities are then summed for each overlying cell in an individual grid. Cells with a higher number of shrub pixels and/or have larger dimensions will therefore have a higher probability of occupation. This calculation is repeated for each grid. The dI is then calculated by using Equation 1:
 |
1 |
where P represents the probability of occupation, K(ε) is the number of cells of width ε, and K(ϒ) is the number of cells of the next larger cell size to ε in the geometric sequence.
We then developed a linear regression model between the median dI value for all grids in a landscape and its corresponding PCTCOV determined from the pattern metric analysis. The Shapiro-Wilk test was used to verify normality for both the dI and PCTCOV datasets (P > 0.05). This regression model was used to predict percent shrub cover required to initiate phase transition using the critical dI values of Loehle et al. (1996).
Results
Pattern analysis of the conceptual landscapes
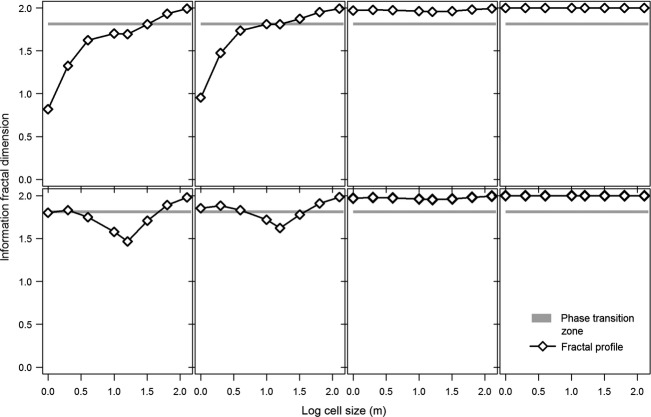
In the “ecotone” and “phase transition” stages for Case 1 (Fig.5), the landscape is highly fragmented for invading shrubs at fine spatial scales (cell sizes ≤4 m). At coarser spatial scales, the landscape transitions towards spatial homogeneity. At the coarsest scales, dI then declines as the irregular distribution of shrubs is sampled (Fig.5). In the “ecotone” and “phase transition” stages for Case 2, the landscapes are in a state of phase transition at fine spatial scales due to their clumped pattern. At coarser scales, the landscape becomes heterogeneous before transitioning towards spatial homogeneity (Fig.5). In Case 1, PADENS peaks just before the phase transition period and CVSIZE peaks just after. MEDIST declines throughout the time period, with the greatest decreases occurring as the landscape transitions from “fragmented” to “heterogeneous” and between the phase transition period and “spatial homogeneity” (Fig.6). In Case 2, PADENS decreases throughout the time period. CVSIZE increases towards the phase transition period and then decreases afterwards. MEDIST also decreases throughout, with the greatest decreases occurring during the transition from “fragmented” and “heterogeneous” categories and from “phase transition” to “spatial homogeneity” (Fig.6). Our observed landscapes and their pattern metrics should more closely match that of Case 1 due to its more heterogeneous configuration.
Figure 5.
Information fractal dimension (dI) profiles for the conceptual shrub patch dynamics of landscapes Case 1 and Case 2.
Figure 6.
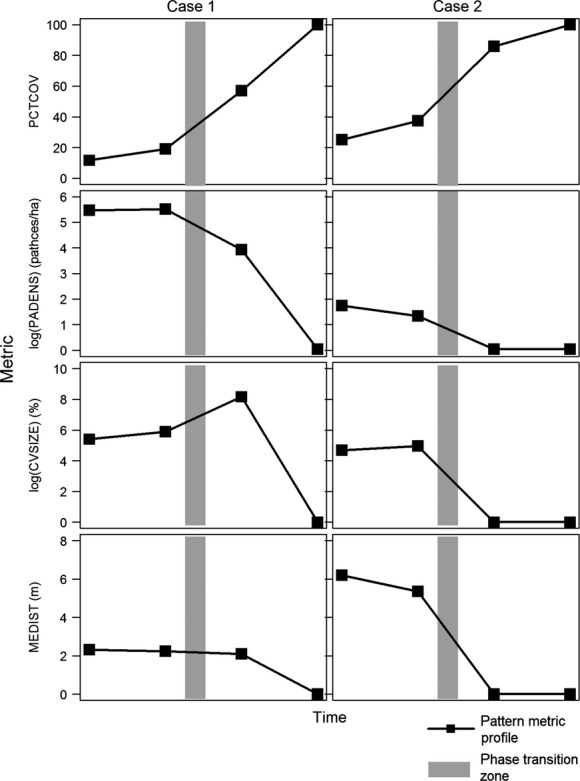
Changes in the pattern metrics of each of the two conceptual landscapes (Case 1 and Case 2) for percent cover (PCTCOV), patch density (PADENS), coefficient of variation of size (CVSIZE), and mean Euclidean nearest neighbor distance between patches (MEDIST). The shaded box approximates a possible phase transition period whereby the dI ranges from 1.7951 to 1.8286.
Pattern analysis of the observed landscapes
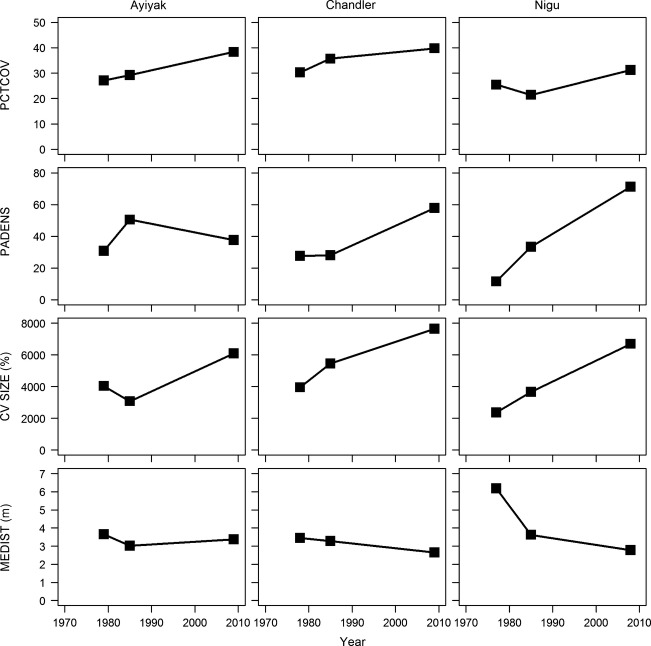
Net increases in PCTCOV occurred at all nine sites (Fig.7, Table2, Appendix 1 and 2). The average PCTCOV for the two sites in the 1950s was 32.28%. The average PCTCOV in the 1970s was 28.32%, while it was 27.32% in the 1980s. By the 2000s, the average PCTCOV was 37.44%. The greatest percent change in PCTCOV for the two landscapes with maps dating from the 1950s onwards occurred at Nanushuk 2 (+79.50%), while the smallest percent change in PCTCOV occurred at Nanushuk 1 (+51.08%). The greatest percent change in PCTCOV for the seven landscapes with maps dating from the 1970s onwards occurred at Kurupa (+85.03%), while the smallest percent change in PCTCOV occurred at Nigu (+22.51%). The average annual percent change in shrub cover for the sites dating from the 1950s was 1.21%/year. The average annual percent change in shrub cover for the sites dating from the 1970s was 1.29%/year.
Figure 7.
Observed trends in (from top to bottom) percent shrub cover (PCTCOV), patch density (PADENS), coefficient of variation of patch size (CVSIZE), and mean Euclidean nearest neighbor distance (MEDIST) for the Ayiyak, Chandler, and Nigu sites.
Table 2.
Median information fractal dimension (dI) and percent shrub cover (PCTCOV) values for each landscape for each date of observation. By the most recent date of observation, all landscapes have passed through the phase transition zone (dI = 1.7951–1.8285) and are now progressing towards a state of homogeneity
| Landscape | Year | Median dI | PCTCOV | Total Δ PCTCOV | Total %Δ PCTCOV |
|---|---|---|---|---|---|
| Ayiyak | 1977 | 1.84 | 27.13 | 11.21 | 41.32 |
| 1985 | 1.85 | 29.22 | |||
| 2009 | 1.88 | 38.34 | |||
| Chandler | 1977 | 1.84 | 30.29 | 9.49 | 31.33 |
| 1985 | 1.84 | 35.68 | |||
| 2009 | 1.96 | 39.78 | |||
| Colville | 1975 | 1.84 | 24.56 | 8.56 | 34.85 |
| 1985 | 1.86 | 31.79 | |||
| 2008 | 1.86 | 33.12 | |||
| Killik | 1977 | 1.87 | 14.11 | 6.50 | 46.07 |
| 1982 | 1.87 | 13.38 | |||
| 2009 | 1.84 | 20.61 | |||
| Kurupa | 1977 | 1.8 | 17.3 | 14.71 | 85.03 |
| 1985 | 1.88 | 32.41 | |||
| 2009 | 1.9 | 32.01 | |||
| Nanushuk 1 | 1955 | 1.86 | 30.66 | 51.08 | 51.07 |
| 1978 | 1.88 | 38.03 | |||
| 2009 | 1.9 | 46.32 | |||
| Nanushuk 2 | 1955 | 1.87 | 33.9 | 79.50 | 79.50 |
| 1978 | 1.92 | 50.64 | |||
| 2009 | 1.94 | 60.85 | |||
| Nigu | 1977 | 1.81 | 25.45 | 22.51 | 22.51 |
| 1985 | 1.81 | 21.44 | |||
| 2008 | 1.87 | 31.18 | |||
| Nimiuktuk | 1977 | 1.86 | 27.35 | 27.09 | 27.10 |
| 2009 | 1.91 | 34.76 | |||
| Mean 1950s PCTCOV | 32.28 | ||||
| Mean 1970s PCTCOV | 28.32 | ||||
| Mean 1980s PCTCOV | 27.32 | ||||
| Mean 2000s PCTCOV | 37.44 | ||||
Four sites (Killik, Nanushuk 1 and 2, and Nimiuktuk) exhibited an overall decline in PADENS ranging from −25.0 to −51.7%. The other five sites (Ayiyak, Chandler, Colville, Kurupa, and Nigu) exhibited an increase ranging from 1.8 to 59.7%. Seven sites (Ayiyak, Chandler, Colville, Killik, Kurupa, Nigu, and Nimiuktuk) exhibited an overall increase in CVSIZE, ranging from 14.8 to 518.3%. In addition, five of the sites (Ayiyak, Chandler, Colville, Killik, Nanushuk 2, and Nigu) exhibited a decrease in MEDIST, ranging from −0.3 to −3.4 m (Fig.7, Appendix S1 and S2).
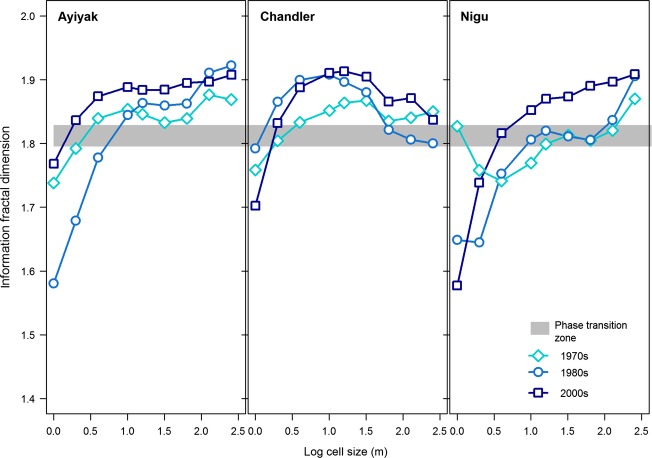
With the exception of Colville, the dI profiles indicate that heterogeneous landscapes are present at fine spatial scales (cell size ≤2 m). As the cell size increases to the landscape-scale, the dI becomes relatively consistent and generally exceeds the critical value for phase transition to occur (Fig.8 and Appendix S3).
Figure 8.
Information fractal dimension (dI) profiles for the Ayiyak, Chandler, and Nigu sites.
The linear relationship between dI and PCTCOV is represented in Eq. 2:
Using the critical dI values noted by Loehle et al. (1996) and Eq. 2, we calculated critical PCTCOV for each landscape (Fig.9 and Table2). The upper critical dI value of 1.8286 corresponded to a PCTCOV of 17.62%. Therefore, the PCTCOV value for each landscapes at each observed date exceeded the upper critical value.
Figure 9.
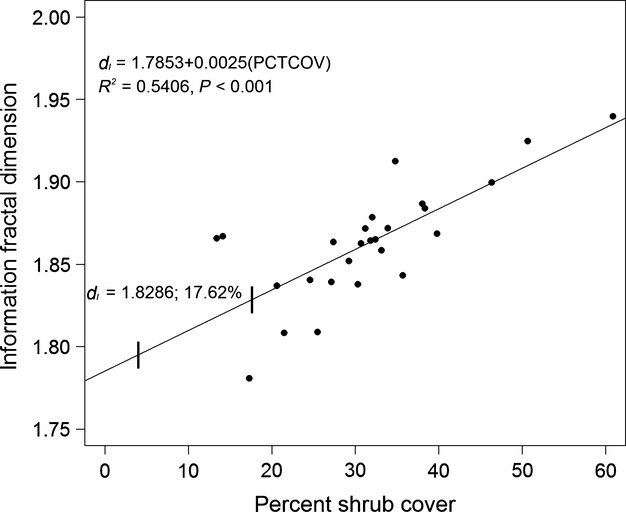
Scatterplot demonstrating the relationship of the information fractal dimension (dI) for each site at each observed year with their corresponding percent shrub cover (PCTCOV). The regression line equation is dI = 1.7853 + 0.0025(PCTCOV). The vertical lines superimposed on the regression line represent the coordinates of the critical dI values, with the upper critical value of 1.8286 and its corresponding PCTCOV labeled. All sites at all years meet or exceed this upper critical value.
Discussion
Implications of an Arctic ecological phase transition
In this study, we applied fractal analysis of spatial pattern in a theoretical context to determine the potential for an ecological phase transition in the shrub-tundra ecotone within river valleys in northern Alaska. This type of analysis has not yet been applied to Arctic ecosystems. Based upon the median dI values for each landscape, the results of the linear regression, and the comparison of the historic pattern metric curves with the conceptual metric curves, we argue that the shrub-tundra ecotone within river valleys of the BRNS is in a state of phase transition from tundra to shrubland. Our objective in this work was not to determine or infer the mechanism of this phase transition at a landscape-scale. However, our analysis can be contextualized with recent literature examining the processes of shrub expansion and will inform future work to identify cross-scale processes and the interaction of positive and negative feedbacks (e.g., Myers-Smith et al. 2011).
The implications of this phase transition are important because the conversion of tundra to tall, canopy-forming deciduous shrub cover (e.g., Alnus, Betula, and Salix spp.) have considerable consequences for Arctic ecosystem processes and their associated feedbacks. For example, tall shrub cover alters local nutrient availability (Cornelissen et al. 2007; Elmendorf et al. 2012a; Vankoughnett and Grogan 2014), reduces surface albedo (Bonfils et al. 2012), and promotes an increase in atmospheric heating, evapotranspiration, soil active layer depth, and permafrost degradation (Chapin et al. 2000). The expansion of shrubs is also thought to reduce erosion (Tape et al. 2011) and can shift the landscape's geomorphic threshold for change (Mann et al. 2010).
The dI profiles suggest that the landscapes we examined are highly heterogeneous at fine spatial scales. Recent findings suggest that microsite differences (e.g., soil or permafrost conditions, snow regime, etc.) contribute to this fine-scale heterogeneity (e.g., Tape et al. 2012; Raynolds et al. 2013). Recent work (Bokhorst et al. 2010; Blok et al. 2011; Myers-Smith and Hik 2013; Vankoughnett and Grogan 2014) has also suggested that abiotic influences of tall shrub canopy (e.g., increased shading and below-canopy snow accumulation) on nutrient dynamics and permafrost thaw is less than previously suggested (e.g., Sturm et al. 2005).
The median dI values and general consistency of the dI values in the fractal profiles of each landscape at coarser spatial scales (Fig.8, Appendix S3) suggests that these landscapes can be characterized as approaching spatial homogeneity. Climatic warming is a primary driver of expansion at these scales, so continued warming will facilitate a shift towards spatial homogeneity for shrub cover. In addition, this warming trend is thought to be an overriding factor of these finer-scale processes (Lawrence and Swenson 2011; Bonfils et al. 2012).
While the growth of low shrubs are responsive to increases in temperature, their impacts on ecosystem functioning are not as extensive. However, it is possible that pixels categorized as tall shrub cover in our study do include some low shrubs. Some of the best imagery was also panchromatic for some of our areas. Tall shrubs often appears as dark patches, but differentiating low shrub from tussock tundra can be more difficult on these images because only textural characteristics are available. The phase transition theory as proposed by Loehle et al. (1996), however, is predicated on the treatment of landscapes as binary in terms of vegetation composition. In the context of this paper, we must treat each pixel in each landscape as “shrub” and “not-shrub.” We propose that this study be considered as a preliminary application of phase transition theory to an Arctic ecosystem to determine its applicability and understanding the implications for the local ecosystems.
Changes in shrub area
We observed net increases in shrub cover at all sites, and this is consistent with previous studies in the region. Loehle et al. (1996) noted that percent cover would increase dramatically during and after the phase transition. Since a transition already appears to have occurred, we could expect continued increases in shrub cover within river corridors as conditions continue to warm (Tape et al. 2006; Walker et al. 2006; Lantz et al. 2010a). Tape et al. (2006) and Lantz et al. (2010b) reported areal increases of shrub patches in the western Arctic between 1 and 6% per decade. Our decadal rates are higher likely due to a smaller total area of investigation.
It is possible that the increase in PCTCOV from the 1970s to the 1980s is a response to the positive temperature anomalies in the late 1970s. Likewise, the stabilization or slight decrease in PCTCOV from the 1980s to the late 2000s is partially a response to the fluctuations in temperature anomalies in the early 2000s (Fig.2). However, shrub data from additional river valleys and climate data from other nearby stations will be required to more firmly establish a correlative link between temperature variability and PCTCOV.
Trends in the spatial characteristics of shrub expansion
Based upon the established types of shrub expansion (Tape et al. 2006; Myers-Smith et al. 2011), we expected to observe consistent increases in PADENS and CVSIZE, and a reduction in MEDIST. Our conceptual landscape results, however, suggest a reduction in PADENS during or after a phase transition, and an increase followed by a decrease in CVSIZE just after the phase transition. These conceptual models, however, do not account for environmental heterogeneity. Our results suggest that the response of PADENS, CVSIZE, and MEDIST vary from site to site, and correspond with previous findings that patterns of shrub development are heterogeneous (Tape et al. 2012). Sites for which the median dI indicated that a phase transition recently occurred or was in progress during the observation period generally exhibited increases in PADENS and CVSIZE (e.g., Ayiyak, Chandler, and Nigu), suggesting the acceleration of recruitment as shrubs begin to expand across the landscape. For sites with higher dI values at the beginning of the observation period (e.g., Killik and Nimiuktuk), however, we noted better correspondence with Case 2 through reduction in PADENS and CVSIZE. This suggests that the phase transition at these sites is completing, leading to spatial homogeneity. Any other variability in these trends is likely due to the irregular distribution and recruitment of shrubs along the floodplains and valley slope drainage channels in response to local hydrological characteristics (e.g., Naito and Cairns 2011b). Over the period of analysis, alterations in the stream channel and the creation of sediment banks that provide new surfaces for shrub recruitment likely introduce additional variability in these trends. Although half the sites exhibited an increase in MEDIST, these increases are very small (<1 m). The unusual trend in pattern metrics at the Nigu site are attributable to the fact that the native resolution of the historical images for the Nigu site were larger than other images used in this study. We opted to present results from this work to ensure good geographic coverage across the BRNS.
Conclusion
Although fine-scale heterogeneity is still present, landscape-scale patterns suggest that our study areas are either currently in a state of phase transition from tundra to shrubland or are progressing towards spatial homogeneity for shrubland. The shrub tundra in the river valleys of the BRNS has reached a tipping point. If climate trends observed in recent decades continue, the shrub tundra within river valleys will continue towards homogeneity with regard to the cover of tall shrubs. Given current understanding of the local-scale implications for hydrology, surface energy balances, and carbon and nutrient cycling as a result of enhanced shrub cover, the completion of this phase transition will alter tundra ecosystem structure and function. Such transitions and ecosystem processes are currently being observed in other biomes.
Acknowledgments
This research was funded by grants from the National Science Foundation (ARC-0806506, BCS-1203444), the GeoEye Foundation and SPOT/Planet Action. The open access publishing fees for this article have been covered by the Texas A&M University Online Access to Knowledge (OAK) Fund, supported by the University Libraries and the Office of the Vice President for Research at Texas A&M University. We would like to thank Elizabeth Doerr at the GeoEye Foundation for her support and furnishing the GeoEye-1 and IKONOS-2 imagery, and Patricia Dankha at SPOT Astrium for supplying the Quick Bird-2 and WorldView-1 imagery. Ellen Gass and Jeremy Johnson were invaluable in the co-registration of the historical aerial imagery. We would also like to extend our thanks to Ken D. Tape, Charles Lafon, Xinyuan “Ben” Wu, and anonymous reviewers for constructive comments on earlier versions of this manuscript.
Conflict of Interest
None declared.
Supporting Information
Appendix S1.Change in pattern metrics PCTCOV (percent shrub cover), PADENS (patch density), CVSIZE (coefficient of variation of patch size), and MEDIST (mean Euclidean nearest neighbor distance) of the Ayiyak, Chandler, Colville, Killik, and Kurupa sites.
Appendix S2. Change in pattern metrics PCTCOV (percent shrub cover), PADENS (patch density), CVSIZE (coefficient of variation of patch size), and MEDIST (mean Euclidean nearest neighbor distance) of the Nanushuk 1, Nanushuk 2, Nigu, and Nimiuktuk sites.
Appendix S3. Information fractal dimension (dI) profiles for all nine sites examined in this study.
References
- Alados CL, Pueyo Y, Navas D, Cabezudo B, Gonzalez A. Freeman DC. Fractal analysis of plant spatial patterns: a monitoring tool for vegetation transition shifts. Biodivers. Conserv. 2005;14:1453–1468. [Google Scholar]
- Alados CL, Navarro T, Komac B, Pascual V, Martinez F, Cabezudo B, et al. Do vegetation patch spatial patterns disrupt the spatial organization of plant species? Ecol. Complex. 2009;6:197–207. [Google Scholar]
- Beck PSA. Goetz SJ. Satellite observations of high northern latitude vegetation productivity changes between 1982 and 2008: ecological variability and regional differences. Environ. Res. Lett. 2011;6:045501. [Google Scholar]
- Beck PSA, Horning N, Goetz SJ, Loranty MM. Tape KD. Shrub Cover on the North Slope of Alaska: a circa 2000 Baseline Map. Arct. Antarct. Alp. Res. 2011;43:355–363. [Google Scholar]
- Beyer H. Geospatial Modelling Environment (geospatial data analysis software package) Toronto, Canada: Spatial Ecology, LLC; 2012. [Google Scholar]
- Blok D, Schaepman-Strub G, Bartholomeus H, Heijmans M, Maximov TC. Berendse F. The response of Arctic vegetation to the summer climate: relation between shrub cover, NDVI, surface albedo and temperature. Environ. Res. Lett. 2011;6:035502. [Google Scholar]
- Bokhorst S, Bjerke JW, Melillo J, Callaghan TV. Phoenix GK. Impacts of extreme winter warming events on litter decomposition in a sub-Arctic heathland. Soil Biol. Biochem. 2010;42:611–617. [Google Scholar]
- Bonfils CJW, Phillips TJ, Lawrence DM, Cameron-Smith P, Riley WJ. Subin ZM. On the influence of shrub height and expansion on northern high latitude climate. Environ. Res. Lett. 2012;7:015503. [Google Scholar]
- Burkett VR, Wilcox DA, Stottlemyer R, Barrow W, Fagre D, Baron J, et al. Nonlinear dynamics in ecosystem response to climatic change: Case studies and policy implications. Ecol. Complex. 2005;2:357–394. [Google Scholar]
- Chapin FS, Eugster W, McFadden JP, Lynch AH. Walker DA. Summer differences among Arctic ecosystems in regional climate forcing. J. Clim. 2000;13:2002–2010. [Google Scholar]
- Chapin FS, Sturm M, Serreze MC, McFadden JP, Key JR, Lloyd AH, et al. Role of land-surface changes in Arctic summer warming. Science. 2005;310:657–660. doi: 10.1126/science.1117368. [DOI] [PubMed] [Google Scholar]
- Cornelissen JHC, van Bodegom PM, Aerts R, Callaghan TV, van Logtestijn RSP, Alatalo J, et al. Global negative vegetation feedback to climate warming responses of leaf litter decomposition rates in cold biomes. Ecol. Lett. 2007;10:619–627. doi: 10.1111/j.1461-0248.2007.01051.x. [DOI] [PubMed] [Google Scholar]
- Danby RK. Hik DS. Variability, contingency and rapid change in recent subarctic alpine tree line dynamics. J. Ecol. 2007;95:352–363. [Google Scholar]
- DeMarco J, Mack MC. Bret-Harte MS. The effects of snow, soil microenvironment, and soil organic matter quality on n availability in three alaskan arctic plant communities. Ecosystems. 2011;14:804–817. [Google Scholar]
- Elmendorf SC, Henry GHR, Hollister RD, Bjork RG, Bjorkman AD, Callaghan TV, et al. Global assessment of experimental climate warming on tundra vegetation: heterogeneity over space and time. Ecol. Lett. 2012a;15:164–175. doi: 10.1111/j.1461-0248.2011.01716.x. [DOI] [PubMed] [Google Scholar]
- Elmendorf SC, Henry GHR, Hollister RD, Bjork RG, Boulanger-Lapointe N, Cooper EJ, et al. Plot-scale evidence of tundra vegetation change and links to recent summer warming. Nat. Clim. Change. 2012b;2:453–457. [Google Scholar]
- Epstein HE, Beringer J, Gould WA, Lloyd AH, Thompson CD, Chapin FS, et al. The nature of spatial transitions in the Arctic. J. Biogeogr. 2004;31:1917–1933. [Google Scholar]
- Forbes BC, Fauria MM. Zetterberg P. Russian Arctic warming and ‘greening’ are closely tracked by tundra shrub willows. Glob. Change Biol. 2010;16:1542–1554. [Google Scholar]
- Frost GV, Epstein HE, Walker DA, Matyshak G. Ermokhina K. Patterned-ground facilitates shrub expansion in Low Arctic tundra. Environ. Res. Lett. 2013;8:015035. [Google Scholar]
- Gillson L. Ekblom A. Resilience and thresholds in savannas: nitrogen and fire as drivers and responders of vegetation transition. Ecosystems. 2009;12:1189–1203. [Google Scholar]
- Goetz SJ, Bunn AG, Fiske GJ. Houghton RA. Satellite-observed photosynthetic trends across boreal North America associated with climate and fire disturbance. Proc. Natl Acad. Sci. USA. 2005;102:13521–13525. doi: 10.1073/pnas.0506179102. [DOI] [PMC free article] [PubMed] [Google Scholar]
- Hallinger M, Manthey M. Wilmking M. Establishing a missing link: warm summers and winter snow cover promote shrub expansion into alpine tundra in Scandinavia. New Phytol. 2010;186:890–899. doi: 10.1111/j.1469-8137.2010.03223.x. [DOI] [PubMed] [Google Scholar]
- Jia GS, Epstein HE. Walker DA. Spatial heterogeneity of tundra vegetation response to recent temperature changes. Glob. Change Biol. 2006;12:42–55. [Google Scholar]
- Lantz TC, Gergel SE. Henry GHR. Response of green alder (Alnus viridis subsp fruticosa) patch dynamics and plant community composition to fire and regional temperature in north-western Canada. J. Biogeogr. 2010a;37:1597–1610. [Google Scholar]
- Lantz TC, Gergel SE. Kokelj SV. Spatial heterogeneity in the shrub tundra ecotone in the mackenzie delta region, northwest territories: implications for arctic environmental change. Ecosystems. 2010b;13:194–204. [Google Scholar]
- Lawrence DM. Swenson SC. Permafrost response to increasing Arctic shrub abundance depends on the relative influence of shrubs on local soil cooling versus large-scale climate warming. Environ. Res. Lett. 2011;6:045504. [Google Scholar]
- Li BL. Fractal geometry applications in description and analysis of patch patterns and patch dynamics. Ecol. Model. 2000;132:33–50. [Google Scholar]
- Li BL. A theoretical framework of ecological phase transitions for characterizing tree-grass dynamics. Acta. Biotheor. 2002;50:141–154. doi: 10.1023/a:1016562208170. [DOI] [PubMed] [Google Scholar]
- Loehle C. Li BL. Statistical properties of ecological and geologic fractals. Ecol. Model. 1996;85:271–284. [Google Scholar]
- Loehle C, Li BL. Sundell RC. Forest spread and phase transitions at forest-prairie ecotones in Kansas, USA. Landscape Ecol. 1996;11:225–235. [Google Scholar]
- Loranty MM, Goetz SJ. Beck PSA. Tundra vegetation effects on pan-Arctic albedo. Environ. Res. Lett. 2011;6:024014. [Google Scholar]
- Mann DH, Groves P, Reanier RE. Kunz ML. Floodplains, permafrost, cottonwood trees, and peat: what happened the last time climate warmed suddenly in arctic Alaska? Quatern. Sci. Rev. 2010;29:3812–3830. [Google Scholar]
- McGarigal K, Cushman SA. Ene E. FRAGSTATS v4.1: Spatial Pattern Analysis Program for Categorical and Continuous Maps. Amherst, MA: University of Massachusetts; 2012. [Google Scholar]
- McGarigal K. Marks BJ. FRAGSTATS: Spatial pattern program for quantifying landscape structure, General Technical Report PNW-GTR-351. Portland, OR: U.S. Department of Agriculture, Forest Service, Pacific Northwest Research Station. 122 pp. 1995. , and http://www.treesearch.fs.fed.us/pubs/3064. [Google Scholar]
- McGuire AD, Chapin FS, Walsh JE. Wirth C. Integrated regional changes in arctic climate feedbacks: Implications for the global climate system. Annu. Rev. Environ. Resour. 2006;31:61–91. [Google Scholar]
- Milne BT, Johnson AR, Keitt TH, Hatfield CA, David J. Hraber PT. Detection of critical densities associated with pinon-juniper woodland ecotones. Ecology. 1996;77:805–821. [Google Scholar]
- Myers-Smith IH. Hik DS. Shrub canopies influence soil temperatures but not nutrient dynamics: an experimental test of tundra snow–shrub interactions. Ecol. Evol. 2013;3:3683–3700. doi: 10.1002/ece3.710. [DOI] [PMC free article] [PubMed] [Google Scholar]
- Myers-Smith IH, Forbes BC, Wilmking M, Hallinger M, Lantz T, Blok D, et al. Shrub expansion in tundra ecosystems: dynamics, impacts and research priorities. Environ. Res. Lett. 2011;6:045509. [Google Scholar]
- Naito AT. Cairns DM. Patterns and processes of global shrub expansion. Prog. Phys. Geogr. 2011a;35:423–442. [Google Scholar]
- Naito AT. Cairns DM. Relationships between Arctic shrub dynamics and topographically derived hydrologic characteristics. Environ. Res. Lett. 2011b;6:045506. [Google Scholar]
- Olofsson J, Stark S. Oksanen L. Reindeer influence on ecosystem processes in the tundra. Oikos. 2004;105:386–396. [Google Scholar]
- Pouliot D, Latifovic R. Olthof I. Trends in vegetation NDVI from 1 km AVHRR data over Canada for the period 1985–2006. Int. J. Remote Sens. 2008;30:149–168. [Google Scholar]
- Raynolds MK, Walker DA, Epstein HE, Pinzon JE. Tucker CJ. A new estimate of tundra-biome phytomass from trans-Arctic field data and AVHRR NDVI. Remote Sens. Lett. 2012;3:403–411. [Google Scholar]
- Raynolds MK, Walker DA, Verbyla D. Munger CA. Patterns of Change within a Tundra Landscape: 22-year Landsat NDVI Trends in an Area of the Northern Foothills of the Brooks Range, Alaska. Arct. Antarct. Alp. Res. 2013;45:249–260. [Google Scholar]
- Risser PG. The status of the science examining ecotones: a dynamic aspect of landscape is the area of steep gradient between more homogenous vegetation associations. Bioscience. 1995;45:318–325. [Google Scholar]
- Rocchini D, Perry GLW, Salerno M, Maccherini S. Chiarucci A. Landscape change and the dynamics of open formations in a natural reserve. Landsc. Urban Plan. 2006;77:167–177. [Google Scholar]
- Scheffer M, Hirota M, Holmgren M, Van Nes EH. Chapin FS. Thresholds for boreal biome transitions. Proc. Natl Acad. Sci. USA. 2012;109:21384–21389. doi: 10.1073/pnas.1219844110. [DOI] [PMC free article] [PubMed] [Google Scholar]
- Sturm M, Racine C. Tape K. Climate change – Increasing shrub abundance in the Arctic. Nature. 2001;411:546–547. doi: 10.1038/35079180. [DOI] [PubMed] [Google Scholar]
- Sturm M, Schimel J, Michaelson G, Welker JM, Oberbauer SF, Liston GE, et al. Winter biological processes could help conver t arctic tundra to shrubland. Bioscience. 2005;55:17–26. [Google Scholar]
- Tape K, Sturm M. Racine C. The evidence for shrub expansion in Northern Alaska and the Pan-Arctic. Glob. Change Biol. 2006;12:686–702. [Google Scholar]
- Tape KD, Verbyla D. Welker JM. Twentieth century erosion in Arctic Alaska foothills: the influence of shrubs, runoff, and permafrost. J. Geophys. Res. Biogeosci. 2011;116:G04024. [Google Scholar]
- Tape K, Hallinger M, Welker J. Ruess R. Landscape heterogeneity of shrub expansion in Arctic Alaska. Ecosystems. 2012;15:711–724. [Google Scholar]
- Uzunov DI. Introduction to the theory of critical phenomena: mean field, fluctuations and renormalization. Singapore: World Scientific; 1993. [Google Scholar]
- Vankoughnett M. Grogan P. Nitrogen isotope tracer acquisition in low and tall birch tundra plant communities: a 2 year test of the snow–shrub hypothesis. Biogeochemistry. 2014;118:291–306. [Google Scholar]
- Verbyla D. The greening and browning of Alaska based on 1982-2003 satellite data. Glob. Ecol. Biogeogr. 2008;17:547–555. [Google Scholar]
- Viereck LA, Dyrness CT, Batten AR. Wenzlick KJ. The Alaska vegetation classification. Portland, OR: U.S. Department of Agriculture, Forest Service, Pacific Northwest Research Station; 1992. p. 278. , and . Gen. Tech. Rep. PNW-GTR-286. p. [Google Scholar]
- Walker DA, Jia GJ, Epstein HE, Raynolds MK, Chapin FS, Copass C, et al. Vegetation-soil-thaw-depth relationships along a Low-Arctic bioclimate gradient, Alaska: synthesis of information from the ATLAS studies. Permafrost Periglac. Process. 2003;14:103–123. [Google Scholar]
- Walker DA, Raynolds MK, Daniels FJA, Einarsson E, Elvebakk A, Gould WA, et al. The Circumpolar Arctic vegetation map. J. Veg. Sci. 2005;16:267–282. [Google Scholar]
- Walker MD, Wahren CH, Hollister RD, Henry GHR, Ahlquist LE, Alatalo JM, et al. Plant community responses to experimental warming across the tundra biome. Proc. Natl Acad. Sci. USA. 2006;103:1342–1346. doi: 10.1073/pnas.0503198103. [DOI] [PMC free article] [PubMed] [Google Scholar]
- Walker DA, Epstein HE, Raynolds MK, Kuss P, Kopecky MA, Frost GV, et al. Environment, vegetation and greenness (NDVI) along the North America and Eurasia Arctic transects. Environ. Res. Lett. 2012;7:015504. [Google Scholar]
- Zeng Y. Malanson GP. Endogenous fractal dynamics at alpine treeline ecotones. Geogr. Anal. 2006;38:271–287. [Google Scholar]
Associated Data
This section collects any data citations, data availability statements, or supplementary materials included in this article.
Supplementary Materials
Appendix S1.Change in pattern metrics PCTCOV (percent shrub cover), PADENS (patch density), CVSIZE (coefficient of variation of patch size), and MEDIST (mean Euclidean nearest neighbor distance) of the Ayiyak, Chandler, Colville, Killik, and Kurupa sites.
Appendix S2. Change in pattern metrics PCTCOV (percent shrub cover), PADENS (patch density), CVSIZE (coefficient of variation of patch size), and MEDIST (mean Euclidean nearest neighbor distance) of the Nanushuk 1, Nanushuk 2, Nigu, and Nimiuktuk sites.
Appendix S3. Information fractal dimension (dI) profiles for all nine sites examined in this study.


