

Abstract
Purpose
To apply k-means clustering of two pharmacokinetic parameters derived from 3T DCE-MRI to predict chemotherapeutic response in bladder cancer at the mid-cycle time-point.
Materials and Methods
With the pre-determined number of 3 clusters, k-means clustering was performed on non-dimensionalized Amp and kep estimates of each bladder tumor. Three cluster volume fractions (VFs) were calculated for each tumor at baseline and mid-cycle. The changes of three cluster VFs from baseline to mid-cycle were correlated with the tumor’s chemotherapeutic response. Receiver-operating-characteristics curve analysis was used to evaluate the performance of each cluster VF change as a biomarker of chemotherapeutic response in bladder cancer.
Results
k-means clustering partitioned each bladder tumor into cluster 1 (low kep and low Amp), cluster 2 (low kep and high Amp), cluster 3 (high kep and low Amp). The changes of all three cluster VFs were found to be associated with bladder tumor response to chemotherapy. The VF change of cluster 2 presented with the highest area-under-the-curve value (0.96) and the highest sensitivity/specificity/accuracy (96%/100%/97%) with a selected cutoff value.
Conclusion
k-means clustering of the two DCE-MRI pharmacokinetic parameters can characterize the complex microcirculatory changes within a bladder tumor to enable early prediction of the tumor’s chemotherapeutic response.
Keywords: bladder cancer, chemotherapeutic response, k-means clustering, pharmacokinetic parameters
INTRODUCTION
Neoadjuvant chemotherapy (NC) has been established as a standard treatment prior to radical cystectomy for muscle-invasive bladder cancers (1). The rate of bladder cancer response to NC ranges from 50% to 60% (2). For responsive patients, NC helps minimize the risk of micrometastasis and reduce the tumor burden by downstaging or significant volume reduction (1). However, NC for non-responsive bladder cancer causes an unnecessary delay of the definitive surgical treatment, and therefore, may lead to tumor progression or avoidable surgical complications (3). Therefore, early assessment of chemotherapeutic response in bladder cancer is critical for successful patient management. To date, there is no effective biomarker to satisfy this unmet clinical need.
In bladder imaging, Magnetic Resonance Imaging is the only imaging modality that has demonstrated value in the evaluation of therapeutic response in bladder tumors (4–7). It has been reported that dynamic contrast-enhanced MRI (DCE-MRI) has high accuracy in predicting the final response of bladder cancer at the mid-cycle time-point of chemotherapy (4, 6).
Previous MRI studies used the mean or median values of functional parameters including DCE-MRI pharmacokinetic parameters and apparent diffusion coefficient (ADC) derived from diffusion-weighted imaging (DWI) to evaluate therapeutic effectiveness of treatments on different cancers (8–11). However, quantitative assessment using these simple statistical values reflects neither the spatial heterogeneity nor the complex changes of functional parameters within a cancerous tumor (12). The k-means clustering method is increasingly applied to solve these limitations in analyzing quantitative MRI data for monitoring therapeutic response in cancers (13–16). The technique is used to segment a set of data into a predetermined number (k) of data clusters based on the distance of each data point from the cluster centers (cluster means).
MRI of pelvic regions, especially the bladder, has experienced substantial quality improvement with the introduction of current generation 3T scanner using multi-transmit technology (17). Compared to lower fields, 3T MRI has a higher spatial resolution and better signal-to-noise and contrast-to-noise ratios (18, 19). 3T MRI also gives a longer longitudinal relaxation time T1, therefore, provides contrast-enhanced MRI (CE-MRI) and DCE-MRI with a significantly higher signal contrast than 1.5T (18). Simultaneously, multi-transmit helps 3T MRI to overcome dielectric artifacts, improve B1 field homogeneity, and reduce local signal absorption rate (SAR) (20).
The goal of this study is to apply k-means clustering of voxel-wise DCE-MRI pharmacokinetic parameters to assess chemotherapeutic response in bladder cancer at the mid-cycle time-point.
MATERIALS AND METHODS
Subjects
This study was approved by the Institutional Review Board. All patients provided written informed consent before their enrollment. The criteria for patient inclusion were: (1) 18 years of age or older; (2) able and willing to provide written informed consent; (3) had no MRI contradictions; (4) pathologically confirmed to have bladder cancer; and (5) scheduled for neoadjuvant chemotherapy followed by cystectomy. From July 2009 to May 2013, thirty patients (twenty-six males and four females; age: range, 38–86 years, median, 66 years) were included in the study. All patients had transurethral resection of bladder tumor (TURBT) prior to the MRIs and neoadjuvant cisplatin-based chemotherapy (twenty-one days per cycle). The histopathological classification of the TURBT specimen was used as the pre-chemotherapy T stage (Figure 1A). Each patient was scheduled to have three (pre-chemotherapy, mid-cycle, and post-chemotherapy) MRI exams followed by radical cystectomy. The histopathological classification of a cystectomy bladder specimen was used as the post-chemotherapy T stage (Figure 1A).
Figure 1. Flow charts of response criteria (A) and data analysis (B).

Flow chart A: Response criteria. TURBT, transurethral resection of bladder tumor. In blue is the flow of the comparison between the pathological classifications of TURBT (Pre-chemotherapy stage) and cystectomy (post-chemotherapy) specimens. In red is the flow of the comparison between pre- and post- chemotherapy tumor volumes estimated by a radiologist on T2W MR images. The response criteria were based on the changes of both pT classification (T stage) and tumor volume.
Flow chart B: Data analysis using k-means clustering. Amp, the amplitude of signal enhancement. kep, the exchange rate of the contrast agent between EES and the plasma space. VF, volume fraction. In blue is the flow of baseline data. In light red is the flow of mid-cycle data. The k-means clustering of (Ampn, ) space was performed on each patient data pool that includes the patient’s baseline and mid-cycle data to determine three cluster centers (centroids). With the determined centroids, three cluster VFs of the patient’s tumor at baseline and mid-cycle were separately calculated. The differences of three cluster VFs were correlated with the tumor response.
Response criteria
Response criteria were based on the difference in tumor volume and the change in pT classification (pathological T classification) after neoadjuvant chemotherapy as illustrated in Figure 1A. Tumor regions of interest (ROIs) was placed by a radiologist (Z.K.S, 12 years of experience) using 1 mm - resolved T2W MR images of pre- and post-chemotherapy MRI scans to estimate the tumor volume change. The change of tumor T stage was determined by comparing pre- with post-chemotherapy pT classifications (pre- and post-chemotherapy T stages).
A patient was defined as a responder if the patient satisfied one of the following criteria:
No malignancy was found by pathology in their cystectomy bladder specimen. This was categorized as tumor complete response.
Post-chemotherapy T stage was lower than pre-chemotherapy T stage and there was no tumor volume increase. This was categorized as tumor downstaging.
There was tumor volume reduction of 50% or more after chemotherapy and no downstaging. This was categorized as significant tumor volume reduction.
A patient was defined as a non-responder if none of these criteria was met.
MRI Protocols
All scans were performed on a 3T MRI system (Achieva; Philips Healthcare, Cleveland, Ohio, USA) with the utilization of 2-channel RF multi-transmit and a 32-channel phased-array surface coil.
Transverse T2-weighted MRI (T2W-MRI) was performed with a Turbo Spin Echo (TSE) sequence (repetition time/echo time, 4264/80 ms; matrix, 292×323; in-plane spatial resolution, 1.0×1.1 mm; slice thickness, 3.0 mm; slice gap, 0.3 mm; number of slices, 40; acquisition time, 300 s; field of view, 130 mm; sensitivity encoding factor, 2) prior to the contrast administration.
DCE-MRI was performed with a 3D-spoiled Gradient Echo sequence (repetition time/echo time, 5/2 ms; flip angle, 20°; matrix, 212×213; in-plane spatial resolution, 1.7×1.7 mm; slice thickness, 5.0 mm; number of slices, 19; field of view, 95 mm; temporal resolution, 8.3 sec; acquisition time, 510 s; number of dynamic scans, 60) in the transverse orientation. A single bodyweight-based dose (0.1 mmol per kilogram) of Gd-based contrast agent (Magnevist, Bayer Healthcare) was intravenously injected at a constant rate of 0.5 mL/s after the fifth dynamic scan, followed by a flush of 25 mL saline at a flow rate of 2mL/s. The injection rate of 0.5 mL/s was used in this study to allow better estimation of kep. Depending on the patient’s weight, injection time ranged from 21 to 50 s, with a median of 30 s.
Data Post Processing
Post processing of DCE-MRI data was done on in-house software written in Interactive Data Language (IDL) (Exelis VIS, Boulder, Colorado, USA). A region of interest (ROI) was placed on the right common femoral artery to acquire an arterial input function (AIF) for the DCE-MRI dataset of each MRI exam. Voxel-wise pharmacokinetic parameters were estimated with a modified Brix’s linear two-compartment pharmacokinetic model proposed by Yang et al. (21). The two parameters used for k-means clustering were the amplitude of signal enhancement (Amp) and the AIF-adjusted exchange rate of the contrast agent between EES and the plasma space (kep). For the Brix’s model, the parameter Amp contains the tissue’s characteristics parameters including T1 relaxation time (21, 22). Therefore, T1 mapping is not needed in the Brix model.
Data analysis
The flow chart of data analysis using k-means clustering is described in Figure 1B. Baseline (pre-chemotherapy) and mid-cycle DCE-MRI data were used.
For each patient, the radiologist placed tumor ROIs to acquire two datasets of voxel-wise parameters (Amp, kep) at baseline and mid-cycle. The two (Amp, kep) datasets were combined in the patient data pool. Voxel-wise Amp and kep values were non-dimensionalized using their averages:
where Ampn and are non-dimensionalized (unit-less) Amp and kep.
The number of clusters (k) was selected to be 3 for k-means clustering. Applying a method proposed by Aravind and Soman (23), k-means clustering of (Ampn, ) space was performed on Microsoft Office Excel (Version 2013) with the aid of Solver add-in to determine three cluster centers (centroids).
The determined centroids were used to calculate three cluster volume fractions (VFs) of the patient’s bladder tumor at baseline and mid-cycle. The changes of the three cluster VFs from baseline to mid-cycle were correlated with the tumor response to chemotherapy.
Color cluster maps were overlaid on original T1-weighted DCE MR Images by using IDL software.
Statistical Analysis
Descriptive statistics (i.e. mean, standard deviation, and 95% confidence interval) were provided for cluster VFs at baseline and their changes from baseline to mid-cycle in each patient. All cluster VFs were normally distributed using Kolmogorov-Smirnov test (all p>0.1). The differences between responders and non-responders in the changes of cluster VFs were evaluated by a two-sided sample t-test. The Holm-Bonferroni method was used to adjust for multiplicity. P<0.05 was considered to be statistically significant.
Receiver Operating Characteristic (ROC) curve analysis was used to assess and compare the performance of using three cluster VF changes as biomarkers of chemotherapeutic response in bladder cancer. Area-under-the-curve (AUC) values were estimated for each cluster VF change. A cut-off value of each cluster VF change was selected with the best combination of sensitivity and specificity in classifying responders and non-responders. The statistical analysis was done on a commercial statistical package (SAS 9.2; SAS Institute Inc., Cary, NC, USA).
RESULTS
Numbers of Responders and Non-responders
Prior to radical cystectomy, twenty-seven patients completed all three MRIs, and three only had baseline and mid-cycle MRIs because their tumor progression or a specific co-morbidity indicated the need of immediate cystectomy. Bladder tumors in two patients (who had three MRIs) were unresectable. A total of twenty-eight patients had cystectomy.
All patients had one bladder tumor shown on MR images (baseline and mid-cycle). Twenty-three patients were identified as responders (Table 1). All responders had radical cystectomy. The pathological examination of cystectomy bladder specimens confirmed ten patients with no malignancy after chemotherapy (complete response). Comparing the pre- and post-chemotherapy T stages as well as tumor volumes, five patients were categorized in tumor downstaging, eight were categorized in significant tumor volume reduction.
Table 1.
Responders and non-responders
| Category | Post-chemotherapy T stage | Number of patients |
|---|---|---|
| Pathological complete response | pT0 | 10 |
| Downstaging | pTis | 2 |
| pT1 | 3 | |
| Significant volume reduction | pT2 | 6 |
| pT3 | 2 | |
| Non-responders with cystectomy | pT3 | 4 |
| pT4 | 1 | |
| Non-responders without cystectomy | NA* | 2 |
Not applicable
The remaining seven patients including two without cystectomy were identified as non-responders (Table 1). Five patients who had cystectomy did not have tumor downstaging. All seven non-responders either had tumor volume increase or tumor volume reduction of less than 50% from baseline to post-chemotherapy.
Microcirculation characteristics of three clusters
Three cluster centroids of thirty cases were all distributed in the same regions on the (Amp, kep) space: (low kep, low Amp) for cluster 1, (low kep, high Amp) for cluster 2 and (high kep, low Amp) for cluster 3 (Figure 2A). Each bladder tumor was segmented in three clusters: cluster 1 with voxels of low kep and low Amp, cluster 2 with voxels of low kep and high Amp, and cluster 2 with voxels of high kep and low Amp (Figure 3).
Figure 2. Signal enhancement characteristics of the three clusters.

Image A: The distribution of three cluster centers in the (Amp and kep) space. For each of thirty patients, a set of three cluster centers were determined. Cluster centers of all thirty patients were distributed in the same region.
Image B: A color cluster map. MR image of a male patient, aged 59. In blue, orange, and red are the voxels of cluster 1, cluster 2, and cluster 3, respectively.
Images C, D, E: The signal intensity curves of three clusters. Cluster 1 (blue) with low kep and low Amp has a flat and shallow curve. Cluster 2 (orange) with low kep and high Amp has a high curve. Cluster 3 (red) with high kep and low Amp has a steep-sloped curve.
Figure 3. Color cluster maps of a responder (A, B) vs. a non-responder (C, D). MR images of a responder (male, age: 51) and a non-responder (male, age: 54).

Images A, B: In a responsive tumor, cluster 1 (blue) and cluster 3 (red) show a larger volume reduction than cluster 2 (orange) from baseline (Image A) to mid-cycle (Image B). This results in the reduction of the VFs of clusters 1 and 3, and the increase of the cluster 2 VF.
Images C, D: In a non-responsive tumor, cluster 1 (blue) and cluster 3 (red) show a volume increase, while cluster 2 (orange) shows a volume reduction from baseline (Image C) to mid-cycle (Image D). This results in the increase of the VFs of clusters 1 and 3, and the reduction of the cluster 2 VF.
Since Amp and kep characterize the amplitude and the rate of microcirculation within tumor tissues, the three clusters showed different microcirculation characteristics that were reflected in the signal enhancement properties (Figures 2C, 2D, and 2E).
Visualization of heterogeneous response
Color cluster maps (Figures 2 & 3) showed the inhomogeneous distribution of pharmacokinetic parameters Amp and kep, i.e. inhomogeneous microcirculation, within a bladder tumor. After chemotherapy, the microcirculation distribution changed within the tumor in terms of its chemotherapeutic response. The color cluster maps demonstrated heterogeneity in chemotherapeutic response within a bladder tumor from baseline to mid-cycle (Figure 3). In responders, clusters 1 and 3 showed a larger volume reduction than cluster 2, or the voxels of cluster 2 replaced those of the other two clusters. On the contrary, in non-responders, clusters 1 and 3 had a smaller volume reduction or larger volume increase than cluster 2, or the voxels of clusters 1 and 3 replaced those of cluster 2. This difference in chemotherapeutic response between responders vs. non-responders can be quantified by the volume fractions (VFs) of the three clusters.
Correlation of cluster VF changes with chemotherapeutic response
The VFs of clusters 1, 2, 3 were calculated for each patient at baseline and mid-cycle. At baseline, VFs of clusters 1, 2, and 3 had mean values of 58±10(%), 24±8(%), and 17±7(%) for twenty-three responders, and 52±10(%), 32±9(%), and 16±3(%) for seven non-responders. No significant difference in the three cluster VFs was found between responders vs. non-responders at baseline (P =0.48, 0.12, 1 for clusters 1, 2, 3, respectively).
The changes of three cluster VFs from baseline to mid-cycle were determined for each patient. The average VF changes of clusters 1, 2, 3 were respectively −9%, 17%, −5% for responders, and 12%, −15%, 3% for non-responders. The VF of cluster 2 increased in twenty-two (96%) responders and decreased in all non-responders. In contrast, VFs of clusters 1 and 3 reduced in seventeen responders and increased in five (cluster 1) or six (cluster 3) non-responders. Student t-test showed that the responders had a significantly higher cluster 2 VF change (P<0.001) and significantly lower VF changes of clusters 1 (P=0.002) and 3 (P=0.005) than non-responders. These changes in a responder vs. a non-responder were illustrated by color cluster maps (Figure 3) and cluster plots (Figure 4).
Figure 4. Cluster plots of a responder (A, B) vs. a non-responder (C, D) in the (Amp and kep) space.

Plots A and B: Cluster plots for a responsive tumor. From baseline (Plot A) to mid-cycle (Plot B), the VFs of clusters 1, 2, 3 change from 69% to 60% (decrease), from 7% to 37% (increase), from 24% to 3% (decrease), respectively.
Plots C and D: Cluster plots for a non-responsive tumor. From baseline (Plot C) to mid-cycle (Plot D), the VFs of clusters 1, 2, 3 change from 35% to 56% (increase), from 43% to 18% (decrease), from 22 to 26% (increase), respectively.
The 95% confidence intervals (CI) for the three cluster VF changes in responders and non-responders are listed in Table 2. There was no overlap between responders and non-responders for the 95% CI of all three VF changes.
Table 2.
Volume fraction (VF) changes of cluster 1, 2, and 3 in responders vs. non-responders. Using ROC curve analysis, the cutoff values of volume fraction (VF) changes of clusters 1, 2, and 3 were determined to predict chemotherapeutic response in bladder cancer.
| VF change | Responders Mean (95% CI) |
Non-responders Mean (95% CI) |
p-value | Cutoff value | (Sens., Spec., Acc.) |
|---|---|---|---|---|---|
| Cluster 1 | −9% (−14%, −3%) | 12% (−1%, 24%) | 0.002 | 4% | (87%, 71%, 83%) |
| Cluster 2 | 15% (8%, 20%) | −15% (−28%, −2%) | < 0.001 | 1% | (96%, 100%, 97%) |
| Cluster 3 | −5% (−11%, 0%) | 3% (0%, 5%) | 0.005 | −1% | (74%, 86%, 77%) |
Cluster VF changes as biomarkers of chemotherapeutic response
ROC curve analysis calculated area-under-the-curve (AUC) values for using each cluster VF change as a biomarker of chemotherapeutic response. AUC values were 0.86, 0.96, and 0.74 for the VF changes of clusters 1, 2, and 3, respectively (Figures 5). The cutoff values of the three cluster VF changes were selected to be 4% (cluster1), 1% (cluster 2), and −1% (cluster 3) (Figure 6). These values corresponds to the points closest to the top left corner of each ROC curve (Figure 5). The sensitivities, specificities, and accuracies given by these cutoff values are listed in Table 2. Accompanied with the highest AUC value (0.97), the VF change of cluster 2 presented with the highest sensitivity (96%), specificity (100%), and overall accuracy (97%) (Figures 5 and 6, and Table 3). The VF change of cluster 3 had a higher specificity but a lower sensitivity and accuracy than that of cluster 1.
Figure 5.

ROC curve analysis of the three VF changes for predicting chemotherapeutic response in bladder cancer at the mid-cycle time-point. Plot A: ROC curve for cluster 1. Plot B: ROC curve for cluster 2. Plot C: ROC curve for cluster 3. Plot D: Three ROC curves in comparison. The cutoff values of VF changes for clusters 1, 2, and 3 were selected with the points marked with 0.69, 0.78, and 0.76 on ROC curves, respectively.
Figure 6.
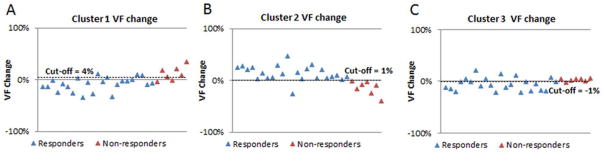
The volume fraction (VF) changes of three clusters from baseline to mid-cycle in responders vs. non-responders. Graphs A, B, C are respectively the VF changes of clusters 1, 2, 3 in twenty-three responders (blue triangles) and seven non-responders (red triangles) with a selected cutoff value (represented by dot lines).
DISCUSSION
Functional imaging parameters derived from DWI and DCE-MRI have been found to be associated with the characteristics of therapeutic response in different types of cancers (7–11). The change in apparent diffusion coefficient (ADC) was correlated with the response to chemo-radiation therapy (CRT) in rectal (9) and cervical (10) cancers. Increases of DCE-MRI pharmacokinetic parameters were indicative of a good chemo-radio-therapeutic response of oral tumors (8). In bladder cancer, Yoshida (7) reported that CRT-sensitive tumors had significantly lower ADC values than CRT-resistant tumors and the sensitivity/specificity/accuracy for the prediction of CRT response were 92/90/91(%) with a selected cutoff of ADC value. All of these studies used the change in a single statistic (mean or median) of a functional parameter for an entire tumor and disregarded the inhomogeneity of both parameter distribution and therapeutic response within the tumor. Using a k-means clustering technique, our study has illustrated the heterogeneous distribution of the two DCE-MRI pharmacokinetic parameters within a bladder tumor. Based on this heterogeneity, a tumor was segmented into three clusters whose VF changes were associated with the tumor’s chemotherapeutic response. The highest sensitivity, specificity, and accuracy of using three cluster VF changes to predict chemotherapeutic response were 96%, 100%, and 97% with a cutoff value of cluster 2 VF change.
The k-means clustering technique has been shown to be a useful data mining tool in the analysis of quantitative MRI data to characterize the heterogeneity of pathophysiological characteristics within a malignant tumor (13–16). The k-means clustering of ADC values was better than pure mean ADC at characterizing neck malignancies and distinguishing malignant from benign tissues (16). The analysis of BOLD functional MRI based on k-means clustering could display the heterogeneity of hemodynamic response inside tumors (14). In the analysis of malignant intra-tumoral kinetic curves in DCE-MRI, optimal k-means clustering was better than a three-time-points technique in partitioning intra-tumoral kinetic patterns, which helps identify and characterize internal kinetic heterogeneity and vascular changes of breast tumors. The k-means clustering of DCE-MRI pharmacokinetic parameters showed an association of a cluster VF with primary tumor control (13). The results in our study have also showed that k-means clustering of DCE-MRI pharmacokinetic parameters could help to both visualize the spatial heterogeneity of chemotherapeutic response within a bladder tumor and distinguish responders from non-responders via the changes of three cluster VFs.
In this study, responsive bladder tumors showed an increase in the VF of cluster 2 and a reduction in the VFs of both clusters 1 and 3 from baseline to mid-cycle. Given that cluster 2 had low kep and high Amp, the increase in the cluster 2 VF may be attributed to the inflammatory and reactive changes in responders due to chemotherapy. In contrast, non-responders had an increase in the VFs of clusters 1 and 3 and a decrease in the VF of cluster 2. The increase in the VFs of clusters 1 (with low kep and low Amp) and 3 (with high kep and low Amp) may be attributed to the necrotic tissues and the neoangiogenesis during the treatment.
Though several previous studies of k-means clustering of functional MRI parameters for the assessment of therapeutic response have been able to describe the heterogeneity of tumor response (13, 14), they did not identify a potential biomarker that could be used to predict therapeutic response in an individual patient. Meanwhile, the summary statistics (mean or median) of several functional MRI parameters have been claimed to be potential biomarkers for therapeutic response in cancers, however, these statistics failed to show the spatial inhomogeneity of response within a tumor. In our study, each of three cluster VF changes was shown to be a potential biomarker of chemotherapeutic response in bladder cancer. Using the VF changes of clusters 1, 2, 3 as response predictors at the mid-cycle time-point presented with AUC values of 0.86, 0.96, and 0.74, respectively.
The number of clusters k needs to be determined before k-means clustering is performed. There have been a number of proposed approaches for the determination of k (24). Each approach has its own strengths and drawbacks. The selection of an approach is dependent on the type of data and often based on some data assumptions. To perform k-means clustering of DCE-MRI pharmacokinetic parameters, Andersen et al. (13) used a validity index to determine k from a range from 2 to 7. It was shown that three clusters provided the optimal k-means clustering of pharmacokinetic parameters of cervical cancers. One of these three clusters had the VF associated with primary tumor control. Our pilot study (unpublished) used a similar approach to determine the number of clusters and also found the same optimal number for k-means clustering of two pharmacokinetic parameters Amp and kep. Therefore, k-means clustering with k of three was performed in the patient population of this study. The VFs of all three clusters reflected the complex changes of tumor microcirculation after chemotherapy. The changes of all three cluster VFs were highly correlated with and potential biomarkers of chemotherapeutic response in bladder tumors.
The criteria for bladder cancer’s response to a pre-operative treatment including chemotherapy and radiotherapy varied in different studies (4, 6, 7). There are no criteria that are entirely accurate in reflecting the therapeutic effect on cancer tissues. We used the changes in tumor stage and volume after chemotherapy to determine responders and non-responders in the study’s patient population. All patients had TURBT prior to MRIs and chemotherapy. The contribution of TURBT to the changes in tumor volume and stage was not distinguishable from the effect of chemotherapy.
A limitation in our study is that the number of non-responders was small (N=7). Although this number depends on chemotherapeutic response in bladder cancers, it will generally increase with a larger patient population. Motion correction was not applied to the analysis of the DCE-MRI data. In the next phase of the study, an optimal technique of motion correction for the data analysis will be determined to further assess the significance of using k-means clustering of DCE-MRI pharmacokinetic parameters in the assessment of chemotherapeutic response in bladder cancer.
In conclusion, while size-based assessment of response is not always reliable, k-means clustering of pharmacokinetic parameters demonstrates robustness in characterizing the complex microcirculatory changes within a bladder tumor to enable early prediction of tumor response to chemotherapy. These promising findings have led to a prospective validation clinical trial that uses this analytical approach for the assessment of neoadjuvant chemotherapeutic response in bladder cancer.
Acknowledgments
Grant Support
This study is supported by Wright Center of Innovation in Biomedical Imaging and The Ohio State University medical center imaging signature program.
References
- 1.Griffiths TR. Current perspectives in bladder cancer management. Int J Clin Pract. 2013;67:435–448. doi: 10.1111/ijcp.12075. [DOI] [PubMed] [Google Scholar]
- 2.Griffiths G, Hall R, Sylvester R, Raghavan D, Parmar MK. International phase III trial assessing neoadjuvant cisplatin, methotrexate, and vinblastine chemotherapy for muscle-invasive bladder cancer: long-term results of the BA06 30894 trial. J Clin Oncol. 2011;29:2171–2177. doi: 10.1200/JCO.2010.32.3139. [DOI] [PMC free article] [PubMed] [Google Scholar]
- 3.Chang JS, Lara PN, Jr, Pan CX. Progress in personalizing chemotherapy for bladder cancer. Adv Urol. 2012;2012:364919. doi: 10.1155/2012/364919. [DOI] [PMC free article] [PubMed] [Google Scholar]
- 4.Barentsz JO, Berger-Hartog O, Witjes JA, et al. Evaluation of chemotherapy in advanced urinary bladder cancer with fast dynamic contrast-enhanced MR imaging. Radiology. 1998;207:791–797. doi: 10.1148/radiology.207.3.9609906. [DOI] [PubMed] [Google Scholar]
- 5.Dobson MJ, Carrington BM, Collins CD, et al. The assessment of irradiated bladder carcinoma using dynamic contrast-enhanced MR imaging. Clin Radiol. 2001;56:94–98. doi: 10.1053/crad.2000.0560. [DOI] [PubMed] [Google Scholar]
- 6.Schrier BP, Peters M, Barentsz JO, Witjes JA. Evaluation of chemotherapy with magnetic resonance imaging in patients with regionally metastatic or unresectable bladder cancer. Eur Urol. 2006;49:698–703. doi: 10.1016/j.eururo.2006.01.022. [DOI] [PubMed] [Google Scholar]
- 7.Yoshida S, Koga F, Kobayashi S, et al. Role of diffusion-weighted magnetic resonance imaging in predicting sensitivity to chemoradiotherapy in muscle-invasive bladder cancer. Int J Radiat Oncol Biol Phys. 2012;83:e21–e27. doi: 10.1016/j.ijrobp.2011.11.065. [DOI] [PubMed] [Google Scholar]
- 8.Chikui T, Kitamoto E, Kawano S, et al. Pharmacokinetic analysis based on dynamic contrast-enhanced MRI for evaluating tumor response to preoperative therapy for oral cancer. J Magn Reson Imaging. 2012;36:589–597. doi: 10.1002/jmri.23704. [DOI] [PubMed] [Google Scholar]
- 9.Jung SH, Heo SH, Kim JW, et al. Predicting response to neoadjuvant chemoradiation therapy in locally advanced rectal cancer: diffusion-weighted 3 Tesla MR imaging. J Magn Reson Imaging. 2012;35:110–116. doi: 10.1002/jmri.22749. [DOI] [PubMed] [Google Scholar]
- 10.Kim HS, Kim CK, Park BK, Huh SJ, Kim B. Evaluation of therapeutic response to concurrent chemoradiotherapy in patients with cervical cancer using diffusion-weighted MR imaging. J Magn Reson Imaging. 2013;37:187–193. doi: 10.1002/jmri.23804. [DOI] [PubMed] [Google Scholar]
- 11.Oberholzer K, Menig M, Pohlmann A, et al. Rectal cancer: Assessment of response to neoadjuvant chemoradiation by dynamic contrast-enhanced MRI. J Magn Reson Imaging. 2013;38:119–126. doi: 10.1002/jmri.23952. [DOI] [PubMed] [Google Scholar]
- 12.Rose CJ, Mills SJ, O’Connor JP, et al. Quantifying spatial heterogeneity in dynamic contrast-enhanced MRI parameter maps. Magn Reson Med. 2009;62:488–499. doi: 10.1002/mrm.22003. [DOI] [PubMed] [Google Scholar]
- 13.Andersen EK, Kristensen GB, Lyng H, Malinen E. Pharmacokinetic analysis and k-means clustering of DCEMR images for radiotherapy outcome prediction of advanced cervical cancers. Acta Oncol. 2011;50:859–865. doi: 10.3109/0284186X.2011.578586. [DOI] [PubMed] [Google Scholar]
- 14.Baudelet C, Gallez B. Cluster analysis of BOLD fMRI time series in tumors to study the heterogeneity of hemodynamic response to treatment. Magn Reson Med. 2003;49:985–990. doi: 10.1002/mrm.10468. [DOI] [PubMed] [Google Scholar]
- 15.Lee SH, Kim JH, Kim KG, Park JS, Park SJ, Moon WK. Optimal clustering of kinetic patterns on malignant breast lesions: comparison between K-means clustering and three-time-points method in dynamic contrast-enhanced MRI. Conf Proc IEEE Eng Med Biol Soc. 2007;2007:2089–2093. doi: 10.1109/IEMBS.2007.4352733. [DOI] [PubMed] [Google Scholar]
- 16.Srinivasan A, Galban CJ, Johnson TD, Chenevert TL, Ross BD, Mukherji SK. Utility of the k-means clustering algorithm in differentiating apparent diffusion coefficient values of benign and malignant neck pathologies. AJNR Am J Neuroradiol. 2010;31:736–740. doi: 10.3174/ajnr.A1901. [DOI] [PMC free article] [PubMed] [Google Scholar]
- 17.Nguyen HT, Pohar KS, Jia G, et al. Improving Bladder Cancer Imaging Using 3-T Functional Dynamic Contrast-Enhanced Magnetic Resonance Imaging. Invest Radiol. 2014 doi: 10.1097/RLI.0000000000000022. (epub ahead of print) [DOI] [PMC free article] [PubMed] [Google Scholar]
- 18.Krautmacher C, Willinek WA, Tschampa HJ, et al. Brain tumors: full- and half-dose contrast-enhanced MR imaging at 3.0 T compared with 1. 5 T. Initial Experience Radiology. 2005;237:1014–1019. doi: 10.1148/radiol.2373041672. [DOI] [PubMed] [Google Scholar]
- 19.Londy FJ, Lowe S, Stein PD, et al. Comparison of 1.5 and 3. 0 T for contrast-enhanced pulmonary magnetic resonance angiography. Clin Appl Thromb Hemost. 2012;18:134–139. doi: 10.1177/1076029611419840. [DOI] [PMC free article] [PubMed] [Google Scholar]
- 20.Willinek WA, Gieseke J, Kukuk GM, et al. Dual-source parallel radiofrequency excitation body MR imaging compared with standard MR imaging at 3. 0 T: initial clinical experience. Radiology. 2010;256:966–975. doi: 10.1148/radiol.10092127. [DOI] [PubMed] [Google Scholar]
- 21.Yang X, Liang J, Heverhagen JT, et al. Improving the pharmacokinetic parameter measurement in dynamic contrast-enhanced MRI by use of the arterial input function: theory and clinical application. Magn Reson Med. 2008;59:1448–1456. doi: 10.1002/mrm.21608. [DOI] [PubMed] [Google Scholar]
- 22.Brix G, Semmler W, Port R, Schad LR, Layer G, Lorenz WJ. Pharmacokinetic parameters in CNS Gd-DTPA enhanced MR imaging. J Comput Assist Tomogr. 1991;15:621–628. doi: 10.1097/00004728-199107000-00018. [DOI] [PubMed] [Google Scholar]
- 23.Aravind H, Rajgopal C, Soman KP. A Simple Approach to Clustering in Excel. International Journal of Computer Applications. 2010;11:19–25. [Google Scholar]
- 24.Pham DT, Dimov SS, Nguyen CD. Selection of k in k-means clustering. Mechanical Engineering Science. 2004;219:103–119. [Google Scholar]