

Abstract
Radiotherapy (RT) is a central treatment modality for breast cancer patients. The purpose of our study was to investigate the DNA methylation changes in tumors following RT, and to identify epigenetic markers predicting treatment outcome. Paired biopsies from patients with inoperable breast cancer were collected both before irradiation (n = 20) and after receiving 10–24 Gray (Gy) (n = 19). DNA methylation analysis was performed by using Illumina Infinium 27K arrays. Fourteen genes were selected for technical validation by pyrosequencing. Eighty-two differentially methylated genes were identified in irradiated (n = 11) versus nonirradiated (n = 19) samples (false discovery rate, FDR = 1.1%). Methylation levels in pathways belonging to the immune system were most altered after RT. Based on methylation levels before irradiation, a panel of five genes (H2AFY, CTSA, LTC4S, IL5RA and RB1) were significantly associated with clinical response (p = 0.041). Furthermore, the degree of methylation changes for 2,516 probes correlated with the given radiation dose. Within the 2,516 probes, an enrichment for pathways involved in cellular immune response, proliferation and apoptosis was identified (FDR < 5%). Here, we observed clear differences in methylation levels induced by radiation, some associated with response to treatment. Our study adds knowledge on the molecular mechanisms behind radiation response.
Keywords: irradiation, immune response, methylation, breast cancer, dose dependent
Cancer is one of the most common human diseases, and worldwide 1.38 million new breast cancer incidences are recorded annually.1 The use of radiotherapy (RT) is increasing together with a tremendous development in treatment planning, where optimal fractionation and precision of the dose to the target volume are important factors for minimizing the side effect as well as increasing the probability of tumor control.2 Still, some patients respond poorly to the treatment, suggesting that relevant genetic and epigenetic variations between individuals exist.3 The impact of epigenetic mechanisms on the response to RT is poorly understood. DNA methylation is an important epigenetic mechanism because it influences many cellular processes and participates in regulating gene transcription.4 Methylation changes in CpG islands after exposure to ionizing radiation (IR) have been described in breast cancer cell lines,5 and a correlation between radiation responsiveness and altered DNA methylation levels has been observed in cultured cells.6 Different pathways are known to be activated following irradiation, such as prosurvival signaling, DNA repair pathways7 and DNA damage pathways,8 to maintain cell stability, and DNA methylation may influence these pathways by affecting gene expression.
In our study, we have addressed to what degree radiotherapy (RT) affects DNA methylation profiles in patient samples and if changes in methylation levels are associated with response to therapy. By comparing irradiated tumor tissue with nonirradiated tumor tissue from the very same patient, we attempted to discover differential methylation patterns and obtain important information about pathway regulations associated with radiation. Genome-wide methylation effects were investigated in tissue biopsies both before exposure to IR and after receiving 10–24 Gray (Gy).
What's new?
Radiotherapy is a central treatment modality for breast cancer patients. This study set to investigate DNA methylation changes in tumors following radiotherapy and identify epigenetic markers predicting treatment outcome. Genome-wide methylation effects were studied by comparing breast cancer biopsies before and after irradiation. 82 differentially methylated genes enriched for immune regulation pathways were identified. Based on methylation levels before irradiation, a combination of 5 genes was significantly associated with response to radiotherapy. A dose dependency was seen for 2516 probes, mainly involved in immune response and apoptosis. This study sheds light on the genes and pathways involved in radiation response.
Material and Methods
Ethical considerations
All patients provided informed consent, and the project was approved by our institutional review board and by the Regional Ethical Committee (REC).
Samples and datasets
Twenty breast cancer patients treated with radiation during 2002–2005 were included in our study. All patients had inoperable breast cancer stage 3–4 or local relapse, with no standard treatment established. Some patients had received systemic treatment before the RT. The volume targeted was the mammary gland and affected lymph nodes when present. Total dose prescribed was 25 × 2 Gy with photons or 23 × 2 Gy with photons and 2 × 2 Gy with electrons. Biopsies were collected both before radiation (n = 20) and after receiving 10–24 Gy (n = 19) of photon irradiation, depending on practicalities in biopsy sampling and scheduling. The response to radiation was evaluated after treatment completion, based on alterations in the clinically evaluated tumor size and categorized as good response, partial response, no response or progression. Side effects were evaluated according to RTOG/EORTC Late Radiation Morbidity Scoring Scheme.9 All clinical information is presented in Supporting Information Table S1, which is an updated description of the clinical material that Helland et al. used when studying gene expression.10 Breast tissue from nine healthy women who underwent breast tissue reduction was used as reference material (denoted as normal controls). The methylation array data are available in the Gene Expression Omnibus (GEO) (http://www.ncbi.nlm.nih.gov/geo) with accession number GSE50220.
Cell lines
Breast cancer cell lines MCF-7 (obtained from Interlab Cell Line Collection, Genova, Italy) and SK-BR-3 (obtained from American type Culture Collection, USA) were cultured and irradiated three times with 2 Gy doses and 24 hr between each fractionation dose. The recipe for the growth medium used for the cell lines is given in Supporting Information Table S2. Irradiation was performed by using a Faxitron CP160 X-ray machine (Initios Medical AB, Sweden) (160 kV, 6.3 mA, dose rate 0.5 Gy/min).
DNA isolation
DNA was extracted from breast tumor biopsies and cell lines by using Maxwell® 16 DNA Purification Kits Technical Manual, Literature # TM284 (http://www.promega.com) and a Maxwell®16 instrument.
DNA methylation
The EpiTect® Bisulphite Kit 48 (Qiagen, California, USA) (Source: EpiTect® Bisulphite Handbook, QIAGEN 09/2009) was used to treat DNA with bisulfite, and the amount of converted DNA was measured by real-time polymerase chain reaction (PCR), as previously described.11 The methylation analysis was performed by using Illumina Infinium HumanMethylation27 BeadChip Kits, Genome Build 36 (27K).12 Because of low DNA concentration, the total elution volume of the bisulfite-treated DNA (30–40 μL) was used instead of the recommended 4 μL. To ensure complete denaturation, 30 μL 0.1 M NaOH was used instead of 4 μL as outlined in the methylation 40 protocol guide. The rest of the procedure was performed according to the protocol (Illumina, San Diego, USA Part#11322371 Rev. A). Methylation scores for each CpG site are referred to as “beta” values (using the BeadStudio software from Illumina) ranging from 0 (unmethylated, U) to 1 (fully methylated, M) on a continuous scale, and are calculated from the intensity of the M and U alleles as the ratio of fluorescent signals, b = Max(M,0)/(Max(M,0) + Max(U,0 + 100)).
Pyrosequencing was used as the technical validation for the array data. Pyrosequencing is a “sequencing by synthesis” method that quantitatively analyzes high-quality, bisulfite-converted DNA sequences. Pyrosequencing primers were designed according to Tost and Gut13 and produced by Eurofins MWG Operon. PCRs were performed in a PTC-200 Peltier Thermal Cycler (BioRad) using either the PyroMark PCR Kit (Qiagen) or a Hotstar Taq® DNA Polymerase Kit (Qiagen). The enzyme mix and substrate mix were PyroMark Gold Q96 reagents (Qiagen), while the pyrosequencing reaction was performed in a PyroMark Q96 MD machine. PCR primers, temperature profiles and primers for pyrosequencing are shown in Supporting Information Table S3.
Statistical analysis
The array dataset was quality controlled and normalized. Bead studio software was used for the initial processing of the methylation data. Probes for which a score was missing for any array were discarded (n = 10). Raw data were normalized according to a three-step process: color bias correction, background level correction and quantile normalization. Only those beta values associated with significant p-values were selected for comparing locus methylation status of the data. Individual loci were scored as differentially methylated if the difference between median beta values was greater than or equal to 20% of methylation.
A paired analysis of the samples was utilized with a significance analysis of microarrays (SAM) in J-express (http://www.molmine.com/) (log2-transformation, 2000 permutations). Next, a group comparison based on the beta-values from the array was performed. The dataset was divided into two groups consisting of (i) nonirradiated samples and (ii) irradiated samples, and a Prediction Analysis of Microarrays (PAM) was performed in R (ver. 2.12.2 http://cran.r-project.org/). The “nearest shrunken method” was used to identify those genes best characterizing each class.14 By defining a threshold, a misclassification table for the samples and number of genes with false discovery rate (FDR) were obtained. The threshold giving the lowest overall error (OER) and the minimum misclassified samples was chosen. To test the robustness of the gene list, a “leave one out test” (LOO) was performed in R. Extracted lists based on the PAM analysis were further analyzed by supervised hierarchical clustering in J-express (http://www.molmine.com/) (average linkage and Spearman rank correlation) and ingenuity pathway analysis (IPA; Ingenuity® Systems, http://www.ingenuity.com). A Spearman's rho correlation analysis between given doses and changes in the degree of methylation was performed by using R (ver. 2.15.1). The Mann–Whitney U-test, Fisher's exact test and Spearman's correlation analysis (IBM SPSS Statistics 18) were used when appropriate. Criteria for significance for all analyses were p < 0.05. Furthermore, to investigate the difference between good and poor responses for “before IR” and “after IR” groups, the following statistical procedure was applied: (i) A methylation index (z-score) of the data was obtained by calculating for each sample the deviation from the mean methylation level divided by the standard deviation for each gene. (ii) The relative value of each z-score was taken to measure the size of the effect for the methylation level. (iii) All relative values for one sample were summarized. (iv) The rank-sum test was applied to two groups, good and poor for each group.
Results
DNA methylation associated with RT
Genome-wide DNA methylation data from breast tumor samples (n = 39) and normal controls (n = 9) were obtained with the use of the Illumina Infinium 27K array. By using PAM, 140 probes representing 138 genes (referred to as PAM140 list; see Supporting Information Table S4) were identified as differentially methylated in the nonirradiated samples versus the irradiated samples (FDR = 8.7). For PAM140, OER was 27.8%, indicating that as many as six of 19 after IR samples and five of 20 before IR samples were misclassified. Supervised hierarchical clustering was performed by using the PAM140 list (see Fig. 1a). Six of the paired samples clustered together (102, 112, 113, 117, 121 and 125 marked with a beige box in the cluster), indicating that these after IR samples shared more similarities with its respective sample partner than with the irradiated group. Interestingly, these biopsies were collected after receiving a comparatively lower cumulative dose (10–16 Gy) compared to the other after IR samples (12–24 Gy) (see Fig. 1b). Samples receiving higher cumulative doses generally showed a better separation in the hierarchical clustering, except samples 120 and 104, which were separated in the cluster despite only receiving 12 and 14 Gy, respectively. We hypothesized that the change in methylation level was more prominent after receiving a higher dose. To test this, samples receiving less than 16 Gy were removed (104, 112, 113, 120 and 125) (see Fig. 1b) and the analysis redone. Based on 20 before IR samples and 14 after IR samples, we did a new PAM analysis. With an OER on 20.3%, a gene list containing 211 probes (PAM211) was generated (FDR = 29%). When clustering, three after IR samples still clustered together with the before IR sample (121, 117 and 102). In an attempt to identify the list of genes with a highest radiation-induced difference in methylation, we also excluded these three from the PAM analysis. The reduced sample set was analyzed by using PAM, giving a probe list (84 probes; FDR = 1.1%) corresponding to 82 genes (PAM84 list; see Supporting Information Table S5). The OER was reduced to 12.8%, where one of 11 after IR samples and three of 20 before IR samples were misclassified. There were 40 genes overlapping between PAM84 and PAM140, while PAM211 and PAM84 had 69 overlapping genes. All the top ten genes in PAM84 were also present in the two other lists. To test the robustness of the PAM84 list, a LOO test was performed on all the after IR samples, generating 11 gene lists. By using Spearman's rho correlation, a significant correlation between the lists was obtained (rho = 0.73; p = 2.2E−16), indicating a robust PAM84 gene list. Supervised hierarchical clustering was utilized for the PAM84 list (see Fig. 1c).
Figure 1.

(a) Hierarchical clustering of “before IR” and “after IR” samples. Red samples are irradiated (after IR) and nonirradiated (before IR) samples are shown in green. The beige boxes indicate samples clustering together as before IR/after IR pairs. The colored spots in the dendrogram reflect the beta-value from the 27K array. Yellow spots imply high levels, green intermediate, and blue low levels of methylation. (b) All the samples that were separated in the cluster are shown in the upper panel, while the samples clustering as pairs are displayed in the lower panel. The X-axis gives information about the given dose in each sample. The red circles are those after IR samples that were removed in the new reduced dataset. (c) Hierarchical clustering of the reduced dataset, where eight of the after IR samples are removed.
Next, a paired SAM analysis was performed on all 27,568 probes to see if the degree of methylation had changed after irradiation in the paired samples (n = 19 pairs). Two genes, RB1 and PDCD1, were found to be significantly demethylated (q-val < 0.0001, FDR < 0.0001) after IR.
The ten genes at the top of the PAM84 list (BCAN, H2AFY, CTSA, LTC4S, BNIPL, FGFBP2, GYPE, IL5RA, PCK1 and TPRG1) as well as RB1 and PDCD1 were investigated by using the Mann–Whitney U-test to estimate the statistical significance of the difference in methylation before and after IR. As illustrated in Table1, the genes BCAN (p = 0.042), CTSA (p = 0.044), PDCD1 (p = 0.014), RB1 (p = 0.001), LTC4S (p = 0.029) and H2AFY (p = 0.015) were found to have a significantly higher methylation level before irradiation compared to after irradiation. The methylation levels were increased by irradiation in the genes BNIPL (p = 0.034), FGFBP2 (p = 0.017), GYPE (p = 0.005), IL5RA (p = 0.018), PCK1 (p = 0.033) and TPRG1 (p = 0.018). The methylation levels of the normal controls are also shown in Table1. For technical validation of the microarray, 14 genes were analyzed by pyrosequencing and correlated (Spearman's rank correlation) with the results obtained from the array. Overall, a high correlation between pyrosequencing data and the 27K data was observed (see Table1).
Table 1.
Average methylation level with standard deviation in normal controls; nonirradiated and irradiated tumor tissue are shown for the 14 validated genes
| ID | Norm. controls | Before IR | After IR | Diff. meth. after IR | |||||||||
|---|---|---|---|---|---|---|---|---|---|---|---|---|---|
| Gene | Position | Avg (%) | St dev | Avg (%) | Stdev | Corr. array/Pyro | p-Value | Avg (%) | Stdev | Corr. array/Pyro | p-Value | Diff. before − after (%) | p-Value |
| PDCD1 | cg00795812 | 34.5 | 0.06 | 56.4 | 0.12 | 0.911 | <0.001 | 44.9 | 0.15 | 0.775 | <0.001 | 11.5 | 0.014 |
| RB1 | cg19254235 | 75.0 | 0.03 | 83.5 | 0.04 | 0.814 | <0.001 | 77.9 | 0.06 | 0.737 | <0.001 | 5.7 | 0.001 |
| H2AFY | cg24628744 | 18.6 | 0.06 | 66.2 | 0.18 | 0.916 | <0.001 | 48.9 | 0.24 | 0.923 | <0.001 | 18.3 | 0.015 |
| BCAN | cg21475402 | 30.0 | 0.11 | 69.6 | 0.19 | 0.961 | <0.001 | 50.7 | 0.29 | 0.907 | <0.001 | 19.4 | 0.042 |
| IL1A | cg00839584 | 33.8 | 0.04 | 50.4 | 0.12 | 0.833 | <0.001 | 39.8 | 0.15 | 0.907 | <0.001 | 10.3 | 0.011 |
| IL1R2 | cg17142183 | 72.8 | 0.07 | 81.6 | 0.09 | 0.805 | <0.001 | 68.1 | 0.16 | 0.858 | <0.001 | 12.7 | 0.008 |
| CTSA | cg19067730 | 14.0 | 0.06 | 60.2 | 0.21 | 0.893 | <0.001 | 44.7 | 0.26 | 0.951 | <0.001 | 16.7 | 0.044 |
| BNIPL | cg11584936 | 55. 5 | 0.12 | 36.1 | 0.19 | 0.831 | <0.001 | 52.3 | 0.26 | 0.909 | <0.001 | −16.1 | 0.034 |
| FGFBP2 | cg08132711 | 19.1 | 0.06 | 22.4 | 0.09 | 0.788 | <0.001 | 35.9 | 0.18 | 0.888 | <0.001 | −13.5 | 0.017 |
| GYPE | cg13143729 | 56.6 | 0.07 | 47.5 | 0.12 | 0.665 | 0.002 | 58.9 | 0.13 | 0.865 | <0.001 | −11.4 | 0.005 |
| IL5RA | cg08404225 | 53.7 | 0.09 | 27.8 | 0.16 | 0.886 | <0.001 | 42.7 | 0.21 | 0.912 | <0.001 | −14.9 | 0.018 |
| LTC4S | cg11394785 | 35.9 | 0.07 | 62.1 | 0.15 | 0.928 | <0.001 | 50.1 | 0.2 | 0.928 | <0.001 | 11.9 | 0.029 |
| PCK1 | cg13904968 | 39.9 | 0.06 | 22.5 | 0.13 | 0.944 | <0.001 | 35.8 | 0.2 | 0.986 | <0.001 | −13.3 | 0.033 |
| TPRG1 | cg19682367 | 33.9 | 0.1 | 33.7 | 0.16 | 0.945 | <0.001 | 48.4 | 0.22 | 0.753 | <0.001 | −14.7 | 0.018 |
Correlation between pyrosequenced and array-based data is displayed with their respective p-values (Spearman's rank correlation). Differences before and after irradiation were calculated and are shown with p-values (Mann–Whitney U-test).
Genes with different methylation levels may predict response
Methylation levels in good and poor responders were compared both before and after irradiation for all the 12 selected genes. Good responders include patients with good responses to RT and poor responders reflect those with a partial, null response, or progression after RT. The methylation levels of two genes, CTSA and LTC4S, were significantly associated with response both in the nonirradiated biopsies (p = 0.041, p = 0.023) and after IR (p = 0.041, p = 0.033). Three additional genes (RB1, H2AFY and IL5RA) were significantly associated with response in the before IR samples, and methylation levels of four genes (BCAN, PDCD1, GYPE and PCK1) were associated with response when analyzing the after IR samples (see Table2). There was no significant difference in the average distributed dose between the good responders and poor responders at the second biopsy time point (16.4 vs. 16.5 Gy). Also, prior chemotherapy was not associated with response (p = 0.608, Fisher's exact test). The z-score methylation index revealed that a panel of five non-irradiated genes combined (RB1, H2AFY, CTSA, LTC4S and IL5RA) could predict response (p = 0.041). As illustrated in Figure 2, the panel of six genes (BCAN, PDCD1, CTSA, LTC4S, GYPE and PCK1) evaluated by the methylation index after IR was of borderline significance (p = 0.051).
Table 2.
Genes selected from the “before IR” and “after IR” analysis
| Selected genes from “before”/“after” analysis | ||||||
|---|---|---|---|---|---|---|
| BCAN | CTSA | PDCD1 | ||||
| Before IR | After IR | Before IR | After IR | Before IR | After IR | |
| Normal | 30% | 14% | 35% | |||
| Good response | 64% | 39% | 52% | 34% | 52% | 39% |
| Poor Response | 78% | 71% | 73% | 60% | 63% | 54% |
| p-Value | 0.230 | 0.016 | 0.041 | 0.041 | 0.062 | 0.023 |
| LTC4S | BNIPL | FGFBP2 | ||||
| Before IR | After IR | Before IR | After IR | Before IR | After IR | |
| Normal | 36% | 55% | 19% | |||
| Good response | 56% | 41% | 37% | 57% | 24% | 41% |
| Poor Response | 71% | 63% | 31% | 43% | 19% | 28% |
| p-Value | 0.023 | 0.033 | 0.398 | 0.183 | 0.477 | 0.213 |
| IL5RA | PCK1 | TPRG1 | ||||
| Before IR | After IR | Before IR | After IR | Before IR | After IR | |
| Normal | 54% | 40% | 34% | |||
| Good response | 34% | 49% | 27% | 43% | 35% | 52% |
| Poor Response | 19% | 32% | 16% | 24% | 29% | 41% |
| p-Value | 0.023 | 0.083 | 0.109 | 0.026 | 0.423 | 0.327 |
| RB1 | H2AFY | GYPE | ||||
| Before IR | After IR | Before IR | After IR | Before IR | After IR | |
| Normal | 75% | 18% | 57% | |||
| Good response | 82% | 76% | 60% | 40% | 52% | 65% |
| Poor Response | 86% | 81% | 76% | 61% | 40% | 50% |
| p-Value | 0.035 | 0.118 | 0.037 | 0.076 | 0.056 | 0.021 |
The table shows the percentage of methylation in three groups (poor and good responders in addition to normal controls). The p-value was calculated by using a Mann–Whitney U-test comparing two categories (good response to poor response) both before and after IR. Statistically significant p-values (p < 0.05) are highlighted with bold letters.
Figure 2.
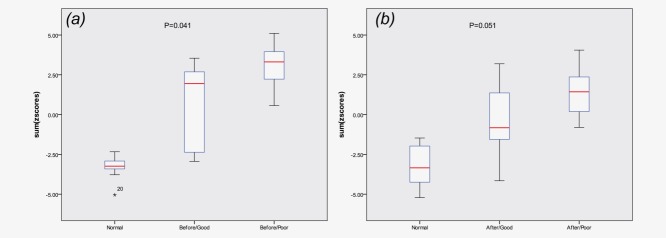
(a) The boxplot shows the median value (red line) of standardized methylation levels for all the five genes, in tumor samples before IR for good and poor responders, and in normal controls. The upper and black line of the box plot indicates 25th and 75th percentiles. (b) The boxplot shows the sum of relative z-score values for six genes in the tumor samples after irradiation for good and poor responders, and in normal controls. [Color figure can be viewed in the online issue, which is available at wileyonlinelibrary.com.]
Pathway analysis for genes differently methylated after IR
IPA was performed to find pathways overrepresented within the PAM140 and PAM84 lists. The top canonical pathways are displayed in Table3, showing that IL-10 signaling pathway and acute phase signaling involved in immune signaling were significantly overrepresented within both gene lists (p < 0.01).
Table 3.
Top canonical pathways with p-value, FDR, ratio and molecules from the gene list associated with the respective pathways
| Gene list | Top canonical pathways | p-Value | FDR (%) | Ratio | Molecules associated with the pathway |
|---|---|---|---|---|---|
| A. Based on genes within PAM140 gene list (138 genes) | NF-kB signaling | 1.04E−03 | 8.6 | 6/172 | FCER1G, IL1B, IL1R2, PIK3CD, TANK, TNFRSF1B |
| Acute-phase response signaling | 1.07E−03 | 8.6 | 6/171 | FGG, IL1B, LPP, PIK3CD, SERPINA3, TNFRSF1B | |
| IL-10 signaling | 1.29E−03 | 8.6 | 4/72 | CCR1, IL1B, IL1R2, LBP | |
| IL-6 signaling | 1.3E−03 | 8.6 | 5/122 | IL1B, IL1R2, LBP, PIK3CD, TNFRSF1B | |
| Serotonin receptor signaling | 1.54E−03 | 8.6 | 3/33 | HTR2A, HTR3D, SLC18A1 | |
| B. Based on genes within PAM84 gene list (82 genes) | Hepatic cholestasis | 1.6E−03 | 12.3 | 4/143 | IL1A, IL1R2, LBP, SLCO1C1 |
| IL-10 signaling | 2.0E−03 | 12.3 | 3/72 | IL1A, IL1R2, LBP | |
| Acute-phase response signaling | 4.8E−03 | 12.6 | 4/172 | FGG, IL1A, LBP, RBP1 | |
| Retioate biosynthesis 1 | 6.3E−03 | 17.5 | 2/34 | ALDH1A3, RBP1 | |
| LPS/IL-1-mediated inhibition of RXR function | 8.7E−03 | 17.5 | 4/226 | ALDH1A3, IL1A, IL1R2, LBP | |
| C. Based on genes correlated to given dose (2,072 genes) | NF-kB signaling | 4.2E−05 | 2 | 37/169 | |
| Role of macrophages, fibroblasts and endothelial cells in rheumatoid arthritis | 8E−05 | 2 | 56/311 | ||
| LPS/IL-1-mediated inhibition of RXR function | 1.6E−04 | 2.6 | 43/222 | ||
| PPAR signaling | 5.40E−04 | 6 | 22/100 | ||
| Differential regulation of cytokine production in intestinal epithelial cells by IL-17A and IL17F | 7.00E−04 | 7 | 9/23 | ||
| D. Based on genes pos. correlated to given dose (1,069 genes) | Role of macrophages, fibroblasts and endothelial cells in rheumatoid arthritis | 6.2E−04 | 14 | 32/311 | |
| NF-kB signaling | 7.5E−04 | 14 | 21/169 | ||
| PPAR signaling | 9.5E−04 | 14 | 14/100 | ||
| E. Based on genes neg. correlated to given dose (1,035 genes) | VDR/RXR activation | 4.7E−04 | 18 | 13/78 | |
| Role of Oct4 in mammalian embryonic stem cell pluripotency | 8.4E−04 | 18 | 9/44 | ||
| Aryl hydrocarbon receptor signaling | 2.00E−03 | 25 | 17/141 | ||
| Top bio functions | p-Value | Molecules | |||
| F. Based on genes correlated to given dose (2,072 genes) | |||||
| Cancer | 8E−11/3E−04 | 1,120 | |||
| Organismal injury and abnormalities | 8E−10/2E−04 | 274 | |||
| Inflammatory response | 5E−09/3E−04 | 334 | |||
Results are shown for the different gene lists. A: PAM140 list, B: PAM84 list, C: pathway analysis based on genes correlated with given dose, D: genes positively correlated with given dose, E: top bio functions displayed with p-values and molecules involved for genes correlated with given dose, F: genes positively correlated with given dose.
Dose-dependent methylation changes
All probes were investigated for correlation between changes in methylation level and the given dose. The delta value between before IR and after IR samples was calculated and correlated with the cumulative administered dose. With a p-value <0.05, the methylation level of 2,516 probes (2,072 genes) correlated with dose. Interestingly, 74% of the probes in the PAM84 list were correlated with the given dose, while the PAM140 list contained 41% dose-correlated probes. Based on the 2,516 probes, IPA showed a significant, differentially methylated, radiation-induced pattern for the pathways “NF-kB signaling,” “role of macrophages, fibroblasts and endothelial cells in rheumatoid arthritis,” “LPS/IL-1-mediated inhibition of RXR function,” “PPAR signaling” and “differential regulation of cytokine production in intestinal epithelial cells by IL-17A and IL-17F.” Top bio function revealed that “cancer,” “organismal injury and abnormalities” and “inflammatory response” are most altered after irradiation (see Table3). The 2,516 probes were then stratified for negative and positive correlations, resulting in 1,281 (1,069 genes) mapped probes positively correlated with dose (demethylated after IR) and 1,235 (1,035 genes) mapped probes negatively correlated with dose (methylated after IR). Figures 3a and 3b illustrate this association for the top 100 genes from the correlation lists. Pathway analysis resulted in “VDR/RXR activation,” “role of Oct4 in mammalian embryonic stem cell pluripotency” and “aryl hydrocarbon receptor signaling” being overrepresented within the list of genes methylated after IR, while the top three canonical pathways for the genes demethylated after IR appeared to be the same as for all the dose correlated genes. The FDR value for these pathways was higher than 10% (see Table3).
Figure 3.
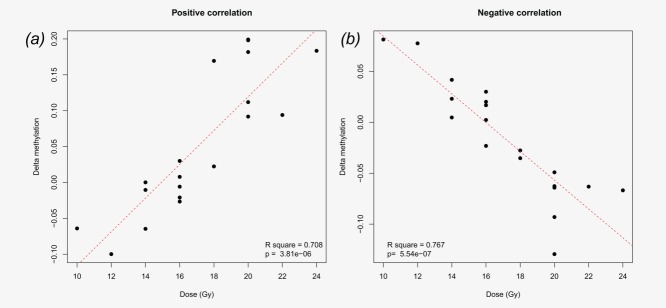
(a) Difference in the percentage of methylation (before/after IR) positively correlated to the effective administered dose. This is performed on the top 100 positively correlated probes, and a mean value is calculated based on delta methylation level for these 100 probes. (b) Delta methylation level is based on the mean value for top 100 negatively correlated probes. The red line indicates a trend line for the values. [Color figure can be viewed in the online issue, which is available at wileyonlinelibrary.com.]
DNA methylation changes after RT in breast cancer cell lines SK-BR-3 and MCF-7
To elucidate if irradiation of tumor cells alone could induce the changes observed in the tumor tissue, breast cancer cell lines (MCF-7 and SK-BR-3) were irradiated by using a Faxitron, and the methylation changes were analyzed by pyrosequencing for the selected set of 12 genes. Methylation changes identified in both cell lines were generally much lower than those found within the patient samples; still nine CpG positions in SK-BR-3 and 12 in MCF-7 were significantly differentially methylated between the before IR and after IR samples (see Supporting Information Table S6).
Discussion
The strength of our study is the unique sample material that provides the opportunity to study changes after IR in paired fresh-frozen tissue samples collected before and after IR. This allows an examination of both the tumor response, along with the impact of the surrounding tissue and systemic responses, such as the immune system. Methylation studies have so far mostly focused on DNA methylation changes following IR in cell lines,15,16 and to our knowledge, our study is the first to provide evidence for methylation changes caused by irradiation in breast cancer biopsies.
Radiation-induced methylation changes
By using a high-throughput microarray, a genome-wide scan of the DNA methylation changes was possible, although the 27K does not cover all genes of the genome. An interesting finding of our study was the correlation between a given dose and changes in methylation levels. Evidence for dose dependency and changes in methylation levels in vivo have not been widely described in the literature, but they have been reported in cell culture models,15 and a dose-dependent increase in T-cell counts is described in mice.17
Altered pathways as a result of irradiation
Tumor cells escape immunosurveillance by immune selection during tumorigenesis. RT may bring the relationship between tumor and the immune system back into balance by inducing immunogenic cell death.18 In our study, pathway analysis revealed that methylation levels of genes in the immune system pathways were significantly altered after irradiation. The altered genes were not typically breast tissue related, although radiation-induced cytokine activation may be tissue specific.19 IL-10 signaling and acute phase response signaling were represented in both gene lists. The hepatic cholestasis pathway is known to involve mechanisms such as necrosis, apoptosis and liver fibrosis,20 and results from chronic damage to hepatocytes, leading to the release of cytokines and reactive oxygen species and the activation of inflammatory cells.21 These reaction patterns share similarities with radiation response and may explain why they were on the top of the canonical pathway lists. Radiation-induced tissue damage and cell death will activate an immune response by releasing cytokines and other proinflammatory factors and involve the surrounding stroma by infiltration of immune cells to achieve tissue healing.19 The methylation changes we observed in our study are clearly radiation dependent, but we cannot discriminate between indirect processes, such as tissue reorganization, and the more direct results of the irradiation. The immune system has for a long time been regarded as crucial for an optimal response to IR,22 but the underlying mechanisms are still poorly understood. This may also explain why irradiation of the cell lines resulted in less prominent changes in methylation level compared to the breast cancer samples collected after irradiation. The surrounding tissue is central for processes such as the inflammatory response, found enriched in our dataset.
Within the dose-dependent gene list, a significant change in methylation pattern for pathways associated with cellular immune response, cell cycle regulation and apoptosis was found, representing mechanisms known to be important in radiation response. This is consistent with the results from Zheng et al., who, when studying irradiated mice, found activated pathways mediating repair, apoptosis, coagulation and cell cycle control.23 Interestingly, when looking at negative and positive dose-correlated probes separately, the positively correlated pathways (demethylated) had a lower FDR, suggesting that demethylation of genes is more prominent after irradiation. We found that irradiation resulted in demethylation of pathways either involved in the immune system response or in cell proliferation and survival. The nuclear factor kappa B (NF-kB) transcription factors can be activated by DNA-damaging agents and can regulate gene expression. Radiation has been shown to activate NF-kB and regulate apoptosis in p53-mutated cell lines. Interestingly, this process was only activated by higher doses (10 Gy).24 Other studies on irradiated mice and rats have demonstrated that NF-kB signaling is activated in a dose-dependent manner.25,26 The peroxisome proliferator-activated receptor α (PPARα) can repress NF-kB activation, and radiation-induced apoptosis can be inhibited by knocking out PPARα.27 In our study, many molecules in these two pathways indicated dose dependency. It is interesting to note that cellular immune response was also present within the top canonical pathways. As 74% of the genes in the PAM84 list also contributed to the dose-dependent list, these findings strengthen immune response as one of the top findings altered after irradiation. This is also consistent with results for the top bio functions, where cancer, organismal injury abnormalities and inflammatory response are ranked highest. On the basis of our results, we propose that methylation changes induced by irradiation influence activities essential for treatment response, and that changes in methylation levels for some of the molecules take place only after higher accumulated doses.
Methylation status may be essential for response to RT
By using the Mann–Whitney U-test, 12 selected genes were tested for the hypothesis that a change in methylation after IR could also be predictive for responses to RT. Interestingly, in PDCD1, BCAN, PCK1 and GYPE the change in methylation after IR was more prominent in good responders than in poor responders (p < 0.05). The genes LTC4S and CTSA also revealed a significantly different methylation level in the two response groups, both before and after IR. We suggest that a change in methylation level in essential genes is required to achieve an optimal radiation response. Furthermore, the methylation status before RT for the entire panel of five genes was significantly associated with response to therapy (p = 0.041). From a clinical point of view, prediction of treatment response is essential information when treatment regimes are chosen for the patients. One of these genes, H2AFY, encoding for the protein macroH2A1, is known as a chromatin regulator involved in X-chromosome inactivation. Xu et al. demonstrated that loss of macroH2A1 resulted in an increased radiosensitivity, suggesting a role in controlling nonhomologous end joining.28 The isoform of this protein mH2AFY1.2 interacts with HER-2 in cancer cells overexpressing HER-2, and has been linked to driving HER-2 overexpression.29 Interestingly, downregulation of HER-2 with trastuzumab has shown enhanced radiation-induced apoptosis and radiosensitivity.30 The gene BCAN has previously been reported to be hypermethylated in breast cancer tissue versus normal tissue.31 This is consistent with our findings, where the mean methylation level was 40% higher in tumor samples than in normal controls. After IR, a 20% decrease in methylation was observed. Cathepsin A, encoded by CTSA, contributes to the normal development of elastic fibers,32 but has not previously been investigated in the context of radiation. Our results indicate significant changes in methylation levels after IR.
There is a growing body of evidence that the inflammatory signaling pathways are strongly involved in the response to radiation and may be promising targets for enhancing radiosensitivity of tumors.7 The interleukin receptor IL5RA revealed a significant change in methylation level after IR and may also be important in the response to IR. Furthermore, PDCD1, encoding the protein PD-1 (programmed cell death 1) and previously described to be involved in response to IR,33 in our study was on average 11% less methylated after IR. PD-1 is responsible for limiting T-cell activation,34 and by targeting PD-1 and Cd137 in combination with IR, an enhanced radiation response in mice models has been reported.35 Clinical studies exploiting this synergy are ongoing.36 Leukotriene C4 synthase (LTC4S) has a biological activity in inflammation and allergy37 but has not previously been associated with response to IR. Another important gene is RB1, which is known to contribute to cell cycle regulation, double-strand break repair and apoptosis.38,39 RB1 regulates the radiation-induced G1 checkpoint through interaction with E2F1,40 a complex that may induce apoptosis.38 In our study, this gene was less methylated after IR, which is consistent with an activation following IR. RB1 was less methylated in good responders compared to poor responders, which is in line with its crucial role of apoptosis in response to radiation.41
During the last decade, the field of RT has gone through a major transformation. To further optimize the RT, a deeper understanding of the radiation response is indispensable. By identifying genes and pathways involved in radiation response, new attractive approaches to improve RT can emerge.
Acknowledgments
The authors gratefully acknowledge the contributions from the women participating in this study.
Additional Supporting Information may be found in the online version of this article
References
- WHO. International Agency for Research on Cancer. WHO; 2012. June 5. Available at: globocan.iarc.fr. [Google Scholar]
- International Commission on Radiation Units and Measurements. ICRU report 83: prescribing, recording and reporting photon beam intensity modulated radiation therapy. Oxford University Press; 2010. Karolinska Institute. [Google Scholar]
- Bourguignon MH, Gisone PA, Perez MR, et al. Genetic and epigenetic features in radiation sensitivity. I. Cell signalling in radiation response. Eur J Nucl Med Mol Imaging. 2005;32:229–46. doi: 10.1007/s00259-004-1730-7. [DOI] [PubMed] [Google Scholar]
- Tost J. DNA methylation: an introduction to the biology and the disease-associated changes of a promising biomarker. Mol Biotechnol. 2010;44:71–81. doi: 10.1007/s12033-009-9216-2. [DOI] [PubMed] [Google Scholar]
- Kuhmann C, Weichenhan D, Rehli M, et al. DNA methylation changes in cells regrowing after fractioned ionizing radiation. Radiother Oncol. 2011;101:116–21. doi: 10.1016/j.radonc.2011.05.048. [DOI] [PubMed] [Google Scholar]
- Luzhna L, Kovalchuk O. Modulation of DNA methylation levels sensitizes doxorubicin-resistant breast adenocarcinoma cells to radiation-induced apoptosis. Biochem Biophys Res Commun. 2010;392:113–17. doi: 10.1016/j.bbrc.2009.12.093. [DOI] [PubMed] [Google Scholar]
- Deorukhkar A, Krishnan S. Targeting inflammatory pathways for tumor radiosensitization. Biochem Pharmacol. 2010;80:1904–14. doi: 10.1016/j.bcp.2010.06.039. [DOI] [PMC free article] [PubMed] [Google Scholar]
- Ma S, Liu X, Jiao B, et al. Low-dose radiation-induced responses: focusing on epigenetic regulation. Int J Radiat Biol. 2010;86:517–28. doi: 10.3109/09553001003734592. [DOI] [PubMed] [Google Scholar]
- Radiation Therapy Oncology Group. RTOG/EORTC Late Radiation Morbidity Scoring Schema. RTOG; 2013. May 5. Available at: http://www.rtog.org. [Google Scholar]
- Helland A, Johnsen H, Froyland C, et al. Radiation-induced effects on gene expression: an in vivo study on breast cancer. Radiother Oncol. 2006;80:230–5. doi: 10.1016/j.radonc.2006.07.007. [DOI] [PubMed] [Google Scholar]
- Campan M, Weisenberger DJ, Trinh B, et al. MethyLight. Methods Mol Biol. 2009;507:325–37. doi: 10.1007/978-1-59745-522-0_23. [DOI] [PubMed] [Google Scholar]
- Illumina I. Infinium methylation assay. Illumina; 2011. Nov 21. Available at: http://www.illumina.com/technology/infinium_methylation_assay.ilmn. [Google Scholar]
- Tost J, Gut IG. DNA methylation analysis by pyrosequencing. Nat Protoc. 2007;2:2265–75. doi: 10.1038/nprot.2007.314. [DOI] [PubMed] [Google Scholar]
- Tibshirani R, Hastie T, Narasimhan B, et al. Diagnosis of multiple cancer types by shrunken centroids of gene expression. Proc Natl Acad Sci USA. 2002;99:6567–72. doi: 10.1073/pnas.082099299. [DOI] [PMC free article] [PubMed] [Google Scholar]
- Aypar U, Morgan WF, Baulch JE. Radiation-induced epigenetic alterations after low and high LET irradiations. Mutat Res. 2010;707:24–33. doi: 10.1016/j.mrfmmm.2010.12.003. [DOI] [PubMed] [Google Scholar]
- Chaudhry MA, Omaruddin RA. Differential DNA methylation alterations in radiation-sensitive and -resistant cells. DNA Cell Biol. 2011;31:908–16. doi: 10.1089/dna.2011.1509. [DOI] [PubMed] [Google Scholar]
- Johnston CJ, Manning C, Hernady E, et al. Effect of total body irradiation on late lung effects: hidden dangers. Int J Radiat Biol. 2011;87:902–13. doi: 10.3109/09553002.2011.573439. [DOI] [PMC free article] [PubMed] [Google Scholar]
- Zitvogel L, Apetoh L, Ghiringhelli F, et al. The anticancer immune response: indispensable for therapeutic success? J Clin Invest. 2008;118:1991–2001. doi: 10.1172/JCI35180. [DOI] [PMC free article] [PubMed] [Google Scholar]
- Stone HB, Coleman CN, Anscher MS, et al. Effects of radiation on normal tissue: consequences and mechanisms. Lancet Oncol. 2003;4:529–36. doi: 10.1016/s1470-2045(03)01191-4. [DOI] [PubMed] [Google Scholar]
- Gujral JS, Farhood A, Bajt ML, et al. Neutrophils aggravate acute liver injury during obstructive cholestasis in bile duct-ligated mice. Hepatology. 2003;38:355–63. doi: 10.1053/jhep.2003.50341. [DOI] [PubMed] [Google Scholar]
- Bataller R, Gabele E, Parsons CJ, et al. Systemic infusion of angiotensin II exacerbates liver fibrosis in bile duct-ligated rats. Hepatology. 2005;41:1046–55. doi: 10.1002/hep.20665. [DOI] [PubMed] [Google Scholar]
- Anderson RE, Warner NL. Ionizing radiation and the immune response. Adv Immunol. 1976;24:215–335. doi: 10.1016/s0065-2776(08)60331-4. [DOI] [PubMed] [Google Scholar]
- Zheng J, Garg S, Wang J, et al. Laser capture microdissected mucosa versus whole tissue specimens for assessment of radiation-induced dynamic molecular and pathway changes in the small intestine. PLoS One. 2013;8:e53711. doi: 10.1371/journal.pone.0053711. [DOI] [PMC free article] [PubMed] [Google Scholar]
- Lu TP, Lai LC, Lin BI, et al. Distinct signaling pathways after higher or lower doses of radiation in three closely related human lymphoblast cell lines. Int J Radiat Oncol Biol Phys. 2010;76:212–19. doi: 10.1016/j.ijrobp.2009.08.015. [DOI] [PMC free article] [PubMed] [Google Scholar]
- Wang Y, Meng A, Lang H, et al. Activation of nuclear factor kappaB In vivo selectively protects the murine small intestine against ionizing radiation-induced damage. Cancer Res. 2004;64:6240–6. doi: 10.1158/0008-5472.CAN-04-0591. [DOI] [PubMed] [Google Scholar]
- Raju U, Gumin GJ, Tofilon PJ. Radiation-induced transcription factor activation in the rat cerebral cortex. Int J Radiat Biol. 2000;76:1045–53. doi: 10.1080/09553000050111514. [DOI] [PubMed] [Google Scholar]
- Zhao W, Iskandar S, Kooshki M, et al. Knocking out peroxisome proliferator-activated receptor (PPAR) alpha inhibits radiation-induced apoptosis in the mouse kidney through activation of NF-kappaB and increased expression of IAPs. Radiat Res. 2007;167:581–91. doi: 10.1667/RR0814.1. [DOI] [PubMed] [Google Scholar]
- Xu C, Xu Y, Gursoy-Yuzugullu O, et al. The histone variant macroH2A1.1 is recruited to DSBs through a mechanism involving PARP1. FEBS Lett. 2012;586:3920–5. doi: 10.1016/j.febslet.2012.09.030. [DOI] [PMC free article] [PubMed] [Google Scholar]
- Li X, Kuang J, Shen Y, et al. The atypical histone macroH2A1.2 interacts with HER-2 protein in cancer cells. J Biol Chem. 2012;287:23171–83. doi: 10.1074/jbc.M112.379412. [DOI] [PMC free article] [PubMed] [Google Scholar]
- Liang K, Lu Y, Jin W, et al. Sensitization of breast cancer cells to radiation by trastuzumab. Mol Cancer Ther. 2003;2:1113–20. [PubMed] [Google Scholar]
- Faryna M, Konermann C, Aulmann S, et al. Genome-wide methylation screen in low-grade breast cancer identifies novel epigenetically altered genes as potential biomarkers for tumor diagnosis. FASEB J. 2012;26:4937–50. doi: 10.1096/fj.12-209502. [DOI] [PubMed] [Google Scholar]
- Seyrantepe V, Hinek A, Peng J, et al. Enzymatic activity of lysosomal carboxypeptidase (cathepsin) A is required for proper elastic fiber formation and inactivation of endothelin-1. Circulation. 2008;117:1973–81. doi: 10.1161/CIRCULATIONAHA.107.733212. [DOI] [PubMed] [Google Scholar]
- Demaria S, Formenti SC. Role of T lymphocytes in tumor response to radiotherapy. Front Oncol. 2012;2:95. doi: 10.3389/fonc.2012.00095. [DOI] [PMC free article] [PubMed] [Google Scholar]
- Pardoll DM. The blockade of immune checkpoints in cancer immunotherapy. Nat Rev Cancer. 2012;12:252–64. doi: 10.1038/nrc3239. [DOI] [PMC free article] [PubMed] [Google Scholar]
- Verbrugge I, Hagekyriakou J, Sharp LL, et al. Radiotherapy increases the permissiveness of established mammary tumors to rejection by immunomodulatory antibodies. Cancer Res. 2012;72:3163–74. doi: 10.1158/0008-5472.CAN-12-0210. [DOI] [PubMed] [Google Scholar]
- 2012. Clinicaltrials. Results database Nov 20. Available at: http://www.clinicaltrials.gov.
- Duroudier NP, Tulah AS, Sayers I. Leukotriene pathway genetics and pharmacogenetics in allergy. Allergy. 2009;64:823–39. doi: 10.1111/j.1398-9995.2009.02015.x. [DOI] [PubMed] [Google Scholar]
- Carnevale J, Palander O, Seifried LA, et al. DNA damage signals through differentially modified E2F1 molecules to induce apoptosis. Mol Cell Biol. 2012;32:900–12. doi: 10.1128/MCB.06286-11. [DOI] [PMC free article] [PubMed] [Google Scholar]
- Udayakumar T, Shareef MM, Diaz DA, et al. The E2F1/Rb and p53/MDM2 pathways in DNA repair and apoptosis: understanding the crosstalk to develop novel strategies for prostate cancer radiotherapy. Semin Radiat Oncol. 2010;20:258–66. doi: 10.1016/j.semradonc.2010.05.007. [DOI] [PubMed] [Google Scholar]
- Slebos RJ, Lee MH, Plunkett BS, et al. p53-dependent G1 arrest involves pRB-related proteins and is disrupted by the human papillomavirus 16 E7 oncoprotein. Proc Natl Acad Sci USA. 1994;91:5320–4. doi: 10.1073/pnas.91.12.5320. [DOI] [PMC free article] [PubMed] [Google Scholar]
- Eriksson D, Stigbrand T. Radiation-induced cell death mechanisms. Tumour Biol. 2010;31:363–72. doi: 10.1007/s13277-010-0042-8. [DOI] [PubMed] [Google Scholar]
Associated Data
This section collects any data citations, data availability statements, or supplementary materials included in this article.