

Abstract
1H-magnetic resonance spectroscopy imaging and diffusion tensor imaging were performed in 19 patients with mild depression and in 13 controls. The mean age of the patients was 31 years. The mean Hamilton depression score of the patients was 22.5 ± 13.2. N-acetylaspartate, choline and creatine concentrations and the average diffusion coefficient and fractional anisotropy values were measured in the bilateral hippocampus, striatum, thalamus and prefrontal deep white matter. Compared with the control group, the mild depressed patients had: (1) a higher choline/creatine ratio and a negative correlation between the choline/creatine ratio and the average diffusion coefficient in the hippocampus; (2) a lower choline/creatine ratio and a higher fractional anisotropy in the striatum; (3) a lower fractional anisotropy and a positive correlation between the fractional anisotropy and the choline/creatine ratio in the prefrontal deep white matter; and (4) a higher average diffusion coefficient and a positive correlation between the choline/creatine ratio and the N-acetylaspartate/creatine ratio in the thalamus, as well as positive correlation between the choline/creatine ratio and Hamilton depression scores. These data suggest evidence of abnormal connectivity in neurofibrotic microstructures and abnormal metabolic alterations in the limbic-cortical-striatal-pallidal-thalamic neural circuit in patients with mild depression.
Keywords: depression, diffusion tensor imaging, hippocampus, magnetic resonance spectroscopy, nerve fiber, neural circuit, neurotransmitter, neural regeneration
Research Highlights
Abnormal connectivity in neurofibrotic microstructures of the prefrontal deep white matter, striatum and thalamus, and abnormal metabolic alterations in the hippocampus and striatum, exist in the limbic-cortical-striatal-pallidal-thalamic neural circuit in patients with mild depression as identified by 1H-magnetic resonance spectroscopy and diffusion tensor imaging.
Abbreviations
NAA, N-acetylaspartate; Cho, choline; Cr, creatine
INTRODUCTION
Depression is a major type of emotional disorder, and is dominated by an obvious and persistent depressed mood. It is generally believed that patients with depression exhibit organic alterations in the brain, and that these alterations are localized to various structures of the brain within a specific neuroanatomical circuit. This circuit, originally described by Nauta (1972), is termed the limbic-cortical-striatal- pallidal-thalamic circuit, and comprises an extensively interconnected brain network involving multiple structures[1]. The hippocampus, striatum, thalamus and prefrontal deep white matter are critical components of this neural circuit, and play an important role in modulating and transmitting emotion[2,3]. There is strong evidence from conventional MRI and blood oxygen level dependent functional MRI studies that alterations in the limbic-cortical-striatal- pallidal-thalamic circuit are involved in depression[4,5,6,7]. Nevertheless, these studies have poor sensitivity and specificity, and other approaches are required for more detailed analyses.
In recent years, numerous studies have examined the underlying biology of depression using diffusion tensor imaging or 1H-magnetic resonance spectroscopy imaging[8,9,10,11]. However, the results remain controversial, as it is difficult to explain a systemic disease by studying the anatomic structures separately. Moreover, the majority of these studies have examined patients with major depression. Thus, approaches that examine the whole neural circuit in mild depressive patients may provide more relevant data. Furthermore, by combining diffusion tensor imaging and magnetic resonance spectroscopy, information on both the metabolism of compounds and the diffusion process of the water molecules can be obtained.
In the present study, we combined diffusion tensor and 1H-magnetic resonance spectroscopy imaging to examine the microstructural and metabolic abnormalities of the limbic-cortical-striatal-pallidal-thalamic neural circuit in patients with mild depression. We hypothesized that abnormal microstructural and metabolic changes within the limbic-cortical-striatal-pallidal-thalamic circuit are important factors in the functional pathophysiological process of depression disorders. The aims of this study were: (1) to explore whether the microstructural and metabolic changes occur consistently in specific brain regions within the neural circuit in patients with mild depression; and (2) to examine for correlations between detected microstructural changes, metabolic changes, and the Hamilton depression score.
RESULTS
Quantitative analysis of subjects
A total of 19 cases of mild depression and 13 controls were recruited into the study. All subjects were included in the result analysis.
Baseline data
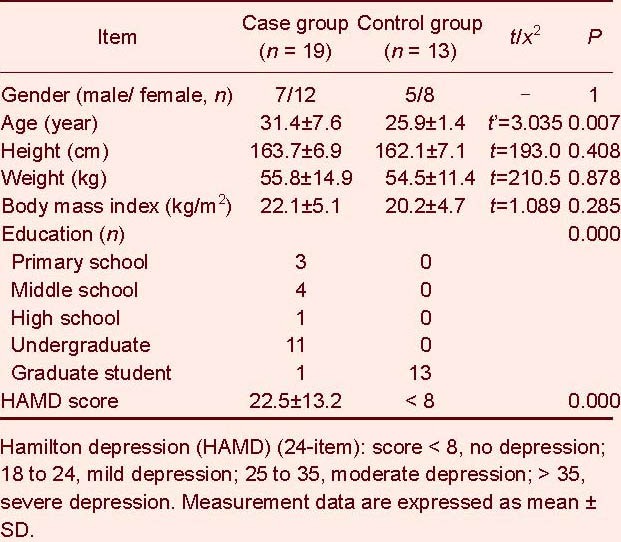
All subjects of the study were right-handed. The baseline data are shown in Table 1. A two-independent samples correcting t-test was used to compare ages between the case and control groups. Results showed that there were significant differences in age between the case and control groups (P < 0.05). A two independent samples rank sum test was performed to compare the height and weight of the subjects. Results showed that there were no significant differences in height, weight or body mass index between case and control groups (P > 0.05).
Table 1.
Baseline data of the subjects
Microstructural and metabolic changes within the limbic-cortical-striatal-pallidal-thalamic circuit in the mild depression patients
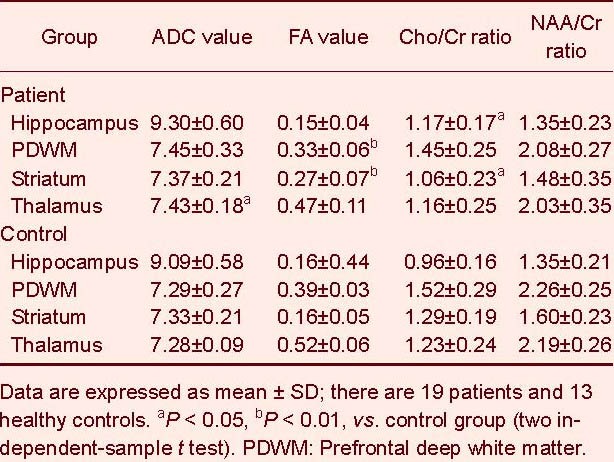
There were no significant differences in N-acetylaspartate (NAA), choline (Cho), creatine (Cr), fractional anisotropy and average diffusion coefficient from the regions of interest in the left and right hemispheres in all subjects (P > 0.05). Thus, the mean bilateral measurements were used for further analyses. Compared with the control group, the depression patients had a higher Cho/Cr ratio (t = 2.518, P = 0.021) in the hippocampus, a lower Cho/Cr ratio (2.478, P = 0.021) and a higher fractional anisotropy (t = 4.364, P = 0.000) in the striatum, a lower fractional anisotropy (t = 3.515, P = 0.001) in the prefrontal deep white matter and a higher average diffusion coefficient value (t = 2.152, P = 0.043) in the thalamus (Table 2).
Table 2.
Differences in average diffusion coefficient (ADC) (×10-10 mm2/s), fractional anisotropy (FA), choline/creatine (Cho/Cr) and N-acetylaspartate/creatine (NAA/Cr) ratio of the brain structures between patients and controls
Correlation between detected microstructural changes and metabolic changes within the limbic-cortical-striatal-pallidal-thalamic circuit in mild depression patients
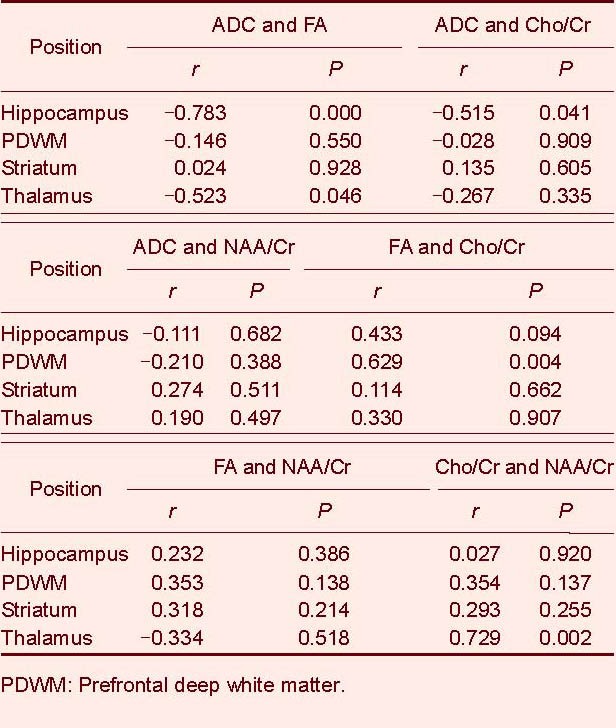
Simple correlation analysis showed that the average diffusion coefficient was negatively correlated (r = −0.515, P = 0.041) with the Cho/Cr ratio in the hippocampus. The fractional anisotropy was positively correlated (r = 0.629, P = 0.004) with the Cho/Cr ratio in the prefrontal deep white matter. The Cho/Cr ratio was positively correlated (r = 0.729, P = 0.002) with the NAA/Cr ratio in the thalamus in mild depression patients (Table 3).
Table 3.
Correlation among average diffusion coefficient (ADC) (×10-10 mm2/s), fractional anisotropy (FA), choline/creatine (Cho/Cr) and N-acetylaspartate/creatine (NAA/Cr) ratio of the brain structures in patients using simple correlation analysis
Correlations between detected microstructural changes, metabolic changes and Hamilton depression scores within the limbic-cortical- striatal-pallidal-thalamic circuit in mild depression patients
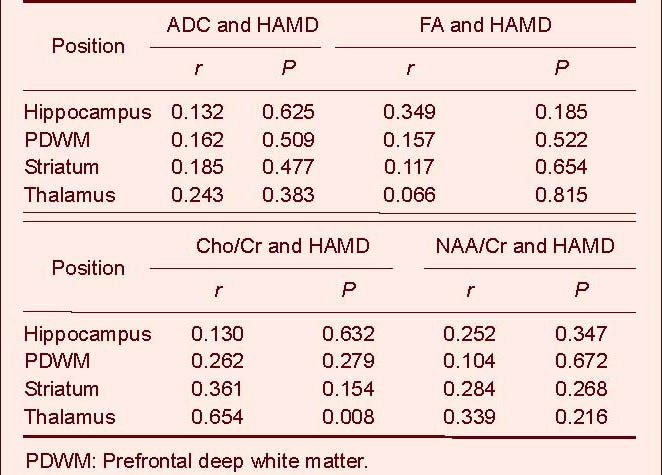
Spearman rank correlation analysis showed that only the thalamus was positively correlated with depression severity (r = 0.654, P = 0.008; Table 4).
Table 4.
Correlation between average diffusion coefficient (ADC), fractional anisotropy (FA), choline/creatine (Cho/Cr), N-acetylaspartate/creatine (NAA/Cr) ratio and Hamilton depression (HAMD) scores in patients using Spearman rank correlation analysis
DISCUSSION
Assessment of metabolic and microstructural changes based on combination of 1H-magnetic resonance spectroscopy imaging and diffusion tensor imaging
1H-magnetic resonance spectroscopy results in the present study showed that the Cho/Cr ratio of the hippocampus in depression patients was higher than that in controls, while there was no change in the NAA/Cr ratio of the hippocampus. Increased choline level is a 1H-magnetic resonance spectroscopy imaging biomarker that reflects increased membrane turnover and abnormal phospholipid metabolism in glial cells. Our results are consistent with prior studies in major depressive disorder patients, which also reported higher choline levels in the hippocampus[12,13,14]. The NAA level is a relatively quantitative marker of neuron metabolism. Thus, the normal NAA/Cr ratio in our patients may reflect a lack of neuronal involvement. The normal fractional anisotropy and average diffusion coefficient values provide further support of intact neuronal structure. When combined with diffusion tensor imaging and magnetic resonance spectroscopy data, the hippocampus damage observed in our youth depressive patients with a shorter disease course may be predominantly functional rather than structural. Milne et al[9] also found no significant differences in NAA between major depressive disorder patients with different courses of illness and controls.
In the thalamus, we found an elevated average diffusion coefficient in depressed patients compared with control subjects, but no significant differences in the Cho/Cr ratio, the NAA/Cr ratio and fractional anisotropy. These data support that the increased average diffusion coefficient in the thalamus may reflect a predominantly metabolic-functional change, which accelerates the diffusion of water molecules in brain tissue without significantly damaging the microstructure of neurons and fibers in early disease course.
In the striatum, we found an elevated fractional anisotropy in depressed patients compared with control subjects. The neurofibrotic network between different brain regions is connected via multiple neurofibrotic fiber bundles[15,16]. Thus, the increased fractional anisotropy in the striatum may reflect a relative reduction of fibers perpendicular to the primary fiber direction or a relative increase of fibers in the primary fiber direction. Alternatively, the connectivity of fibers may be altered in the striatum of depressed patients. The Cho/Cr ratio of the striatum in our data was lower in depressed patients than in controls, which contrasts with the significantly higher Cho/Cr ratio previously reported in the striatum of depression patients[17,18,19,20]. Nevertheless, a significantly lower Cho/Cr level was reported in one study in patients with depression[21].
Most major depressive disorder patients typically exhibit a significant increase in choline levels in the limbic-cortical-striatal-pallidal-thalamic circuit on 1H-magnetic resonance spectroscopy imaging. An increased choline level is considered a reflection of increased cell membrane turnover, abnormal phospholipid metabolism and abnormal signal transduction. However, the peak choline level is correlated with disease course and depression severity, and this abnormal change in the limbic-cortical-striatal-pallidal-thalamic circuit is an adaptive impairment that reflects glial cell loss with neuronal shrinkage rather than neuronal loss; these changes are only transient, however. Treatment with antidepressants may also result in a significant decrease in the Cho/Cr level in the basal ganglia in depressed patients[19]. Compared with previous studies in major depressive disorder patients[17,18,19,20], patients in our group had a shorter disease course (one week to three years) and lower depression scores (79% of case < 35). Furthermore, some patients were on antidepressant medications. Thus, we suggest that patients with lower depression severity, and possibly some patients in antidepressant therapy, may show a lower choline level due to reduced cellular damage and enhanced repair of metabolic abnormalities in the disease course.
In the prefrontal lobe, our diffusion tensor imaging data showed a reduction in fractional anisotropy in depressed patients compared with control subjects, which is consistent with other studies[22,23,24]. The decreased fractional anisotropy indicates an abnormal change in nerve fibers, including a reduction in connectivity, structural integrity, fiber numbers and volume in regions of the limbic-cortical-striatal-pallidal-thalamic circuit. Histopathological analysis[1] has confirmed a reduction of glial cells (predominantly oligodendrocytes) in the prefrontal cortex in major depressive disorder patients and bipolar depressive patients, which might be secondary to an effect on the myelin sheath, resulting in demyelination, abnormal oligodendrocyte development and diminution or atrophy of myelinated axons. There is supporting evidence for a significant reduction in the concentration of myelin-basic protein in the frontal polar cortex in major depressive disorder subjects, and a simultaneous decrease in staining for myelin sheaths in the frontal deep white matter in major depressive disorder and bipolar depressive subjects. The decreased fractional anisotropy on diffusion tensor imaging in the prefrontal white matter might also indicate a decrease in the projecting fibers (which are predominantly dopaminergic) from the prefrontal cortex, resulting in decreased inhibition of the amygdala and striatum, and a simultaneous increase in projecting fibers from the disinhibited striatum as indicated by the increase in striatal fractional anisotropy.
Correlation analysis showed both positive and negative correlations between various diffusion tensor imaging and 1H-magnetic resonance spectroscopy imaging parameters; these parameters reflect the microstructural or metabolic changes in brain areas within the neural circuit. For example, there was a positive correlation between the Cho/Cr ratio and the NAA/Cr ratio in the thalamus and a positive correlation between fractional anisotropy and the Cho/Cr ratio in the prefrontal white matter, as well as a negative correlation between the average diffusion coefficient and the Cho/Cr value in the hippocampus. These correlation analyses suggest that the detected microstructural abnormalities and metabolic abnormalities in our patients may be dependent on the activity or degree of such alterations over the course of the disease. We considered that the positive correlation between the Cho/Cr ratio in the thalamus and depression severity (Hamilton depression score) of depressive patients was functional rather than structural in our patients. A normal Cho/Cr level on 1H-magnetic resonance spectroscopy imaging does not necessarily suggest no mild metabolic and biochemical changes of nerve fibers and the myelin sheath[18,19]. Our correlation analysis was also based on a relatively small sample number, which may increase the possibility of statistical errors. Future studies in a larger patient sample are required to validate these results.
In summary, we found evidence of abnormal connectivity in neurofibrotic microstructures and abnormal metabolic alterations in the limbic-cortical-striatal-pallidal-thalamic neural circuit in depression patients, although these abnormalities were not consistently observed on diffusion tensor imaging and 1H-magnetic resonance spectroscopy imaging in every component of the circuit. The micro-structural changes mainly manifested in the prefrontal lobe white matter (lower fractional anisotropy), striatum (higher fractional anisotropy) and thalamus (higher average diffusion coefficient), while the metabolic changes mainly manifested in the hippocampus (higher Cho/Cr) and striatum (lower Cho/Cr). Of note, it is possible that the functional and metabolic changes in our patients with lower depression severity may differ from those in major depressive disorder or refractory depressive patients.
Role of abnormal metabolic and microstructural alterations in limbic-cortical-striatal-pallidal-thalamic circuit in the pathogenesis of depression
There are multiple hypotheses concerning the pathogenesis of depressive disorders. In a study examining the molecular mechanisms of brain plasticity based on neurophysiology and neuroimaging, Kulak et al[25] found that neural circuits and connectivity of nerve fibers underwent a process of reconstruction and repair in depression patients. This process of adaptive changes related to brain function generated by internal and/or external stimulus was termed neural plasticity. By contrast, there is also evidence that disorders in neural plasticity may result in mood disorders, including depression[26]. This hypothesis may explain the magnetic resonance spectroscopy and diffusion tensor imaging findings in our study.
In a large study of human functional and structural imaging data, as well as clinical and histological analyses, Yamada et al[26] reported that the limbic-cortical-striatal-pallidal-thalamic circuit was centrally involved in mood disorders. It has also been suggested that a complex neural network exists between specific structures in this loop, with extensive overlapping and interconnection. Thus, a specific hypothesis on the pathophysiology of depression has been proposed, as follows[1]: In depression patients, the lower activity of dopamine in the prefrontal cortex leads to disinhibition of the limbic system-striatum (disinhibition of the amygdala and striatum), which results in over-inhibition of the ventral pallidum. Simultaneously, the connection with the mediodorsal thalamus is decreased, which ultimately results in disinhibition of the excitatory circuit joining of the mediodorsal thalamus, prefrontal cortex and the amygdala.
The hippocampus exhibits an extensive connection with other structures of the limbic system, and plays a role in modulating and maintaining the interaction between the amygdala and the prefrontal cortex. Our results showed that the Cho/Cr ratio of the hippocampus was higher in depressive patients than the controls, suggesting an abnormal membrane phospholipid metabolism and abnormal signal transduction system in the hippocampus. The lower fractional anisotropy in the prefrontal deep white matter suggests that the effective output from the prefrontal cortex may be reduced, while the higher fractional anisotropy in the striatum suggests that projections may be enhanced in a preferential fiber direction. These fractional anisotropy changes are consistent with the aforementioned hypothesis. Moreover, the positive correlation between the Cho/Cr ratio in the thalamus and depression severity in our patients suggests a role for altered thalamic metabolism in the process of depression.
There are a number of potential limitations of this study. The experimental methods should be further optimized, and the analysis of depression onset age, duration of depression, medication history, gender and education level of the subjects should be considered if a large sample is available. Furthermore, some anatomic structures that are close to the cranial base, including the hippocampus, can affect the baseline stability of the spectral line by partial volume effects.
In summary, the abnormal fractional anisotropy in the striatum and the prefrontal deep white matter may indicate abnormal connectivity in the limbic-cortical-striatal-pallidal-thalamic neural circuit in patients with mild depression. Furthermore, the abnormal alterations of Cho/Cr and NAA/Cr ratios in the corresponding areas suggest functional and metabolic abnormalities in this circuit. These functional and metabolic changes in patients with mild depression may differ from those in major depressive disorder patients.
SUBJECTS AND METHODS
Design
Case control study with neuroimaging.
Time and setting
The study was conducted in December 2010 at the Third Affiliated Hospital of Sun Yat-sen University in China.
Subjects
From July 2006 to December 2010, 19 adults in the Third Affiliated Hospital of Sun Yat-sen University, with clinically confirmed depression, were recruited in the study. The patients were selected according to the International Classification of Diseases[27] and the Chinese Classification of Mental Disorders Version 3 criteria[28]. The age of first onset ranged from 14 to 41 years of age. The course lasted from one week to three years. All subjects were right-handed. The main clinical symptoms in depressed subjects included passive contact, depressed emotion, negative action and activity decrease. Control subjects were recruited from the volunteers of the Third Affiliated Hospital of Sun Yat-sen University. All subjects were right-handed. Exclusion criteria for participation in this study included a history of neurological illness, serious medical illness and substance abuse.
There were no structural or signal intensity abnormalities observed on routine MRI in all subjects. All subjects gave written informed consent for participation in this study, which was in accordance with the ethical approval of Declaration of Helsinki.
Methods
MRI examination
All images were produced from a 1.5 T MRI scanner (Signa Excite II; GE Healthcare, Bethesda, MD, USA) with a signal-channel phased-array head coil. Diffusion tensor imaging and 1H-magnetic resonance spectroscopy imaging studies were performed on all subjects. Point resolved spectroscopy and chemical shift selective pulses were applied in 1H-magnetic resonance spectroscopy imaging. Single-voxel 1H-magnetic resonance spectroscopy was conducted using a short echo point resolved spectroscopy sequence (echo time = 30 ms, repetition time = 1 500 ms, field of view = 24 cm × 24 cm, voxel = 20 × 20 × 20 mm3, FMNH < 4 Hz, number of excitations = 8). The voxel was placed on the hippocampus. A two-dimensional multi-voxel technique was used on the striatum, thalamus and prefrontal deep white matter. Scanning parameters were: repetition time/echo time = 1 000 ms/144 ms, field of view = 24 cm × 24 cm, phase matrix = 18 × 18, slice thickness 10 mm, FMNH < 10 Hz, and number of excitations = 1. The local magnetic field homogeneity was optimized with the three-plane auto-shim procedure, and the flip angle of the third water suppression pulse was adjusted for chemical shift selected prior to point resolved spectroscopy acquisition.
Regions of interest were carefully selected to avoid partial volume averaging from the cerebral spinal fluid and bone (Figure 1). Multi-voxel spectroscopy data were transferred to the GE AW4.1 workstation for post-processing with Functool II software. NAA, Cho and Cr concentrations, and the NAA/Cr and Cho/Cr ratios, were measured.
Figure 1.
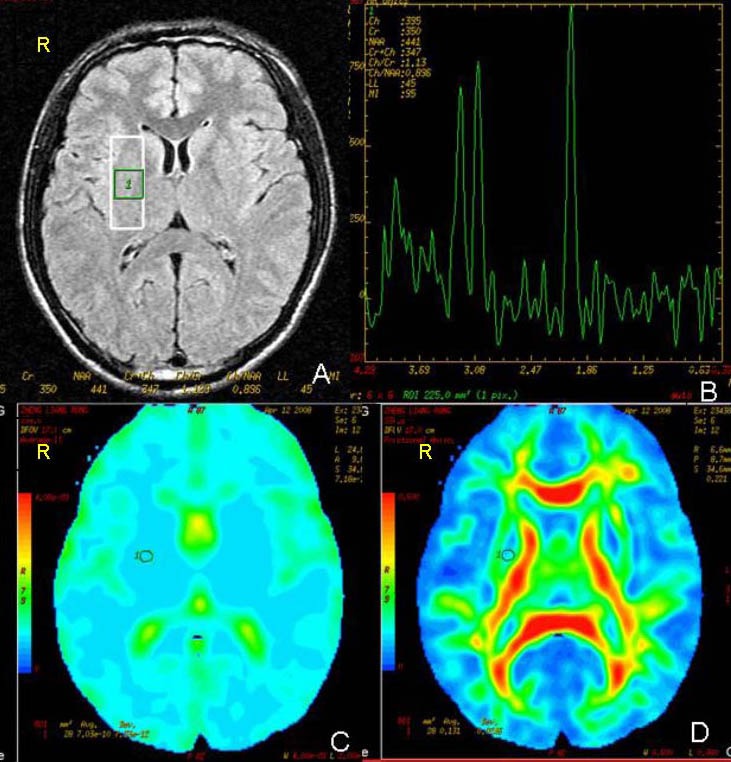
T2-weighted fluid attenuated inversion recovery image (A) and 1H-magnetic resonance spectroscopy imaging with a two-dimensional multi-voxel technique (B); average diffusion coefficient (C) and fractional anisotropy (D) images.
Regions of interest for measurements of average diffusion coefficient, fractional anisotropy, choline/creatine and N-acetylaspartate/creatine ratio in the right striatum (circle or pane). R: Right.
A single-shot diffusion weighted echo-planar imaging sequence was performed on diffusion tensor imaging. Scanning parameters were: repetition time/echo time = 8 000.0 ms/84.7 ms, field of view = 24 cm× 24 cm, and matrix = 128 × 128. Transverse sections of 3 mm thickness were acquired parallel to the anterior commissure- posterior commissure line. Scan sections covered the entire hemisphere and brainstem without gaps. Diffusion weighting encoded along 25 independent orientations, b = 1 000 s/m2. The acquisition time per dataset was approximately 9 minutes. The diffusion tensor imaging datasets were transferred to the workstation and processed by using Functool software (GE Healthcare).
Using the same size and location of region of interest used in the previous 1H-magnetic resonance spectroscopy imaging scanning, fractional anisotropy and average diffusion coefficient values were measured on the hippocampus, prefrontal deep white matter, striatum and thalamus.
Statistical analysis
The average diffusion coefficient, fractional anisotropy, NAA/Cr ratio and Cho/Cr ratio of the hippocampus, prefrontal deep white matter, striatum and thalamus in the depressed and control subjects were analyzed with SPSS 16.0 (SPSS, Chicago, IL, USA). First, an independent-sample t test was used to analyze difference in the average diffusion coefficient, fractional anisotropy, NAA/Cr ratio and Cho/Cr ratio between both hemispheres in all patients, and between control and patient groups. Second, a simple correlation analysis was performed for the average diffusion coefficient, fractional anisotropy, NAA/Cr ratio and Cho/Cr ratio of the region of interest in the depressed group. Finally, a Spearman rank correlation analysis was performed for the average diffusion coefficient, the fractional anisotropy, the NAA/Cr ratio, the Cho/Cr ratio and the Hamilton depression score. A value of P < 0.05 was considered statistically significant. Fisher's exact test was used to analyze the difference of the gender between the patients and controls.
Footnotes
Conflicts of interest: None declared.
Ethical approval: Informed consents were obtained from subjects and their family members. This study was approved by the Ethics Committee, Third Affiliated Hospital, Sun Yat-sen University, China.
(Edited by Sun AQ, Li ST/Qiu Y/Wang L)
REFERENCES
- [1].Price JL, Drevets WC. Neurocircuitry of mood disorders. Neuropsychopharmacology. 2010;35(1):192–216. doi: 10.1038/npp.2009.104. [DOI] [PMC free article] [PubMed] [Google Scholar]
- [2].Sheline YI. Neuroimaging studies of mood disorder effects on the brain. Biol Psychiatry. 2003;54(3):338–352. doi: 10.1016/s0006-3223(03)00347-0. [DOI] [PubMed] [Google Scholar]
- [3].Ende G, Braus DF, Walter S, et al. The hippocampus in patients treated with electroconvulsive therapy: a proton magnetic resonance spectroscopic imaging study. Arch Gen Psychiatry. 2000;57(10):937–943. doi: 10.1001/archpsyc.57.10.937. [DOI] [PubMed] [Google Scholar]
- [4].Sala M, Perez J, Soloff P, et al. Stress and hippocampal abnormalities in psychiatric disorders. Eur Neuropsychoparmacol. 2004;14(5):393–405. doi: 10.1016/j.euroneuro.2003.12.005. [DOI] [PubMed] [Google Scholar]
- [5].Botteron KN, Raichle ME, Drevets WC, et al. Volumetric reduction in left subgenual prefrontal cortex in early onset depression. Biol Psychiatry. 2002;51(4):342–344. doi: 10.1016/s0006-3223(01)01280-x. [DOI] [PubMed] [Google Scholar]
- [6].Vakili K, Pillay SS, Lafer B, et al. Hippocampal Volume in primary unipolar major depression: a magnetic resonance imaging study. Biol Psychiatry. 2000;47(12):1087–1090. doi: 10.1016/s0006-3223(99)00296-6. [DOI] [PubMed] [Google Scholar]
- [7].Anand A, Li Y, Wang Y, et al. Resting state corticolimbic connectivity abnormalities in unmedicated bipolar disorder and unipolar depression. Psychiatry Res. 2009;171(3):189–198. doi: 10.1016/j.pscychresns.2008.03.012. [DOI] [PMC free article] [PubMed] [Google Scholar]
- [8].Zhu X, Wang X, Xiao J, et al. Altered white matter integrity in first-episode, treatment-naive young adults with major depressive disorder: a tract-based spatial statistics study. Brain Res. 2011;1369:223–229. doi: 10.1016/j.brainres.2010.10.104. [DOI] [PubMed] [Google Scholar]
- [9].Milne A, MacQueen GM, Yucel K, et al. Hippocampal metabolic abnormalities at first onset and with recurrent episodes of a major depressive disorder: a proton magnetic resonance spectroscopy study. Neuroimage. 2009;47(1):36–41. doi: 10.1016/j.neuroimage.2009.03.031. [DOI] [PubMed] [Google Scholar]
- [10].Li CX, Sun XI, Zou K, et al. Voxel based analysis of DTI in depressive patients. Int J Magn Reson Imaging. 2007;1(1):43–48. [Google Scholar]
- [11].Li XL, Fang YN, Gao QC, et al. A diffusion tensor magnetic resonance imaging study of corpus callosum from adult patients with migraine complicated with depressive/anxious disorder. Headache. 2011;51(2):237–245. doi: 10.1111/j.1526-4610.2010.01774.x. [DOI] [PubMed] [Google Scholar]
- [12].Yildiz-Yesilogly A, Ankerst DP. Review of 1H magnetic resonance spectroscopy findings in major depressive disorder: a meta-analysis. Psychiatry Res. 2006;147(1):1–25. doi: 10.1016/j.pscychresns.2005.12.004. [DOI] [PubMed] [Google Scholar]
- [13].Carmichael ST, Price JL. Limbic connections of the orbital and medial prefrontal cortex in macaque monkeys. J Comp Neurol. 1995;363(4):615–641. doi: 10.1002/cne.903630408. [DOI] [PubMed] [Google Scholar]
- [14].Szatkowski M, Attwell D. Triggering and execution of neuronal death in brain ischemia: Two phases of glutamate release by different mechanisms. Trends Neurosci. 1994;17(9):359–365. doi: 10.1016/0166-2236(94)90040-x. [DOI] [PubMed] [Google Scholar]
- [15].Drevets WC. Neuroimaging studies of mood disorders. Biol Psychiatry. 2000;48(8):813–829. doi: 10.1016/s0006-3223(00)01020-9. [DOI] [PubMed] [Google Scholar]
- [16].Nobuhara K, Okugawa G, Sugimoto T, et al. Frontal white matter anisotropy and symptom severity of late-life depression: a magnetic resonance diffusion tensor imaging study. J Neurol Neurosurg Psychiatry. 2006;77(1):120–122. doi: 10.1136/jnnp.2004.055129. [DOI] [PMC free article] [PubMed] [Google Scholar]
- [17].Vythilingam M, Charles HC, Tupler LA, et al. Focal and lateralized subcortical abnormalities in unipolar major depressive disorder: an automated multivoxel proton magnetic resonance spectroscopy study. Biol Psychiatry. 2003;54(7):744–750. doi: 10.1016/s0006-3223(02)01908-x. [DOI] [PubMed] [Google Scholar]
- [18].Hamakawa H, Kato T, Murashita J, et al. Quantitative proton magnetic resonance spectroscopy of the basal ganglia in patients with affective disorders. Eur Arch Psychiatry Clin Neurosci. 1998;248(1):53–58. doi: 10.1007/s004060050017. [DOI] [PubMed] [Google Scholar]
- [19].Charles HC, Lazeyras F, Krishnan KR, et al. Brain choline in depression: in vivo detection of potential pharmacodynamic effects of antidepressant therapy using hydrogen localized spectroscopy. Prog Neuropsychopharmacol Biol Psychiatry. 1994;18(7):1121–1127. doi: 10.1016/0278-5846(94)90115-5. [DOI] [PubMed] [Google Scholar]
- [20].Renshaw PF, Parow AM, Hirashima F, et al. Multinuclear magnetic resonance spectroscopy studies of brain purines in major depression. Am J Psychiatry. 2001;158(12):2048–2055. doi: 10.1176/appi.ajp.158.12.2048. [DOI] [PubMed] [Google Scholar]
- [21].Renshaw PF, Lafer B, Babb SM, et al. Basal ganglia choline levels in depression and response to fluoxetine treatment: an in vivo proton magnetic resonance spectroscopy study. Biol Psychiatry. 1997;41(8):837–843. doi: 10.1016/S0006-3223(96)00256-9. [DOI] [PubMed] [Google Scholar]
- [22].Taylor WD, MacFall JR, Payne ME, et al. Late-life depression and microstructural abnormalities in dorsolateral prefrontal cortex white matter. Am J Psychiatry. 2004;161(7):1293–1296. doi: 10.1176/appi.ajp.161.7.1293. [DOI] [PubMed] [Google Scholar]
- [23].Schlösser R, Gesierich T, Kaufmann B, et al. Altered effective connectivity during working memory performance in schizophrenia: a study with fMRI and structural equation modeling. Neuroimage. 2003;19(3):751–763. doi: 10.1016/s1053-8119(03)00106-x. [DOI] [PubMed] [Google Scholar]
- [24].Sim K, Yang GL, Loh D, et al. White matter abnormalities and neurocognitive deficits associated with the passivity phenomenon in schizophrenia: a diffusion tensor imaging study. Psychiatry Res. 2009;172(2):121–127. doi: 10.1016/j.pscychresns.2009.02.003. [DOI] [PubMed] [Google Scholar]
- [25].Ku³ak W, Sobaniec W. Molecular mechanisms of brain plasticity: neurophysiologic and neuroimaging studies in the developing patients. Rocz Akad Med Bialymst. 2004;49:227–236. [PubMed] [Google Scholar]
- [26].Yamada M, Yamada M, Higuchi T. Antidepressant-elicited changes in gene expression: remodeling of neuronal circuits as a new hypothesis for drug efficacy. Prog Neuropsychopharmacol Biol Psychiatry. 2005;29(6):999–1009. doi: 10.1016/j.pnpbp.2005.03.022. [DOI] [PubMed] [Google Scholar]
- [27].Geneva: World Health Organization; 1992. World Health Organization. The ICD-10 classification of mental and behavioural disorders: clinical descriptions and diagnostic guidelines. [Google Scholar]
- [28].Jinan: Chinese Society of Psychiatry; 2001. Chinese Society of Psychiatry. The Chinese Classification and Diagnostic Criteria of Mental Disorders Version 3 (CCMD-3) [Google Scholar]