Tan et al. (1) comment on our earlier paper regarding the accuracy of multiple sequence alignments (MSAs) using different guide tree topologies (2). We stress that the scope of our result was confined to alignments of very large numbers of protein sequences with known structures, where accuracy was measured against structure-based alignments. We point out that this result could not be translated to a strictly phylogenetic view. Tan et al. (1) demonstrate that, using a phylogenetic perspective, one can get the opposite result to ours. Given how they configure their test system, Tan et al.’s result is to be expected and easy to explain. If one simulates MSAs with many indels at random locations and then tests correspondence between alignments, including gaps in the test, then guide tree topology must have a huge effect. This is more or less inevitable.
Our benchmark test sets do not have gaps at random locations. Gaps are mostly confined to loops between the main secondary structure regions. During evolution indels may occur in secondary structure elements, but rarely. Occurring indels may be cancelled out by compensating events that restore length and periodicity of the element. In contrast, gaps in loops are common and tolerated during evolution. This extreme imbalance in indel frequency has been well known for decades (3). The parameterization for the ALF simulation program comes partly from ref. 4, which describes such an imbalance with indels predominantly at exposed positions in structures.
ALF can be used to simulate alignments with indel probabilities across sites from a distribution. Tan et al. (1) chose a uniform distribution. One has to ask what kind of sequences these simulated ones might be most similar to in reality. What kinds of biological sequences allow indels equally easily at any position? Such sequences may exist in intergenic regions but will be difficult to align after even moderate sequence divergence. Equal probabilities of indels at all sites suggest sequences not under any selective or structural constraint. All our sequences are proteins with 3D structural information and constrained structure. Our main tests used a combination of PFAM sequences and Homstrad structure-based alignments. We also used Balibase but only to make a minor point. With the large tests the effect we described was mainly clear for more than 1,000 sequences; that is the upper limit of the tests in Tan et al. (1). On a much smaller scale, we can see a weaker but similar effect on small test cases where we explore every possible guide tree topology (5).
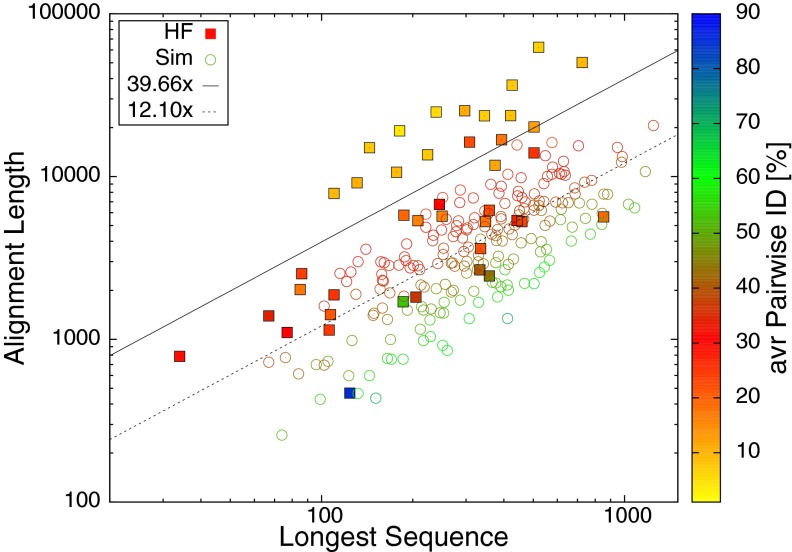
In Fig. 1, we plot unaligned sequence lengths versus final alignment lengths for Homstrad/PFAM test cases and those used by Tan et al. (1). There is a clear difference in behavior, making the results hard to compare. Furthermore, there are differences in how gaps are counted in the two studies. We used Qscore, which ignores gaps in the reference sequences. Finally, we wish to repeat that we do accept that alignments with chained guide trees may not be ideal for phylogenetic purposes, which is why we point that out in our original paper.
Fig. 1.
The length of the longest sequence in a protein family is given along the x axis; length of the final alignment is along the y axis. The alignments were produced using the phylogeny-aware program PAGAN. The 41 HomFam datasets (HF), as used in figure 5 of Boyce et al. (2), are rendered as solid squares; the 200 simulated datasets (Sim), as used in Tan et al. (1), are shown as open circles. The average pairwise identity in the alignments is rendered with color (blue/green, high identity; red/yellow, low identity). Lines represent average “inflation” of the alignments because of the alignment process: solid line 40-fold inflation for HomFam, dotted line 12-fold inflation for the simulated data.
Footnotes
The authors declare no conflict of interest.
References
- 1.Tan G, Gil M, Löytynoja AP, Goldman N, Dessimoz C. Simple chained guide trees give poorer multiple sequence alignments than inferred trees in simulation and phylogenetic benchmarks. Proc Natl Acad Sci USA. 2014;112:E99–E100. doi: 10.1073/pnas.1417526112. [DOI] [PMC free article] [PubMed] [Google Scholar]
- 2.Boyce K, Sievers F, Higgins DG. Simple chained guide trees give high-quality protein multiple sequence alignments. Proc Natl Acad Sci USA. 2014;111(29):10556–10561. doi: 10.1073/pnas.1405628111. [DOI] [PMC free article] [PubMed] [Google Scholar]
- 3.Pascarella S, Argos P. Analysis of insertions/deletions in protein structures. J Mol Biol. 1992;224(2):461–471. doi: 10.1016/0022-2836(92)91008-d. [DOI] [PubMed] [Google Scholar]
- 4.Chang MSS, Benner SA. Empirical analysis of protein insertions and deletions determining parameters for the correct placement of gaps in protein sequence alignments. J Mol Biol. 2004;341(2):617–631. doi: 10.1016/j.jmb.2004.05.045. [DOI] [PubMed] [Google Scholar]
- 5.Sievers F, Hughes GM, Higgins DG. Systematic exploration of guide-tree topology effects for small protein alignments. BMC Bioinformatics. 2014;15(1):338. doi: 10.1186/1471-2105-15-338. [DOI] [PMC free article] [PubMed] [Google Scholar]


