

Significance
A previously unidentified set of thermosensory neurons embedded in the olfactory organ of the Drosophila larva is shown to be required to drive the animal up temperature gradients toward preferred environments. Optogenetics and optical neurophysiology reveal efficient sensory encoding of both favorable (warming) and unfavorable (cooling) stimuli for distinct components of thermotactic strategy by this one set of neurons. Cooling-evoked activation is used to curtail forward movements in unfavorable directions; warming-evoked deactivation is used to orient new forward movements in favorable directions during turns. Our results pinpoint the locus of thermosensory perception for cool-avoidance behavior in the larva and define how downstream circuits use thermosensory perception to organize navigational behavior.
Keywords: navigation, reverse correlation, temperature, calcium imaging, voltage imaging
Abstract
Complex animal behaviors are built from dynamical relationships between sensory inputs, neuronal activity, and motor outputs in patterns with strategic value. Connecting these patterns illuminates how nervous systems compute behavior. Here, we study Drosophila larva navigation up temperature gradients toward preferred temperatures (positive thermotaxis). By tracking the movements of animals responding to fixed spatial temperature gradients or random temperature fluctuations, we calculate the sensitivity and dynamics of the conversion of thermosensory inputs into motor responses. We discover three thermosensory neurons in each dorsal organ ganglion (DOG) that are required for positive thermotaxis. Random optogenetic stimulation of the DOG thermosensory neurons evokes behavioral patterns that mimic the response to temperature variations. In vivo calcium and voltage imaging reveals that the DOG thermosensory neurons exhibit activity patterns with sensitivity and dynamics matched to the behavioral response. Temporal processing of temperature variations carried out by the DOG thermosensory neurons emerges in distinct motor responses during thermotaxis.
Navigation toward environmental conditions that improve survival and fitness is of near-universal importance in motile biological organisms. Quantitative analysis of such animal behaviors to defined sensory inputs is a powerful approach to elucidate how behavior is encoded in underlying neurons and circuits. The advantage of studying navigation in small, optically transparent, genetically modifiable animals like Caenorhabditis elegans (1) or Drosophila larvae (2) is the opportunity to dissect sensory, neuronal, and behavioral dynamics in live animals by using optical neurophysiology and optogenetics throughout the nervous system.
The Drosophila melanogaster larva navigates gradients of many sensory cues, including light, temperature, odors, and tastes, but with fewer neurons in its sensory periphery and brain than the adult. Moreover, the simpler body plan and crawling movements of the larva facilitate the precise quantification of behavioral dynamics. Poikilotherms like C. elegans or Drosophila use sensitive thermosensory mechanisms to navigate moderate temperature ranges, thereby enabling them to use their environments to regulate their own body temperatures (3, 4). Here, we study sensory and behavioral dynamics during positive thermotaxis (i.e., cool avoidance) by the Drosophila larva. Tracking the movements of Drosophila exploring temperature, olfactory, or gaseous gradients has shown that their navigation is generated by a sequence of two alternating motor programs: runs involving peristaltic forward movement that are interrupted by turns involving probing side-to-side head sweeps until the initiation of a new run (5–8). Larvae negotiating temperature gradients stochastically transition between runs and turns by strategies that cause runs pointed in favorable directions to be more frequent and longer than runs pointed in unfavorable directions. These transitions between runs and turns are dependent on temporal variations in ambient temperature. Warming over time is favorable and cooling is unfavorable during positive thermotaxis. However, the sensitivity and dependence of these transitions on measurements of temperature variations by the nervous system is not known.
The sensory basis for positive thermotaxis in the Drosophila larva is also poorly understood. In adult Drosophila, separate sensory neurons in the arista of the antennae contribute to cold and warm avoidance (9). These sensory neurons project to distinct glomeruli in the brain, suggesting labeled lines from the sensory periphery to the brain that drive flies toward preferred temperatures. In addition, dTRPA1-expressing neurons in the central brain function as internal temperature sensors that also contribute to warm avoidance (10). Several genes that can affect the range of preferred temperatures in larvae have been identified, which include transient receptor potential (trp) channels and rhodopsin (11, 12). However, none of these genes are required for driving larval movement toward preferred temperatures. It has been suggested that the larva’s terminal organ ganglion (TOG) is activated by temperature changes, but specific neurons that might be required for positive thermotaxis were not identified (13).
In earlier work, we used imaging systems that tracked individual larvae to uncover general rules for thermotactic behavioral strategy (5). Here, we used high-throughput/high-resolution behavioral assays to define the patterns of sensorimotor processing that produce these behavioral rules. We tracked the movements of large numbers of animals responding to fixed spatial gradients or defined random thermal fluctuations. Reverse-correlation methods yielded the temperature sensitivity as functions of time between stimulus history and motor responses that dictate how the larva uses its sensory experience to modulate behavior. We sought the relevant thermosensory neurons and discovered three neurons that are necessary for positive thermotaxis in each dorsal organ ganglion (DOG). We characterized the dynamics of the DOG thermosensory neurons by imaging calcium dynamics using GCaMP and voltage dynamics using ArcLight in response to defined temperature waveforms: sine waves, ramps, and random thermal fluctuations (14). Reverse-correlation methods showed that the transformations from temperature dynamics into neuronal dynamics are well matched to behavioral response. Finally, we used random optogenetic stimulation of the DOG neurons combined with reverse-correlation methods to connect neuronal dynamics with behavior. We confirmed that both activation and deactivation of the DOG neurons—which signify cooling and warming, respectively—drive distinct motor state transitions during thermotaxis.
Results
Behavioral Responses to Thermosensory Inputs.
When Drosophila larvae are placed on linear spatial temperature gradients between ∼15 °C and 23 °C, they move up the temperature gradients toward warmer temperatures, a response called positive thermotaxis (Fig. 1A). At temperatures above ∼30 °C, they crawl down temperature gradients (Fig. 1B). Earlier, using a single-animal tracking microscope that followed first-instar larvae during thermotaxis, we uncovered biases in larval movement caused by temperature gradients that produce thermotaxis (5). The trajectory of a crawling larva consists of a sequence of alternating periods of forward movement (runs) and head-sweeping movements (turns). During positive thermotaxis, transitions between these motor states are modulated by the gradient. First, the larva exhibits longer runs moving up gradients than down gradients (Fig. 1C, Left). Second, the larva modulates the size of turns, making larger course corrections after runs pointed down the gradient than up the gradient (Fig. 1C, Center). Third, the larva modulates the direction of turns, starting more runs up the gradient than down the gradient (Fig. 1C, Right).
Fig. 1.
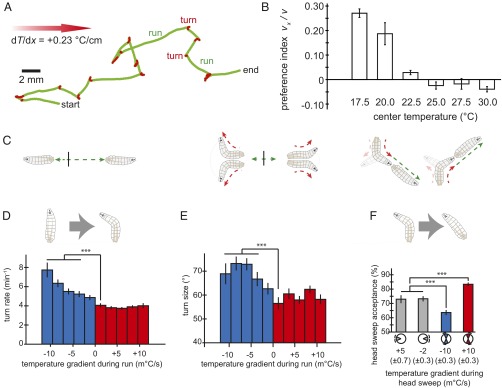
Precise dependence of sensorimotor transformations on temperature gradients. (A) Trajectory of an individual larva crawling for 120 s toward warmer temperatures (left to right) in a spatial temperature gradient of dT/dx = 0.23 °C/cm. The track is segmented into runs (green) and turns (red). Biases in the run-to-turn transitions (turn rate and turn size) and the turn-to-run transitions (turn direction) form the basis of navigation toward preferred conditions. (B) Population-level navigation as a function of the starting temperature on a spatial temperature gradient. Second-instar larvae crawl toward warmer temperatures when <22 °C and toward colder temperatures when above ∼28 °C. Preference index is defined as the mean component of velocity in the x direction divided by the mean speed. Each data point was calculated by using trajectories from 128 to 256 larvae, and error bars are ± SEM. (C) Illustrations of behavioral biases in larval motion. (C, Left and Center) A larva crawling parallel to the temperature gradient and starting at the vertical black line will use shorter runs (Left) and wider turns (Center) when headed toward colder conditions; a larva crawling perpendicular to the gradient will be more likely to turn toward the warmer side. (D) Larvae modulate turning rate and size in response to cooling. Turning rate as a function of the temporal gradients encountered by larvae during runs pointed in different directions while navigating the temperature gradients illustrated in A. For positive temporal gradients (red), turning rate is constant, regardless of the magnitude of the heating rate, whereas for negative temporal gradients (blue), turning rate progressively increases with gradient steepness. (E) Larvae also modulate turning size in response to cooling, with wider turns used in response to steeper cooling gradients and approximately the same size turns regardless of the steepness of warming gradients. (F) Trajectories as shown in A were separated into runs in four octiles (up the gradient, down the gradient, and two orthogonal to the gradient). We calculated the mean temporal gradient (± SEM) experienced during head sweeps succeeding runs parallel to the gradient (gray octiles), during head sweeps toward colder temperatures (blue octiles), and during head sweeps toward warmer temperatures (red octiles) after runs orthogonal to the gradient (run directions illustrated by octiles). Next, we calculated the probability of starting a new run during each head sweep in each condition. Statistics for D–F were calculated from trajectories exhibited by 85 wild-type larvae segmented into 3,642 discrete runs. Error bars are ± SEM. ***P < 0.001 (Mann–Whitney–Wilcoxon test for turn rate; Student’s t test for turn size and direction).
To assess how transitions between motor states might be triggered by temperature gradients, we engineered a high-throughput behavioral analysis system to accumulate enough larval trajectories—many runs and turns exhibited at all angles—to discriminate the effects of small differences in thermosensory inputs on movements (Fig. S1). We used high-pixel-density video cameras to record the time-varying posture and movements of many second-instar larvae performing thermotaxis across the surfaces of 22- × 22-cm agar plates, starting at 17.5 °C on a stable, linear gradient (6).
Increasing the resolution of statistical analysis led to several insights into the specific temperature-triggered responses exhibited during thermotaxis. In stable spatial temperature gradients, the animal experiences temporal gradients by self-movement, the vector product of the animal's velocity, and the temperature gradient. We determined the sensitivity of run durations to the sign and steepness of temperature gradients by calculating the temporal gradient that preceded all turns in all trajectories. We found that runs last longer when larvae move up gradients compared with moving down gradients, but turning rate is not actually affected by positive temporal gradients. Turning rate specifically rises with negative temporal gradients as shallow as 0.005 °C/s (Fig. 1D). During thermotaxis, larvae also regulate the size of the head sweeps at the end of each run (Fig. 1E). Like run duration, we found that turn size was unaffected by positive temporal gradients, but rose only with negative temporal gradients as shallow as 0.005 °C/s. Thus, runs are shortened and turns are widened by falling temperatures, but neither run length nor turn size is affected by rising temperatures.
The turn-to-run transition is how the larva picks the direction of new runs (5). When the body is initially parallel to the gradient, a head sweep will detect the same temporal gradients whether the head sweeps to the left or right. When the larva is headed up spatial gradients (0.23 °C/cm), side-to-side head movements detect negative temporal gradients near −0.002 °C/s. When headed down the gradient, side-to-side head movements generate positive temporal gradients near +0.005 °C/s; these temporal gradients are larger in magnitude than when the larva is headed up the gradient because the larva sweeps its head in larger angles when the temperature is dropping (Fig. S1B). In these cases, the probability of starting a new run during each head sweep was ∼73% (Fig. 1F).
In contrast, after runs pointed orthogonal to the gradient, head sweeps create temporal gradients (± 0.010 °C/s on 0.23 °C/cm gradients) that depend on their direction. For these head sweeps, the probability of starting a new run dropped to ∼62% when toward colder temperatures and rose to ∼83% when toward warmer temperatures. Unlike the run-to-turn transition, which is specifically induced by cooling, the turn-to-run transition is induced by warming (Fig. 1F).
Reverse-Correlation Analysis of the Computational Structure of Thermotactic Strategy.
To identify the specific pattern of sensory input that triggers transitions between motor states, we turned to reverse-correlation methods. We built a Peltier-driven platform to subject freely moving larvae to spatially uniform random thermal flicker (SI Experimental Procedures). Random rapid thermal fluctuations allowed us to explore a large space of possible sensory input patterns in each experiment, while every navigating animal experienced the same temperature stimulus (Fig. 2A). Linear systems analysis, viewing the whole animal as the transducer, is the simplest model for estimating the transformation from stimulus input to motor response (15). In this scheme, the sensorimotor transformation can be represented as the average stimulus history that precedes each type of behavioral response. These response-triggered stimulus histories represent how the animal uses its sensory experiences to make behavioral decisions.
Fig. 2.
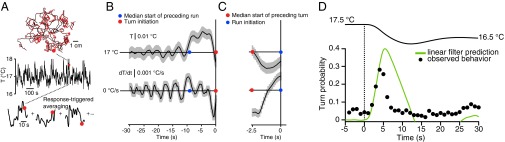
Reverse-correlation analysis of thermotactic behavior. (A) Behavioral event-triggered averaging of themotactic response. (A, Top and Middle) Larvae crawling on a temperature gradient that is time-varying but spatially uniform (Top) are subjected to random white noise thermal flicker between 16 and 18 °C and up to 1 °C/s changes (Middle). Run-to-turn transition events are indicated by red dots, with a surrounding time window from a single transition (large red dot) shaded in gray for illustration. (A, Bottom) The temperature stimulus histories for all such transitions are then averaged together. n = 60 wild-type (Canton-S) larvae. (B) Reverse-correlation response filter computed by the event-triggered averaging in A. (B, Upper) Averaged temperature (T) stimulus history. (B, Lower) Averaged change in temperature (dT/dt) stimulus history. A sharp decrease in temperature immediately precedes the run-to-turn transition (defined as time t = 0). The red dot indicates the turn initiation, and the blue dot indicates the median time of the preceding turn-to-run transition. (C) Reverse-correlation filter for the turn-to-run transition, where t = 0 is defined to be the time corresponding to the maximum body bend angle during an accepted head sweep. (C, Upper) Averaged temperature (T) stimulus history. (C, Lower) Average change in temperature (dT/dt) stimulus history. A sharp increase in temperature precedes the turn-to-run transition. The blue dot indicates the accepted head sweep time, and the red dot indicates the median preceding run-to-turn transition time. (D) Predicting the run-to-turn transition probability. (D, Upper) Larvae were subjected to a temperature waveform from 17.5 °C to 16.5 °C starting at t = 0 s (n = 90 animals). The reverse-correlation filter in B convolved with the temperature waveform yields a predicted probability of turning over time (green trace), which compares with experimental measurement (black markers).
We found that the response-triggered temperature history for the run-to-turn transition is characterized by a sharp drop in temperatures, peaking at approximately −0.003 °C/s in a ∼3-s period preceding the turn (Fig. 2B). The millidegree sensitivities of behavioral responses to random thermal fluctuations compares well with our estimates of the sensitivity using linear spatial gradients (see above) and additionally provides an estimate of the time window over which the larva analyzes temperature variations in transitions between run and turn behaviors. During each run, the larva monitors temperature variations over a ∼3-s interval and initiates turns that are triggered by cooling. This finding is consistent with our observation on spatial gradients that runs are shortened by negative gradients, but not lengthened by positive gradients (Fig. 1D).
We also calculated the response-triggered temperature history for the turn-to-run transition. During each turn, the larva sweeps its head from side to side until it picks a new direction by starting a run and ending the turn. We found the stimulus history preceding the turn-to-run transition was a ∼1-s interval of rising temperature, peaking at ∼0.002 °C/s. This warming phase is itself preceded by the cooling phase that initiated the turn (Fig. 2C). Thus, during each turn, the larva monitors temperature variations with millidegree sensitivities and is induced to start the new run when it detects warming. This finding is consistent with our observation on spatial gradients where the larva increases the likelihood of turning toward warmer temperatures by starting new runs when the head sweeps toward higher temperatures (Fig. 1F).
Finally, we asked whether the linear filter obtained by reverse-correlation analysis has predictive value. We subjected larvae to a specific stimulus waveform that started at 17.5 °C and ended at 16.5 °C and experimentally measured the turning frequency before, during, and after the temperature change. We then predicted how the frequency should be modulated using the linear filter convolved with the stimulus waveform (Fig. 2D). The prediction of turning frequency to the stimulus waveform compares favorably with experimentally observed behavior, suggesting that the linear filter captures much of the sensorimotor transformation underlying larval thermotaxis. We expect that the prediction could be further improved by including nonlinearities into the transformation (e.g., linear–nonlinear models) or additional factors (e.g., generalized linear models) (16, 17).
The Dorsal Organ Is Required for Thermotactic Behavior.
Our behavioral measurements set new criteria for the relevant sensory neurons for positive thermotaxis. Neurons that are required for thermotaxis had not yet been identified. Several proteins—TRP, TRP-like, and Rhodopsin—have been suggested to have roles in thermotaxis by affecting the setpoint of the larva’s preferred temperature (12, 18). Another member of the TRP family of cation channels—inactive, which is largely expressed in the chordotonal organs along the larva’s body (Fig. 3A)—has also been proposed to affect the setpoint of the larva’s preferred temperature (19). We examined these candidates, but found that driving tetanus toxin light chain under the control of the iav promoter does not significantly affect positive thermotaxis (Fig. S2). Mutants in trp and trpL were also capable of moving up spatial temperature gradients toward preferred temperatures (Fig. S2).
Fig. 3.

Three thermosensory neurons in the dorsal organ are required for cool avoidance. (A) Schematic and fluorescence image of an elav > mCD8::GFP larva, labeling the entire nervous system and highlighting relevant neuroanatomy, including the location of the anterior sensory ganglia, central brain and ventral nerve cord, and chordotonal organs. The neurons in the dorsal organ have their cell bodies in the DOG, sending sensory dendrites toward the central dome and axons along the antennal nerve to the LAL. (B) Larvae with both antennal nerves severed cannot perform cold avoidance. Preference index toward the warm side of the spatial linear temperature gradient for larvae with no ablation performed (0), both maxillary nerves severed (2 MN), one antennal nerve severed (1 AN), or both antennal nerves severed (2 AN). (C) Single-sided ablation of the antennal nerve does not affect the statistics of head-sweep behavior during thermotaxis. Neither the direction of the first head sweep nor the direction of the accepted head sweep is biased by unilateral ablation. A head sweep is defined as accepted when the larva initiated a new run during the head sweep. Error bars are mean ± 1 SEM. **P < 0.01 (calculated using Student’s t test). (D) Three thermally responsive neurons in each DOG. In vivo calcium imaging of the DOG in an NP4486 > GCaMP3 first-instar larva in response to a sinusoidal temperature waveform, highlighting the cell bodies of three thermosensory neurons (circles) and their dendritic bulb structures (arrows) at two time points, ta and tb. Images indicate a strong response to cooling in all three cells. (E) The sensory dendrites of the three thermosensory neurons exhibit a large membrane-rich bulb before reaching the central dome, unlike the olfactory neurons in the DOG. (E, Right) Single-plane confocal image of an R11F02 > mCD8::GFP larva DOG, showing two neurons and their bulbs (larger view). (F) Image of the whole brain and ventral nerve cord (VNC) of a second-instar larva expressing R11F02 > GFP. The severed antennal nerve descends from the DOG, and the fluorescently labeled neurons in the DOG innervate a region posterior to the antennal lobe. Right-hand dashed box, maximum intensity projection of the antennal lobe innervation viewed from an alternate angle to illustrate innervation from the DOG. (G) Larvae expressing R11F02 > TeTxLC do not exhibit positive thermotaxis up linear spatial temperature gradients (0.23 °C/cm; centered at 17.5 °C), indicating the necessity of the thermosensory neurons for this behavior response. (H) The three thermosensory neurons are not olfactory neurons. Maximum intensity projections images of the DOG region in the front of the head (Left) and in the central brain (Right). Larvae are R11F02 > mCD8::GFP;Orco-RFP, with ORNs in red and the three thermosensory neurons in green (see also Movie S3). The axons of the thermosensory neurons project to the ventral surface of the LAL, whereas ORNs project to the LAL. Blue arrows point along the larva’s central axis toward the front of the head. Error bars are ± SEM. **P < 0.01 (Student’s t test); ns, not significant.
The two principal sensory structures for chemosensation are located in the larva’s head. The TOG contains numerous gustatory receptors, and the DOG contains the olfactory receptors (Fig. 3A) (20). One report suggested that the TOG contributes to cool avoidance based on calcium imaging with GCaMP and synaptic inactivation of neurons by using the GH86 promoter (13). Previously, we confirmed that transgenic lines that express TNT-C under the control of the GH86 promoter are incapable of crawling up temperature gradients (5). However, the GH86 promoter labels most neurons in the both the DOG and TOG, making it uncertain which organ mediates the response.
We used laser ablation to directly probe whether the TOG or DOG contributes to thermotaxis by cutting the nerves that run from these organs to the brain (Movie S1). We confirmed that these nerves do not regrow in the 24-h time interval between laser ablation and testing behavior (Fig. S3A). We found that bilateral ablation of the maxillary nerves that run from the TOG had no effect on positive thermotaxis (Fig. 3B). However, bilateral ablation of the antennal nerves that run from the DOG abolished positive thermotaxis (Fig. 3B). We asked whether snipping the antennal nerves might lead to a general loss of navigational ability by testing phototaxis. In a checkerboard pattern of illumination projected on the surface of a gel, larvae will stay within the dark squares (21–23). Snipping the antennal nerves has no effect on phototaxis (Fig. S3B), suggesting that the larvae are still capable of performing other modes of navigation. The DOG, but not the TOG, is required for positive thermotaxis.
Direct left/right spatial comparisons are thought to be important for larval olfactory navigation (2, 7, 24). We found that snipping just one antennal nerve did not abolish positive thermotaxis (Fig. 3B), so larvae do not require comparisons between the left and right DOG. We speculated that unilateral ablation of the antennal nerve might induce handedness in movement patterns: Left and right dorsal organs might have different effects on left and right turning movements, for example. However, unilateral ablation did not bias the initiate head sweeps or start new runs toward either direction (Fig. 3C).
Three Thermosensory Neurons in Each Dorsal Organ.
To narrow down the DOG neurons responsible for positive thermotaxis, we used calcium imaging. We built a custom temperature-controlled stage (Fig. S1C) to deliver different temperature waveforms during confocal imaging, while minimizing motion artifacts with focus compensation. We subjected immobilized animals to sinusoidal temperature variations (1.5 °C amplitude, 18 °C mean temperature, 60-s period) that would evoke cool avoidance in behaving animals. Multineuronal calcium dynamics were imaged by driving GCaMP expression throughout the dorsal organ by using the panneuronal elav promoter, or a large subset of DOG neurons by using the NP4486 promoter, which had previously been shown to drive expression in cold-sensing neurons in the adult fly (9). Calcium imaging revealed three neurons in each dorsal organ that exhibited strong intracellular calcium dynamics coupled to the temperature waveform (Fig. 3D and Movie S2).
The thermosensory neurons are morphologically distinct from all other neurons in the DOG (Fig. 3D and Movie S3). The rest of the DOG neurons—olfactory receptor neurons (ORNs) and a few gustatory receptor neurons—send their dendrites to a dome of cuticle perforated by pores (25). In contrast, the thermosensory neurons develop large membrane-rich dendritic bulbs that appear 60 ± 13% of the distance before reaching the dome (Fig. 3 D and E). These three thermosensory neurons are the only ones with this unique morphology in the DOG revealed by the panneuronal driver elav, indicating that they are the same three neurons labeled by the GH86 and NP4486 drivers. Because these drivers label many neurons in the DOG, we sought a sparser line in the GAL4 collection at Janelia Farm (26). We found that the R11F02 driver reliably and specifically labels the three thermosensory neurons with minimal expression in the rest of the animal (Fig. 3F, Experimental Procedures, and Movie S3).
We found that driving tetanus toxin light chain in the DOG thermosensory neurons (R11F02–Gal4; UAS–TeTxLC) completely abolished positive thermotaxis, whereas driver control larvae (attP2 landing site; UAS–TeTxLC) were normal, suggesting that these thermosensory neurons are required to drive navigation up temperature gradients (Fig. 3G). Because the GH86 promoter labels these three morphologically distinct neurons (Movie S3), we suggest that disrupting thermotaxis by inactivation of GH86 expressing cells is not through inactivation of the TOG, as previously thought, but by inactivation of the R11F02–GAL4-expressing neurons in the DOG (13).
We asked whether the DOG thermosensory neurons might express known chemoreceptors. We used a line that expresses RFP in all 21 olfactory neurons (Orco::RFP) while driving mCD8::GFP by the line R11F02 and observed no overlapping fluorescence in the dorsal organ (Fig. 3H, Left; Movie S4). We followed the axons of the three thermosensory neurons and found that they run parallel to the axons of the 21 ORNs along the antennal nerve (Movie S4). Each olfactory neuron innervates a distinct glomerulus within the larval antennal lobe (LAL) (27, 28). The three thermosensory neurons do not innervate olfactory glomeruli, but glomeruli in a region posterior and slightly dorsal to the LAL (Fig. 3H, Right; Movie S4). The cellular expression patterns of all 68 gustatory receptor genes have been systematically characterized (29). None of these expression patterns include neurons that resemble the thermosensory neurons. The thermosensory neurons do not appear to be previously characterized olfactory or gustatory neurons.
Physiological Properties of the Thermosensory Neurons.
To further probe the physiological properties of the three thermosensory neurons, we subjected animals to a variety of defined temperature waveforms and monitored calcium dynamics using GCaMP3 (30). First, to probe whether these neurons encode warming, cooling, or both, we subjected animals to two sets of sinusoidal waveforms of temperature within the range of cool avoidance, either starting in the warming phase of the waveform (the +sin waveform) or starting at the cooling phase of the waveform (the −sin waveform) (Fig. 4A). Interestingly, we found that two neurons exhibited the same pattern of calcium dynamics (what we call the A-type sensors; blue and green traces in Fig. 4A), and one neuron exhibited a similar but different pattern (what we call the B-type sensor; red trace in Fig. 4A). We distinguished the A-type sensors based on their stereotyped position within the dorsal organ, medial (blue) and lateral (green) (Fig. 3D).
Fig. 4.

Optical neurophysiology of the thermosensory neurons. (A) Calcium activity in the three thermosensory neurons (two A-type sensors in green and blue and one B-type sensor in red; Fig. 3D) in response to temperature modulation in NP4486 > GCaMP3 larvae. Percent changes in fluorescence levels (ΔF/F) upon sine-wave temperature modulation. (A, Left) The +sin waveforms begin with the heating phase. (A, Right) The −sin waveforms begin with the cooling phase. Individual (thin lines) and mean (thick lines) are shown for the lateral and medial A-type (Upper) and B-type (Lower) neurons. (B) Physiological response to heating vs. cooling. Bar graph values represent averages of the max/min ∆F/F with respect to the initial F level before the onset of oscillating temperature waveforms. (B, Left) The A-type neurons (Upper Left) show a stronger response to cooling than do B-type neurons (Lower Left). n = 4–9 larvae used for each measurement. Error bars are ± SEM. **P < 0.01. (C, Top and Middle) Activation threshold during cooling ramps. Individual traces (thin lines) and mean traces (thick lines) are shown for the A- and B-type neurons during negative temperature ramps (Top) and positive temperature ramps (Middle). (C, Bottom) Histograms show the activation temperature of A- and B-type neurons (defined as the temperature coinciding with the half-maximal response response). n = 10 larvae used for each measurement. Error bars are ± SEM. ***P < 0.001. (D) Sensitivity of neuronal response to temporal gradients. Temperature sine waves of equal period (60 s) and varying amplitude (Inset) were applied while measuring calcium dynamics. The largest ΔF/F fractional change is plotted against the steepest temporal gradient within each cycle. n = 4–22 larvae used for each measurement. Error bars are ± SEM. (E) Representative traces of calcium dynamics (Left) and voltage dynamics (Right) measured using R11F02 > GCaMP5 and R11F02 > ArcLight larvae, respectively, during rapid temperature modulation (3-s period) in the three thermosensory neurons. (F) ArcLight fluorescence decreases with membrane depolarization, whereas GCaMP fluorescence signals increase with calcium levels. Representative traces of GCaMP vs. ArcLight fluorescence levels during sinusoidal temperature waveforms as shown in E show that calcium rises and falls with membrane depolarization and hyperpolarization, respectively, in both A-type (blue) and B-type (red) neurons.
Both A-type sensors are activated at the onset of the −sin waveform (onset of cooling) with a large rise in intracellular calcium levels, but show little response at the onset of the +sin waveform (onset of warming) (Fig. 4A). At subsequent warming and cooling phases during the continuing waveform, intracellular calcium levels drop and rise, respectively. In contrast, the B-type sensor shows a significant rise in intracellular calcium levels at the onset of the −sin waveform and a significant drop at the onset of the +sin waveform. During subsequent cooling and warming phases of either waveform, the B-type sensor shows increases and decreases in intracellular calcium levels, respectively. Thus, both A- and B-type sensors are activated by cooling and deactivated by warming. The two A-type sensors have low baseline calcium levels, thereby showing little change when naïve animals are exposed to warming (Fig. 4B). The B-type sensors have higher baseline calcium levels, thereby showing a bigger drop in calcium levels when naïve animals are exposed to warming.
Next, we tested the range of response of the A- and B-type sensors. Wild-type larvae prefer temperatures between ∼22 °C and 28 °C, and crawl up gradients from lower temperatures (Fig. 1B). For these neurons to be able to contribute to the full range of cool avoidance, their range of sensitivity should extend at least up to preferred temperatures. We subjected larvae to negative linear temperature ramps starting at warm temperatures and found that both neuron types exhibited step increases in intracellular calcium levels, but at different temperatures (Fig. 4C). A-type sensory neurons are activated near 32 °C. B-type sensory neurons are activated near 26 °C. Corresponding positive linear ramps starting at cold temperatures induced in both neuron types a drop in calcium levels that remained low (Fig. 4C). Thus, both neuronal types fully span the range of positive thermotaxis behavior.
To characterize the limits to sensitivity of the A- and B-type neurons, we measured their intracellular calcium dynamics in response to sine waves of different amplitudes (Fig. 4D). We observed detectable fluorescence changes induced by sinusoidal variations in temperature with gradients as small as ∼0.005 °C/s, which compares well to the behavioral sensitivity to temperature gradients (see above). Interestingly, the increase in the magnitude of fluorescence changes appears to be logarithmic with increases in the magnitude of temporal gradients (growing linearly on a linear-log plot), and so the responses of these neurons is also not saturated with gradients as steep as 0.2 °C/s.
Reverse-correlation analysis had shown us that thermotactic behavioral responses are sensitive to temperature variations in time intervals as short as ∼1–3 s. We asked whether the thermosensory neurons are capable of responding on this time scale. First, we subjected the animal to sinusoidal variations in temperature with a period of 3 s (i.e., alternating warming and cooling phases lasting 1.5 s each) and found that the thermosensory neurons were able to phase lock their calcium dynamics (using GCaMP5) to the thermosensory input (Fig. 4E). Phase locking of calcium dynamics to sine waves suggests that a bidirectional electrophysiological response underlies calcium dynamics, as has been described in the principal thermosensory neurons in C. elegans (4). To visualize the changes in membrane potential that might accompany temperature changes, we used ArcLight, a newly developed fluorescent reporter of membrane potential (14). The fluorescence of ArcLight decreases with membrane depolarization and increases with repolarization. When we expressed ArcLight in the thermosensory neurons, we found that warming is correlated with membrane repolarization, and cooling is correlated with membrane depolarization (Fig. 4E). Plotting dynamics of the GCaMP5 vs. ArcLight signals in thermosensory neurons driven by sinusoidal changes in temperature, we infer that increases and decreases in intracellular calcium levels are correlated with membrane depolarization and repolarization, respectively (Fig. 4F).
To further characterize temporal signal processing by the thermosensory neurons, we used reverse-correlation analysis. We delivered defined random thermal fluctuations to immobilized larvae, similar to the random waveforms in behavioral measurements, and quantified their calcium dynamics (Fig. 5A). We calculated the stimulus history that preceded increases in thermosensory neuron activity for both the A- and B-type thermosensory neurons (Fig. 5B). The stimulus input that activates either the A- or B-type neurons is a sharp drop in temperatures over ∼3 s, where the drop and negative sign of the lobe indicates increased calcium activity during cooling, the shift from t = 0 indicates a short delay between stimulus and response, and the increase in temperature after the drop indicates a return to uncorrelated baseline activity. This result compares well with the sensory input that initiates transitions from run to turn behavior (Fig. 2B). Calcium dynamics are uncorrelated with temperature variations more than ∼3 s in the past, providing an estimate of the time window of signal transduction from temperature variations into neuronal activity patterns.
Fig. 5.

Response filters for calcium dynamics and optogenetic activation of thermosensory neurons. (A, Upper) Defined random thermal fluctuation induces calcium signals in the A- and B-type thermosensory neurons. Thermal flicker noise has the same properties as in Fig. 2A. (A, Lower) Example trace from a single neuron in one R11F02 > GCaMP5 larva. (B) Cross-correlation between the temporal activity patterns in A- and B-type thermosensory neurons and the temporal pattern of defined random thermal fluctuation. For all three neurons, increased calcium activity is preceded by a period of cooling lasting several seconds, closely mirroring the behavioral response filters of Fig. 2. Data represent 25 neurons, each recorded for 5 min, taken from seven animals. (C) Optogenetic activation of the DOG thermosensory neurons. (C, Upper Inset) Defined random red LED light fluctuations induce activity in the thermosensory neurons of R11F02 > CsChrimson larvae, leading to behavioral response mirroring positive thermotaxis. The light is red (624 nm), with an on level of 1.9 W/m2 and an off level of 0 W/m2. (C, Upper) Reverse-correlation response filter generated from the average LED light stimulus preceding run-to-turn transitions. The transition (red dot) is set to t = 0, and the blue dot denotes the median start time of the preceding run. The run-to-turn transition is preceded by a sharp increase in light intensity, which mirrors sharp cooling of temperature. (C, Lower) Control data with R11F02 > CsChrimson that have not been fed ATR, showing behavior that is uncorrelated with the light stimulus. (D) Response filters for the turn-to-run transition (accepted head sweeps) using optogenetic activation. Larvae fed with ATR (Upper) respond to a decrease in LED light intensity (mirroring warming), whereas control larvae not fed ATR (Lower) have an uncorrelated response. For C and D, mean ± SEM is denoted by black line and shading. n = 7,904 turns from n = 179 animals for +ATR conditions and 1,108 turns from 44 animals for −ATR control conditions. (E) Predicting the run-to-turn transition probability. Larvae were subjected to steps in light intensity. The reverse-correlation filter in D convolved with the light intensity profile yields a predicted probability of turning (green trace), which we compare with the observed turning probability (black markers). n = 60 R11F02 > CsChrimson larvae with +ATR conditions.
Optogenetic Activation of Thermosensory Neurons.
We turned to optogenetics to causally connect the activity patterns of the thermosensory neurons with behavioral dynamics in freely moving larvae. We tracked the movements of larvae expressing the red-shifted Channelrhodopsin CsChrimson (31) in the thermosensory neurons (R11F02 > CsChrimson) while being subjected to red light (624 nm) that is outside their visual response spectrum. Depolarization of the three DOG thermosensors via red light illumination should mimic cooling, with the exception of a ∼1–2 s delay between illumination and depolarization in Drosophila neurons that is characteristic of CsChrimson (31). We used reverse-correlation analysis to quantify behavioral responses to optogenetic stimulation provided by random on/off flickering of red light (50% likelihood of illumination in every 0.25-s interval) (Fig. 5C). We calculated the average stimulus histories that precede the initiation of new turns during runs (Fig. 5C) and initiation of new runs during turns (Fig. 5D). We found a sharp increase in the “on” probability of the LEDs in a ∼3-s interval before the initiation of turns, which is consistent with the effect of cooling in triggering a run-to-turn transition when freely moving larvae were subjected to random thermal fluctuations. We found a sharp decrease in the on probability of the LEDs in the interval between turn initiation and an accepted head sweep, which is consistent with the effect of warming in promoting head-sweep acceptance. We also note that the behavioral transitions in control larvae were uncorrelated with the light stimulus. Together, these results suggest that optogenetically induced variations in the activity of the DOG thermosensory neurons in freely crawling larvae mimic the effects of warming and cooling on the full set of sensorimotor transformations underlying positive thermotaxis.
Similarly to our analysis of behavioral responses to temperature variations (Fig. 2), we asked whether the linear filter between light-activation of CsChrimson and behavioral responses that we obtained using reverse-correlation has predictive value. We measured the behavioral response to a single off-to-on step in light intensity and found a favorable comparison with a prediction of the behavioral response based on the linear filter obtained using random flicker (Fig. 5E). A slight delay in the behavioral transitions caused by optogenetic modulation in comparison with those caused by temperature (compare Figs. 5C and 2) are likely due to the latency of CsChrimson (31).
Discussion
Small animals with fewer sensory channels and simple body plans like the nematode C. elegans and the Drosophila larva make it possible to reduce complex animal behaviors like navigation into specific transformations between sensory inputs and motor outputs (32). Because these animals have small and accessible nervous systems, it is further possible to map these transformations to the activity patterns of specific neurons. Here, we undertook a quantitative analysis of navigational behavior and neuronal encoding during positive thermotaxis in Drosophila larva. We found that reverse-correlation methods applied to behavior—viewing the animal itself as a linear transducer—is an effective tool in defining the stimulus inputs that trigger specific motor responses. We discovered and characterized three thermosensory neurons in each DOG that drive positive thermotaxis. Their morphologies of the DOG thermosensory neurons in Drosophila larvae are reminiscent of the thermosensory neurons in C. elegans. In C. elegans, thermotactic navigational behavior requires the AFD neurons, a subset of the amphid sensory neurons that are otherwise mostly olfactory and gustatory (33). Amphid sensory neurons send dendrites to a pore to sample the external chemical environment, except the membrane-rich sensory dendrites of the AFD neuron that terminate in a ciliary bulb before reaching the pore (34). Like C. elegans, the molecular thermoreceptor that functions in the Drosophila thermotaxis neurons remains to be identified.
The three DOG thermosensory neurons exhibit the remarkable sensitivity to temperature variations (<0.005 °C/s) that trigger thermotactic behavioral responses. This high thermal sensitivity is comparable to the most sensitive thermoreceptors in biology: The infrared receptor in snakes has been reported to exhibit sensitivity of ∼0.005 °C/s (35); a cave beetle has been reported to exhibit sensitivity of ∼0.003 °C/s (36). The temporal dynamics of behavioral and thermosensory neuron responses are also highly comparable: Similar intervals of thermosensory history are used to initiate transitions between run and turn behavior as well as to activate the thermosensory neurons (compare Fig. 2B and Fig. 5B), suggesting that temporal processing of temperature changes begins at the sensory periphery without substantial delays along downstream circuits. Importantly, we found that optogenetic activation of the thermosensory neurons causes transitions between run and turn behavior with similar dynamics as temperature-induced transitions during thermotaxis (compare Fig. 2B and Fig. 5C), providing direct evidence that these thermosensory neurons drive all components of navigational behavior.
Like the thermosensory neurons in C. elegans, the DOG thermosensory neurons are bidirectional in that they respond to both cooling and warming by depolarizing and hyperpolarizing, respectively. This property makes them able to respond to alternating warming and cooling phases of a thermosensory input, which can rapidly occur during navigation on a spatial temperature gradient (Fig. 4F). For example, the DOG thermosensory neurons would be poised to respond to a head sweep pointed toward higher temperatures after a run that was pointed toward lower temperatures. We found a difference between the A- and B-type DOG neurons in their responses to the onset of warming or cooling. Both neurons are activated by cooling, but high baseline calcium levels in the B-type neurons might make naïve animals more sensitive to sudden warming. Further mapping and analysis of the circuits downstream of the A- and B-type DOG neurons would help to discriminate their potentially distinct roles in thermotaxis. These roles could also be illuminated by observing neuronal activity in freely moving, navigating larvae, as in C. elegans, once the motion compensation difficulties of the larger animal were overcome.
Optogenetic analysis in behaving animals suggests that both activation and deactivation of the DOG thermosensory neurons are triggers for behavioral responses during positive thermotaxis. Cooling-mediated activation of the DOG neurons during runs causes the animal to initiate turns, thereby shortening runs that are pointed in an unfavorable direction. Warming-mediated deactivation of the DOG neurons causes the animal to initiate a new run during a turn, thereby causing the animal to pick new runs that are pointed toward favorable directions. Thus, the larva does not use separate sensors for detecting warming and cooling to encode favorable and unfavorable sensory inputs during positive thermotaxis, but differentially uses the activation and deactivation of one set of thermosensory neurons to promote transitions between motor states.
It would be interesting to know to what extent principles for sensorimotor behavior underlying thermotaxis are conserved in the transformation of Drosophila body plan from larva to adult. Substantial progress has been made in understanding circuits for thermotaxis in the adult fly (3). Distinct peripheral sensory pathways for warm and cold avoidance that start in the fly antenna and project to the adult central brain, also to a region ventral to the antennal lobe, have now been identified (9, 37), as well as a distinct internal sensory pathway involving the anterior cell warmth sensors in the fly brain (10). The molecules, cells, and circuits for negative thermotaxis in Drosophila larva remain poorly understood, except at noxious temperatures (18, 38), and we have not yet identified circuits for negative thermotaxis (warm avoidance). Evaluating these possibilities will require more extensive mapping of thermosensory neurons and thermotaxis circuits in the larva.
Small organisms like C. elegans and Drosophila offer the possibility of complete understanding of behavioral dynamics in terms of neuronal dynamics starting at the sensory periphery (16, 39, 40). The Drosophila larva is likely to be the next animal, after C. elegans, that offers a complete wiring diagram of an entire nervous system with synaptic resolution (41). Advances in optical neurophysiology may soon make it possible to record the activities of large ensembles of neurons in the Drosophila larva, as has recently been accomplished in C. elegans and zebrafish larva (42–45). Following the outputs of sensory neurons to the central brain and beyond—combined with studies that quantitatively connect transformations from sensory inputs to neuronal activity patterns to motor outputs—will help unravel the complete encoding of complex behaviors like navigation from perception to action.
Experimental Procedures
Drosophila Strains and Husbandry.
Drosophila were raised in vials or bottles with standard yeast-containing medium at 22 °C with alternating 12-h cycles of dark and light, except for R11F02 > CsChrimson larvae, which were raised entirely in the dark at 22 °C and given yeast with 0.2 mM all-trans retinal (ATR). The following strains were used: Canton-S (BL#1), GH86 (BL#36339), elav–GAL4 (BL#8760), iav–GAL4 (BL#36360), NP4486–GAL4 (DGRC 104-694), R11F02–GAL4 (BL #49828), UAS–mCD8::GFP (BL#5137), UAS–GCaMP3 (BL#32236), UAS–GCaMP5 (BL #42037), UAS–ArcLight, UAS–TeTxLC (BL#28838), trpL[302] (BL#433), trp[343], and UAS–CsChrimson (BL #55136). John Carlson, Yale University, New Haven, CT, kindly provided Orco–RFP;UAS–mCD8::GFP.
For the R11F02–GAL4 driver, consistent expression was only observed in the three cooling-responsive neurons in each DOG. Dim expression (10–20% of the level of the DOG thermosensory neurons as quantified by using GFP expression) was randomly observed in other sensory neurons and interneurons. From observations of 13 R11F02 > mCD8::GFP larvae, we also found on average 0.85 ± 0.15 other DOG neurons, 0.77 ± 0.14 TOG neurons, 2.54 ± 0.31 neurons in the pharynx region between the two DOGs, and 2.08 ± 0.42 neurons in a 150- × 150- × 100-μm volume surrounding the LAL. However, no temperature-responsive activity was observed in these other cells during calcium or voltage imaging experiments, suggesting that they represent leaky expression outside the thermotaxis circuit.
Behavior Experiments.
Adult flies were transferred to cages (Genesee Scientific), where eggs were laid on grape juice plates. Larvae were rinsed three times in distilled water, and second-instar larvae were selected based on spiracle development under a dissecting microscope. All behavior experiments were conducted within an outer box with black walls and a sealed door that prevented any external light stimulus. The stages were all mounted on vibration-damping legs to minimize mechanical agitation. The agar gels were replaced after each experiment to prevent any potential odor remnants from persisting across experiments. To acquire sufficient statistics for analysis, multiple larvae were recorded simultaneously; the low density of animals on the gel ensured that their trajectories rarely collided (SI Experimental Procedures), and our navigation results were consistent with past work that quantified thermotaxis in a single-animal tracking setup (5).
For spatial navigation assays, groups of 20–35 larvae placed in the central region of a 3- to 4-mm-thick agar (Fisher Scientific) surface were allowed to crawl for 20 min. For postlaser ablation behavior experiments, larvae were tracked and recovered individually to later confirm ablation. Images were acquired at 4 or 5 Hz by using a 5-megapixel CCD camera (Mightex) placed above the agar surface. For thermal fluctuation experiments, groups of ∼20 larvae were placed evenly on a 300-μm-thick agar surface and imaged at 14 Hz on a 5-megapixel CCD camera (Basler). Larvae were illuminated with four custom-built LED bars arranged in a square around the gel; the illumination wavelength was 624 nm, outside the range visible to larval photosensors (22). For the Channelrhodopsin CsChrimson optogenetic activation experiments, larvae were instead illuminated with infrared LED bars (875 nm), with images recorded at 4 Hz; the red light used to induce neuronal activity was 624 nm with an intensity of 1.9 W/m2.
In Vivo Calcium and Voltage Imaging.
Images were acquired on an upright microscope (Nikon Instruments LV100), with excitation light delivered and emitted light measured by using a Revolution spinning-disk confocal setup (Andor Technology). Fluorescence and calcium imaging experiments used either a 60× 1.2-N.A. water immersion objective or a 40× 0.95-NA air objective (Nikon Instruments). Full details of the spinning-disk imaging set-up are provided in SI Experimental Procedures.
Anatomical Imaging.
To characterize R11F02 expression, second-instar larvae were dissected in cold Schneider's Drosophila medium (Life Technologies) and fixed with 4% (wt/vol) paraformaldehyde in PBS with 0.1% Triton for 1 h on wet ice. Samples were then washed 4 × 20 min using PBS with 0.1% Triton (PBST) and blocked for 1 h with 5% (vol/vol) heat-inactivated goat serum (Sigma) in PBST. Samples were then incubated overnight in primary antibody mixture of 1:1,000 anti-GFP (A11122; Life Technologies) and 1:25 nc82 (DSHB;). The next day, specimens were washed 4 × 20 with PBST, blocked as previously described, and incubated with secondary antibodies of Alexa Fluor 488 goat anti-rabbit and Alexa Fluor 555 goat anti-mouse (Life Technologies) for 3 h. After a final 4 × 20 PBST wash, samples were suspended in low-gelling-temperature agarose (9414; Sigma) and imaged on a two-photon confocal (LSM 780 NLO; Zeiss). To image the dendritic bulbs of the thermosensory neurons, first-instar R11F02 > mCD8::GFP larvae were rinsed in distilled water and fixed for 2 h in 4% (wt/vol) paraformaldehyde. Larvae were mounted onto coverslips with VectaShield (Vector Labs) and imaged with a 60× oil objective (NA = 1.35) on an Olympus Fluoview FV1000 confocal microscope.
Laser Ablation.
A MicroPoint high-intensity pulsed dye laser system (Andor Technology) was focused to a ∼3-μm diameter spot, and a controlled series of 440-nm pulses was delivered to the nerve of interest in immobilized larvae at ∼9 °C on the calcium imaging apparatus described in SI Experimental Procedures. Orco–RFP;UAS–mCD8::GFP larvae were used for improved visual clarity when developing the ablation procedure, and GH86;UAS–mCD8::GFP were used for experiments. After ablation of one or more nerves, larvae were retrieved and allowed to recover overnight in yeast at 25 °C.
After recovery, larvae were placed on a 1% agar gel with a white-light checkerboard array of bright and dark squares projected downward onto the surface using a digital light projector (ViewSonic) with color filters removed and a broadband mirror. The squares were 3.6 cm wide, and the intensity was 70 W/m2 for bright squares and 1.4 W/m2 for dark squares, conditions that evoke robust light avoidance (21, 22). Each larva began the assay in a light square, and for each boundary crossing during 10 min of observation, we recorded whether the larva crossed into dark or light squares. The probability of remaining in the dark square or crossing from a light into a dark square was recorded as the preference for dark squares reported in Fig. 3D. Afterward, each larva capable of phototaxis was assayed for cool-avoidance behavior three times before reimaging with confocal microscopy to confirm severing.
Supplementary Material
Acknowledgments
We thank Drew Robson, Jennifer Li, Yun Zhang, James Truman, and Benjamin de Bivort for useful discussions and for reading the manuscript; Hyuno Kim for assistance with confocal microscopy; and Richard Benton, John Carlson, and Gerry Rubin for sharing strains. This work was supported by the NIH Pioneer Award (to A.D.T.S.) and NIH National Research Service Award Fellowships (to M.K. and A.J.V.).
Footnotes
The authors declare no conflict of interest.
This article is a PNAS Direct Submission.
This article contains supporting information online at www.pnas.org/lookup/suppl/doi:10.1073/pnas.1416212112/-/DCSupplemental.
References
- 1.Lockery SR. The computational worm: Spatial orientation and its neuronal basis in C. elegans. Curr Opin Neurobiol. 2011;21(5):782–790. doi: 10.1016/j.conb.2011.06.009. [DOI] [PMC free article] [PubMed] [Google Scholar]
- 2.Gomez-Marin A, Duistermars BJ, Frye MA, Louis M. Mechanisms of odor-tracking: Multiple sensors for enhanced perception and behavior. Front Cell Neurosci. 2010;4:6. doi: 10.3389/fncel.2010.00006. [DOI] [PMC free article] [PubMed] [Google Scholar]
- 3.Garrity PA, Goodman MB, Samuel AD, Sengupta P. Running hot and cold: Behavioral strategies, neural circuits, and the molecular machinery for thermotaxis in C. elegans and Drosophila. Genes Dev. 2010;24(21):2365–2382. doi: 10.1101/gad.1953710. [DOI] [PMC free article] [PubMed] [Google Scholar]
- 4.Ramot D, MacInnis BL, Goodman MB. Bidirectional temperature-sensing by a single thermosensory neuron in C. elegans. Nat Neurosci. 2008;11(8):908–915. doi: 10.1038/nn.2157. [DOI] [PMC free article] [PubMed] [Google Scholar]
- 5.Luo L, et al. Navigational decision making in Drosophila thermotaxis. J Neurosci. 2010;30(12):4261–4272. doi: 10.1523/JNEUROSCI.4090-09.2010. [DOI] [PMC free article] [PubMed] [Google Scholar]
- 6.Gershow M, et al. Controlling airborne cues to study small animal navigation. Nat Methods. 2012;9(3):290–296. doi: 10.1038/nmeth.1853. [DOI] [PMC free article] [PubMed] [Google Scholar]
- 7.Gomez-Marin A, Stephens GJ, Louis M. Active sampling and decision making in Drosophila chemotaxis. Nat Commun. 2011;2:441. doi: 10.1038/ncomms1455. [DOI] [PMC free article] [PubMed] [Google Scholar]
- 8.Lahiri S, et al. Two alternating motor programs drive navigation in Drosophila larva. PLoS ONE. 2011;6(8):e23180. doi: 10.1371/journal.pone.0023180. [DOI] [PMC free article] [PubMed] [Google Scholar]
- 9.Gallio M, Ofstad TA, Macpherson LJ, Wang JW, Zuker CS. The coding of temperature in the Drosophila brain. Cell. 2011;144(4):614–624. doi: 10.1016/j.cell.2011.01.028. [DOI] [PMC free article] [PubMed] [Google Scholar]
- 10.Hamada FN, et al. An internal thermal sensor controlling temperature preference in Drosophila. Nature. 2008;454:217–220. doi: 10.1038/nature07001. [DOI] [PMC free article] [PubMed] [Google Scholar]
- 11.Rosenzweig M, Kang K, Garrity PA. Distinct TRP channels are required for warm and cool avoidance in Drosophila melanogaster. Proc Natl Acad Sci USA. 2008;105(38):14668–14673. doi: 10.1073/pnas.0805041105. [DOI] [PMC free article] [PubMed] [Google Scholar]
- 12.Shen WL, et al. Function of rhodopsin in temperature discrimination in Drosophila. Science. 2011;331(6022):1333–1336. doi: 10.1126/science.1198904. [DOI] [PubMed] [Google Scholar]
- 13.Liu L, Yermolaieva O, Johnson WA, Abboud FM, Welsh MJ. Identification and function of thermosensory neurons in Drosophila larvae. Nat Neurosci. 2003;6(3):267–273. doi: 10.1038/nn1009. [DOI] [PubMed] [Google Scholar]
- 14.Jin L, et al. Single action potentials and subthreshold electrical events imaged in neurons with a fluorescent protein voltage probe. Neuron. 2012;75(5):779–785. doi: 10.1016/j.neuron.2012.06.040. [DOI] [PMC free article] [PubMed] [Google Scholar]
- 15.Ringach D, Shapley R. Reverse correlation in neurophysiology. Cogn Sci. 2004;28:147–166. [Google Scholar]
- 16.Kato S, Xu Y, Cho CE, Abbott LF, Bargmann CI. Temporal responses of C. elegans chemosensory neurons are preserved in behavioral dynamics. Neuron. 2014;81(3):616–628. doi: 10.1016/j.neuron.2013.11.020. [DOI] [PMC free article] [PubMed] [Google Scholar]
- 17.Coen P, et al. Dynamic sensory cues shape song structure in Drosophila. Nature. 2014;507(7491):233–237. doi: 10.1038/nature13131. [DOI] [PubMed] [Google Scholar]
- 18.Rosenzweig M, et al. The Drosophila ortholog of vertebrate TRPA1 regulates thermotaxis. Genes Dev. 2005;19(4):419–424. doi: 10.1101/gad.1278205. [DOI] [PMC free article] [PubMed] [Google Scholar]
- 19.Kwon Y, Shen WL, Shim HS, Montell C. Fine thermotactic discrimination between the optimal and slightly cooler temperatures via a TRPV channel in chordotonal neurons. J Neurosci. 2010;30(31):10465–10471. doi: 10.1523/JNEUROSCI.1631-10.2010. [DOI] [PMC free article] [PubMed] [Google Scholar]
- 20.Vosshall LB, Stocker RF. Molecular architecture of smell and taste in Drosophila. Annu Rev Neurosci. 2007;30:505–533. doi: 10.1146/annurev.neuro.30.051606.094306. [DOI] [PubMed] [Google Scholar]
- 21.Xiang Y, et al. Light-avoidance-mediating photoreceptors tile the Drosophila larval body wall. Nature. 2010;468(7326):921–926. doi: 10.1038/nature09576. [DOI] [PMC free article] [PubMed] [Google Scholar]
- 22.Sprecher SG, Pichaud F, Desplan C. Adult and larval photoreceptors use different mechanisms to specify the same Rhodopsin fates. Genes Dev. 2007;21(17):2182–2195. doi: 10.1101/gad.1565407. [DOI] [PMC free article] [PubMed] [Google Scholar]
- 23.Kane EA, et al. Sensorimotor structure of Drosophila larva phototaxis. Proc Natl Acad Sci USA. 2013;110(40):E3868–E3877. doi: 10.1073/pnas.1215295110. [DOI] [PMC free article] [PubMed] [Google Scholar]
- 24.Louis M, Huber T, Benton R, Sakmar TP, Vosshall LB. Bilateral olfactory sensory input enhances chemotaxis behavior. Nat Neurosci. 2008;11(2):187–199. doi: 10.1038/nn2031. [DOI] [PubMed] [Google Scholar]
- 25.Kreher SA, Kwon JY, Carlson JR. The molecular basis of odor coding in the Drosophila larva. Neuron. 2005;46(3):445–456. doi: 10.1016/j.neuron.2005.04.007. [DOI] [PubMed] [Google Scholar]
- 26.Pfeiffer BD, et al. Tools for neuroanatomy and neurogenetics in Drosophila. Proc Natl Acad Sci USA. 2008;105(28):9715–9720. doi: 10.1073/pnas.0803697105. [DOI] [PMC free article] [PubMed] [Google Scholar]
- 27.Python F, Stocker RF. Adult-like complexity of the larval antennal lobe of D. melanogaster despite markedly low numbers of odorant receptor neurons. J Comp Neurol. 2002;445(4):374–387. doi: 10.1002/cne.10188. [DOI] [PubMed] [Google Scholar]
- 28.Masuda-Nakagawa LM, Gendre N, O’Kane CJ, Stocker RF. Localized olfactory representation in mushroom bodies of Drosophila larvae. Proc Natl Acad Sci USA. 2009;106(25):10314–10319. doi: 10.1073/pnas.0900178106. [DOI] [PMC free article] [PubMed] [Google Scholar]
- 29.Kwon JY, Dahanukar A, Weiss LA, Carlson JR. Molecular and cellular organization of the taste system in the Drosophila larva. J Neurosci. 2011;31(43):15300–15309. doi: 10.1523/JNEUROSCI.3363-11.2011. [DOI] [PMC free article] [PubMed] [Google Scholar]
- 30.Tian L, et al. Imaging neural activity in worms, flies and mice with improved GCaMP calcium indicators. Nat Methods. 2009;6(12):875–881. doi: 10.1038/nmeth.1398. [DOI] [PMC free article] [PubMed] [Google Scholar]
- 31.Klapoetke NC, et al. Independent optical excitation of distinct neural populations. Nat Methods. 2014;11(3):338–346. doi: 10.1038/nmeth.2836. [DOI] [PMC free article] [PubMed] [Google Scholar]
- 32.Clark DA, Freifeld L, Clandinin TR. Mapping and cracking sensorimotor circuits in genetic model organisms. Neuron. 2013;78(4):583–595. doi: 10.1016/j.neuron.2013.05.006. [DOI] [PMC free article] [PubMed] [Google Scholar]
- 33.Bargmann CI, Horvitz HR. Chemosensory neurons with overlapping functions direct chemotaxis to multiple chemicals in C. elegans. Neuron. 1991;7(5):729–742. doi: 10.1016/0896-6273(91)90276-6. [DOI] [PubMed] [Google Scholar]
- 34.Mori I, Ohshima Y. Neural regulation of thermotaxis in Caenorhabditis elegans. Nature. 1995;376(6538):344–348. doi: 10.1038/376344a0. [DOI] [PubMed] [Google Scholar]
- 35.Bullock TH, Diecke FP. Properties of an infra-red receptor. J Physiol. 1956;134(1):47–87. doi: 10.1113/jphysiol.1956.sp005624. [DOI] [PMC free article] [PubMed] [Google Scholar]
- 36.Loftus R, Corbière-Tichané GL. Response of antennal cold receptors of the catopid beetles, Speophyes lucidulus Delar. And Cholera angustata Fab. to very slowly changing temperature. J Comp Physiol. 1987;161:399–405. [Google Scholar]
- 37.Stocker RF, Singh RN, Schorderet M, Siddiqi O. Projection patterns of different types of antennal sensilla in the antennal glomeruli of Drosophila melanogaster. Cell Tissue Res. 1983;232(2):237–248. doi: 10.1007/BF00213783. [DOI] [PubMed] [Google Scholar]
- 38.Hwang RY, et al. Nociceptive neurons protect Drosophila larvae from parasitoid wasps. Curr Biol. 2007;17(24):2105–2116. doi: 10.1016/j.cub.2007.11.029. [DOI] [PMC free article] [PubMed] [Google Scholar]
- 39.Clark DA, Bursztyn L, Horowitz MA, Schnitzer MJ, Clandinin TR. Defining the computational structure of the motion detector in Drosophila. Neuron. 2011;70(6):1165–1177. doi: 10.1016/j.neuron.2011.05.023. [DOI] [PMC free article] [PubMed] [Google Scholar]
- 40.Eichner H, Joesch M, Schnell B, Reiff DF, Borst A. Internal structure of the fly elementary motion detector. Neuron. 2011;70(6):1155–1164. doi: 10.1016/j.neuron.2011.03.028. [DOI] [PubMed] [Google Scholar]
- 41.Cardona A, et al. An integrated micro- and macroarchitectural analysis of the Drosophila brain by computer-assisted serial section electron microscopy. PLoS Biol. 2010;8(10):e1000502. doi: 10.1371/journal.pbio.1000502. [DOI] [PMC free article] [PubMed] [Google Scholar]
- 42.Schrödel T, Prevedel R, Aumayr K, Zimmer M, Vaziri A. Brain-wide 3D imaging of neuronal activity in Caenorhabditis elegans with sculpted light. Nat Methods. 2013;10(10):1013–1020. doi: 10.1038/nmeth.2637. [DOI] [PubMed] [Google Scholar]
- 43.Prevedel R, et al. Simultaneous whole-animal 3D imaging of neuronal activity using light-field microscopy. Nat Methods. 2014;11:727–730. doi: 10.1038/nmeth.2964. [DOI] [PMC free article] [PubMed] [Google Scholar]
- 44.Ahrens MB, et al. Brain-wide neuronal dynamics during motor adaptation in zebrafish. Nature. 2012;485(7399):471–477. doi: 10.1038/nature11057. [DOI] [PMC free article] [PubMed] [Google Scholar]
- 45.Ahrens MB, Orger MB, Robson DN, Li JM, Keller PJ. Whole-brain functional imaging at cellular resolution using light-sheet microscopy. Nat Methods. 2013;10(5):413–420. doi: 10.1038/nmeth.2434. [DOI] [PubMed] [Google Scholar]
Associated Data
This section collects any data citations, data availability statements, or supplementary materials included in this article.