Significance
A unique population of Foxp3+CD4+ regulatory T (Treg) cells resides in visceral adipose tissue of lean mice. VAT Tregs are important regulators of local and systemic inflammation and metabolism. Here, we show that the VAT Treg signature is imposed early in life, well before the typical age-dependent expansion of the adipose-tissue Treg population. VAT Tregs in obese mice lose the signature typical of lean individuals but gain an additional set of over- and underrepresented transcripts. In striking parallel to a pathway recently elucidated in adipocytes, the obese mouse VAT Treg signature depends on phosphorylation of a specific residue of PPARγ. These findings are important to consider in designing drugs to target type 2 diabetes and other features of the “metabolic syndrome.”
Keywords: obesity, inflammation, type 2 diabetes, regulatory T cell, Foxp3
Abstract
A unique population of Foxp3+CD4+ regulatory T (Treg) cells resides in visceral adipose tissue (VAT) of lean mice, especially in the epididymal fat depot. VAT Tregs are unusual in their very high representation within the CD4+ T-cell compartment, their transcriptome, and their repertoire of antigen-specific T-cell receptors. They are important regulators of local and systemic inflammation and metabolism. The overall goal of this study was to learn how the VAT Treg transcriptome adapts to different stimuli; in particular, its response to aging in lean mice, to metabolic perturbations associated with obesity, and to certain signaling events routed through PPARγ, the “master-regulator” of adipocyte differentiation. We show that the VAT Treg signature is imposed early in life, well before age-dependent expansion of the adipose-tissue Treg population. VAT Tregs in obese mice lose the signature typical of lean individuals but gain an additional set of over- and underrepresented transcripts. This obese mouse VAT Treg signature depends on phosphorylation of the serine residue at position 273 of PPARγ, in striking parallel to a pathway recently elucidated in adipocytes. These findings are important to consider in designing drugs to target type 2 diabetes and other features of the “metabolic syndrome.”
Inflammation is a major link between obesity and type 2 diabetes (T2D) (1–3). Energy intake in excess of expenditure induces chronic inflammation of visceral adipose tissue (VAT), which eventually provokes inflammation at distant sites and, thereby, metabolic abnormalities such as insulin resistance and dyslipidemia, culminating in T2D and cardiovascular disease. At the core of this “metabolic syndrome” is VAT: Through the production of a variety of adipokines and other mediators, adipocytes in visceral fat depots can positively or negatively influence insulin sensitivity, lipid levels and appetite. Although innate immunocytes, notably macrophages (MFs), have historically been considered to be the drivers of adipose-tissue inflammation and metabolic dysregulation, several recent reports argued for an important effector or regulatory role for adaptive immunocytes, i.e., T, B, or NKT cells.
In particular, a unique population of Foxp3+CD4+ regulatory T (Treg) cells accumulates in VAT of lean mice as they age (4, 5). Vis-à-vis their lymphoid-tissue counterparts, VAT Tregs are remarkable by several criteria. They are highly overrepresented in lean individuals (40–80% vs. 5–15% of the CD4+ T-cell compartment). Their transcriptome is distinct, especially the profile of transcripts encoding transcription factors, chemokines/chemokine-receptors, and cytokines/cytokine-receptors, as well as atypical expression of a set of transcripts specifying molecules involved in lipid metabolism. Thirdly, they have an unusual, clonally expanded, repertoire of T-cell antigen receptors (4).
It came as a surprise that PPARγ, the “master regulator” of adipocyte differentiation (6), is also a crucial molecular orchestrator of VAT Treg cell accumulation, phenotype and function (5). Treg-specific ablation of Pparg greatly reduced the VAT Treg population, while not affecting lymphoid-tissue Tregs, in mice maintained on a normal-chow diet (NCD). Conversely, injection of the PPARγ agonist, pioglitazone (pio), into mice kept on a high-fat diet (HFD) expanded the Treg population in VAT but not lymphoid tissues. Cotransduction experiments revealed that PPARγ worked together with Foxp3 to impose the unique transcriptome of VAT Tregs: the sets of genes over- or underrepresented in CD4+ T cells transduced with Foxp3 plus Pparg in comparison with Foxp3 alone was enriched for the previously defined VAT Treg up- and down-signatures.
The overall goal of the set of experiments reported herein was to further elucidate the VAT Treg signature: its appearance in lean mice as they age; disappearance in obese mice; and its response to PPARγ-mediated signaling events. Our data document a number of age- and diet-dependent influences on the VAT Treg transcriptome, and reveal that, as in adipocytes, the effect of obesity on transcription in VAT Tregs does not reflect a reduction in their expression of the Pparg gene, but rather a posttranslational modification of PPARγ proteins.
Results
Appearance of the VAT Treg Signature in Lean Mice as they Age.
Our first goal was to learn how the transcriptome of VAT Tregs evolves over time in lean mice, given that insulin resistance is an age-dependent process. The epididymal fat depot was removed from cohorts of male C57BL/6 (B6) mice at increasing ages, and was digested with collagenase to separate floating mature adipocytes from the other cells, referred to as the stromal vascular fraction (SVF). Foxp3+CD4+ Tregs witin the SVF were enumerated and further characterized by flow cytometry. Control splenic and/or lymph node (LN) Tregs from the same individuals were assessed in parallel. At 5 wk of age, the fraction of Tregs in the VAT CD4+ T-cell compartment was similar to, even a bit lower than, that typical of lymphoid organs (Fig. 1A). The fraction in VAT gradually rose at 14 and 25 wk of age, and then descended quite precipitously at 40 wk (Fig. 1A), accompanied by a decline in insulin sensitivity (Fig. S1). Meanwhile, the percentage of splenic Tregs remained stable at 15–20% (Fig. 1A). A similar rise and fall of the VAT, but not splenic, Treg population was evident when their number, rather than fractional representation, was quantified (Fig. 1B).
Fig. 1.
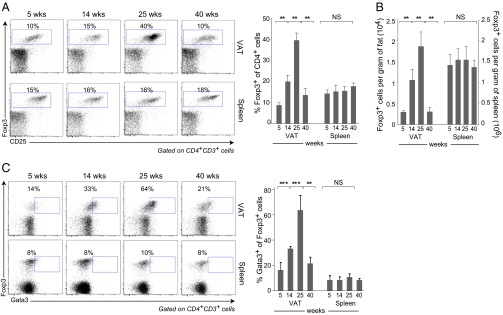
Treg dynamics and phenotype with aging. Tregs were isolated from VAT and spleen of lean B6 males at the indicated ages. (A) Cytofluorometric analysis of Foxp3+CD4+CD3+ T cells. (Left) Representative dot plots. Numbers indicate the percentage Foxp3+ of CD4+ cells for that particular experiment. (Right) Summary data from at least three independent experiments. (B) Treg numbers for the same mice. (C) As per A, except Gata3+Foxp3+ cells were examined. Numbers refer to the percentage Gata3+ of Foxp3+ cells for that particular experiment. Mean ± SD; **P < 0.01; ***P < 0.001; NS, not significant; by the Student’s t test.
We previously reported that the transcription factor, Gata3, is a useful marker for bona fide VAT Tregs [given the absence of an appropriate monocolonal antibody (mAb) for cytofluorimetric detection of PPARγ] (5). The fraction of Gata3+ Tregs in VAT also rose at 14 and 24 wk of age and fell at 40 wk, whereas the fraction in the spleen was constantly low (Fig. 1C).
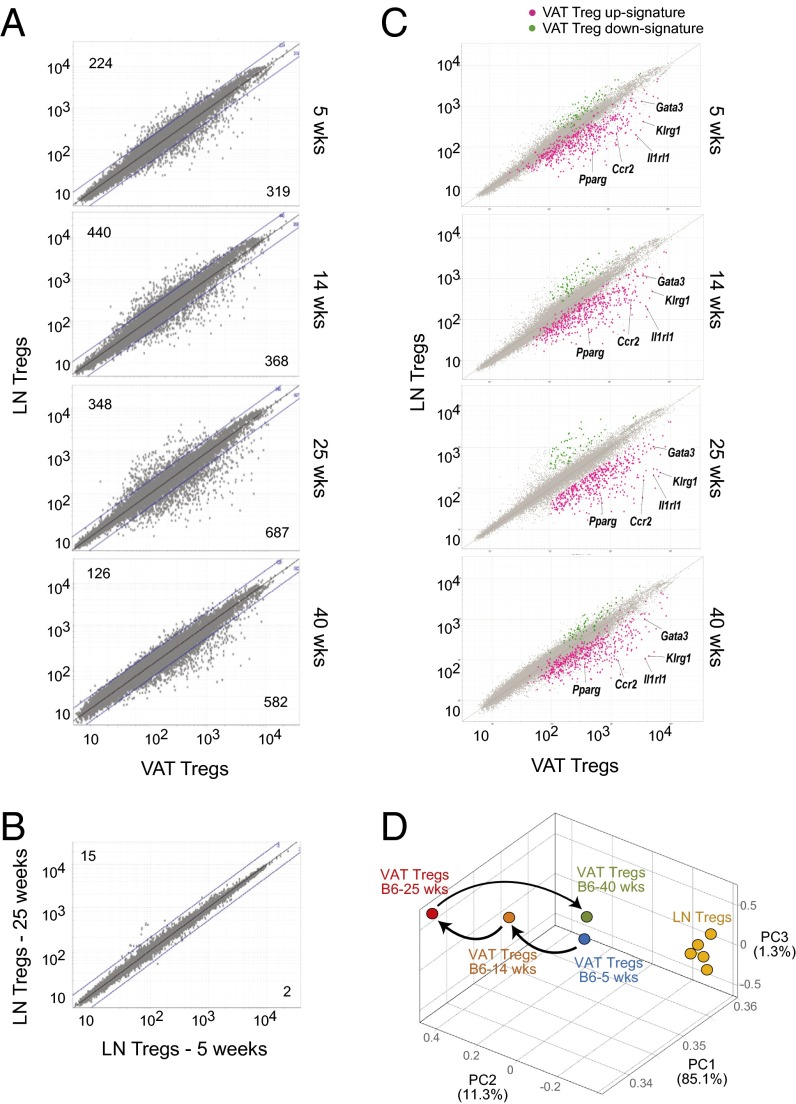
To follow corresponding evolution of the VAT transcriptome, we performed microarray-based gene-expression profiling of Foxp3+CD4+ T cells from the LNs vs. the SVF of VAT from B6 mice at increasing ages. Although the transcriptional profiles of VAT and LN Tregs were already distinct at 5 wk of age, the total number of loci differentially expressed ≥twofold in VAT mounted at 14 wk and peaked at 25 wk of age (Fig. 2A). This increase reflected evolution of the VAT Treg transcriptome as there were very few differences in the gene-expression profiles of LN Tregs from 5- and 25-wk-old mice (Fig. 2B). Analogous to the numerical decline in Tregs at 40 wk of age, the VAT:LN Treg gene-expression differential also dropped at this age (Fig. 2A).
Fig. 2.
Treg transcriptome evolution with aging. (A) Normalized microarray-determined expression values for transcripts from VAT vs. LN Tregs of B6 mice. Values in the corners refer to numbers of transcripts up- (Upper) or down- (Lower) regulated in VAT Tregs. Lines indicate the twofold cutoff. (B) As in panel a except LN transcriptomes from 5- and 25-wk-old mice are compared. (C) Same data as in A except the VAT Treg up- (pink) and down- (green) signatures are overlain (from Dataset S1). (D) Principal components analysis of the same microarray data.
Using microarray data from 25-wk-old lean mice, we generated “VAT Treg” signatures, comprised of 437 genes up-regulated and 71 genes down-regulated ≥twofold in VAT Tregs vs. VAT conventional T (Tconv) cells, LN Tregs and LN Tconv cells (Dataset S1; see its legend for details of signature generation). This signature is more robust than the one previously reported (4) because the various T-cell populations were double-sorted to extremely high purity and because the newer microarray platform encompasses a higher fraction of the genome. Superimposing the VAT Treg signature on the VAT vs. LN Treg comparison plots revealed that the bulk of the signature genes were divergently expressed (i.e., displaced from the diagonal) already at 5 wk of age—notably, paradigmatic VAT transcripts such as Pparg, Gata3, Klrg1, Ccr2, and Il1rl1 (Fig. 2C). Nonetheless, the differential gradually increased to 24 wk, but shrank noticeably at 40 wk of age (Fig. 2C). This age-dependent evolution of the VAT Treg signature, and its persistent distinction from the LN gene-expression profile, is readily apparent from the principal components analysis illustrated in Fig. 2D.
Disappearance of the VAT Treg Signature in Obese Mice.
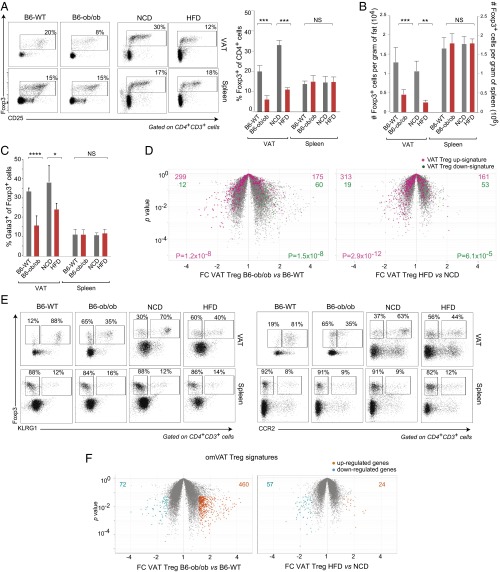
Next, we addressed how the transcriptome of VAT Tregs responds to metabolic dysregulation. Two insulin-resistant mouse models of obesity were compared with their lean counterparts: 14-wk-old leptin-deficient (B6.Lepob/ob; hereafter referred to as B6-ob/ob) mice versus B6 wild-type (B6-WT) littermates; and B6 animals maintained on HFD versus NCD between 8 and 16 wk of age. As previously reported (4), both genetically promoted and diet-induced obesity resulted in a clear reduction in the Treg fraction and number in VAT, while not in the spleen (Fig. 3 A and B). In addition, a lower proportion of VAT, but not splenic, Tregs expressed detectable levels of Gata3 in the two obese models (Fig. 3C). Under the conditions we chose, the VAT Treg changes were more pronounced in the B6-ob/ob than the HFD model, not surprising given that the former were distinctly more obese (6 g heavier on average).
Fig. 3.
Treg numbers and phenotype in obese mice. (A–C) Treg cell representation in the CD4+ compartment. Cells were isolated from the VAT and spleen of 14-wk-old B6-ob/ob vs. B6-WT mice or of B6 mice fed HFD vs. NCD between the ages of 8 and 16 wk. Percentage Foxp3+ of CD4+ T cells (A), number of such cells (B), and percentage Gata3+ of Foxp3+ cells were analyzed and displayed as per the corresponding panels in Fig. 1. For A–C, mean ± SD; *P < 0.05; **P < 0.01; ***P < 0.001; NS, not significant; by the Student’s t test. (D) Volcano plots comparing transcriptomes of obese and lean mice in the two models. Overlain are the VAT Treg up- (pink) and down- (green) signatures (from Dataset S1). P values from the χ2 test. (E) Representative dot plots of Klrg1 (Left) and CCR2 (Right) expression by VAT and spleen Tregs from obese mice and their lean controls. Percentages refer to the fraction of Foxp3+ cells constituted by the gated population. (F) Volcano plots comparing transcriptomes of obese and lean mice for the two models. Highlighted are the transcripts up- (orange) or down- (aqua) regulated ≥1.5-fold in obese mice (with a P value of ≤0.05 in three replicates). The omVAT Treg up- and down-signatures sum the altered transcripts from the two models (Dataset S2).
In both obese models, the Tregs that persisted in the adipose tissue were no longer bona fide VAT Tregs. This finding is perhaps most evident from the Fold-Change (FC) versus P value volcano plots of Fig. 3D, which show a significant underrepresentation of the VAT Treg up-signature and overrepresentation of the corresponding down-signature. Dampening of the characteristic VAT Treg gene-expression profile could reflect alterations at the molecular level (i.e., genes turned up or down), the cellular level (e.g., VAT Tregs replaced by lymphoid-tissue Tregs) or a mixture of the two. The fact that the transcript “cross-overs” were never complete, some elements of the up-signature remaining overexpressed and some members of the down-signature still underexpressed in VAT Tregs of obese mice, argues that the transcriptome changes do not simply reflect replacement of VAT by lymphoid-tissue Tregs. We were able to confirm transcript changes at the protein level via cytofluorimetric analysis of gated Tregs (Fig. 3E).
To generate a transcriptional signature for the VAT Tregs characteristic of obese mice (which will be referred to as the omVAT Treg signature), we combined the sets of transcripts differentially expressed ≥1.5-fold in either of the two models (Fig. 3F and Dataset S2). The substantially larger number of overrepresented transcripts in the genetically promoted than in the diet-induced obesity model may reflect leptin-dependent transcriptional effects or may simply result from the more advanced obesity in B6-ob/ob mice. Pathway analysis using the Ingenuity and DAVID programs highlighted lymphocyte activation (P = 10−7), cytokine/cytokine-receptor (P = 10−4) and chemokine/chemokine receptor (P = 10−3) pathways in the omVAT Treg up-signature. Sterol (10−7) and steroid (10−6) biosynthesis pathways emerged from pathway analysis of the corresponding down-signature.
Phosphorylation of PPARγ in Cultured VAT Tregs Recapitulates the Transcriptome Changes Provoked by Obesity in Vivo.
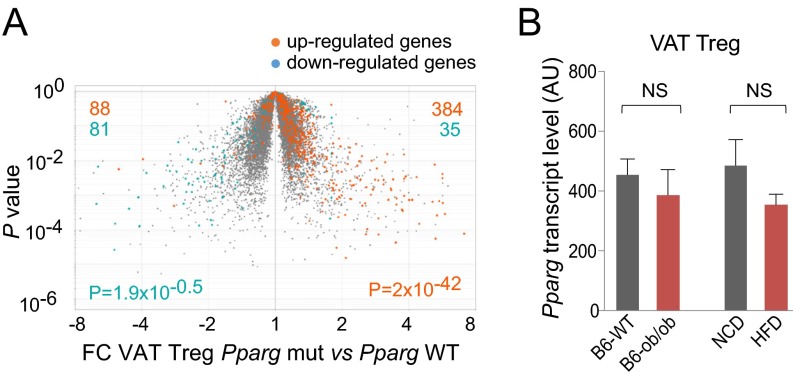
Interestingly, the omVAT Treg up-signature was significantly enriched and the corresponding down-signature significantly impoverished in the transcriptome of Tregs isolated from mice lacking PPARγ only in Tregs (compared with their WT littermates) (Fig. 4A). These observations argue that obesity might exert its impact somewhere at the level of PPARγ. However, in neither model did VAT Tregs from obese mice express fewer Pparg transcripts than their lean counterparts did (Fig. 4B). Hence, we were prompted to explore other known aspects of PPARγ biology.
Fig. 4.
PPARγ and transcriptome changes with obesity. (A) Volcano plot comparing the VAT Treg transcriptomes of mice lacking PPARγ only in Tregs (Treg Pparg mut) vs. of their WT littermates (Pparg WT). Highlighted are the omVAT Treg up- (orange) and down- (aqua) signatures (from Dataset S2). P values from the χ2 test. (B) Pparg transcript levels. Extracted from the microarray data of Fig. 3. Mean ± SD. NS = P value not significant by the Student’s t test.
Spiegelman and colleagues recently discovered that many PPARγ ligands exert anti-diabetic activities through a previously unsuspected biochemical pathway independent of classical PPARγ agonism and its downstream transcriptional consequences (7–9). Diet-induced obesity activates cyclin-dependent kinase (Cdk)5 and ERKs in adipocytes, leading to phosphorylation of the serine residue at position 273 (Ser273) of PPARγ, which in turn results in dysregulation of a set of genes abnormally expressed in the obese state. Certain PPARγ ligands, such as rosiglitazone and MRL24, are antidiabetic because they block Cdk5-induced phosphorylation of PPARγ. These processes were detected in adipose tissue ex vivo, and could be mimicked in adipocyte cultures treated with tumor necrosis factor (TNF)α.
We hypothesized that analogous phosphorylation of PPARγ at the Ser273 position might underlie at least some of the transcriptome changes induced in VAT Tregs by obesity. Unfortunately, by-far-inadequate cell numbers precluded testing this hypothesis on ex vivo Tregs by biochemical means. Instead, we made use of a TNFα-supplemented culture system parallel to that which had been used for adipocytes by Spiegelman and colleagues. Conventional Foxp3−CD4+ T cells were isolated from lean B6 mice, activated in vitro, and cotransduced with retroviruses expressing Foxp3 and Pparg. We had previously demonstrated that the concomitant expression of these two genes in naïve CD4+ Tconv cells induced much of the VAT Treg signature typical of lean mice (5). We first checked to what extent TNFα treatment of Foxp3/Pparg-transduced cells mimicked the Treg transcriptome changes induced by obesity in vivo. As illustrated by a volcano plot comparing the effects of 24-h TNFα versus vehicle treatment, the omVAT Treg up-signature was strongly induced by TNFα, whereas the corresponding down-signature was essentially unaltered (Fig. 5A). We then determined to what extent the TNFα-induced transcriptional changes reflected Ser273 phosphorylation. In the absence of TNF-α, the Foxp3 transductants cotransduced with wild-type Pparg (Pparg-WT) and those transduced with Pparg encoding an Ala substitution for the Ser at position 273 (Pparg-S273A) showed indistinguishable expression of the omVAT Treg up- and down-signatures (Fig. 5B); however, in the presence of TNFα, the up-signature was greatly enriched in the double-transductants expressing WT compared with the mutant PPARγ (Fig. 5C). Furthermore, pretreatment of the Foxp3/Pparg double-transductants with SR1664, a Cdk5 inhibitor with no agonistic activity for PPARγ (7), abolished the TNFα-induced differential between WT and mutant PPARγ (Fig. 5D).
Fig. 5.
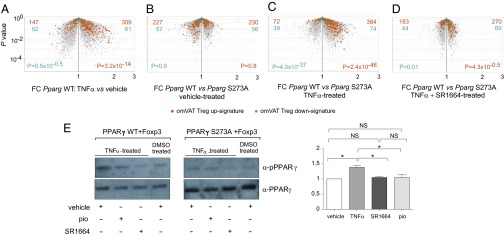
Effect of PPARγ phosphorylation on the VAT Treg signatures. Naïve CD25−CD4+ T cells were stimulated ex vivo, and were transduced with retroviruses encoding Foxp3 and WT Pparg (Pparg WT) or Pparg bearing the S273A phosphorylation-site mutation. Infected cells were treated with TNFα or vehicle in the presence or absence of the Cdk5 inhibitor, SR1664, and then were sorted for GFP and Thy1.1 positivity before RNA processing. (A–D) Microarray analysis. Volcano plots comparing the effects of TNFα (A), of the S273A mutation in the absence (B) or presence (C) of TNFα, and of the Cdk5 inhibitor, SR 1664, in the presence of TNFα (D). Highlighted are the omVAT Treg up- (orange) and down- (aqua) signatures. P values from the χ2 test. (E) Western blotting. Same samples as in A–D, except an additional sample from cells treated with TNFα plus pio was included. (Left) An example blot using Abs that detect total PPARγ (clone E-8, Santa Cruz) or PPARγ phosphorylated at position 273 (7). (Right) Quantification from two experiments. For each experiment, the value for vehicle-treated cells was set at 1. Mean ± SD; *P = <0.05; NS, not significant; by the Student’s t test.
Western blotting with mAbs recognizing PPARγ or specifically the phosphorylated Ser273 residue of PPARγ confirmed the expected phosphorylation status of the Foxp3/Pparg double-tranductants (Fig. 5E). TNFα induced phosphorylation at position 273 in WT, but not mutant, PPARγ; and TNFα-induced Ser273 phosphorylation was dampened by both the PPARγ ligand, pio, and the Cdk5 inhibitor, SR1664.
Discussion
The transcriptome of VAT Tregs is strikingly different from that of classical Tregs circulating through lymphoid tissues (4, 5). Notably, transcripts encoding certain transcription factors (e.g., PPARγ, Gata-3), chemokines or their receptors (e.g., CCR1, CCR2), cytokines or their receptors (e.g., IL10, IL1rl1), and a set of proteins involved in lipid metabolism (e.g., Dgat1, Pcyt1a) are overrepresented in Tregs residing in VAT. The overall goal of this study was to further elucidate the VAT Treg signature: how it responds to aging in lean mice, to metabolic perturbation in obese mice, and to certain PPARγ-mediated signaling events discovered in adipocytes.
Although the fraction of Tregs in the VAT CD4+ T-cell compartment was routinely much higher than that in lymphoid organs in 25-wk-old mice, the differential was not apparent until about 10–15 wk of age, and 5-wk-old mice harbored a Treg population in VAT fractionally similar to, or even smaller than, that in the spleen and LNs (ref. 4 and Fig. 1 A and B). One possibility was that VAT is populated by Tregs of lymphoid-type early in life, which are gradually replaced by their VAT-type counterparts, optimally adapted to thrive and proliferate. However, we found that the VAT Treg signature was already evident at 5 wk of age. Paradigmatic VAT Treg transcripts were already overrepresented, and for most of them there was little additional increase in expression at 25 wk: e.g., Pparg (1.3-fold), Gata3 (1.4-fold), Ccr2 (2.6-fold), Klrg1 (1.7-fold), Il1rl1 (1.8-fold). There was, however, a score of transcripts enriched substantially more (>4 times) in the VAT Treg population of 25- than of 5-wk-old mice; their continued increase might reflect additional local adaptation to the lipophilic, hypoxic adipose-tissue environment.
The first suggestion that VAT Tregs might have an important function in guarding against adipose-tissue inflammation and insulin resistance was their conspicuous reduction in insulin-resistant models of obesity, a notion ultimately substantiated by gain- and loss-of-function experiments (4, 5). In the present study, we showed this numerical decrease to be accompanied by loss of a large swathe of the VAT Treg signature in the remaining Foxp3+CD4+ T-cell population, no matter whether obesity was provoked by a genetic or dietary alteration. Interestingly, about 1/3 of the VAT Treg up-signature was not down-regulated in each of the two models.
In this study, we also defined an omVAT Treg signature, consisting of transcripts up- or down-regulated in obese mice vis-à-vis their lean counterparts. Surprisingly, although this signature showed a strong correlation with transcriptional changes provoked by ablation of PPARγ (Fig. 4A), the level of transcripts encoding PPARγ, itself, was not altered in the obese state. Instead, experiments on a previously and currently validated (ref. 8 and Fig. 5A) TNFα-supplemented cell-culture model led us to conclude that PPARγ must be phosphorylated at the Ser273 position by Cdk5. This posttranslational modification led to dysregulated transcription akin to what was previously reported for adipocytes (ref. 8 and Fig. 5).
These findings point to a remarkable parallelism in PPARγ’s modus operandi in adipocytes and VAT Tregs. It is thus easier to rationalize our previous observation that the PPARγ displayed on Tregs is a major conduit for the insulin-sensitizing effects of the PPARγ agonists, such as pio and rosiglitazone, that were for many years front-line drugs for treatment of T2D (5). And one might anticipate that new PPARγ agonists designed to have potency in the absence of weight gain, fluid retention, and cardiac abnormalities (7) will effectively target VAT Tregs as well as adipocytes. Lastly, this remarkable parallelism between the Treg population and its parenchymal cohabitants highlights the malleability of Tregs in adapting to a particular tissue context, operating in concert with its defining cellular participant.
Methods
Mice.
B6, B6.Lepob/ob, and B6.Pparg-flox (10) mice were bred in our specific-pathogen-free facilities at Harvard Medical School, or were purchased from Jackson Laboratory. Treg-Pparg mut mice were generated as described (5). HFD-fed animals were maintained on a diet of 60 kcal% fat, purchased from Research Diets (catalog no. D12451). NCD-fed control animals were kept on a diet containing 10 kcal% fat, obtained from the same vendor (catalog no. 12450B). In designated experiments, pio (Actos, Takeda) was introduced into the diet at a concentration of 100 mg per kg of food. Experimental and control animals were generally littermate-matched males.
HOMA-IR, calculated as described (11), was determined for 25- and 40-wk-old B6 individuals. Mice were fasted overnight, weighed, then tested for fasting blood-glucose and blood-insulin concentrations by ELISA, performed by the Joslin Diabetes Center’s Specialized Assay Core.
Immunocyte Isolation and Analysis.
Epididymal adipose tissue (VAT) and splenic or LN immunocytes were isolated as described (4, 5). They were routinely stained with anti-CD45 (30-F11), -CD3 (145-2C11), -CD4 (GK1.5), -CD8 (5H10), and -CD25 (PC61) mAbs, (all eBiosciences) and, for some experiments, were fixed and permeabilized according to the manufacturer’s instructions, followed by intracellular staining of Foxp3 (FJK-16s) and/or Gata3 (TWAJ) (both from eBiosciences). Cells were double-sorted using the Moflo, or analyzed using an LSRII instrument (BD Bioscience) and FlowJo software.
Retroviral Transduction Experiments.
Immunocytes were harvested from pooled spleens and LNs of 6- to 8-wk-old B6 mice, and CD25−CD4+ T cells were prepared for retroviral transduction as described (5). Viruses were made by transfecting platE cells (12) with (i) retroviral expression plasmids [(MSCV IRES-GFP (pMIG2) and IRES-Thy1.1 (pMIT2)] (13), encoding Foxp3 (GFP), PPARγ WT (Thy1.1) or PPARγ S273A (Thy1.1); and (ii) the packaging construct pcl-ECO (14); using TransIT-293 (Mirus) according to the manufacturer's instructions. Naive CD4+ T cells were infected with retroviral supernatants 48 h after activation with anti-CD3/CD28 mAb-coated beads, and were cultured for an additional 72 h. Singly (Foxp3) or doubly (Foxp3 plus Pparg WT or Pparg S273A) transduced cells were double-sorted as (CD11b− CD11c−B220−CD8−)CD3+CD4+GFP+(and/or Thy1.1+) by Moflo for RNA processing and microarray analysis. In designated experiments, 48 h after cell infection, single- and double-transductants were treated with TNFα (50 ng/mL) with or without SR1664 (2 μM) (7) or vehicle (DMSO) alone for 24 h.
Microarray Analysis.
LN or VAT Tregs (CD25hiCD4+CD3+) or Tconv cells (CD25−CD4+CD3+) were double-sorted from B6-WT, B6-ob/ob, Pparg WT or Treg-Pparg mut mice. GFP+ (i.e., Foxp3+)CD4+CD3+ double-transduced cells, treated with TNFα plus SR1664 or vehicle, were also double-sorted to ensure high purity. RNA was extracted, amplified for two rounds, biotin-labeled, and purified as described (5). The resulting cRNAs (three independent datasets for each sample type) were hybridized to Mouse Genome M1.0 ST arrays (Affymetrix) according to the manufacturer's protocol. Microarray data were background-corrected and normalized, and replicates were averaged as described (5). The “VAT Treg” signatures included transcripts ≥twofold over- or underrepresented in VAT Tregs vs. LN Tregs, VAT Tconv cells and LN Tconv cells of 25-wk-old mice. The omVAT Treg signatures included all transcripts ≥1.5-fold over- or underrepresented in VAT Tregs of obese mice vis-à-vis their lean comparators, summing those from the B6-ob/ob and HFD-fed models.
Immunoblotting.
Foxp3−CD4+ T cells were cotransduced with Foxp3 and Pparg(WT or encoding the S273A mutant), pretreated with pio or SR1664 in DMSO or just DMSO, before incubation with DMSO or TNFα in DMSO. Protein lysates were made, run on SDS/PAGE, and probed with an anti-PPARγ or an anti-phosphoPPARγ (pPPARg) antibody, all as per ref. 7.
Supplementary Material
Acknowledgments
We thank V. Babatunde for help with cloning, K. Hattori for assistance with mouse husbandry, J. LaVecchio and G. Buruzala for flow-cytometry, J. Ericson and K. Leatherbee for RNA processing, S. Davis for help with the microarray analysis, and Dr. M. T. Wilson for discussions. This work was supported by grants from the NIH (R01 DK092541), the Ellison Foundation (Boston), and the JPB Foundation (to D.M. and B.M.S.), and by the core facilities of the Joslin Diabetes Center (P30DK36836).
Footnotes
The authors declare no conflict of interest.
Data deposition: The data reported in this paper have been deposited in the Gene Expression Omnibus (GEO) database, www.ncbi.nlm.nih.gov/geo (accession no. GSE37535).
This article contains supporting information online at www.pnas.org/lookup/suppl/doi:10.1073/pnas.1423486112/-/DCSupplemental.
References
- 1.Osborn O, Olefsky JM. The cellular and signaling networks linking the immune system and metabolism in disease. Nat Med. 2012;18(3):363–374. doi: 10.1038/nm.2627. [DOI] [PubMed] [Google Scholar]
- 2.Mathis D. Immunological goings-on in visceral adipose tissue. Cell Metab. 2013;17(6):851–859. doi: 10.1016/j.cmet.2013.05.008. [DOI] [PMC free article] [PubMed] [Google Scholar]
- 3.Cipolletta D. Adipose tissue-resident regulatory T cells: Phenotypic specialization, functions and therapeutic potential. Immunology. 2014;142(4):517–525. doi: 10.1111/imm.12262. [DOI] [PMC free article] [PubMed] [Google Scholar]
- 4.Feuerer M, et al. Lean, but not obese, fat is enriched for a unique population of regulatory T cells that affect metabolic parameters. Nat Med. 2009;15(8):930–939. doi: 10.1038/nm.2002. [DOI] [PMC free article] [PubMed] [Google Scholar]
- 5.Cipolletta D, et al. PPAR-γ is a major driver of the accumulation and phenotype of adipose tissue Treg cells. Nature. 2012;486(7404):549–553. doi: 10.1038/nature11132. [DOI] [PMC free article] [PubMed] [Google Scholar]
- 6.Tontonoz P, Spiegelman BM. Fat and beyond: The diverse biology of PPARgamma. Annu Rev Biochem. 2008;77:289–312. doi: 10.1146/annurev.biochem.77.061307.091829. [DOI] [PubMed] [Google Scholar]
- 7.Choi JH, et al. Antidiabetic actions of a non-agonist PPARγ ligand blocking Cdk5-mediated phosphorylation. Nature. 2011;477(7365):477–481. doi: 10.1038/nature10383. [DOI] [PMC free article] [PubMed] [Google Scholar]
- 8.Choi JH, et al. Anti-diabetic drugs inhibit obesity-linked phosphorylation of PPARgamma by Cdk5. Nature. 2010;466(7305):451–456. doi: 10.1038/nature09291. [DOI] [PMC free article] [PubMed] [Google Scholar]
- 9.Banks AS, et al. An ERK/Cdk5 axis controls the diabetogenic actions of PPARγ. Nature. 2014 doi: 10.1038/nature13887. [DOI] [PMC free article] [PubMed] [Google Scholar]
- 10.Akiyama TE, et al. Conditional disruption of the peroxisome proliferator-activated receptor gamma gene in mice results in lowered expression of ABCA1, ABCG1, and apoE in macrophages and reduced cholesterol efflux. Mol Cell Biol. 2002;22(8):2607–2619. doi: 10.1128/MCB.22.8.2607-2619.2002. [DOI] [PMC free article] [PubMed] [Google Scholar]
- 11.Matthews DR, et al. Homeostasis model assessment: Insulin resistance and beta-cell function from fasting plasma glucose and insulin concentrations in man. Diabetologia. 1985;28(7):412–419. doi: 10.1007/BF00280883. [DOI] [PubMed] [Google Scholar]
- 12.Morita S, Kojima T, Kitamura T. Plat-E: An efficient and stable system for transient packaging of retroviruses. Gene Ther. 2000;7(12):1063–1066. doi: 10.1038/sj.gt.3301206. [DOI] [PubMed] [Google Scholar]
- 13.Holst J, et al. Generation of T-cell receptor retrogenic mice. Nat Protoc. 2006;1(1):406–417. doi: 10.1038/nprot.2006.61. [DOI] [PubMed] [Google Scholar]
- 14.Naviaux RK, Costanzi E, Haas M, Verma IM. The pCL vector system: rapid production of helper-free, high-titer, recombinant retroviruses. J Virol. 1996;70(8):5701–5705. doi: 10.1128/jvi.70.8.5701-5705.1996. [DOI] [PMC free article] [PubMed] [Google Scholar]
Associated Data
This section collects any data citations, data availability statements, or supplementary materials included in this article.


