

Abstract
Synthetic genetic systems share resources with the host, including machinery for transcription and translation. Phage RNA polymerases (RNAPs) decouple transcription from the host and generate high expression. However, they can exhibit toxicity and lack accessory proteins (σ factors and activators) that enable switching between different promoters and modulation of activity. Here, we show that T7 RNAP (883 amino acids) can be divided into four fragments that have to be co-expressed to function. The DNA-binding loop is encoded in a C-terminal 285-aa ‘σ fragment’, and fragments with different specificity can direct the remaining 601-aa ‘core fragment’ to different promoters. Using these parts, we have built a resource allocator that sets the core fragment concentration, which is then shared by multiple σ fragments. Adjusting the concentration of the core fragment sets the maximum transcriptional capacity available to a synthetic system. Further, positive and negative regulation is implemented using a 67-aa N-terminal ‘α fragment’ and a null (inactivated) σ fragment, respectively. The α fragment can be fused to recombinant proteins to make promoters responsive to their levels. These parts provide a toolbox to allocate transcriptional resources via different schemes, which we demonstrate by building a system which adjusts promoter activity to compensate for the difference in copy number of two plasmids.
Keywords: genetic circuit, resource allocation, split protein, synthetic biology, T7 RNA polymerase
Introduction
Cells must control the production of RNA polymerase (RNAP) and ribosomes to balance their biosynthetic cost with the needs of cell growth and maintenance (Warner, 1999). As such, RNAP and ribosome synthesis is under stringent regulatory control, both to coordinate their levels with respect to cellular and environmental cues for growth (Nierlich, 1968; Hayward et al, 1973; Iwakura & Ishihama, 1975; Bedwell & Nomura, 1986; Bremer & Dennis, 2008; Schaechter et al, 1958; Lempiäinen & Shore, 2009; Gausing, 1977; Schneider et al, 2003) and to balance the expression of their components for proper assembly into functional machines (Warner, 1999; Ishihama, 1981; Nierhaus, 1991; Fatica & Tollervey, 2002). This sets a resource budget that must be shared in the transcription of approximately 4,000 genes and translation of ∼106 nucleotides of mRNA in E. coli (Bremer & Dennis, 1996). The budget is not large; on average, there are 2,000 RNAP and 10,000 ribosomes per cell (Ishihama et al, 1976; Bremer & Dennis, 1996; Ishihama, 2000). Mathematical models often assume these budgets to be constant (Shea & Ackers, 1985; Gardner et al, 2000; Elowitz & Leibler, 2000), but the numbers can vary significantly in different growth phases and nutrient conditions, ranging from 1,500 to 11,400 RNAPs and 6,800 to 72,000 ribosomes per cell (Bremer & Dennis, 1996; Klumpp & Hwa, 2008). The fluctuations in resources can lead to global changes in expression levels and promoter activities (Keren et al, 2013; De Vos et al, 2011).
This poses a problem when a synthetic genetic system is introduced. When it relies on the transcription and translation machinery of the host, it becomes implicitly embedded in their regulation, making it sensitive to changes that occur during cell growth and function. As a result, the system can be fragile because the strengths of its component parts (promoters and ribosome binding sites) will vary with the resource budgets (Moser et al, 2012; Arkin & Fletcher, 2006; Kittleson et al, 2012). For example, changes in the RNAP concentration can impact the expression from constitutive promoters by fivefold (Bremer & Dennis, 1996; Liang et al, 1999; Klumpp et al, 2009; Liang et al, 2000; Klumpp & Hwa, 2008). These changes can reduce the performance of a system that requires precise balances in expression levels (Temme et al, 2012b; Moser et al, 2012; Moon et al, 2012). This has emerged as a particular problem in obtaining reliable expression levels and gene circuit performance during industrial scale-up, where each phase is associated with different growth and media conditions (Moser et al, 2012).
Another problem is that synthetic systems often place high demands on host transcription and translation resources and this can have global consequences in maintaining growth and responding to stress (Hoffmann & Rinas, 2004; Birnbaum & Bailey, 1991). Proteins and pathways expressed at very high levels place a burden on cells that can reach up to 30% of total cellular proteins and utilize 50% of translation capacity (Dong et al, 1995; Scott et al, 2010; Carrera et al, 2011). The competition with native genes can cause a decrease in their expression and a reduction or cessation of growth (Dong et al, 1995; Scott et al, 2010; Carrera et al, 2011; Tabor et al, 2008). In addition, because of the small numbers of RNAP and ribosomes, the expression of recombinant genes can become coupled, where a high level of expression of one gene titrates a resource and reduces the expression of another gene. In the context of synthetic signaling networks, this has been referred to as ‘retroactivity’, where downstream targets can impart a load on the upstream signaling pathway (Jiang et al, 2011; Jayanthi et al, 2013; Del Vecchio et al, 2008; Del Vecchio & Murray, 2014).
These challenges were recognized early in biotechnology and a partial solution emerged by using the RNAP from T7 phage to decouple transcription from the host machinery (Chamberlin et al, 1970; Studier & Moffatt, 1986; Alexander et al, 1992). Heterologous T7 RNAP was patented in 1984 (Studier et al, 1990) and since then has been the basis for expression systems across many organisms (Elroy-Stein & Moss, 1990; Brunschwig & Darzins, 1992; McBride et al, 1994; Conrad et al, 1996). An advantage cited for this system was that it could achieve high expression levels by adding an inhibitor of E. coli RNAP, thus directing metabolic resources to recombinant protein production (Tabor & Richardson, 1985). However, there are also some challenges with using T7 RNAP. While the polymerase itself is not toxic, when it is combined with a strong promoter, it can cause severe growth defects. The origin of this toxicity is not clear, but it could be related to the rate of transcription of T7 RNAP, which is eightfold faster than E. coli RNAP and could expose naked mRNA (Iost et al, 1992; Miroux & Walker, 1996). Toxicity can be ameliorated by introducing a mutation near the active site and by selecting parts to lower polymerase expression (Temme et al, 2012a,b). Beyond the RNAP from T7, many polymerases have been identified from different phage and directed evolution experiments have yielded variants that recognize different promoter sequences (Temme et al, 2012a; Ellefson et al, 2013; Carlson et al, 2014).
Phage polymerases are central to our organization of larger genetic systems (Temme et al, 2012a,b; Smanski et al, 2014). We separate the regulation of a system (on a plasmid we refer to as the ‘controller’) from those genes encoding pathways or cellular functions (‘actuators’) (Fig1A). The controller contains synthetic sensors and circuits, whose outputs are phage polymerases specific to the activation of the actuators. This organization has several practical advantages. First, it avoids evolutionary pressure when manipulating the actuators because the promoters are tightly off in the absence of phage polymerase. Thus, they can be carried in an inactive state until the controller is introduced into the cell. Actuators often require many genes and assembled parts, making re-verification of their sequence expensive. Second, it allows the regulation of the actuators to be changed quickly. Controllers can be swapped to change the conditions and dynamics of expression, so long as they produce the same dynamic range in output polymerase expression. In the same way, the controllers can also be characterized independently using surrogate fluorescent reporters prior to being combined with the actuators.
Figure 1. The resource allocator.
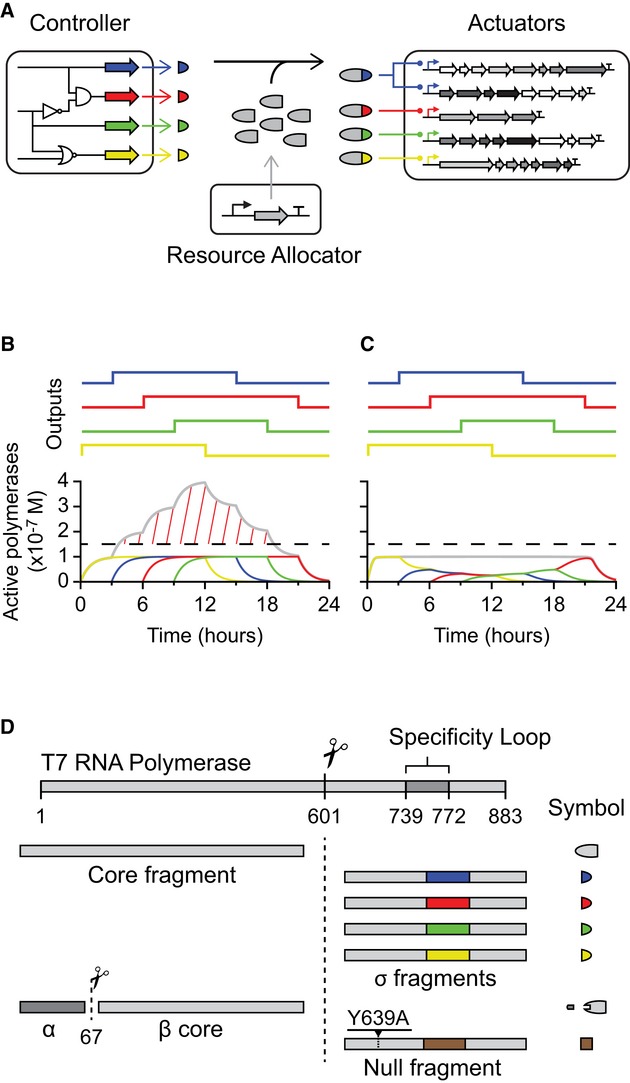
- Complex synthetic genetic systems are broken down into three modules. The core fragment of RNAP is expressed from the resource allocator. Each output from the controller results in the expression of a different σ fragment (colored half-circles), which share the core fragment and turn on different actuators.
- Dynamic simulations of resource allocation are shown, where the outputs from the controller are turned on and off at different times (colored lines) (Supplementary information Section IV.A.). A hypothetical toxicity threshold is shown with the dashed horizontal line. When the outputs of the controller are complete RNAPs, their sum crosses the threshold (gray line and red hash).
- With resource allocation, the outputs of the controller are σ fragments that must share the core fragment, thus ensuring that their sum transcriptional activity does not cross the threshold.
- The complete toolbox of phage RNAP fragments is shown.
With these large and complex synthetic systems, problems can arise as the host is subjected to significant perturbation and load. Simultaneously activating a number of actuators requires expressing multiple polymerases that might collectively cross the threshold for toxicity (Fig1B). While lowering expression rates throughout the system could avoid toxicity, it would needlessly constrain expression when only one actuator is active. To address this issue, we aimed to create an allocation system that allows independently setting the total desired polymerase activity and allocating this resource to the various actuators as needed. With this organization, a single actuator can be expressed to full strength, but expression of multiple actuators is attenuated to avoid overexpression (Fig1C). In effect, we are proposing to add another layer to the organization of genetic designs, where a separate ‘resource allocator’ is responsible for the maintenance of a desired level of orthogonal transcriptional machinery (Fig1A).
Prokaryotes solve the problem of partitioning a budget of RNAP to different cellular processes through the action of σ factors, which bind to the core RNAP (α2, β, β′, and ω subunits) and direct it to promoter sequences (Gruber & Gross, 2003; El-Samad et al, 2005). Core RNAP itself only has the ability to non-specifically bind to DNA, whereas the σ factor contains the DNA recognition domains for the −35 and −10 regions of promoters. Different σ factors bind to distinct promoter recognition sequences. In E. coli, there is one ‘housekeeping’ σ factor (σ70) that is expressed at a constant level of 500–700 molecules/cell, independent of growth phase or stress, and 6 alternate σ factors that control various stress responses (e.g., heat shock) and cellular functions (e.g., flagella assembly) (Jishage et al, 1996). σ factors can range in size; σ70 is 613 amino acids and the average alternative σ is ∼200 amino acids (Burton et al, 1981; Staroń et al, 2009; Rhodius et al, 2013). These alternative σs can be embedded in complex regulatory networks that implement signal integration and feedback regulation that mimics engineering control architectures (Lange & Hengge-Aronis, 1994; Hengge-Aronis, 2002; Kurata et al, 2001). In this way, the level of core RNAP dictates the total transcriptional potential in the cell, while the relative levels of σ factors determine how this resource is allocated between growth and stress resistance (Nyström, 2004; Maharjan et al, 2013). Bacteria with more diverse lifestyles can have significantly more σ factors, for example, Streptomyces and Bacteroides species can have greater than 50 (Lange & Hengge-Aronis, 1994; Hengge-Aronis, 2002; Kurata et al, 2001). All of these σs compete to bind to the core RNAP (Ishihama, 2000; Gruber & Gross, 2003).
In this manuscript, we have created an analogous system by fragmenting T7 RNAP. We used a transposon method to identify five regions where the polymerase can be bisected and retain function. One of these splits produces a 285 amino acid fragment that we refer to as the ‘σ fragment’ because it contains the region that binds to the promoter (Fig1D). We find that variants of this fragment with different promoter specificities can bind to the remaining ‘core fragment’ and direct it to different promoters. The expression level of the core fragment dictates the maximum number of active polymerases. The outputs of the controller are different σ fragments, which are used to turn on different actuators. If the pool of core fragments is saturated by σ fragments, the total number of active polymerases in the system will remain constant regardless of the levels of σ fragments being produced (Fig1C). In this way, a desired transcriptional load can be specified and then dynamically allocated to different actuators as the conditions require. Negative regulators can be built by creating null σ fragments that titrate the core fragment but do not support transcription. Additionally, the core fragment can be positively regulated using the N-terminal bisection point to separate an ‘α fragment’ that is required for activity. These regulators could be used to implement feedback loops that control the amount of active RNAP complexes under different conditions or the dynamics of signal progression from the controller to the actuators.
Results
Bisection mapping of T7 RNA polymerase
Our first objective was to identify all of the places T7 RNAP could be split to yield two fragments that can be co-expressed to produce a functional protein. To do this, we developed a transposase-based method that uses a novel transposon to split proteins, which we refer to as a ‘splitposon’. Previous methods have been published to generate libraries of split proteins or domain insertions that are based on incremental truncation (Ostermeier et al, 1999; Paschon & Ostermeier, 2004), multiplex inverse PCR (Kanwar et al, 2013), DNAse cleavage (Guntas & Ostermeier, 2004; Chen et al, 2009), and transposon insertion (Segall-Shapiro et al, 2011; Mahdavi et al, 2013). The transposon-based approaches are able to generate large libraries and do not require sensitive DNAse steps, but they leave ∼10 added amino acids at the split site. To improve on this approach, the splitposon is a Mu transposon in which one terminal transposon recognition end is altered to contain a non-disruptive ribosome binding site (RBS) and start codon (Fig2A). We further modified the transposon to add the remaining necessary regulation to divide a protein into two fragments (stop codon—PTac IPTG-inducible system—RBS—start codon). The MuA transposase efficiently yields random insertions of the splitposon throughout a DNA molecule, producing a library of split proteins flanked by just three additional amino acids for in-frame insertions (Supplementary Fig S1).
Figure 2. Bisection mapping of T7* RNAP.
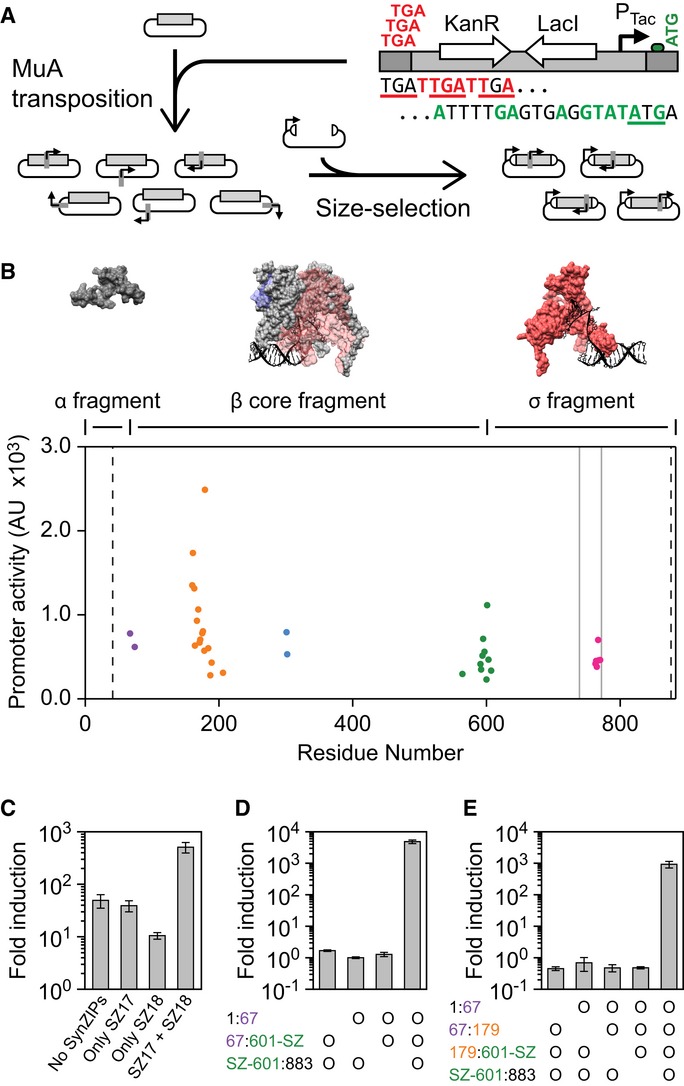
- The splitposon is based on a modified mini-Mu transposon mutated to contain staggered stop codons in one recognition end (red) and an RBS & start codon in the other (green). An internal inducible system (LacI and PTac) has been added. Bisection mapping includes two cloning steps. First, the splitposon is transposed randomly into a gene using MuA transposase. Second, the library is size selected for inserts that contain one transposon insertion and cloned into an expression plasmid.
- Each point represents a unique in-frame split location in T7* RNAP, where the residue number is the final residue in the N-terminal fragment. The promoter activity is the mean PT7 activity for all recovered clones at each split point, from four independent assays (10 μM IPTG induction). Bisection points are clustered into five ‘seams’, which are color-coded. The vertical dashed lines show the region where bisections were allowed in the library, and the gray vertical lines show the location of the promoter specificity loop. Surface models are shown for the three fragments used for the resource allocator (PDB:1QLN (Cheetham & Steitz, 1999), visualized using UCSF Chimera (Pettersen et al, 2004)). The model for the β core fragment shows the position of the α and σ fragments in transparent blue and red, respectively. More views of the surface model are shown in Supplementary Fig S4.
- The fragments created from splitting T7 RNAP at residue 601 were assayed with and without SynZIP domains at low expression levels (4 μM IPTG). When SynZIP 17 (SZ17) is fused to the N-terminal fragment and SynZIP 18 (SZ18) is fused to the C-terminal fragment, a large increase in the induction of PT7 is observed. Fold induction is calculated as the PT7 promoter activity in induced cells divided by the promoter activity of cells that contain the reporter plasmid but no polymerase fragments.
- Data are shown for the expression of the three fragments corresponding to the α fragment (1:67), β core fragment (67:601-SZ), and σ fragment (SZ-601:883). An ‘o’ indicates the presence of a fragment in an operon that is expressed with 100 μM IPTG.
- Data are shown for the induction of four fragments, as in (D), with an additional split of the β core fragment at residue 179.
Data information: For the graphs in (C–E), the mean is shown for three independent assays performed on different days, with error bars showing standard deviation.Source data are available online for this figure.
With the splitposon, a bisection library for any protein can be generated in two steps (Fig2A). First, the splitposon is transposed in vitro into a plasmid containing the DNA within which bisections are desired (e.g., a gene or segment of a gene). Second, the target region is digested from the plasmid backbone and size selected for fragments containing an inserted transposon. These fragments are ligated into an expression plasmid containing an upstream inducible promoter. The final library will contain only plasmids with a single transposon insertion in the region of interest and can be induced and screened for function.
The splitposon method was applied to generate a library of bisections of a variant of T7 RNAP (T7* RNAP). This gene contains the R632S mutant, which reduces host toxicity (Temme et al, 2012a). To avoid trivial truncations of the termini, we directed transposon insertions to the region of the gene corresponding to amino acids 41 through 876 of the polymerase. Both fragments are induced with IPTG from PTac. The library was co-transformed with a screening plasmid that contains a T7 RNAP dependent promoter and red fluorescent protein (RFP) (Temme et al, 2012a), and 384 clones were picked by eye from agar plates, re-assayed in liquid media, and the best 192 sequenced. From these, 36 unique in-frame split sites were identified (Fig2B). The split sites cluster into five distinct seams that correspond to six potential fragments if they were all implemented simultaneously. The seam around position 179 corresponds to a previously identified split site that yields a functional T7 RNAP (Ikeda & Richardson, 1987a,b; Muller et al, 1988; Shis & Bennett, 2013).
Division of T7 RNAP into multiple fragments
All of the discovered split seams occur in surface-exposed regions of the T7* RNAP, and the largest seam corresponds to a large surface-exposed loop known as the ‘Flap’ in the 3-dimensional structure (Supplementary Fig S3) (Tahirov et al, 2002). This implies that additional functional domains can be inserted at these positions. We hypothesized that the addition of protein–protein interaction domains could improve the affinity of the fragments. To this end, two leucine zipper domains that bind in an antiparallel orientation were chosen from the SynZIP toolbox (variants 17 and 18) (Reinke et al, 2010; Thompson et al, 2012). Addition of either SynZIP at the 601 split site with a short flexible linker is tolerated by the split polymerase, and adding both is beneficial and improves activity by greater than tenfold at low expression levels (Fig2C).
The outcome of the bisection mapping experiment also implied that it might be possible to divide T7* RNAP into more than two fragments. First, the protein was divided into three fragments based on the split points at residues 67 and 601, including the added SynZIPs at the 601 split. These three fragments were expressed as a single inducible operon and compared to versions lacking each of the single fragments. RNAP activity (4,000-fold induction) is only detected when all three fragments are expressed and there is no activity in the absence of any fragment (Fig2D). We also tested a four fragment version, which includes a split at position 179 (Fig2E). The expression of these four fragments yields active RNAP (900-fold induction), and there is no detectible activity if any of the fragments are not expressed.
While the four and three-piece polymerases do lead to a reduction in cell growth when expressed at high levels, this effect is more pronounced when expressing the full-length protein (Supplementary Fig S12). Splitting the polymerase into five or six fragments was not attempted due to the attenuation of activity and growth impact of high expression with four fragments.
Construction of ‘σ fragments’ with different promoter specificities
The C-terminal fragment generated by the split site at residue 601 (601–883) contains the DNA-binding loop that determines promoter specificity (Cheetham et al, 1999). Thus, we refer to this as the ‘σ fragment’ as it functions analogously to σ factors that bind to E. coli RNAP and is approximately the same size. Following this analogy, the 601 amino acid N-terminal fragment is referred to as the ‘core fragment’. Note that this fragment is much smaller than the α2/β/β’/ω subunits of E. coli RNAP (329/1342/1407/91 amino acids) and they assemble into a very different 3-dimensional structure (Sousa et al, 1993; Vassylyev et al, 2002; Opalka et al, 2010).
A simple resource allocator was built based on the core and σ fragments (Fig3A), retaining the amino acids added by the splitposon method and the SynZIP 18 domain on the σ fragment. The core fragment is expressed from the constitutive promoter PJ23105, tuned to a low level such that expressing full-length polymerase in its place is not toxic. The σ fragment is expressed at varying levels using an IPTG-inducible PTac promoter. Polymerase activity is measured using PT7 driving green fluorescent protein (GFP) (Materials and Methods). The σ fragment, core fragment, and reporter are carried on three separate plasmids (p15A*, BAC, pSC101) to mimic the controller, resource allocator, and actuator organization (Fig1A).
Figure 3. Activation of the core fragment via σ fragments.
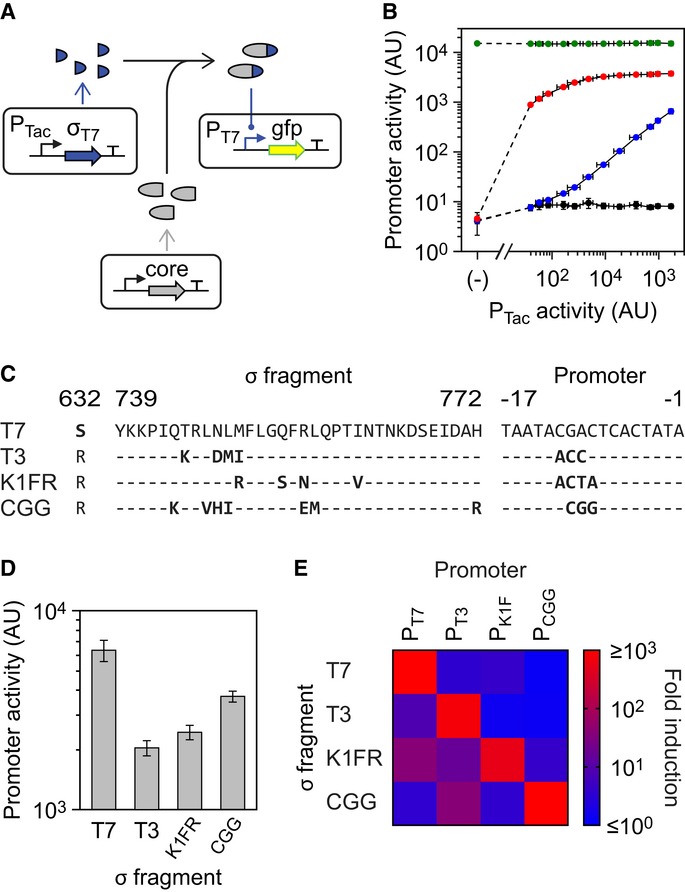
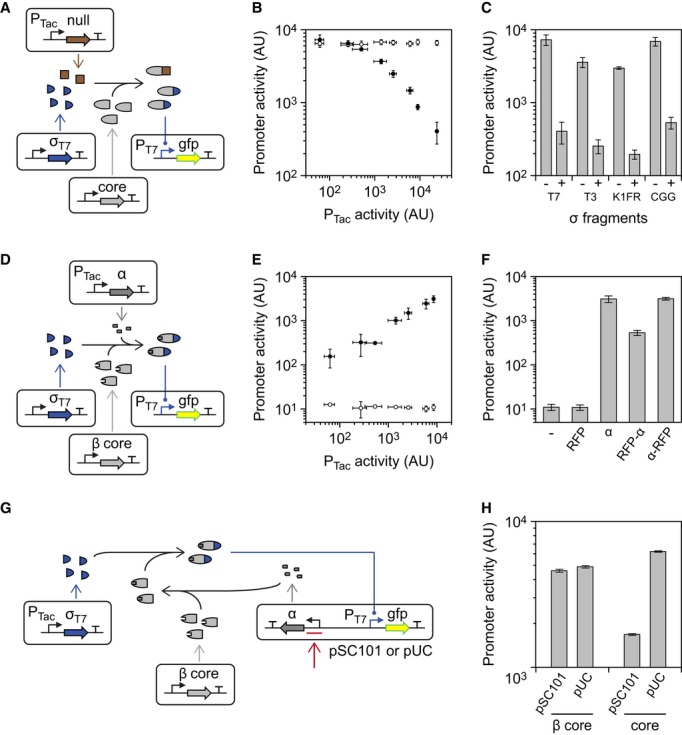
- A schematic of the induction system is shown; the core fragment is expressed at a constant level from a constitutive promoter.
- The T7 σ fragment (SZ-601:883) is induced in the presence of different core fragments, and the activity of PT7 is measured. Red and blue points show the induction in the presence and absence of the SynZIP, respectively (core fragments 1:601-SZ and 1:601). The activity of full-length T7* RNAP is shown as a positive control (green). A negative control with no core fragment is shown (black). The leftmost point (marked ‘(−)’) represents cells that did not encode the T7 σ fragment. From left to right, the remaining points represent induction levels of: 0, 1, 2, 4, 6.3, 10, 16, 25, 40, 63, 100, and 1,000 μM IPTG.
- The variations between the σ fragments and promoters are shown. Position 632 indicates the mutation made in T7* RNAP that reduces toxicity, and positions 739–772 show the DNA-binding loop.
- The activities of each of the four σ fragments are shown with their cognate promoters when expressed to saturation (100 μM IPTG) with the core fragment.
- The cross-reactivity of each σ fragment with each promoter is shown (100 μM IPTG induction of the σ fragments and constant core fragment expression). The underlying activity levels and variation for this assay are shown in Supplementary Fig S5.
Data information: For all graphs, the mean is shown for three independent assays performed on different days, with error bars showing standard deviation.Source data are available online for this figure.
For the resource allocation scheme to function correctly, σ fragments need to saturate the core fragment, causing total RNAP activity to plateau above a certain total concentration of σ fragments. The maximum level of polymerase activity is then set by the concentration of the core fragment, independent of changes in σ fragment expression (Fig1C). Core fragment expression, and thus overall maximum functional polymerase expression, can be modulated by selecting constitutive promoters and RBSs of different strengths. This saturation behavior is observed when the core fragment is fused to the SynZIP 17 domain (Fig 3B, red points). The RNAP activity saturates approximately fourfold below that obtained with the expression of full-length T7* RNAP in place of the core fragment, which does not change as a function of σ fragment expression (green points). Since the full-length T7* RNAP is expressed at a level equivalent to the core fragment, this indicates that the split polymerase with SynZIPs has about one quarter the activity of full-length T7* RNAP. Without the SynZIP domain on the core fragment, the σ fragment binds with much lower affinity and does not reach saturation even at high levels of expression (blue points). Because the desired saturation of the core fragment is obtained only with the SynZIPs, they were used in all further experiments.
A key feature of the allocator is to be able to direct transcriptional resources to different actuators. This requires multiple σ fragments that can bind to the core fragment to change its promoter affinity. These σ fragments need to be orthogonal, that is, they cannot cross-react with each other's promoters. Initially, we attempted to base the orthogonal σ fragments on a set of specificity loop mutations previously shown to generate orthogonal variants of full-length T7 RNAP (Temme et al, 2012a). These specificity loops are based on polymerases from the T3, K1F, and N4 phages. We tested the corresponding σ fragments and mutated promoters. Unfortunately, of these variants, only the σ fragment containing the T3 specificity loop and corresponding promoter (Fig3C) generated an activity comparable to that of the T7 σ fragment (Fig3D).
The σ fragments based on the K1F and N4 specificity loops did have some residual activity. This was used as a basis to apply error-prone PCR to the σ fragments to search for mutations that increase activity (Materials and Methods). One mutation was found for the K1F loop (K1FR: M750R) that recovered activity to a sufficient level, but similar efforts with the N4 loop proved unsuccessful (Supplementary Information Section III.A.). An additional σ fragment was built based on an orthogonal T7 RNAP variant (CGG-R12-KIR) that was identified from directed evolution experiments (Ellefson et al, 2013). This produced a comparable activity to the other σ fragments (Fig3D). In total, four σ fragment variants (T7, T3, K1FR, and CGG) and cognate promoters were built. It is noteworthy that the σ fragments only differ in sequence by 5–10 amino acids (Fig3C). Expression of each σ fragment with its cognate promoter and the same level of core fragment shows that their activities fall into a similar range with less than a fourfold difference between the strongest (T7) and weakest (T3) σ fragments (Fig3D). The four σ fragments were also found to be orthogonal (Fig3E), and their expression to saturation with the core fragment does not lead to growth defects (Supplementary Fig S10).
Setting and sharing the transcriptional budget
The expression level of the core fragment from the resource allocator sets the maximum number of active RNAPs in the synthetic system. This budget has to be shared between σ fragments that are expressed simultaneously (Fig1C). To test this, we built a plasmid where the K1FR σ fragment is expressed from PTet and the T3 σ fragment is expressed from PTac (Fig4A). By inducing the system with IPTG, the level of expression of the T3 σ fragment is varied while the K1FR σ fragment is maintained at a constant level (PTet is uninduced but has leaky expression). In essence, this captures the scenario where one output of a controller is constantly on at a saturating level and then another output turns on and competes for the RNAP resource. To report how much of each type of polymerase complex is present in the system, reporter plasmids that express GFP from PT3 and PKIF were used. The activity of the σT3:PT3 and σK1FR:PK1F pairs are very similar (Fig3D), making it possible to compare their expression levels.
Figure 4. Competition between σ fragments to bind the core fragment.
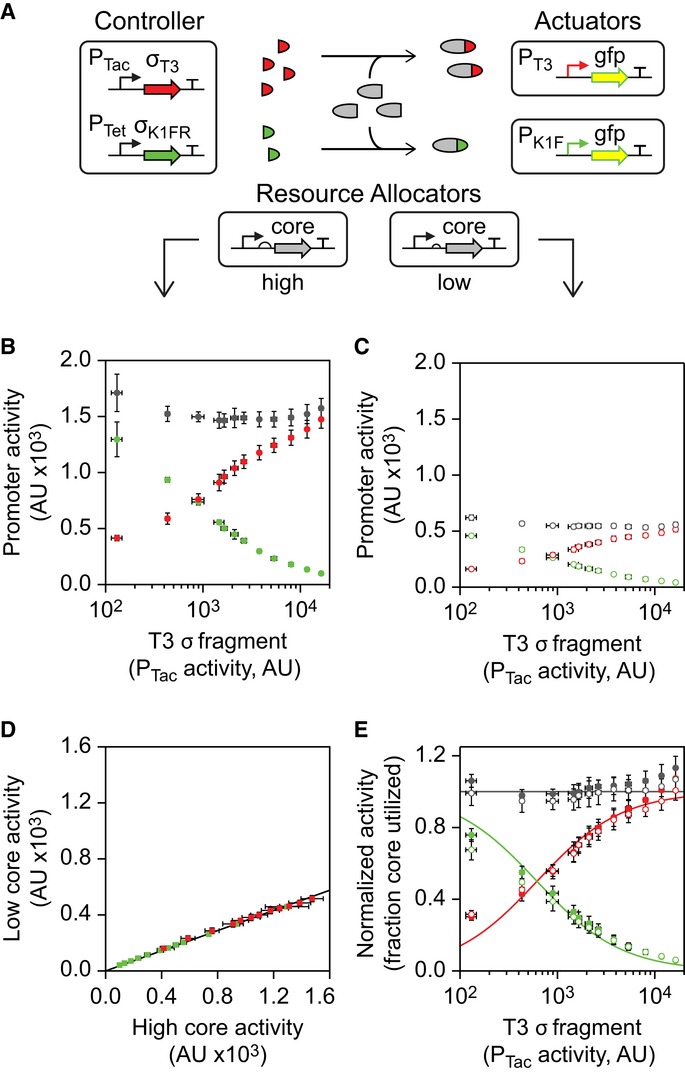
- The genetic system used for the competition assays is shown. Two resource allocator plasmids were built that generate high and low core fragment expression levels via a strong or weak RBS and constitutive promoter.
- Data for the high resource allocator are shown. The K1FR σ fragment was expressed at a constant level (no induction of PTet), and the T3 σ fragment was induced with 0, 2, 4, 6.3, 7.4, 8.6, 10, 13, 16, 20, 25, and 32 μM IPTG. The activities of PT3 (red circles) and PK1F (green circles) were measured, and the sum of their activities computed (gray circles).
- Data for the low resource allocator are shown, as in (B).
- Each point represents promoter activity (red: PT3, green: PK1F) at a specific level of inducer. The x and y values show the activity with high and low levels of core fragment expression, respectively. The line shows a linear regression, with the intercept fixed to 0.
- Each σ fragment was expressed to saturation (100 μM IPTG) with the high and low resource allocators, and the measured promoter activities were used to normalize the data shown in (B) and (C) (solid and hollow circles, respectively). The ‘fraction core utilized’ represents the proportion of the core fragment present in the system that is bound by either σ fragment, assuming a linear correlation with promoter activity. The solid lines show a simplified model of competition fit to the normalized data.
Data information: For all graphs, the mean is shown for three independent assays performed on different days, with error bars showing standard deviation.Source data are available online for this figure.
Core fragment expression was driven by the PJ23105 promoter with RBSs of different strengths. Initially, a strong RBS was chosen that sets a high expression level of the core fragment (Fig4B). The K1FR σ fragment utilizes the majority of the core fragment budget before the T3 σ fragment is induced. As the T3 σ fragment is induced, it competes for the core fragment. At high concentrations, it saturates the pool of core fragment, almost completely titrating it from binding to the K1FR σ fragment. The sum of the PK1F and PT3 promoter activities (gray points) remains constant and is independent of the expression of either σ fragment. The competition experiment was repeated with the core fragment expressed at a lower level from a weaker RBS (Fig4C). Importantly, the expression level of the K1F σ fragment and the induction of the T3 σ fragment remain unchanged. As before, the sum of activities from the PT3 and PK1F promoters remains constant. Both of these competition systems are tolerated by cells with little growth impact at the induction levels used (Supplementary Fig S11).
The shapes of the curves are essentially identical when compared for high and low concentrations of the core fragment. The similarity is shown by plotting the PT3 and PK1F promoter activities with low core fragment expression against their activities with high core fragment expression (Fig4D). This results in a linear relationship, meaning that all promoter activities scale equally with the amount of core fragment expressed. The slope of this line indicates that the low level of core fragment yields approximately 36% of the activity compared to the high level. Hence, the budget is shared identically between the σ fragments at each core fragment expression level. This property means that the proportional outputs of the resource allocator can be set independently from the level of resource being produced.
To correct for the slight activity difference between the T3 and K1FR systems, we normalized the PT3 and PK1F activity values by the activity when each individual σ fragment is expressed to saturation with the appropriate resource allocator (Fig4E). Assuming that promoter activity is linearly proportional to the number of active polymerases, these normalized values represent the proportion of the available core fragment bound by each of the σ fragments. A mathematical model of the system was built and its dynamics analyzed (Supplementary Information Section IV.B.). When the core fragment is fully saturated by σ fragments, the model predicts that the proportion of the core fragment bound by each σ fragment should depend solely on the relative expression levels of each σ fragment. The simplified model has only one parameter not measured in the normalized data set: the relative expression of the K1FR σ fragment (Supplementary Information Section IV.C, Equations 29-30). Fitting this parameter yields a good agreement between the theory and experimental data (Fig4E, Supplementary Equations 31, 32, 33).
Positive and negative regulation of the core fragment
The resource allocators shown in Figs3 and 4 maintain a constant level of core fragment. It is desirable to be able to dynamically shift the budget up or down, for example, to control the maximum transcriptional capacity as a function of media or growth phase. To do this, we used additional splits and mutations to create positive and negative regulators. These regulators could also be used to design feedback or feedforward circuits to implement control algorithms that act on the signal from the controller plasmid to the actuators.
The negative regulator is based on a ‘null’ σ fragment that binds to the core fragment but does not support transcription. This functions to sequester the core fragment in the same way as an active σ fragment, making less of it available to the other competing σ fragments. Sequestration has emerged as a generalizable method to tune the threshold and ultrasensitivity of genetic circuits by setting a concentration of sequestering molecule that must be outcompeted before the circuit turns on (Buchler & Louis, 2008; Buchler & Cross, 2009; Chen & Arkin, 2012; Rhodius et al, 2013). The null fragment was identified by testing amino acid substitutions and deletions identified from the literature to disrupt T7 RNAP function (Bonner et al, 1992; Mookhtiar et al, 1991). These mutations were selected to disrupt transcription activity without impacting the ability of the σ fragment to bind and sequester the core fragment (Supplementary Table S4). Based on the screen, we identified the Y638A mutation in the CGG σ fragment as having the strongest effect when sequestering the core fragment. This fragment was confirmed to carry no residual activity for its original promoter (Supplementary Fig S6).
A system was constructed to test the ability of the null fragment to titrate the core fragment and reduce its availability to the σ fragments (Fig5A). For this, the σ fragments were expressed using a constitutive promoter derived from PJ23119 and the null fragment was placed under PTac IPTG-inducible control on a separate plasmid. When expressed with the T7 σ fragment, the null fragment decreases the activity from PT7 as it is induced (Fig5B). The null fragment is able to compete with all of the σ fragments and reduces each of their activities by at least tenfold when fully induced (Fig5C).
Figure 5. Positive and negative post-transcriptional regulation of the core fragment.
- Null fragment sequestration of the core fragment.
- The core fragment and T7 σ fragment are expressed constitutively, while null fragment expression is induced from PTac (induction from left to right is: 0, 2, 4, 10, 16, 25, 40, and 1000 μM IPTG). The effect of the expression of the null fragment on PT7 activity is shown as black circles. The activity of PT7 under the same conditions lacking the inducible null fragment cassette is shown as white circles.
- The null fragment is shown in competition with each of the four σ fragments. Data are shown when the null fragment is uninduced (−, 0 μM IPTG) and induced (+, 1000 μM IPTG).
- Activation of the β core fragment through the expression of the α fragment.
- The impact of expressing the α fragment from the PTac promoter is shown. The black and white circles show induction in the presence and absence of the α fragment cassette, respectively (from left to right: 0, 2, 4, 10, 16, 25, and 40 μM IPTG). The high level for uninduced is due to leaky expression from PTac.
- The ability of α fragment : RFP fusions to complement the β core fragment (with the T7 σ fragment) is shown. From left to right: (−), no inducible cassette; RFP, expression of unmodified RFP; α, expression of free α fragment; RFP-α, expression of a C-terminal fusion of α fragment to RFP; α-RFP, expression of an N-terminal fusion. Each system was induced with 40 μM IPTG.
- A genetic system is shown that uses α fragment expression from a constitutive promoter to compensate for the effects of differences in copy number. A strong constitutive promoter and RBS controlling α expression (red arrow) are selected at low copy (pSC101), while a weaker promoter and RBS are used at high copy (pUC).
- Data are shown for a pair of pSC101 and pUC plasmids carrying tuned α fragment cassettes and a PT7 promoter driving GFP. ‘β core’ indicates that the β core fragment and T7 σ fragment are co-expressed. ‘core’ indicates that the core fragment and T7 σ fragment are co-expressed.
Data information: For all graphs, the mean is shown for three independent assays performed on different days, with error bars showing standard deviation.
The positive regulator is based on further splitting the core fragment at the most N-terminal split site (Fig2B and D). This divides the core fragment into two pieces: a short 67 amino acid ‘α fragment’ and a larger 586 amino acid ‘β core fragment’ (including the SynZIP). The α fragment can be expressed separately and is required for activity. It can be used to modulate the fraction of the polymerase pool that is active. Note that it still does not enable more transcriptional activity than is set by the amount of β core fragment that is expressed. Thus, the maximum can be set and then the α fragment used to modulate the amount that is available at any given time.
A system was constructed to assay the α fragment's ability to regulate the polymerase budget (Fig5D). The β core fragment is expressed from the PJ23105 constitutive promoter on a low copy plasmid, while the T7 σ fragment is expressed from a constitutive promoter derived from PJ23119 on a high copy plasmid. The α fragment is expressed from PTac. There is no T7 RNAP activity without the α fragment and activity increases as it is induced (Fig5E).
Coupling RNAP activity to the concentration of arbitrary α fragment tagged proteins
Since the α fragment is relatively small (67 aa) and required for polymerase function, we hypothesized that it would be useful as a protein tag to activate transcription proportional to the level of an arbitrary protein of interest. While the C-terminus of T7 RNAP catalyzes transcription and is highly sensitive to alteration, the N-terminus (where the α fragment is located) is much more tolerant to modifications (Dunn et al, 1988). The α fragment was fused to proteins of interest via a GGSGG flexible linker. Fusion to either the N- and C-terminus of RFP or GFP makes polymerase activity responsive to the level of fluorescent protein expression (Fig5F and Supplementary Fig S7). This may be used to tag proteins in a synthetic system or the host, enabling the readout of an internal or cell state.
Application of the α fragment to compensate for differences in copy number
A challenge in building genetic systems is that regulatory parts will change their activity depending on the copy number of the system. For example, a constitutive promoter will produce a high level of expression when it is placed on a high copy plasmid and a low level of activity with placed at single copy on a bacterial artificial chromosome (Kittleson et al, 2011). The α fragment could be used to regulate the activity of the polymerase to adjust the activity of promoters and compensate for the copy number at which they are carried due to different plasmid origins (or in the genome). The idea is to combine the phage promoter(s) with an expression cassette including the α fragment that is expressed at a level inversely proportional to the copy number (Fig5G). In other words, a strong promoter and RBS would be selected to drive the expression of the α fragment from a low copy plasmid and vice versa.
Plasmids were constructed on pSC101 and pUC backbones that contain a PT7 promoter driving GFP expression and a α fragment expression cassette. We mutagenized the RBSs and altered the promoters and start codon of the α fragment expression cassettes to identify a strong cassette that would be carried on the pSC101 plasmid and weak cassette that would be carried on the pUC plasmid (Materials and Methods). With these different levels of α fragment expression, we were able to achieve nearly identical activities for PT7 in the different plasmid contexts when they are used with the β core fragment (Fig5H). In contrast, when the plasmids are used with the full core fragment, which does not need the α fragment to function, high expression is seen from the high copy pUC backbone and low expression is seen from the low copy pSC101 backbone.
One of the values of this approach is that it enables actuators that require multiple phage promoters to be moved to different copy number contexts without having to change and rebalance each of the promoters. For example, actuators that produce deoxychromoviridans, nitrogenase, and lycopene require 2, 4, and 5 phage promoters (Temme et al, 2012a,b). These could be moved to different copy number backbones without changing their genetics by changing the expression level of the α fragment from that backbone. One can also imagine harnessing feedback or feedforward loops that self-adjust the level of α fragment to maintain constant promoter activity independent of context, similar to systems that have been implemented in mammalian cells (Bleris et al, 2011).
Discussion
As a means to organize and control large genetic engineering projects, we propose to introduce a separate resource allocator module. The allocator is responsible for providing resources that are orthogonal to those required by the host for growth and maintenance. To that end, this manuscript focuses on budgeting transcriptional resources through the control of phage polymerase activity and promoter specificity. Thinking ahead, this approach can be extended to budget additional resources. For example, translational resources could be incorporated by controlling a orthogonal rRNA (Rackham & Chin, 2005; An & Chin, 2009) (specific to RBSs only in the synthetic system) or even introducing an entire second ribosome. Extending this idea, it may be possible to incorporate orthogonal tRNAs (Liu et al, 1997; Chin, 2014), DNA replication machinery (Ravikumar et al, 2014), protein degradation machinery (Grilly et al, 2007), carbon precursors (Pfeifer et al, 2001), and organelle structures (Moon et al, 2010; Bonacci et al, 2012). While this never completely decouples the synthetic system from the host, it systematically reduces its dependence on host resources and genetic idiosyncrasies. This approaches the concept of a ‘virtual machine’ for cells, where synthetic systems would bring all of the necessary cellular machinery with them. This concept will become critical as designs become larger, moving toward the scale of genomes and requiring the simultaneous control over many multi-gene actuators.
This work demonstrates an incredible tolerance of the T7 RNAP structure for division into multiple proteins without disrupting its function. To our knowledge, this is the first time that a protein has been artificially divided into four fragments that can be functionally co-expressed. This tolerance is surprising because T7 RNAP is known to undergo large-scale conformational changes as it proceeds from promoter binding to transcription elongation (Ma et al, 2002; Guo et al, 2005). The residues involved in these conformational changes occur toward the N-terminal region but are distributed across the first three fragments of the 4-fragment polymerase (Fig2E). All of the RNAP split points were discovered simultaneously using a new experimental method, which we refer to as a ‘splitposon’. This approach is faster, simpler, and produces more accurate split proteins than previous methods. Split proteins have applications in genetic circuits (Shis & Bennett, 2013; Mahdavi et al, 2013), plasmid maintenance with fewer antibiotics (Schmidt et al, 2012), and biosensors (Johnsson & Varshavsky, 1994; Galarneau et al, 2002; Hu & Kerppola, 2003; Michnick et al, 2007; Camacho-Soto et al, 2014).
The fragments of T7 RNAP are used to implement regulatory control. A C-terminal fragment contains the DNA-binding loop and we demonstrate that fragments with different specificities can direct the RNAP to different promoters. For this reason, and because of its size, we draw a loose analogy to the role of σ factors in native prokaryotic transcription. However, there are notable differences between our σ fragments compared to natural σ factors. First, core E. coli RNAP binds to DNA in a non-specific manner and this is titrated away by the σ factors (Grigorova et al, 2006; Bratton et al, 2011). It is unlikely that our T7 RNAP core fragment binds to DNA. Second, a prokaryotic σ factor only recruits the RNAP to the promoter and once transcription initiation is complete, the σ factor dissociates during transcription (Travers & Burgess, 1969; Raffaelle et al, 2005). Thus, the ratio of σ factors to core RNAP is low (∼50%) because they only have to compete to bind to free (non-transcribing) polymerase (Ishihama, 2000). Our system requires larger ratios, because the σ fragments must remain associated with the core fragment during transcription. Third, while the size of a σ factor and the σ fragment are about the same, their 3-dimensional structure and mechanism of binding to core and DNA are different (Vassylyev et al, 2002). Finally, recent results suggest that the B. subtilis core RNAP is shared by σ factors in time as opposed to concentration (Levine et al, 2013). In other words, the σ factors pulse in a mutually exclusive manner to take turns fully utilizing the pool of core RNAP. In contrast, our σ fragments compete for the core fragment following mass action kinetics. This is similar to the previous understanding, where differences in σ factor binding affinities are a means that cells prioritize and order different responses (Lord et al, 1999; Maeda et al, 2000; Grigorova et al, 2006).
Resource allocation also occurs in natural regulatory networks. In bacteria, alternative σ factors can redirect RNAP to different condition-specific promoters. Factors such as ppGpp and 6S RNA also regulate the pool of active free RNAP (Jensen & Pedersen, 1990; Wassarman & Storz, 2000; Klumpp & Hwa, 2008). Using up this resource has been observed and shown to result in a slower growth rate (Farewell et al, 1998). Further, the competition between σ factors for core RNAP has been quantified (De Vos et al, 2011; Grigorova et al, 2006). Keren and co-workers measured the activity of thousands of native E. coli and S. cerevisiae promoters under different environmental conditions (Keren et al, 2013). They found that while changes in conditions have a global impact on many promoters, they shift by a linear factor that is characteristic of each condition. This factor ranges from 0.51 to 1.68 with M9 + glucose being the reference condition. They found that a simple model that treats overall promoter activity as a fixed resource explains their data. Overall promoter activity is equivalent to the total active RNAP concentration that forms the backbone of our resource allocator and the ratio of 0.36 shown in Fig4D is analogous to their linear factor when moving from the high to the low resource allocator.
In the context of synthetic signaling networks, retroactivity occurs when downstream regulation impacts an upstream process. For example, the titration of ribosomes or proteases by one branch of the network can influence the network as a whole (Cookson et al, 2011). This is viewed as an undesirable effect that must be buffered against in order to maintain computational integrity (Del Vecchio & Murray, 2014). In contrast, the resource allocator harnesses retroactivity in order to budget transcription to different pathways without surpassing a limit. As an allocation mechanism, retroactivity is an ideal means of distributing a budgeted resource. Currently, this is limited to dividing the core fragment among the σ fragments in a way that is proportional to their expression levels. Building on this, more complex dynamics could be introduced that implement signal processing between the output of the controller plasmid and the actuators that are being regulated. For instance, it may be desirable to control several actuators via a mutually exclusive or analog relationship, for example to slow down a metabolic pathway as a molecular machine is being built. Other actuators may require graded or ultrasensitive responses, for example the all-or-none commitment to flagellum construction versus simply changing the level of an enzyme. The toolbox presented in this paper provides a means to rationally design such control that can be implemented on the signal from the output of circuitry encoded on a controller to the actuators.
Materials and Methods
Strains and media
Escherichia coli DH10B was used for all routine cloning and characterization. ElectroMAX competent cells (Life Technologies) were used for library cloning steps as noted. LB-Miller media was used for assays and strain propagation, 2YT media was used for strain propagation, and SOC media was used for transformation recovery. Antibiotics were used as necessary for plasmid maintenance, with ampicillin at 100 μg/ml, spectinomycin at 100 μg/ml, kanamycin at 50 μg/ml, and chloramphenicol at 17 μg/ml. IPTG (isopropyl β-D-1-thiogalactopyranoside) was used as an inducer at concentrations up to 1 mM.
Plasmids and parts
Plasmids with the ColE1 origin were based off of the plasmid pSB1C3 from the Registry of Standard Biological Parts, which has a pUC19 (Yanisch-Perron et al, 1985) derived origin. Plasmids with the pUC origin were based off of a pUC19 (Yanisch-Perron et al, 1985) vector. Plasmids with the p15A* origin were based off of plasmid pSB3C5 (Shetty et al, 2008) from the Registry. This origin appears to maintain at a higher copy number than standard for p15A. Plasmids with the pSC101 origin were based on pUA66 (Zaslaver et al, 2006). Plasmids with the BAC origin were based on pBACr-Mgr940 (Anderson et al, 2007) (BBa_J61039), which has an F plasmid derived origin. A PTac promoter system derived from pEXT20 (Dykxhoorn et al, 1996) modified to contain a symmetric LacI binding site or a shortened version of this expression system was used in all systems that required inducible expression. Constitutive protein expression was driven by promoter PJ23105 (BBa_J23105) or PJ23109 (BBa_J23109), by a modified PTet expression system (Moon et al, 2012) (uninduced), and by promoters selected from libraries derived from PJ23119 (BBa_J23119) through degenerate PCR. RBSs were either generated using the RBS calculator, taken from the Registry (BBa_B0032 and BBa_B0034 (Elowitz & Leibler, 2000)), or selected from libraries generated using degenerate PCR. The RiboJ insulator (Lou et al, 2012) was used between PTac or PTet and the RBS in all constructs when titrations curves were run. mRFP1 (Campbell et al, 2002) and sfGFP (Pédelacq et al, 2006) were used as fluorescent reporters. Representative plasmid maps are shown in Supplementary Figs S2, S9, and S13 through S19. A list of new plasmids is given in Supplementary Table S6. Select constructs from this study will be made available online through Addgene (http://www.addgene.org/Christopher_Voigt/).
Bisection mapping T7 RNA polymerase
The splitposon was generated by modifying the HyperMu <KAN-1> transposon (Epicentre Biotechnologies). Examining previously described variants of the MuA transposon system (Goldhaber-Gordon et al, 2002; Poussu et al, 2004, 2005; Jones, 2006; Hoeller et al, 2008), a number of terminal bases were identified that could be altered while maintaining transposition activity. The RBS calculator (Salis, 2011) was used to design a strong terminal RBS and start codon while staying within these alterations. This modified end was combined with a previously built end containing terminal stop codons (Poussu et al, 2005). A PTac promoter and constitutive LacI expression cassette were inserted into the transposon to drive transcription at the end with the RBS and start codon. Finally, point mutations were made to remove restriction sites that would interfere with downstream cloning steps. A region of the T7* RNA polymerase CDS encoding aa 41–876 was flanked by BsaI sites in a ColE1 AmpR backbone. The splitposon (KanR) was transposed into this plasmid with MuA transposase (300 ng target DNA, 200 ng transposon, MuA buffer, 1.1 U HyperMuA transposase (Epicentre Biotechnologies), 30°C 8 h, 75°C 10 min), DNA clean and concentrated (Zymo), electroporated into ElectroMAX cells and plated on LB + Kan/Amp plates to obtain > 700,000 colonies. The colonies were scraped from the plates, pooled, and miniprepped to obtain DNA of the transposon insertion library. The transposon insertion library was digested with BsaI, run on an agarose gel, and a band of ∼5.7 kb (representing the section of the T7 CDS plus transposon) was excised, gel-purified (Zymo), and DNA clean and concentrated. A plasmid containing an inducible PTac system and the remainder of the T7 CDS (aa 1–40 and 877–883) with internal BsaI sites on a p15A* SpecR backbone was digested with BsaI and the size-selected fragment ligated into it. This reaction was DNA clean and concentrated, electroporated into ElectroMAX cells plated on LB + Spec/Kan plates to obtain > 600,000 colonies, and the colonies were scraped, pooled, and miniprepped as before to obtain the bisected library. This library was electroporated into E. coli DH10B cells with a plasmid containing a PT7-RFP cassette on a pSC101 CamR backbone (Nif_489 (Temme et al, 2012a)), plated on LB + Spec/Kan/Cam, and visually red colonies were picked after 16 h of growth for analysis in liquid media. More information on the splitposon method and T7 RNAP bisection mapping are included in Supplementary Information Sections I and II.
Assay protocol
All promoter activity assays except the initial assay of T7 bisection mapping were performed as follows. Cells containing the plasmids of interest were inoculated from glycerol stocks into 0.5 ml LB-Miller media plus antibiotics in a 2-ml 96-deepwell plate (USA Scientific) sealed with an AeraSeal film (Excel Scientific) and grown at 37°C, 900 rpm overnight (∼14–16 h) in a deepwell shaker. These overnights were diluted 200-fold into 150 μl LB-M with antibiotics plus varying concentrations of IPTG in 300-μl 96-well V-bottom plates (Thermo Scientific Nunc) sealed with an AeraSeal film and grown at 37°C, 1,000 rpm for 6 h. 5 μl of each sample was removed and diluted in 195 μl PBS + 2 mg/ml kanamycin to halt protein production. Cells diluted in PBS were either characterized immediately with flow cytometry or stored at 4°C until characterization. The initial T7 bisection mapping assays were performed similarly except the overnight cultures were grown in 2YT, and the overnight cultures were diluted 1:10 into 150 μl induction media.
Flow cytometry characterization
All fluorescence characterization was performed on a BD LSR Fortessa flow cytometer with HTS attachment and analyzed using FlowJo vX (TreeStar). Cells diluted in PBS + kanamycin were run at a rate of 0.5 μl/s until up to 100,000 events were captured (at least 50,000 events were recorded in all cases). The events were gated by forward scatter and side scatter to reduce false events and by time to reduce carry-over events. Gating was determined by eye and was kept constant for all analysis within each triplicate experiment. For all assays except the initial characterization of T7 bisection mapping, the geometric mean value of fluorescence was calculated for each sample, using a biexponential transform with a width basis of −10.0 to allow calculations with negative values. Finally, white-cell fluorescence measured concurrently from cells lacking fluorescent protein was subtracted from measured fluorescence to yield the Promoter activity (AU) values presented in the figures. The initial T7 bisection mapping assay was characterized identically, except that white-cell values were not subtracted.
Where fold induction calculations were required, fluorescence measurements were made of cells containing the appropriate reporter construct and lacking a functional polymerase, grown in the same conditions as the test cells. The fold induction is reported as the ratio of the white-cell-corrected test cell fluorescence to the white-cell-corrected fluorescence of the reporter-only cells.
To obtain relative expression levels for the polymerase fragments driven by PTac, constructs were made that express GFP after PTac and RiboJ (Supplementary Fig S9). For each assay, cells with this construct were induced under the same conditions as the test cells, and their fluorescence measured (Supplementary Fig S8). The PTac activity value in each plot represents the geometric mean white-cell-corrected fluorescence of these cells for that assay, and the horizontal error bars show the standard deviation of those measurements.
Measuring the growth impact of split polymerase expression
Cells containing the plasmids of interest were inoculated from colonies on agar plates into 0.5 ml LB-Miller media plus antibiotics in a 2-ml 96-deepwell plate, sealed with an AeraSeal film, and grown at 37°C, 900 rpm overnight (∼14–16 h) in a deepwell shaker. These overnights were diluted 200-fold into 150 μl LB-M with antibiotics plus varying concentrations of IPTG in 300-μl 96-well V-bottom plates, sealed with an AeraSeal film, and grown at 37°C, 1,000 rpm for 6 h. 20 μl of each sample were added to 80 μl LB in a 96-well optical plate (Thermo Scientific Nunc), and the OD600 of each diluted sample was measured using a BioTek Synergy H1 plate reader. These measurements were normalized by dividing by the OD600 of samples containing plasmids with the same backbones but expressing none of the proteins of interest (polymerase fragments or GFP) at each level of IPTG induction. Growth data are shown in Supplementary Figs S10, S11 and S12.
Error-prone PCR of σ fragment variants
Sections of the K1F and N4 T7 RNAP variants (Temme et al, 2012a) were amplified using GoTaq (Promega) in 1× GoTaq buffer plus MgCl2 to a final concentration of 6.5 mM Mg2+. The amplified fragments were cloned into a σ fragment expression plasmid including any necessary flanking RNAP sequence and the N-terminal SynZIP 18 domain. These mutated σ fragments were expressed with the core fragment and the appropriate promoter driving GFP. Colonies with visually improved GFP production were picked from plates, re-assayed to confirm activity, and sequenced to identify their mutations (Supplementary Tables S2 and S3). Promising variants were reconstructed to isolate their effects and the resulting new σ fragments assayed for activity.
Tuning α fragment expression to compensate for copy number
An α fragment expression cassette consisting of the constitutive promoter PJ23105, RiboJ, and B0032 RBS driving the α fragment was inserted in the reverse direction before the PT7: GFP cassette on a pSC101 reporter plasmid. These two cassettes were also inserted into a pUC19 backbone, with the weaker constitutive promoter PJ23109 and start codon (GTG instead of ATG) in the α fragment cassette. Degenerate PCR was used to randomize the RBS in each plasmid at five nucleotides, and the resulting libraries were screened for fluorescence in the presence of the σT7 and either core or β core fragments. Sets of pSC101 and pUC plasmids were selected that had similar levels of activity with the β core fragment, but retained different levels of activity with the core fragment. These plasmids were isolated, sequenced, re-assayed, and the pair of pSC101 and pUC plasmids with the closest levels of expression in the presence of the β core fragment was selected.
Acknowledgments
This work was supported by the United States Office of Naval Research (N00014-13-1-0074), the United States National Institutes of Health (5R01GM095765), and the US National Science Foundation Synthetic Biology Engineering Research Center (SA5284-11210). THSS was supported by the National Defense Science & Engineering Graduate Fellowship (NDSEG) Program and by a Fannie and John Hertz Foundation Fellowship.
Author contributions
THSS and CAV conceived of the study. THSS carried out experiments. AJM and ADE developed the CCG T7 RNAP variant. THSS and EDS modeled and analyzed the system. THSS and CAV wrote the manuscript with input and contributions from all of the authors.
Conflict of interest
A patent application has been filed on some aspects of this work, with THSS and CAV as inventors.
Supporting Information
Supplementary information for this article is available online: http://msb.embopress.org
Supplementary Figures and Tables
Review Process File
Source Data for Figure 2B
Source Data for Figure 3E
Source Data for Figure 4
References
- Alexander WA, Moss B, Fuerst TR. Regulated expression of foreign genes in vaccinia virus under the control of bacteriophage T7 RNA polymerase and the Escherichia coli lac repressor. J Virol. 1992;66:2934–2942. doi: 10.1128/jvi.66.5.2934-2942.1992. [DOI] [PMC free article] [PubMed] [Google Scholar]
- An W, Chin JW. Synthesis of orthogonal transcription-translation networks. Proc Natl Acad Sci. 2009;106:8477–8482. doi: 10.1073/pnas.0900267106. [DOI] [PMC free article] [PubMed] [Google Scholar]
- Anderson JC, Voigt CA, Arkin AP. Environmental signal integration by a modular AND gate. Mol Syst Biol. 2007;3:133. doi: 10.1038/msb4100173. [DOI] [PMC free article] [PubMed] [Google Scholar]
- Arkin AP, Fletcher DA. Fast, cheap and somewhat in control. Genome Biol. 2006;7:114. doi: 10.1186/gb-2006-7-8-114. [DOI] [PMC free article] [PubMed] [Google Scholar]
- Bedwell DM, Nomura M. Feedback regulation of RNA polymerase subunit synthesis after the conditional overproduction of RNA polymerase in Escherichia coli. Mol Gen Genet. 1986;204:17–23. doi: 10.1007/BF00330181. [DOI] [PubMed] [Google Scholar]
- Birnbaum S, Bailey JE. Plasmid presence changes the relative levels of many host cell proteins and ribosome components in recombinant Escherichia coli. Biotechnol Bioeng. 1991;37:736–745. doi: 10.1002/bit.260370808. [DOI] [PubMed] [Google Scholar]
- Bleris L, Xie Z, Glass D, Adadey A, Sontag E, Benenson Y. Synthetic incoherent feedforward circuits show adaptation to the amount of their genetic template. Mol Syst Biol. 2011;7:519. doi: 10.1038/msb.2011.49. [DOI] [PMC free article] [PubMed] [Google Scholar]
- Bonacci W, Teng PK, Afonso B, Niederholtmeyer H, Grob P, Silver PA, Savage DF. Modularity of a carbon-fixing protein organelle. Proc Natl Acad Sci. 2012;109:478–483. doi: 10.1073/pnas.1108557109. [DOI] [PMC free article] [PubMed] [Google Scholar]
- Bonner G, Patra D, Lafer EM, Sousa R. Mutations in T7 RNA polymerase that support the proposal for a common polymerase active site structure. EMBO J. 1992;11:3767–3775. doi: 10.1002/j.1460-2075.1992.tb05462.x. [DOI] [PMC free article] [PubMed] [Google Scholar]
- Bratton BP, Mooney RA, Weisshaar JC. Spatial distribution and diffusive motion of RNA polymerase in live Escherichia coli. J Bacteriol. 2011;193:5138–5146. doi: 10.1128/JB.00198-11. [DOI] [PMC free article] [PubMed] [Google Scholar]
- Bremer H, Dennis PP. Modulation of chemical composition and other parameters of the cell by growth rate. In: Neidhardt FC, Curtis R III, Ingraham JL, Lin ECC, Low KB, Magasanik B, Reznikoff WS, Riley M, Schaechter M, Umbarger HE, editors. Escherichia coli and Salmonella: cellular and molecular biology. 2nd edn. Washington, DC: ASM Press; 1996. pp. 1553–1569. [Google Scholar]
- Bremer H, Dennis P. Feedback control of ribosome function in Escherichia coli. Biochimie. 2008;90:493–499. doi: 10.1016/j.biochi.2007.10.008. [DOI] [PubMed] [Google Scholar]
- Brunschwig E, Darzins A. A two-component T7 system for the overexpression of genes in Pseudomonas aeruginosa. Gene. 1992;111:35–41. doi: 10.1016/0378-1119(92)90600-t. [DOI] [PubMed] [Google Scholar]
- Buchler NE, Louis M. Molecular titration and ultrasensitivity in regulatory networks. J Mol Biol. 2008;384:1106–1119. doi: 10.1016/j.jmb.2008.09.079. [DOI] [PubMed] [Google Scholar]
- Buchler NE, Cross FR. Protein sequestration generates a flexible ultrasensitive response in a genetic network. Mol Syst Biol. 2009;5:272. doi: 10.1038/msb.2009.30. [DOI] [PMC free article] [PubMed] [Google Scholar]
- Burton Z, Burgess RR, Lin J, Moore D, Holder S, Gross CA. The nucleotide sequence of the cloned rpoD gene for the RNA polymerase sigma subunit from E. coli K12. Nucleic Acids Res. 1981;9:2889–2903. doi: 10.1093/nar/9.12.2889. [DOI] [PMC free article] [PubMed] [Google Scholar]
- Camacho-Soto K, Castillo-Montoya J, Tye B, Ghosh I. Ligand-gated split-kinases. J Am Chem Soc. 2014;136:3995–4002. doi: 10.1021/ja4130803. [DOI] [PubMed] [Google Scholar]
- Campbell RE, Tour O, Palmer AE, Steinbach PA, Baird GS, Zacharias DA, Tsien RY. A monomeric red fluorescent protein. Proc Natl Acad Sci. 2002;99:7877–7882. doi: 10.1073/pnas.082243699. [DOI] [PMC free article] [PubMed] [Google Scholar]
- Carlson JC, Badran AH, Guggiana-Nilo DA, Liu DR. Negative selection and stringency modulation in phage-assisted continuous evolution. Nat Chem Biol. 2014;10:216–222. doi: 10.1038/nchembio.1453. [DOI] [PMC free article] [PubMed] [Google Scholar]
- Carrera J, Rodrigo G, Singh V, Kirov B, Jaramillo A. Empirical model and in vivo characterization of the bacterial response to synthetic gene expression show that ribosome allocation limits growth rate. Biotechnol J. 2011;6:773–783. doi: 10.1002/biot.201100084. [DOI] [PubMed] [Google Scholar]
- Chamberlin M, Mcgrath J, Waskell L. New RNA Polymerase from Escherichia coli infected with Bacteriophage T7. Nature. 1970;228:227–231. doi: 10.1038/228227a0. [DOI] [PubMed] [Google Scholar]
- Cheetham GM, Jeruzalmi D, Steitz TA. Structural basis for initiation of transcription from an RNA polymerase-promoter complex. Nature. 1999;399:80–83. doi: 10.1038/19999. [DOI] [PubMed] [Google Scholar]
- Cheetham GM, Steitz TA. Structure of a transcribing T7 RNA polymerase initiation complex. Science. 1999;286:2305–2309. doi: 10.1126/science.286.5448.2305. [DOI] [PubMed] [Google Scholar]
- Chen Y, Li S, Chen T, Hua H, Lin Z. Random dissection to select for protein split sites and its application in protein fragment complementation. Protein Sci. 2009;18:399–409. doi: 10.1002/pro.42. [DOI] [PMC free article] [PubMed] [Google Scholar]
- Chen D, Arkin AP. Sequestration-based bistability enables tuning of the switching boundaries and design of a latch. Mol Syst Biol. 2012;8:620. doi: 10.1038/msb.2012.52. [DOI] [PMC free article] [PubMed] [Google Scholar]
- Chin JW. Expanding and reprogramming the genetic code of cells and animals. Annu Rev Biochem. 2014;83:379–408. doi: 10.1146/annurev-biochem-060713-035737. [DOI] [PubMed] [Google Scholar]
- Conrad B, Savchenko RS, Breves R, Hofemeister J. A T7 promoter-specific, inducible protein expression system for Bacillus subtilis. Mol Gen Genet. 1996;250:230–236. doi: 10.1007/BF02174183. [DOI] [PubMed] [Google Scholar]
- Cookson NA, Mather WH, Danino T, Mondragón-Palomino O, Williams RJ, Tsimring LS, Hasty J. Queueing up for enzymatic processing: correlated signaling through coupled degradation. Mol Syst Biol. 2011;7:561. doi: 10.1038/msb.2011.94. [DOI] [PMC free article] [PubMed] [Google Scholar]
- De Vos D, Bruggeman FJ, Westerhoff HV, Bakker BM. How molecular competition influences fluxes in gene expression networks. PLoS ONE. 2011;6:e28494. doi: 10.1371/journal.pone.0028494. [DOI] [PMC free article] [PubMed] [Google Scholar]
- Del Vecchio D, Murray RM. Biomolecular Feedback Systems. Princeton, NJ: Princeton University Press; 2014. [Google Scholar]
- Del Vecchio D, Ninfa AJ, Sontag ED. Modular cell biology: retroactivity and insulation. Mol Syst Biol. 2008;4:161. doi: 10.1038/msb4100204. [DOI] [PMC free article] [PubMed] [Google Scholar]
- Dong H, Nilsson L, Kurland CG. Gratuitous overexpression of genes in Escherichia coli leads to growth inhibition and ribosome destruction. J Bacteriol. 1995;177:1497–1504. doi: 10.1128/jb.177.6.1497-1504.1995. [DOI] [PMC free article] [PubMed] [Google Scholar]
- Dunn JJ, Krippl B, Bernstein KE, Westphal H, Studier FW. Targeting bacteriophage T7 RNA polymerase to the mammalian cell nucleus. Gene. 1988;68:259–266. doi: 10.1016/0378-1119(88)90028-5. [DOI] [PubMed] [Google Scholar]
- Dykxhoorn DM, St. Pierre R, Linn T. A set of compatible tac promoter expression vectors. Gene. 1996;177:133–136. doi: 10.1016/0378-1119(96)00289-2. [DOI] [PubMed] [Google Scholar]
- Ellefson JW, Meyer AJ, Hughes RA, Cannon JR, Brodbelt JS, Ellington AD. Directed evolution of genetic parts and circuits by compartmentalized partnered replication. Nat Biotechnol. 2013;32:97–101. doi: 10.1038/nbt.2714. [DOI] [PubMed] [Google Scholar]
- Elowitz MB, Leibler S. A synthetic oscillatory network of transcriptional regulators. Nature. 2000;403:335–338. doi: 10.1038/35002125. [DOI] [PubMed] [Google Scholar]
- Elroy-Stein O, Moss B. Cytoplasmic expression system based on constitutive synthesis of bacteriophage T7 RNA polymerase in mammalian cells. Proc Natl Acad Sci. 1990;87:6743–6747. doi: 10.1073/pnas.87.17.6743. [DOI] [PMC free article] [PubMed] [Google Scholar]
- El-Samad H, Kurata H, Doyle JC, Gross CA, Khammash M. Surviving heat shock: control strategies for robustness and performance. Proc Natl Acad Sci USA. 2005;102:2736–2741. doi: 10.1073/pnas.0403510102. [DOI] [PMC free article] [PubMed] [Google Scholar]
- Farewell A, Kvint K, Nyström T. Negative regulation by RpoS: a case of sigma factor competition. Mol Microbiol. 1998;29:1039–1051. doi: 10.1046/j.1365-2958.1998.00990.x. [DOI] [PubMed] [Google Scholar]
- Fatica A, Tollervey D. Making ribosomes. Curr Opin Cell Biol. 2002;14:313–318. doi: 10.1016/s0955-0674(02)00336-8. [DOI] [PubMed] [Google Scholar]
- Galarneau A, Primeau M, Trudeau L-E, Michnick SW. β-Lactamase protein fragment complementation assays as in vivo and in vitro sensors of protein–protein interactions. Nat Biotechnol. 2002;20:619–622. doi: 10.1038/nbt0602-619. [DOI] [PubMed] [Google Scholar]
- Gardner TS, Cantor CR, Collins JJ. Construction of a genetic toggle switch in Escherichia coli. Nature. 2000;403:339–342. doi: 10.1038/35002131. [DOI] [PubMed] [Google Scholar]
- Gausing K. Regulation of ribosome production in Escherichia coli: synthesis and stability of ribosomal RNA and of ribosomal protein messenger RNA at different growth rates. J Mol Biol. 1977;115:335–354. doi: 10.1016/0022-2836(77)90158-9. [DOI] [PubMed] [Google Scholar]
- Goldhaber-Gordon I, Early MH, Gray MK, Baker TA. Sequence and positional requirements for DNA sites in a Mu transpososome. J Biol Chem. 2002;277:7703–7712. doi: 10.1074/jbc.M110342200. [DOI] [PubMed] [Google Scholar]
- Grigorova IL, Phleger NJ, Mutalik VK, Gross CA. Insights into transcriptional regulation and σ competition from an equilibrium model of RNA polymerase binding to DNA. Proc Natl Acad Sci. 2006;103:5332–5337. doi: 10.1073/pnas.0600828103. [DOI] [PMC free article] [PubMed] [Google Scholar]
- Grilly C, Stricker J, Pang WL, Bennett MR, Hasty J. A synthetic gene network for tuning protein degradation in Saccharomyces cerevisiae. Mol Syst Biol. 2007;3:127. doi: 10.1038/msb4100168. [DOI] [PMC free article] [PubMed] [Google Scholar]
- Gruber TM, Gross CA. Multiple sigma subunits and the partitioning of bacterial transcription space. Annu Rev Microbiol. 2003;57:441–466. doi: 10.1146/annurev.micro.57.030502.090913. [DOI] [PubMed] [Google Scholar]
- Guntas G, Ostermeier M. Creation of an allosteric enzyme by domain insertion. J Mol Biol. 2004;336:263–273. doi: 10.1016/j.jmb.2003.12.016. [DOI] [PubMed] [Google Scholar]
- Guo Q, Nayak D, Brieba LG, Sousa R. Major conformational changes during T7RNAP transcription initiation coincide with, and are required for, promoter release. J Mol Biol. 2005;353:256–270. doi: 10.1016/j.jmb.2005.08.016. [DOI] [PubMed] [Google Scholar]
- Hayward RS, Tittawella IP, Scaife JG. Evidence for specific control of RNA polymerase synthesis in Escherichia coli. Nat New Biol. 1973;243:6–9. [PubMed] [Google Scholar]
- Hengge-Aronis R. Signal transduction and regulatory mechanisms involved in control of the σS (RpoS) subunit of RNA polymerase. Microbiol Mol Biol Rev. 2002;66:373–395. doi: 10.1128/MMBR.66.3.373-395.2002. [DOI] [PMC free article] [PubMed] [Google Scholar]
- Hoffmann F, Rinas U. Stress induced by recombinant protein production in Escherichia coli. Adv Biochem Eng Biotechnol. 2004;89:73–92. doi: 10.1007/b93994. [DOI] [PubMed] [Google Scholar]
- Hu C-D, Kerppola TK. Simultaneous visualization of multiple protein interactions in living cells using multicolor fluorescence complementation analysis. Nat Biotechnol. 2003;21:539–545. doi: 10.1038/nbt816. [DOI] [PMC free article] [PubMed] [Google Scholar]
- Hoeller BM, Reiter B, Abad S, Graze I, Glieder A. Random tag insertions by Transposon Integration mediated Mutagenesis (TIM) J Microbiol Methods. 2008;75:251–257. doi: 10.1016/j.mimet.2008.06.017. [DOI] [PubMed] [Google Scholar]
- Ikeda RA, Richardson CC. Interactions of a proteolytically nicked RNA polymerase of bacteriophage T7 with its promoter. J Biol Chem. 1987a;262:3800–3808. [PubMed] [Google Scholar]
- Ikeda RA, Richardson CC. Enzymatic properties of a proteolytically nicked RNA polymerase of bacteriophage T7. J Biol Chem. 1987b;262:3790–3799. [PubMed] [Google Scholar]
- Iost I, Guillerez J, Dreyfus M. Bacteriophage T7 RNA polymerase travels far ahead of ribosomes in vivo. J Bacteriol. 1992;174:619–622. doi: 10.1128/jb.174.2.619-622.1992. [DOI] [PMC free article] [PubMed] [Google Scholar]
- Ishihama A, Taketo M, Saitoh T, Fukuda R. Control of formation of RNA polymerase in Escherichia coli. Fac Res. 1976;1970–1979:485–502. [Google Scholar]
- Ishihama A. Subunit of assembly of Escherichia coli RNA polymerase. Adv Biophys. 1981;14:1–35. [PubMed] [Google Scholar]
- Ishihama A. Functional modulation of Escherichia coli RNA polymerase. Annu Rev Microbiol. 2000;54:499–518. doi: 10.1146/annurev.micro.54.1.499. [DOI] [PubMed] [Google Scholar]
- Iwakura Y, Ishihama A. Biosynthesis of RNA polymerase in Escherichia coli. II. control of RNA polymerase synthesis during nutritional shift up and down. Mol Gen Genet. 1975;142:67–84. [PubMed] [Google Scholar]
- Jayanthi S, Nilgiriwala KS, Del Vecchio D. Retroactivity controls the temporal dynamics of gene transcription. ACS Synth Biol. 2013;2:431–441. doi: 10.1021/sb300098w. [DOI] [PubMed] [Google Scholar]
- Jensen KF, Pedersen S. Metabolic growth rate control in Escherichia coli may be a consequence of subsaturation of the macromolecular biosynthetic apparatus with substrates and catalytic components. Microbiol Rev. 1990;54:89–100. doi: 10.1128/mr.54.2.89-100.1990. [DOI] [PMC free article] [PubMed] [Google Scholar]
- Jiang P, Ventura AC, Sontag ED, Merajver SD, Ninfa AJ, Del Vecchio D. Load-Induced Modulation of Signal Transduction Networks. Sci Signal. 2011;4:ra67. doi: 10.1126/scisignal.2002152. [DOI] [PMC free article] [PubMed] [Google Scholar]
- Jishage M, Iwata A, Ueda S, Ishihama A. Regulation of RNA polymerase sigma subunit synthesis in Escherichia coli: intracellular levels of four species of sigma subunit under various growth conditions. J Bacteriol. 1996;178:5447–5451. doi: 10.1128/jb.178.18.5447-5451.1996. [DOI] [PMC free article] [PubMed] [Google Scholar]
- Johnsson N, Varshavsky A. Split ubiquitin as a sensor of protein interactions in vivo. Proc Natl Acad Sci. 1994;91:10340–10344. doi: 10.1073/pnas.91.22.10340. [DOI] [PMC free article] [PubMed] [Google Scholar]
- Jones D. 2006. European Patent: EP1838851 - Polypeptide mutagenesis method.
- Kanwar M, Wright RC, Date A, Tullman J, Ostermeier M. Protein switch engineering by domain insertion. Methods Enzymol. 2013;523:369–388. doi: 10.1016/B978-0-12-394292-0.00017-5. [DOI] [PMC free article] [PubMed] [Google Scholar]
- Keren L, Zackay O, Lotan-Pompan M, Barenholz U, Dekel E, Sasson V, Aidelberg G, Bren A, Zeevi D, Weinberger A, Alon U, Milo R, Segal E. Promoters maintain their relative activity levels under different growth conditions. Mol Syst Biol. 2013;9:701. doi: 10.1038/msb.2013.59. [DOI] [PMC free article] [PubMed] [Google Scholar]
- Klumpp S, Hwa T. Growth-rate-dependent partitioning of RNA polymerases in bacteria. Proc Natl Acad Sci USA. 2008;105:20245–20250. doi: 10.1073/pnas.0804953105. [DOI] [PMC free article] [PubMed] [Google Scholar]
- Klumpp S, Zhang Z, Hwa T. Growth rate-dependent global effects on gene expression in bacteria. Cell. 2009;139:1366–1375. doi: 10.1016/j.cell.2009.12.001. [DOI] [PMC free article] [PubMed] [Google Scholar]
- Kittleson JT, Cheung S, Anderson JC. Rapid optimization of gene dosage in E. coli using DIAL strains. J Biol Eng. 2011;5:10. doi: 10.1186/1754-1611-5-10. [DOI] [PMC free article] [PubMed] [Google Scholar]
- Kittleson JT, Wu GC, Anderson JC. Successes and failures in modular genetic engineering. Curr Opin Chem Biol. 2012;16:329–336. doi: 10.1016/j.cbpa.2012.06.009. [DOI] [PubMed] [Google Scholar]
- Kurata H, El-Samad H, Yi T-M, Khammash M, Doyle J. 2001. pp. 837–842. Feedback regulation of the heat shock response in E. coli. In Proceedings of the 40th IEEE Conference on Decision and Control, Vol. 1.
- Lange R, Hengge-Aronis R. The cellular concentration of the sigma S subunit of RNA polymerase in Escherichia coli is controlled at the levels of transcription, translation, and protein stability. Genes Dev. 1994;8:1600–1612. doi: 10.1101/gad.8.13.1600. [DOI] [PubMed] [Google Scholar]
- Lempiäinen H, Shore D. Growth control and ribosome biogenesis. Curr Opin Cell Biol. 2009;21:855–863. doi: 10.1016/j.ceb.2009.09.002. [DOI] [PubMed] [Google Scholar]
- Levine JH, Lin Y, Elowitz MB. Functional roles of pulsing in genetic circuits. Science. 2013;342:1193–1200. doi: 10.1126/science.1239999. [DOI] [PMC free article] [PubMed] [Google Scholar]
- Liang S-T, Bipatnath M, Xu Y-C, Chen S-L, Dennis P, Ehrenberg M, Bremer H. Activities of constitutive promoters in Escherichia coli. J Mol Biol. 1999;292:19–37. doi: 10.1006/jmbi.1999.3056. [DOI] [PubMed] [Google Scholar]
- Liang S-T, Xu Y-C, Dennis P, Bremer H. mRNA composition and control of bacterial gene expression. J Bacteriol. 2000;182:3037–3044. doi: 10.1128/jb.182.11.3037-3044.2000. [DOI] [PMC free article] [PubMed] [Google Scholar]
- Liu DR, Magliery TJ, Pastrnak M, Schultz PG. Engineering a tRNA and aminoacyl-tRNA synthetase for the site-specific incorporation of unnatural amino acids into proteins in vivo. Proc Natl Acad Sci. 1997;94:10092–10097. doi: 10.1073/pnas.94.19.10092. [DOI] [PMC free article] [PubMed] [Google Scholar]
- Lord M, Barillà D, Yudkin MD. Replacement of vegetative ςA by sporulation-specific ςF as a component of the RNA polymerase holoenzyme in sporulating bacillus subtilis. J Bacteriol. 1999;181:2346–2350. doi: 10.1128/jb.181.8.2346-2350.1999. [DOI] [PMC free article] [PubMed] [Google Scholar]
- Lou C, Stanton B, Chen Y-J, Munsky B, Voigt CA. Ribozyme-based insulator parts buffer synthetic circuits from genetic context. Nat Biotechnol. 2012;30:1137–1142. doi: 10.1038/nbt.2401. [DOI] [PMC free article] [PubMed] [Google Scholar]
- Ma K, Temiakov D, Jiang M, Anikin M, McAllister WT. Major conformational changes occur during the transition from an initiation complex to an elongation complex by T7 RNA polymerase. J Biol Chem. 2002;277:43206–43215. doi: 10.1074/jbc.M206658200. [DOI] [PubMed] [Google Scholar]
- Maeda H, Fujita N, Ishihama A. Competition among seven Escherichia coli σ subunits: relative binding affinities to the core RNA polymerase. Nucleic Acids Res. 2000;28:3497–3503. doi: 10.1093/nar/28.18.3497. [DOI] [PMC free article] [PubMed] [Google Scholar]
- Maharjan R, Nilsson S, Sung J, Haynes K, Beardmore RE, Hurst LD, Ferenci T, Gudelj I. The form of a trade-off determines the response to competition. Ecol Lett. 2013;16:1267–1276. doi: 10.1111/ele.12159. [DOI] [PubMed] [Google Scholar]
- Mahdavi A, Segall-Shapiro TH, Kou S, Jindal GA, Hoff KG, Liu S, Chitsaz M, Ismagilov RF, Silberg JJ, Tirrell DA. A genetically encoded and gate for cell-targeted metabolic labeling of proteins. J Am Chem Soc. 2013;135:2979–2982. doi: 10.1021/ja400448f. [DOI] [PMC free article] [PubMed] [Google Scholar]
- McBride KE, Schaaf DJ, Daley M, Stalker DM. Controlled expression of plastid transgenes in plants based on a nuclear DNA-encoded and plastid-targeted T7 RNA polymerase. Proc Natl Acad Sci. 1994;91:7301–7305. doi: 10.1073/pnas.91.15.7301. [DOI] [PMC free article] [PubMed] [Google Scholar]
- Michnick SW, Ear PH, Manderson EN, Remy I, Stefan E. Universal strategies in research and drug discovery based on protein-fragment complementation assays. Nat Rev Drug Discov. 2007;6:569–582. doi: 10.1038/nrd2311. [DOI] [PubMed] [Google Scholar]
- Miroux B, Walker JE. Over-production of proteins in Escherichia coli: mutant hosts that allow synthesis of some membrane proteins and globular proteins at high levels. J Mol Biol. 1996;260:289–298. doi: 10.1006/jmbi.1996.0399. [DOI] [PubMed] [Google Scholar]
- Mookhtiar KA, Peluso PS, Muller DK, Dunn JJ, Coleman JE. Processivity of T7 RNA polymerase requires the C-terminal Phe882-Ala883-COO- or ‘foot’. Biochemistry. 1991;30:6305–6313. doi: 10.1021/bi00239a032. [DOI] [PubMed] [Google Scholar]
- Moon TS, Dueber JE, Shiue E, Prather KLJ. Use of modular, synthetic scaffolds for improved production of glucaric acid in engineered E. coli. Metab Eng. 2010;12:298–305. doi: 10.1016/j.ymben.2010.01.003. [DOI] [PubMed] [Google Scholar]
- Moon TS, Lou C, Tamsir A, Stanton BC, Voigt CA. Genetic programs constructed from layered logic gates in single cells. Nature. 2012;491:249–253. doi: 10.1038/nature11516. [DOI] [PMC free article] [PubMed] [Google Scholar]
- Moser F, Broers NJ, Hartmans S, Tamsir A, Kerkman R, Roubos JA, Bovenberg R, Voigt CA. Genetic circuit performance under conditions relevant for industrial bioreactors. ACS Synth Biol. 2012;1:555–564. doi: 10.1021/sb3000832. [DOI] [PMC free article] [PubMed] [Google Scholar]
- Muller DK, Martin CT, Coleman JE. Processivity of proteolytically modified forms of T7 RNA polymerase. Biochemistry. 1988;27:5763–5771. doi: 10.1021/bi00415a055. [DOI] [PubMed] [Google Scholar]
- Nierhaus KH. The assembly of prokaryotic ribosomes. Biochimie. 1991;73:739–755. doi: 10.1016/0300-9084(91)90054-5. [DOI] [PubMed] [Google Scholar]
- Nierlich DP. Amino acid control over RNA synthesis: a re-evaluation. Proc Natl Acad Sci. 1968;60:1345–1352. doi: 10.1073/pnas.60.4.1345. [DOI] [PMC free article] [PubMed] [Google Scholar]
- Nyström T. MicroReview: growth versus maintenance: a trade-off dictated by RNA polymerase availability and sigma factor competition? Mol Microbiol. 2004;54:855–862. doi: 10.1111/j.1365-2958.2004.04342.x. [DOI] [PubMed] [Google Scholar]
- Opalka N, Brown J, Lane WJ, Twist K-AF, Landick R, Asturias FJ, Darst SA. Complete structural model of Escherichia coli RN polymerase from a hybrid approach. PLoS Biol. 2010;8:e1000483. doi: 10.1371/journal.pbio.1000483. [DOI] [PMC free article] [PubMed] [Google Scholar]
- Ostermeier M, Nixon AE, Shim JH, Benkovic SJ. Combinatorial protein engineering by incremental truncation. Proc Natl Acad Sci. 1999;96:3562–3567. doi: 10.1073/pnas.96.7.3562. [DOI] [PMC free article] [PubMed] [Google Scholar]
- Paschon DE, Ostermeier M. Construction of protein fragment complementation libraries using incremental truncation. Methods Enzymol. 2004;388:103–116. doi: 10.1016/S0076-6879(04)88010-8. [DOI] [PubMed] [Google Scholar]
- Pédelacq J-D, Cabantous S, Tran T, Terwilliger TC, Waldo GS. Engineering and characterization of a superfolder green fluorescent protein. Nat Biotechnol. 2006;24:79–88. doi: 10.1038/nbt1172. [DOI] [PubMed] [Google Scholar]
- Pettersen EF, Goddard TD, Huang CC, Couch GS, Greenblatt DM, Meng EC, Ferrin TE. UCSF Chimera—A visualization system for exploratory research and analysis. J Comput Chem. 2004;25:1605–1612. doi: 10.1002/jcc.20084. [DOI] [PubMed] [Google Scholar]
- Pfeifer BA, Admiraal SJ, Gramajo H, Cane DE, Khosla C. Biosynthesis of Complex Polyketides in a Metabolically Engineered Strain of E. coli. Science. 2001;291:1790–1792. doi: 10.1126/science.1058092. [DOI] [PubMed] [Google Scholar]
- Poussu E, Vihinen M, Paulin L, Savilahti H. Probing the α-complementing domain of E. coli β-galactosidase with use of an insertional pentapeptide mutagenesis strategy based on Mu in vitro DNA transposition. Proteins. 2004;54:681–692. doi: 10.1002/prot.10467. [DOI] [PubMed] [Google Scholar]
- Poussu E, Jäntti J, Savilahti H. A gene truncation strategy generating N- and C-terminal deletion variants of proteins for functional studies: mapping of the Sec1p binding domain in yeast Mso1p by a Mu in vitro transposition-based approach. Nucleic Acids Res. 2005;33:e104. doi: 10.1093/nar/gni102. [DOI] [PMC free article] [PubMed] [Google Scholar]
- Rackham O, Chin JW. A network of orthogonal ribosome·mRNA pairs. Nat Chem Biol. 2005;1:159–166. doi: 10.1038/nchembio719. [DOI] [PubMed] [Google Scholar]
- Raffaelle M, Kanin EI, Vogt J, Burgess RR, Ansari AZ. Holoenzyme switching and stochastic release of sigma factors from RNA polymerase in vivo. Mol Cell. 2005;20:357–366. doi: 10.1016/j.molcel.2005.10.011. [DOI] [PubMed] [Google Scholar]
- Ravikumar A, Arrieta A, Liu CC. An orthogonal DNA replication system in yeast. Nat Chem Biol. 2014;10:175–177. doi: 10.1038/nchembio.1439. [DOI] [PubMed] [Google Scholar]
- Reinke AW, Grant RA, Keating AE. A synthetic coiled-coil interactome provides heterospecific modules for molecular engineering. J Am Chem Soc. 2010;132:6025–6031. doi: 10.1021/ja907617a. [DOI] [PMC free article] [PubMed] [Google Scholar]
- Rhodius VA, Segall-Shapiro TH, Sharon BD, Ghodasara A, Orlova E, Tabakh H, Burkhardt DH, Clancy K, Peterson TC, Gross CA, Voigt CA. Design of orthogonal genetic switches based on a crosstalk map of σs, anti-σs, and promoters. Mol Syst Biol. 2013;9:702. doi: 10.1038/msb.2013.58. [DOI] [PMC free article] [PubMed] [Google Scholar]
- Salis HM. The ribosome binding site calculator. Methods Enzymol. 2011;498:19–42. doi: 10.1016/B978-0-12-385120-8.00002-4. [DOI] [PubMed] [Google Scholar]
- Schaechter M, MaalØe O, Kjeldgaard NO. Dependency on medium and temperature of cell size and chemical composition during balanced growth of Salmonella typhimurium. J Gen Microbiol. 1958;19:592–606. doi: 10.1099/00221287-19-3-592. [DOI] [PubMed] [Google Scholar]
- Schmidt CM, Shis DL, Nguyen-Huu TD, Bennett MR. Stable maintenance of multiple plasmids in E. coli using a single selective marker. ACS Synth Biol. 2012;1:445–450. doi: 10.1021/sb3000589. [DOI] [PubMed] [Google Scholar]
- Schneider DA, Ross W, Gourse RL. Control of rRNA expression in Escherichia coli. Curr Opin Microbiol. 2003;6:151–156. doi: 10.1016/s1369-5274(03)00038-9. [DOI] [PubMed] [Google Scholar]
- Scott M, Gunderson CW, Mateescu EM, Zhang Z, Hwa T. Interdependence of cell growth and gene expression: origins and consequences. Science. 2010;330:1099–1102. doi: 10.1126/science.1192588. [DOI] [PubMed] [Google Scholar]
- Segall-Shapiro TH, Nguyen PQ, Dos Santos ED, Subedi S, Judd J, Suh J, Silberg JJ. Mesophilic and hyperthermophilic adenylate kinases differ in their tolerance to random fragmentation. J Mol Biol. 2011;406:135–148. doi: 10.1016/j.jmb.2010.11.057. [DOI] [PubMed] [Google Scholar]
- Shea MA, Ackers GK. The OR control system of bacteriophage lambda: a physical-chemical model for gene regulation. J Mol Biol. 1985;181:211–230. doi: 10.1016/0022-2836(85)90086-5. [DOI] [PubMed] [Google Scholar]
- Shetty RP, Endy D, Knight TF. Engineering BioBrick vectors from BioBrick parts. J Biol Eng. 2008;2:5. doi: 10.1186/1754-1611-2-5. [DOI] [PMC free article] [PubMed] [Google Scholar]
- Shis DL, Bennett MR. Library of synthetic transcriptional AND gates built with split T7 RNA polymerase mutants. Proc Natl Acad Sci. 2013;110:5028–5033. doi: 10.1073/pnas.1220157110. [DOI] [PMC free article] [PubMed] [Google Scholar]
- Smanski MJ, Bhatia S, Park Y, Woodruff L, Zhao D, Giannoukos G, Ciulla D, Busby M, Calderon J, Nicol R, Gordon B, Densmore D, Voigt CA. Combinatorial design and assembly of refactored gene clusters. Nat Biotechnol. 2014:In press. doi: 10.1038/nbt.3063. [DOI] [PubMed] [Google Scholar]
- Sousa R, Chung YJ, Rose JP, Wang B-C. Crystal structure of bacteriophage T7 RNA polymerase at 3.3 Å resolution. Nature. 1993;364:593–599. doi: 10.1038/364593a0. [DOI] [PubMed] [Google Scholar]
- Staroń A, Sofia HJ, Dietrich S, Ulrich LE, Liesegang H, Mascher T. The third pillar of bacterial signal transduction: classification of the extracytoplasmic function (ECF) σ factor protein family. Mol Microbiol. 2009;74:557–581. doi: 10.1111/j.1365-2958.2009.06870.x. [DOI] [PubMed] [Google Scholar]
- Studier FW, Moffatt BA. Use of bacteriophage T7 RNA polymerase to direct selective high-level expression of cloned genes. J Mol Biol. 1986;189:113–130. doi: 10.1016/0022-2836(86)90385-2. [DOI] [PubMed] [Google Scholar]
- Studier FW, Davanloo P CH, Rosenberg AH, Moffatt BA, Dunn JJ. United States Patent: 4952496 – Cloning and expression of the gene for bacteriophage T7 RNA polymerase. 1990. [DOI] [PMC free article] [PubMed]
- Tabor S, Richardson CC. A bacteriophage T7 RNA polymerase/promoter system for controlled exclusive expression of specific genes. Proc Natl Acad Sci. 1985;82:1074–1078. doi: 10.1073/pnas.82.4.1074. [DOI] [PMC free article] [PubMed] [Google Scholar]
- Tabor JJ, Bayer TS, Simpson ZB, Levy M, Ellington AD. Engineering stochasticity in gene expression. Mol BioSyst. 2008;4:754–761. doi: 10.1039/b801245h. [DOI] [PMC free article] [PubMed] [Google Scholar]
- Tahirov TH, Temiakov D, Anikin M, Patlan V, McAllister WT, Vassylyev DG, Yokoyama S. Structure of a T7 RNA polymerase elongation complex at 2.9 A resolution. Nature. 2002;420:43–50. doi: 10.1038/nature01129. [DOI] [PubMed] [Google Scholar]
- Temme K, Hill R, Segall-Shapiro TH, Moser F, Voigt CA. Modular control of multiple pathways using engineered orthogonal T7 polymerases. Nucleic Acids Res. 2012a;40:8773–8781. doi: 10.1093/nar/gks597. [DOI] [PMC free article] [PubMed] [Google Scholar]
- Temme K, Zhao D, Voigt CA. Refactoring the nitrogen fixation gene cluster from Klebsiella oxytoca. Proc Natl Acad Sci. 2012b;109:7085–7090. doi: 10.1073/pnas.1120788109. [DOI] [PMC free article] [PubMed] [Google Scholar]
- Thompson KE, Bashor CJ, Lim WA, Keating AE. SYNZIP protein interaction toolbox: in vitro and in vivo specifications of heterospecific coiled-coil interaction domains. ACS Synth Biol. 2012;1:118–129. doi: 10.1021/sb200015u. [DOI] [PMC free article] [PubMed] [Google Scholar]
- Travers AA, Burgess RR. Cyclic re-use of the RNA polymerase sigma factor. Nature. 1969;222:537–540. doi: 10.1038/222537a0. [DOI] [PubMed] [Google Scholar]
- Vassylyev DG, Sekine S, Laptenko O, Lee J, Vassylyeva MN, Borukhov S, Yokoyama S. Crystal structure of a bacterial RNA polymerase holoenzyme at 2.6 Å resolution. Nature. 2002;417:712–719. doi: 10.1038/nature752. [DOI] [PubMed] [Google Scholar]
- Warner JR. The economics of ribosome biosynthesis in yeast. Trends Biochem Sci. 1999;24:437–440. doi: 10.1016/s0968-0004(99)01460-7. [DOI] [PubMed] [Google Scholar]
- Wassarman KM, Storz G. 6S RNA regulates E. coli RNA polymerase activity. Cell. 2000;101:613–623. doi: 10.1016/s0092-8674(00)80873-9. [DOI] [PubMed] [Google Scholar]
- Yanisch-Perron C, Vieira J, Messing J. Improved M13 phage cloning vectors and host strains: nucleotide sequences of the M13mpl8 and pUC19 vectors. Gene. 1985;33:103–119. doi: 10.1016/0378-1119(85)90120-9. [DOI] [PubMed] [Google Scholar]
- Zaslaver A, Bren A, Ronen M, Itzkovitz S, Kikoin I, Shavit S, Liebermeister W, Surette MG, Alon U. A comprehensive library of fluorescent transcriptional reporters for Escherichia coli. Nat Methods. 2006;3:623–628. doi: 10.1038/nmeth895. [DOI] [PubMed] [Google Scholar]
Associated Data
This section collects any data citations, data availability statements, or supplementary materials included in this article.
Supplementary Materials
Supplementary Figures and Tables
Review Process File
Source Data for Figure 2B
Source Data for Figure 3E
Source Data for Figure 4