

Abstract
Background
Mammography is the primary imaging technique for detection and diagnosis of breast cancer; however, the contrast of a mammogram image is often poor, especially for dense and glandular tissues. In these cases the radiologist may miss some diagnostically important microcalcifications. In order to improve diagnosis of cancer correctly, image enhancement technology is often used to enhance the image and help radiologists.
Methods
This paper presents a comparative study in digital mammography image enhancement based on four different algorithms: wavelet-based enhancement (Asymmetric Daubechies of order 8), Contrast-Limited Adaptive Histogram Equalization (CLAHE), morphological operators and unsharp masking. These algorithms have been tested on 114 clinical digital mammography images. The comparison for all the proposed image enhancement techniques was carried out to find out the best technique in enhancement of the mammogram images to detect microcalcifications.
Results
For evaluation of performance of image enhancement algorithms, the Contrast Improvement Index (CII) and profile intensity surface area distribution curve quality assessment have been used after any enhancement. The results of this study have shown that the average of CII is about 2.61 for wavelet and for CLAHE, unsharp masking and morphology operation are about 2.047, 1.63 and 1.315 respectively.
Conclusion
Experimental results strongly suggest that the wavelet transformation can be more effective and improve significantly overall detection of the Computer-Aided Diagnosis (CAD) system especially for dense breast. Compare to other studies, our method achieved a higher CII.
Keywords: Breast neoplasm, Mammography, Image enhancement, Wavelet transform
Introduction
Breast cancer is one of the most important causes of mortality in women over the world. In the United States alone, a most recent research estimated that 207,090 new cases of breast cancer and 39,840 deaths occurred during 2010 [1].
Breast cancer in Iran was the second leading cause of cancer death after gastric carcinoma, and unfortunately in recent years it has become the number one for women. At the present time there are more than 40,000 cases that have been inflicted with breast cancer, and cases will increase more than 7000 each year; the incidence of breast cancer is 10 per 100,000 populations [2]. In recent years more young generation are being inflicted than the elderly. According to the latest report of Statistics Department of Health of Iran, the age of women with breast cancer has been decreased about 7 to 10 years i.e. age 40 is coming to age 30. This is a warning for our society and more research in this field seems essential.
Although, there is no an assured way to prevent breast cancer, early detection is the key to improve breast cancer treatment. Mammography remains the most effective diagnostic technique so far for early breast cancer detection. Mammography can show changes in the breast up to two years before a physician can feel them. Masses and microcalcifications are the two most important mammographic indicators of breast cancer. Microcalcifications are tiny specks of calcium in breast and may appear alone or in clusters. Microcalcification Cluster (MCCs) is an important sign for early breast carcinoma. However, MCCs have small size (ranging from 0.1mm to 0.7 mm) and low contrast, which may be missed or misinterpreted by radiologists and the task of mammography screening by eye, may be tedious. The American College of Radiology (ACR) Breast Imaging Reporting And Data System (BIRADS) identifies four major groups for classifying breast density: (1) predominantly fat (2) fat with some fibroglandular tissue (3) heterogeneously dense (4) extremely dense [3]. Also, in a breast which is considerably dense, the sensitivity of mammography is reduced for early detection of malignancy due to difficulty to find ill-defined mass in an opaque uniform background.
With advances in digital image processing, pattern recognition and artificial intelligence, radiologists have an opportunity to improve the diagnosis with aid of computer systems. Depending on radiologist, readers’ sensitivity can be increased about 10-15% by using Computer-Aided Diagnosis (CAD) systems. Therefore, a reliable CAD system can be very helpful to help radiologists to detect breast cancer both for prompting suspect cases and to help to make a diagnostic decision as a ‘‘second reading”. A CAD system consists of several steps, such as preprocessing, segmentation and classification of pathological cases [4].
In the preprocessing step, the significant features of mammogram are enhanced and most of hidden characteristics are recovered and image quality is improved. Mainly, image enhancement includes intensity and contrast manipulation, noise reduction, background removal, edges sharpening, filtering, etc. Mammogram enhancement techniques are employed for increasing detection, characterization efficiency and also as preprocessing stages of CAD schemes [5]. Several processing techniques for contrast enhancing in the region of microcalcifications have been reported in literature, such as global enhancement techniques (contrast stretching, histogram equalizing) [6], fixed and adaptive local enhancement [7], unsharp masking [8], and region based enhancement aimed to adjust the contrast of ROIs in relation with their surrounding areas [9]. In fact, the standard image enhancement methods failed to achieve a satisfactory enhancement of MCs, which motivated the researchers to develop feature based enhancement methods such as locating features by extracting local statistical attributes of ROIs [10], fuzzy techniques [11], and multiscale analysis methods [12]. Other enhancement methods such as high-pass filtering using wavelet reconstruction [13], fractal modelling [14], and morphological operators [15] focus on background subtraction to increase the appearance of MCs.
Although these methods have improved the possibility of better view of MCS, but sometime have destroyed the shape and appearance of MCs leading to a misdiagnosis. Also, many improved methods for mammogram cause increasing noise or destruction to anatomical structures of image [5]. So, in this work the four best image enhancement methods were proposed for detection of microcalcifications in mammograms. The considered methods are: wavelet transformation, Contrast-Limited Adaptive Histogram Equalization (CLAHE), unsharp masking, and morphological operator. These methods have been selected based on causing no damage on diagnostic result for MCs identification. Furthermore, employment of different enhancement algorithms in the same mammographic dataset provides an additional capability for evaluation of clinical data.
The aim of this research is to evaluate different enhancement methods and determine the appropriate one for mammogram enhancement and microcalcification detection. It provides a good platform for further processing such as classification lesions into benign and malignant. The way that these methods have been implemented in this paper is unique. The effect of enhancement techniques on detection performance of the CAD system is investigated by means of the following parameters: (a) Contrast Improvement Index (CII) and (b) intensity surface area distribution curve. Experimental results have demonstrated that employment of the wavelet-based enhancement techniques have improved the overall detection performance of the CAD system especially for dense breasts. This work can help radiologists in making more accurate breast cancer diagnosis on mammograms.
Materials and Methods
In this paper, four different image processing algorithms (unsharp masking, Contrast-Limited Adaptive Histogram Equalization (CLAHE), morphological operators and wavelet-based enhancement) were applied to digital mammogram images of 114 histological proven clinical cases.
Database
All mammography films used in this study were obtained from patients' medical records in Isfahan. This data set consisted of 114 clinical mammogram images. Among them 22 were normal cases, and the rest of patients (92) contained histologically proven MCCs. These mammograms were collected between 2009 and 2010 and digitized with resolution of about 6000 × 5000 pixels and 24 bit or 32bit color or at least 8 bit per pixel by a laser film digitizer. The processing or transmission time of such digital images was quite long and also archiving the large amount of data generated in any screening mammography program was expensive and a difficult challenge. Therefore to solve this problem the sizes of all images were reduced to 800 × 600 pixels and converted to grey scale images.
Breast Region Extraction
Mammogram images contain a large area of dark, which is not a breast tissue, so to accelerate processing and reduce artefact, these regions have been removed by masking. The mask template is a binary matrix of size equal to original image. Morphology operation and Otsu algorithms have been used to make an appropriate mask. This mask preserved breast tissue especially nipples and it works excellent for almost all type of breast tissue. The result of this procedure on a mammogram image is depicted in Figure 1.
Figure 1.

The result of breast region extraction
Image Enhancement
In this research, four microcalcification enhancement methods were used as preprocessing step of a CAD system. The methods included: unsharp masking, Contrast-Limited Adaptive Histogram Equalization (CLAHE), morphological operators and wavelet-based enhancement.
Unsharp Masking
To illustrate edges and small details in a mammogram image, unsharp masking filter is very useful [16]. The unsharp masking method reduces low-frequency details but amplifies high-frequency. However, this process may change the images dramatically to be applied to the mammograms. Unsharp masking is a process of subtracting a blurred image from an original. It can be expressed as
where f is the original image is the blurred image, g is the sharpened result and ∝ controls how much sharpening should be added and it must be in the range of 0.0 to 1.0.
Contrast Limited Adaptive Histogram Equalization (CLAHE)
The CLAHE algorithm is a widely used technique which results in contrast enhancement of medical images. It replaces every pixel in a given image by integral of histogram of the given image up to the value of the pixel. CLAHE operates on a small region, called tile, rather than the entire image. Each tile’s contrast is enhanced so that the histogram of the output region approximately matches the histogram specified by the 'Distribution' parameter. The neighbouring tiles are then combined using bilinear interpolation to eliminate artificially induced boundaries. The contrast, especially in homogeneous areas, can be limited to avoid amplifying any noise that might be present in the image [17].
Morphological Operators
Morphology is a broad set of image processing operations that process images based on shapes. Morphological operations apply a structuring element to an input image, creating an output image of the same size. In a morphological operation, the value of each pixel in the output image is based on a comparison of the corresponding pixel in the input image with its neighbours. By choosing the size and shape of the neighbourhood, a morphological operation can be constructed that is sensitive to specific shapes in the input image.
In grayscale morphology, images are functions mapping a Euclidean space or grid E into, where is the set of real, is an element larger than any real number, and , is an element smaller than any real number. Grayscale structuring elements are also functions of the same format, called "structuring functions". Denoting an image by f(x) and the structuring function by b(x), the opening and closing are given respectively by Equation(2).
Formula 2
In this research morphological reconstruction (opening and then closing by reconstruction) has been used to clean up the image and smoothing so the foreground which contains breast tissue would be more recognizable. Comparing reconstruction-based opening and closing to standard opening and closing are more effective to remove small blemish without affecting the whole shapes of the objects. Reconstruction is a morphological transformation involving two images and a structuring element instead of a single image and a structure element. One image is the marker for starting point of the transformation. The other image is the mask containing the transformation. The structure element defined the connectivity. If g is the mask and f is the marker, the reconstruction of g from f, denotes by Rg (f). The high points or peaks in the marker image specify where the processing begins and the processing continues until the image values stop changing [18].
Wavelet-based Enhancement
Wavelet transform is a powerful tool for filtering which represents images hierarchically on the basis of scale and resolution; it analyzes high-spatial frequency phenomena localized in space, thus it can effectively extract information derived from localized high-frequency signals such as those emitted by microcalcification.
Wavelet transforms are one dimensional but easily extend to analyze 2-D discrete signals. Separable 2-D wavelet transform of an image is constructed by applying 1-D wavelet transform along with the image rows and columns. The 2-D wavelet and scaling functions derived from 1-D wavelet ψ(x) and scaling φ(x) functions, are expressed according to the following equation (Eq.3):
Formula 3
Φ(x, y) represents a 2-D separable low-pass filter applied along with the horizontal x vertical y directions are 2-D separable high-pass filters extracting the signal details along with the horizontal, vertical, and diagonal directions, respectively. The detailed coefficients contain small-scale components of the image. In frequency domain analysis, high frequency coefficients are detailed. Microcalcifications often appear on the mammogram image as fine and bright grains in the breast tissue. So, we can assume that a wavelet decomposition of mammogram image will contain MCCs mostly within the detailed coefficients [19].
In this research, Five-level discrete wavelet decomposition was employed by using Asymmetric Daubechies of order 8; it accumulates more energy corresponding to the details of the wavelet transform and more over it is characterized by symmetry and finite length to enhance mammograms. Due to these features, they can achieve high correlation with the clustered MC; therefore, they can effectively enhance MC, so the filtered image is subjected to five-level discrete wavelet decomposition. This produces an approximation and five sets of horizontal, vertical and diagonal detailed coefficients and afterwards the contrast enhanced mammogram is obtained by reverse wavelet transform.
Results
The considered enhancement techniques which were introduced in this paper have been tested on 114 mammogram images. The experimental results for different density mammograms (BIRADCI-BIRADCIV) have been shown in Figure 2.
Figure 2.

Visual contrast enhancement results
For evaluation of analysis of the proposed enhancement algorithm, the Contrast Improvement Index (CII) has been used [10] which is defined as follows:
Formula 4
C processed and C original are the contrast value of the processed and original images, respectively . The contrast of a region is defined by the following equation:
Formula 5
f is the mean gray-level value of the foreground and is the mean gray-level value of the background. The bigger value of CII shows the better performance of enhancement methods. In Table 1 the contrasts of the original and enhancements images are given.
Table 1.
CII values of four enhanced mammograms
| Contrast | Original | Wavelet | CLAHE | Unsharp | Morphology | |
|---|---|---|---|---|---|---|
| Image1 | C | 0.1412 | 0.4954 | 0.3208 | 0.1959 | 0.1641 |
| CII | - | 3.50 | 2.27 | 1.38 | 1.16 | |
| Image2 | C | 0.3098 | 0.7217 | 0.5707 | 0.4920 | 0.4513 |
| CII | - | 2.32 | 1.84 | 1.58 | 1.45 | |
| Image3 | C | 0.2458 | 0.5560 | 0.5332 | 0.4066 | 0.2848 |
| CII | - | 2.26 | 2.16 | 1.65 | 1.15 | |
| Image4 | C | 0.2297 | 0.4616 | 0.4341 | 0.3496 | 0.2546 |
| CII | - | 2.00 | 1.88 | 1.52 | 1.10 |
Profile intensity surface area distribution curve has been used for quality assessment of an image following enhancement. Granulometry estimates the intensity surface area distribution of MCCs as a function of size. Granulometry likens image objects to stones with sizes which can be determined by sifting them through screens of increasing size and collecting what remains after each pass. Image objects are sifted by opening the image with a structuring element of increasing size and counting the remaining intensity surface area (summation of pixel values in the image) after each opening. Let B be a structuring element in a Euclidean space or grid E, and consider the family , given by:
Formula 6
Where denotes morphological dilation. By convention, is the set containing only the origin of E and B1=B .
Let X be a set (i.e., a binary image in mathematical morphology), and consider the series of sets ,
Formula 7
Where denotes the morphological opening.
The granulometry function is the cardinality (i.e., area or volume, in continuous Euclidean space, ornumber of elements, in grids) of the image :
Formula 8
The pattern spectrum or size distribution of X is the collection of sets given by:
Formula 9
Parameter k is referred to size, and the component k of the pattern spectrum PSk(X) provides a rough estimate for the amount of grains of size in the image . Peaks of indicate PSk(X) relatively large quantities of grains of the corresponding size. The intensity curve of a mammogram image is shown in Figure 3. This figure determines that wavelet transformation has the best performance for mammogram enhancement.
Figure 3.
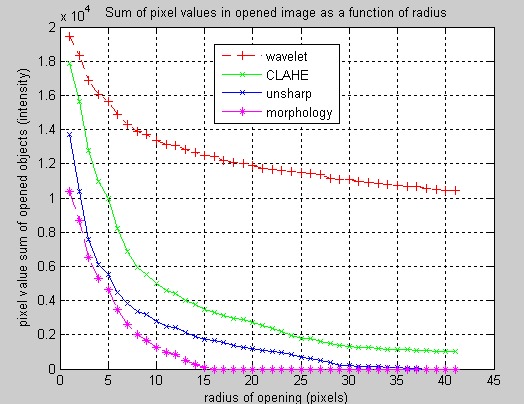
Intensity surface area distribution curve
Our method has the best effect on dense mammograms. Mammograms which have density 3 and 4 in breast density rating in the American College of Radiology (ACR), are the most difficult cases to screen.
Discussion
Since many mammograms are low contrast, blur and fuzzy, it is difficult to detect the microcalcifications. Mammogram enhancement is essential for improvement of contrast features and suppression of noise. Appropriate image enhancement improves the visibility of microcalcifications. The essential need in mammogram enhancement is to increase the contrast.
To our knowledge, there are no specific references for evaluation of preprocessing techniques in CAD schemes for microcalcification detection. However, in [20, 21] a set of metrics which measure the quality of mammographic image enhancement of masses proposed in a CAD frame work. A single quantitative measure, which arises from the combination of these metrics, suggests reprocessing technique, which results in the highest enhancement effect. On the other hand, there are several works, which address improvement of radiologist’s detection performance by using enhancement techniques. Four enhancement algorithms (adaptive unsharp masking, CLAHE, adaptive-neighborhood contrast enhancement, and wavelet approach) were applied to 40 patients who had malignant or benign masses and microcalcification clusters [22]. The adaptive neighborhood contrast enhancement algorithm was the most preferred by the radiologists i.e. in 49% of the microcalcification interpretations. Wavelet-based enhancement was preferred in 28% and the unenhanced images in 13% of the microcalcification clusters. Wavelet contrast enhancement methods lead to a significant improvement of local contrast and noise amplification [23, 24]. Five pre-processing methods which can enhance the mammographic image were implemented. They were processed by a CAD system and they were as follow: the Local Range Modification (LRM), Redundant Discrete Wavelet (RDW), linear stretching, shrinkage algorithms, and CLAHE. The highest performance in two mammographic datasets were achieved by LRM (AZ= 0.932) and the wavelet-based linear stretching (AZ= 0.926) methodology. But still direct comparison of efficiency of the enhancement method with the results was not possible, since the used CAD systems were different and none of the researchers tuned the parameters of the system.
In this paper, four enhancement methods have been tested aiming to improve previously developed CAD system [20] for detection of microcalcification clusters in digital mammograms. As these enhancement methods were selected based on the best effect for improvement of mammogram images and microcalcifications detection, the results of this study are more reliable. Also experimental results illustrated that investigated algorithms made a higher CII in compare with conventional image enhancement methods and reduced noise in high noise mammograms [25].
Although, this study achieved a satisfactory performance, further studies should be carried out to use efficient enhancement methodologies aiming to reduce false objects detection rate. The employment of wavelet enhancement techniques, which would utilize different weights in each level of image decomposition process, can provide more flexible and probably more effective enhancement in interpretation of digital mammograms. In our future research, we would like to investigate whether the mammography images are divided in different groups according to the ACR tissue density and then multiple analyses will be done about enhancement methods to get more reliable and useful results. We would also like to extend this research for detection and classification of other presentations of breast cancer such as mass.
Conclusion
Image processing methods have different effects on digital mammogram images and can make them clearer. The results of this study illustrated that the wavelet transformation had the highest CII about 2.61 in average. The CII averages of CLAHE, unsharp masking and morphology operation were about 2.047, 1.63 and 1.315 respectively. The results demonstrated that the wavelet transformation with Asymmetric Daubechies of order 8 method was an effective way to enhance microcalcifications especially for dense breasts and also reduced noise in high noise mammograms. It may also be able to improve the detection and classification of microcalcifications in a computer-aided diagnosis system.
Acknowledgments
The authors would like to thank Mr. Hossein Khazaei Targhi for his cooperation in this study.
Footnotes
Conflicts of Interest
The authors declared that this research was not supported by funding institutions.
Authors' Contribution
Hajar Moradmand designed the study, analyzed the data and wrote the paper. Saeed Setayeshi and Ali Reza Karimian contributed to the study design and analysis. Mohammad Esmaeil Akbari disposed breast cancer statistics in Iran, Mehri Sirous supplied mammogram images and they approved the result.
REFERENCES
- 1.ACR Breast Imaging Reporting and Data System, Breast Imaging Atlas, Breast Cancer Facts and Figure. The American College of Radiology (ACR). 2010. Available from: http://www.cancer.org.
- 2.Akbari ME, Khayamzadeh M, Khoshnevis SJ, Nafisi N, Akbari A. Five and Ten Years Survival in Breast Cancer Patients Mastectomies vs. Breast Conserving Surgeries Personal Experience. Iran J Cancer Prev. 2008;2(1):53–6. [Google Scholar]
- 3.Lazarus E, Mainiero MB, Schepps B, Koelliker SL, Livingston LS. BI-RADS Lexicon for US and Mammography: Interobserver Variability and Positive Predictive Value. Radiology. 2006;239(2):385–91. doi: 10.1148/radiol.2392042127. [DOI] [PubMed] [Google Scholar]
- 4.Cheng HD, Cai X, Chen X, Hu L, Lou X. Computer-aided detection and classification of microcalcifications in mammogram . The Journal of Pattern Recognition. Elsevier. 2003;36:2967–91. [Google Scholar]
- 5.Dean J, Ilvento CC. Improved cancer detection using computer-aided detection with diagnostic and screening mammography: Prospective study of 104 cancers. American Journal of Roentology. 2006;187(1):20–8. doi: 10.2214/AJR.05.0111. [DOI] [PubMed] [Google Scholar]
- 6.Gandhi KR, Karnan M. Mammogram image enhancement and segmentation. IEEE International Conference on Computational Intelligence and Computing Research (ICCIC). 2010;1:1. [Google Scholar]
- 7.Veldkamp WJ, Karssemeijer N. Normalization of Local Contrast in Mammograms. IEEE Transactions on Medical Imaging. 2000;19(7):731–8. doi: 10.1109/42.875197. [DOI] [PubMed] [Google Scholar]
- 8.Panetta K, Zhou Y, Agaian S, Jia H. Nonlinear Unsharp Masking for Mammogram Enhancement. IEEE Transactions on Information Technology in Biomedicine. . 2011;15(6):918. doi: 10.1109/TITB.2011.2164259. [DOI] [PubMed] [Google Scholar]
- 9.Morrow WM, Paranjape RB, Rangayyan RM. Region-based contrast enhancement of mammograms. IEEE Trans Med Imaging. 1992;11(3):392. doi: 10.1109/42.158944. [DOI] [PubMed] [Google Scholar]
- 10.Ema T, Doi K, Nishikawa RM, Jiang Y, Papaioannou J. Image feature analysis and computer-aided diagnosis in mammography: reduction of false-positive clustered microcalcifications using local edge-gradient analysis. Med Phys. 1995;22(2):161–9. doi: 10.1118/1.597465. [DOI] [PubMed] [Google Scholar]
- 11.Cheng HD, Xu H. A Novel Fuzzy Logic Approach to Mammogram Contrast Enhancement. Information Sciences. 2002;148(1-4):167–84. [Google Scholar]
- 12.Dippel S, Stahl M, Wiemker R, Blaffert T. Multiscale ContrastEnhancement for Radiographies: Laplacian Pyramid versus FastWavelet Transform. IEEE Trans Med Imaging. 2002;21(4):343. doi: 10.1109/TMI.2002.1000258. [DOI] [PubMed] [Google Scholar]
- 13.Mencattini A, Salmeri M, Lojacono A, Frigerio R, Caselli MF. Mammographic Images Enhancement and Denoising for Breast Cancer Detection Using Dyadic Wavelet Processing. IEEE Transactions on Instrumentation and Measurement. 2008;57(7):1422–30. [Google Scholar]
- 14.Stojić T, Reljin B. Enhancement of Microcalcifications in Digitized Mammograms: Multifractal and Mathematical Morphology Approach. Faculty of Mechanical Engineering Transactions. 2010;38(1):1–9. [Google Scholar]
- 15.Hassanien AE, Abraham A. Rough Morphology Hybrid Approach for Mammography Image Classification and Prediction. International Journal of Computational Intelligence and Applications . 2008;7(1):17–42. [Google Scholar]
- 16.Lure FYM, Jones PW, Gaborski RS. Multi-resolution unsharp masking technique for mammogram image enhancement. SPIE Proceedings. 1996;2710:830–9. [Google Scholar]
- 17.Pizer SM, Amburn EOP, Austin JD. Adaptive histogram equalization and its variations. Computer Vision Graphics Image Process. 1987;39:355–68. [Google Scholar]
- 18.Gonzalez RC, Woods RE. Digital image processing. 1st. Re 18.ading, MA: Addison-Wesley; 1992. [Google Scholar]
- 19.Tang J, Liu X, Sun Q. A Direct Image Contrast Enhancement Algorithm in the Wavelet Domain for Screening Mammograms. IEEE Journal of Selected Topics in Signal Processing. 2009;3(1):74. [Google Scholar]
- 20.Moradmand H, Setayeshi S, Khazaei H. Comparing Methods for segmentation of Microcalcification Clusters in Digitized Mammograms. International Journal of Computer Science Issues. 2011;8(6):104–108. [Google Scholar]
- 21.Singh S, Bovis K. An evaluation of contrast enhancement techniques for mammographic breast masses. IEEE Trans Inf Technol Biomed. 2005;9(1):109–19. doi: 10.1109/titb.2004.837851. [DOI] [PubMed] [Google Scholar]
- 22.Sivaramakrishna R, Obuchowski NA, Chilcote WA, Cardenosa G, Powell KA. Comparing the performance of mammographic enhancement algorithms: a preference study. AJR Am J Roentgenol. 2000;175(1):45–51. doi: 10.2214/ajr.175.1.1750045. [DOI] [PubMed] [Google Scholar]
- 23.Costaridou L, Sakellaropoulos P, Skiadopoulos S, Panayiotakis G. Locally adaptive wavelet contrast enhancement. In: L. Costaridou (Ed.) Medical Image Analysis Methods (Electrical Engineering & Applied Signal Processing), CRC Press, Taylor & Francis, Boca Raton, FL, London. 2005;6:225–70. [Google Scholar]
- 24.Papadopoulosa A, Fotiadisb DI, Costaridou L. Improvement of microcalcification cluster detection in mammography utilizing image enhancement techniques. Computers in Biology and Medicine. 2008;38(10):1045. doi: 10.1016/j.compbiomed.2008.07.006. [DOI] [PubMed] [Google Scholar]
- 25.Kang H, Ro Y, Kim S. Microcalcification detection using adaptive contrast enhancement on wavelet transformation and neural network. IEEE Trans INF&SYST. 2006;89(3):1280–7. [Google Scholar]