

Abstract
Background
As children comprise a considerable proportion of our population, the importance of local epidemiologic research and geographic and racial differences can’t be disputed on childhood malignancies.
Methods
In this descriptive retrospective study, we extensively reviewed the medical records of patients younger than 15 years of age, diagnosed with solid malignant tumors, from 1996 to 2010, using the last version of International Classification of Childhood Cancers.
Results
In our study the order of incidence of solid malignancies was relatively similar to the other national studies, with lymphomas and Central Nervous System (CNS) tumors as the most common, followed by Sympathetic Nervous System (SNS) tumors, soft tissue sarcomas and renal tumors. The peak age of diagnosis was between 1 and 4 years old. In our study, the overall male to female ratio was 1.38, with a trend towards male dominance in the older age groups. We also observed a disturbing trend of childhood solid malignancies. The total number of cases almost doubled from 2009(54(6.9%)) to 2010(96(12.2%)) .This trend was particularly detected in CNS and SNS tumors. Further analysis showed that malignant CNS tumors had played a more pronounced role in this change.
Conclusion
Changes in trends of some tumor categories have illustrated a desperate need to further research in regional and national levels. Also the gathered data can be used to make more accurate programs for a better control of cancer and to help policymakers to allocate more evidence-based resource for hospitals.
Keywords: Child, Infant, Neoplasm, Epidemiology, Pediatric hospital
Introduction
According to the global statistics, cancer as one of the most preventable non-communicable chronic diseases is the second leading cause of death after cardiovascular disease worldwide. To our knowledge, only about 2% of all cancers diagnosed in industrialized nations are childhood malignancies, but despite a low prevalence of cancer in children, it represents the most frequent cause of death among children in developed countries. Based on the epidemiological surveys conducted for mortality, malignancy was second cause of death after accidents in children older than one in the United States [1].On the other hand, in developing countries, childhood cancer mortality may not be the first priority of research and it may seem an unaffordable luxury issue, compared to high mortality rates in other causes, such as infections [2]. However, despite under-reporting, cancer is now the 3rd or 4th cause of death among children in many developing countries [2]. In addition, according to the Montevideo document published by the International Society of Pediatric Oncology (SIOP), almost 70% of childhood cancers are currently curable with adequate treatments.
There are some data showing prevalence and cancer-related mortality in children and adolescents have different epidemiological pattern. However the substantial differences between pediatric and adult malignancies are not just limited to this; other examples emphasizing the need for separate analysis and further research in epidemiology of childhood malignancies are as follow: tumor types and histopathological characteristics, genetic etiology and teratogenic factors in pediatric malignancies, possibility of spontaneous regression towards benign category, and remarkable improvement in the prognosis and advances in management of childhood cancers [3].
Considering that children comprise a considerable proportion of our population, for example 29% of the current population of Iran and also considering geographic and racial differences between Iran and other countries, it is inevitable to do a local epidemiologic research in this field. Early preventive measures and a diagnosis in time, and also appropriate treatments are essential for reducing the rate of pediatric cancers but they need classified demographic data including incidence rate, prevalence, age, gender distribution, etiologies, and prognosis and survival rates.
Another important issue is the temporal trends of childhood malignancies. A brief review indicates that several studies have been conducted to analyze and interpret the patterns and trends of cancer in children. Despite of complications caused by short-term random variation, artificial fluctuations introduced by screening and changes in diagnosis or disease classification as well as completeness of reporting and multiple factors which may affect the risk of developing cancer and progression in specific cancer sites, recent reports suggest an increasing trend for some childhood malignancies which may be worthy of further analysis [4-12]. Changes in temporal trends in the incidence of particular types of cancer may also reflect changes in exposure to underlying etiologic factors; therefore public health actions are required to address such issues more seriously.
In this hospital-based study, we described the demographics, age and gender distribution for each tumor category; we also analyzed changes in temporal trends of each tumor category during a 15-year period. The results from this study can provide further opportunities for etiologic research and such findings may help for better prevention strategies in the future.
Materials and Methods
In this descriptive retrospective study, we extensively reviewed the patients' medical records of younger than 15 years of age with solid malignant tumors, from 1996 to 2010. Due to lack of a comprehensive hospital registration system, we firstly established a complete pediatric cancer registry, using the last version of International Classification of Childhood Cancers (ICCC) diagnostic groups. All 784 patients were finally included in the data set and following variables were collected: name, tissue block number, hospital admission code, age, age group, gender, date of diagnosis, ICCC diagnostic groups, and tumor type and tumor site. All individuals who enrolled in this study had histopathological proven solid malignant tumors confirmed by two pediatric pathologists and if the diagnosis was uncertain, they evaluated the case by a further immunohistochemistry assay. As ICCC was not available before 2000, two pediatric pathologists revised the data collected before it and reviewed the slides and necessary modifications were implemented to fulfil the updated criteria. After being assessed for eligibility some groups were excluded: patients older than 15 years as the hospital insurance policy didn’t cover these patients and having this group could be counted as a remarkable underestimation. Manual checking for duplicate records were performed by comparing names, age, gender, date and kind of diagnosis. All duplicate cases whether due to recurrence or follow up were excluded. All patients with missing data or uncertain diagnosis were also excluded.
Statistical Analysis
Statistical analyses were performed using SPSS version 11. For categorical variables Chi-square test was used. P-values were based on two-sided tests and the cut-off point for statistical significance was P<0.05.
Results
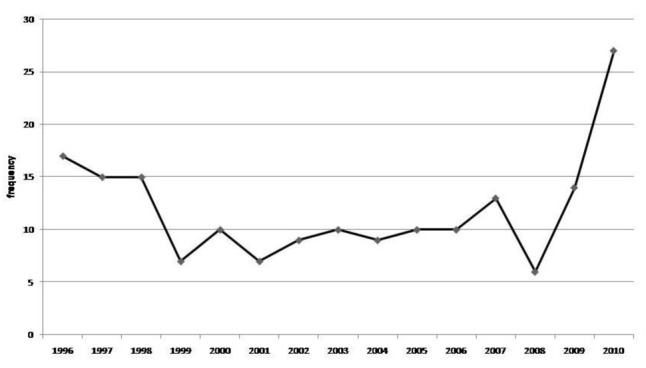
As mentioned before, 784 solid malignant tumors were classified according to the ICCC diagnostic categories. Frequency of the tumors classifications were as follows: 1. Lymphoma and reticuloendothelial neoplasm 186 (23.7%), 2- CNS and miscellaneous intracranial and intraspinal neoplasm 175 (22.3%), 3-Sympathetic Nervous System tumor (SNS tumors)131(16.7%), 4 and 5- Soft-tissue sarcoma and renal tumors both 84(10.7%), 6-Germ-cell, trophoblastic and other gonadal neoplasm 44(5.6%), 7-Hepatic tumors 40(5.1%),8- Other cancers and miscellaneous categories 34(4.3%), 9-Malignant bone tumors 6(0.8%). Changes in overall frequency of solid malignant tumors in a 15-year period are shown in Figure 1.
Figure 1.

Overall frequency of solid malignancies in the 15 year period
Gender Distribution
Amongst 784 cases, 329 (42%) were female and 455(58%) were male, with a 1.38 male to female ratio. The gender distribution was almost the same in the first two the age groups. Male to female ratio was 1.16 in less than one year and 1.12 in 1-4 year old group. However, such trend turned towards more male dominancy in the older age groups i.e. 1.69 male to female ratio in 5-9 age group and 1.93 in 10-14 year old age group. For both sexes the most frequent cases were in 1-4 year old group (48% of females vs. 38.9% of males).The difference in distribution of genders in different age groups was statistically significant using Chi-square test (P-value<0.05). You can see further details in Figure 2.
Figure 2.

Gender distribution in different age groups
Age Distribution
Among 784 cases, 91(11.6%) were below 1 year old, 335 (42.7%) were in 1-4 age group, 229 (29.2%) were in 5-9 age group and 129(16.5%) of cases were in 10-14 age group. The pattern of age distribution was similar in the most of the 15 year period, with some exceptions in some years i.e. the 5-9 was the leading age group (Figure 3).
Figure 3.

Frequency and distribution of each tumor category in different age groups
In children below 1 and 1-4 year old of age, SNS tumors with 30 (33%) and 75(22.4%) of cases were respectively the most frequent tumor category while in 5-9 and 10-14 year old group, lymphomas and reticuloendothelial neoplasms were the most with 87(38%) and 60(46.5%) of cases respectively. CNS tumors were the second most common tumor in overall and also in each age category. The peak age of diagnosis for almost all tumor categories was 1-4 year old. These categories included: CNS tumors, sympathetic nervous system tumors, hepatic and renal tumors, soft tissue sarcomas, and germ-cell tumors. The peak age of incidence in contrast to other categories was 5-9 year old for lymphomas and 10-14 year old for bone tumors. More details in frequency and distribution of each tumor category in different age groups are listed in Table1 and shown in Figure 3.
Table 1.
Distribution of different tumor categories in different age groups
| Classification | Age groups | Total | ||||
|---|---|---|---|---|---|---|
| <1 y | 1-4 y | 5-9 y | 10-14 y | |||
| CNS tumors | Count | 16 | 74 | 55 | 30 | 175 |
| % within Classification | 9.1% | 42.3% | 31.4% | 17.1% | 100.0% | |
| % within Age groups | 17.6% | 22.1% | 24.0% | 23.3% | 22.3% | |
| Lymphomas | Count | 3 | 36 | 87 | 60 | 186 |
| % within Classification | 1.6% | 19.4% | 46.8% | 32.3% | 100.0% | |
| % within Age groups | 3.3% | 10.7% | 38.0% | 46.5% | 23.7% | |
| SNS tumors | Count | 30 | 75 | 19 | 7 | 131 |
| % within Classification | 22.9% | 57.3% | 14.5% | 5.3% | 100.0% | |
| % within Age groups | 33.0% | 22.4% | 8.3% | 5.4% | 16.7% | |
| Bone tumors | Count | 0 | 0 | 2 | 4 | 6 |
| % within Classification | .0% | .0% | 33.3% | 66.7% | 100.0% | |
| % within Age groups | .0% | .0% | .9% | 3.1% | .8% | |
| Liver tumors | Count | 11 | 20 | 7 | 2 | 40 |
| % within Classification | 27.5% | 50.0% | 17.5% | 5.0% | 100.0% | |
| % within Age groups | 12.1% | 6.0% | 3.1% | 1.6% | 5.1% | |
| Kidney tumors | Count | 11 | 50 | 22 | 1 | 84 |
| % within Classification | 13.1% | 59.5% | 26.2% | 1.2% | 100.0% | |
| % within Age groups | 12.1% | 14.9% | 9.6% | .8% | 10.7% | |
| Soft tissue sarcomas | Count | 12 | 37 | 27 | 8 | 84 |
| % within Classification | 14.3% | 44.0% | 32.1% | 9.5% | 100.0% | |
| % within Age groups | 13.2% | 11.0% | 11.8% | 6.2% | 10.7% | |
| Germ cell tumors | Count | 4 | 31 | 4 | 5 | 44 |
| % within Classification | 9.1% | 70.5% | 9.1% | 11.4% | 100.0% | |
| % within Age groups | 4.4% | 9.3% | 1.7% | 3.9% | 5.6% | |
| Other tumors | Count | 4 | 12 | 6 | 12 | 34 |
| % within Classification | 11.8% | 35.3% | 17.6% | 35.3% | 100.0% | |
| % within Age groups | 4.4% | 3.6% | 2.6% | 9.3% | 4.3% | |
| Total | Count | 91 | 335 | 229 | 129 | 784 |
| % within Classification | 11.6% | 42.7% | 29.2% | 16.5% | 100.0% | |
| % within Age groups | 100.0% | 100.0% | 100.0% | 100.0% | 100.0% | |
Tumor Specific Age-gender Distribution:
In male the four most common tumors were 1- Lymphomas and reticuloendothelial neoplasms 143(31.4%) 2-CNS tumors 98(21.5%), 3-SNS tumors 65(14.3%) and 4-Renal tumors 53(11.6%). In female the four most common tumors were 1- CNS tumors 77(23.4%), 2- SNS tumors 66(20.1%), 3-Lymphomas and reticuloendothelial neoplasms 43(13.1%) and 4-Soft tissue sarcomas 42(12.8%).
The overall pattern of male dominancy was observed in the following tumor categories: 1- Lymphomas and reticuloendothelial neoplasms, 2-Renal tumors, 3-Hepatic tumors, 4- CNS tumors. Only germ-cell tumors were more frequent among females. On the other hand, the frequency of some tumors such as SNS tumors, soft tissue sarcomas and bone tumors were relatively similar among male and female. The frequency and distribution of each tumor category in male and female have also been illustrated in Table 2.
Table 2.
Distribution of different tumors in both sexes
| Classification | Sex | Total | ||
|---|---|---|---|---|
| Female | Male | |||
| CNS tumors | Count | 77 | 98 | 175 |
| % within Classification | 44.0% | 56.0% | 100.0% | |
| Lymphomas | Count | 43 | 143 | 186 |
| % within Classification | 23.1% | 76.9% | 100.0% | |
| SNS tumors | Count | 66 | 65 | 131 |
| % within Classification | 50.4% | 49.6% | 100.0% | |
| Bone tumors | Count | 3 | 3 | 6 |
| % within Classification | 50.0% | 50.0% | 100.0% | |
| Liver tumors | Count | 16 | 24 | 40 |
| % within Classification | 40.0% | 60.0% | 100.0% | |
| Kidney tumors | Count | 31 | 53 | 84 |
| % within Classification | 36.9% | 63.1% | 100.0% | |
| Soft tissue sarcomas | Count | 42 | 42 | 84 |
| % within Classification | 50.0% | 50.0% | 100.0% | |
| Germ cell tumors | Count | 34 | 10 | 44 |
| % within Classification | 77.3% | 22.7% | 100.0% | |
| Other tumors | Count | 17 | 17 | 34 |
| % within Classification | 50.0% | 50.0% | 100.0% | |
| Total | Count | 329 | 455 | 784 |
| % within Classification | 42.0% | 58.0% | 100.0% | |
Analyzing the Trend in More Details
We assessed the trend of each tumor category separately; however, we only analyzed the trend of the three most frequent categories in different sex and age groups in the 15 year study period. The results are shown in Figures 4-9.
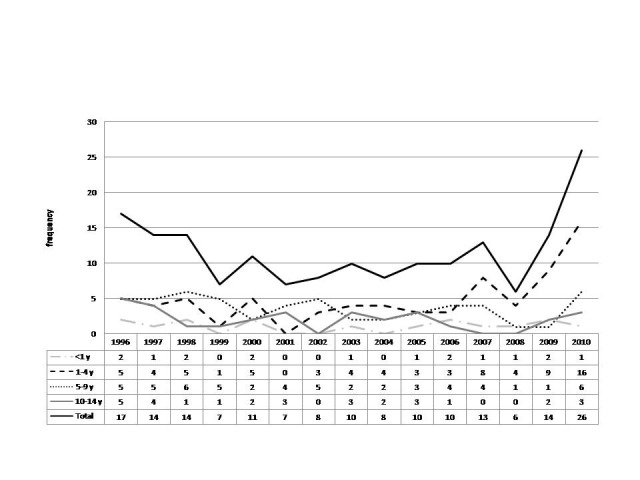
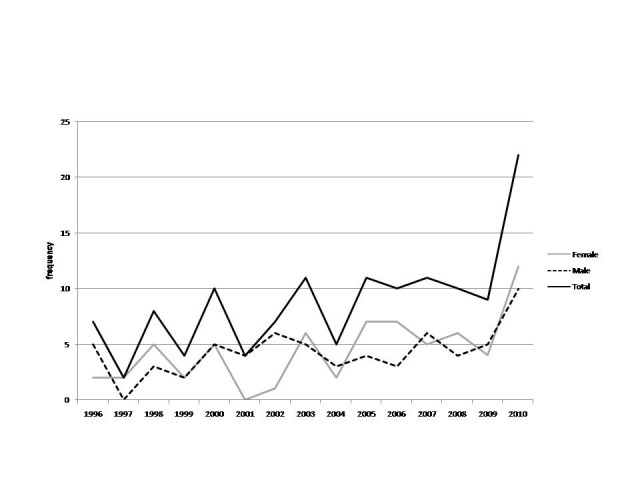
Figure 4.

Lymphomas /trend across different sexes
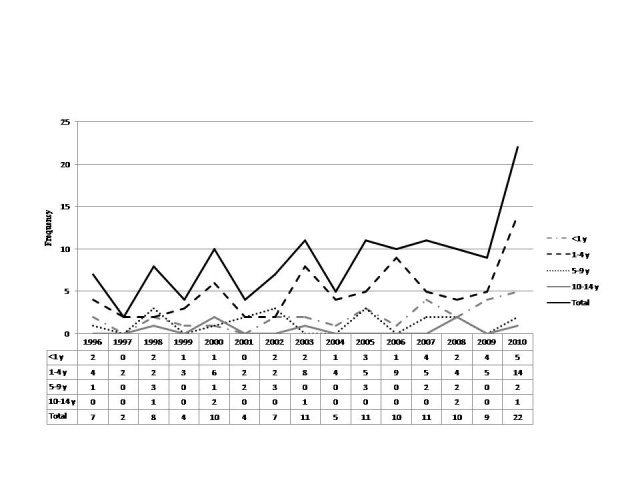
Figure 5.

Lymphomas /trend across different age groupstable
Figure 6.

CNS tumors/trend across different sexes
Figure 7.
CNS tumors/trend across different age groups
Figure 8.
SNS tumors/trend across different sexes
Figure 9.
SNS tumors/trend across different age groups
Discussion
We classified the solid childhood malignancies using the ICCC diagnostic categories. Previous national reports suggested that the incidence of childhood cancer in Iran is significantly lower than the developed countries; such difference was attributed to a possible under reporting due to differences in diagnostic and registration process, in addition to the different environmental exposure and genetic background [13-17].
According to epidemiologic studies, the three most common cancers in children are leukemia, CNS tumors and lymphomas; these cancers are followed by SNS tumors, soft tissue sarcomas and renal tumors in order of frequency. Such pattern is observed in the United States, Europe and Africa; however, in South America, there is a difference pattern of cancer distribution so that the most prevalent malignancies in children are leukemia, lymphomas and brain and CNS tumors [13, 17]. According to the epidemiologic surveys conducted in Iran, the difference in pattern also is in compliance with our population [16]. Except leukemia, the order of frequency was similar to the national study mentioned above. Lymphomas and CNS tumors are the most common followed by SNS tumors, soft tissue sarcomas and renal tumors. It is worth mentioning that variation in incidence of CNS tumors have attributed to the difference in registration process throughout the world; such difference is more pronounced in registration of non-malignant CNS tumors and tumors of uncertain behavior[18].
Age Distribution
Though this pattern varies by tumor categories, the peak age of diagnosis of overall solid malignancies was 1-4 year old in our study; such pattern has also been reported by Surveillance, Epidemiology and End Results (SEER) program in the USA and UK cancer research centers. In a tumor specific analysis, we found that for almost all tumor categories, except lymphomas and bone tumors, the peak age of presentation was 1-4 year old. For lymphomas we observed a significant increase of cases in 5-9 and 10-14 age groups while the number of cases below 2 years was considerably low. Very few cases of orthopedic malignancies had been admitted to our hospital because it was not a center for pediatric orthopedics. Although few cases of bone tumors included in our study, but most cases were in 10-14 year old group. These findings also match SEER and UK statistics [14, 19].
Gender Distribution
Generally, the overall incidence of malignancies in boys is higher than girls [20]. In our hospital based study the overall male to female ratio was 1.38. In infants, this ratio was 1.16 while in older age groups i.e. 1-4, 5-9, 10-14 the ratio was 1.12, 1.69 and 1.93 respectively, with a trend towards more significant male dominancy. The difference observed in distribution of genders in different age groups, as mentioned before, was statistically significant (P-value<0.05). Further details are also demonstrated in Figure 2.This finding is in compliance with statistics reported by SEER program which refers to infancy as a “notable period” ,the only age group in which female rate of malignancy is not lower than male [21]. When we analyzed the gender distribution for each tumor category, our findings mostly matched the statistics reported by cancer research in the United Kingdom. Similar to our survey, they reported almost equal distribution of cases in different sexes, for tumors such as SNS tumors, bone tumors and miscellaneous tumors. Germ cell tumors were the only type of tumors that we observed more in female cases than men. Other tumor categories were similar to their male dominant pattern. The only tumor category in which the findings contrasted the UK reports significantly, was the renal tumors in which we had considerable male dominancy while in the report from UK there was a female dominancy in the renal tumors. We also further analyzed gender distribution in each category, across different age groups, to unmask some epidemiological patterns that might be possibly missed in general assessment. For instance, we discovered a notable female dominancy in 1-4 year old group, for SNS tumors, soft tissue sarcomas and germ cell tumors in our study.
Trend
We observed a drastic change in trend of childhood solid malignancies, as you can see in the Figure1. The total number of cases almost doubled from 2009 (54(6.9%)) to 2010 (96(12.2%)). Such trend was particularly detected in CNS and SNS tumor categories. Moreover, when we divided CNS tumors into two subcategories, one consisting of all malignant CNS tumors plus tumors with uncertain behavior like astrocytoma and the other group consisting of only malignant CNS tumors, the change in trend was more significant. 8 cases were observed (14.28% relative frequency in 2009) versus 22 cases (22.9% relative frequency in 2010) in the only malignant category comparing to 14 cases (25% relative frequency in 2009) versus 27 cases (28.12% relative frequency in 2010) in malignant plus uncertain group, showing that the only malignant CNS tumors had played a more pronounced role in the increasing pattern of overall trend in 2010 and tumors with uncertain behavior didn’t contribute. More details and 15 year trend are shown in Figures10 and 11.
Other studies on epidemiology of childhood cancers have reported significant increases of incidence statistically. Such rise is partly attributed to the improvement of diagnostic capabilities and more accurate registration of cases worldwide; however, the theories on the changes of risk factors should be interpreted in this context [5, 22-25].
Strengths and Limitations
Limitations
The findings in this report are subject to at least four noteworthy limitations:
Despite the fact that Mofid Children Hospital is one of the largest referral pediatric centers in Iran, our sample might have some biased result and might not be the best representative of the general population.
The hospital’s insurance policy didn’t cover the adolescent population, therefore, we had to exclude 15-19 year old age group.
The children with malignancies such as leukemia are usually admitted to other specialty centers. In order to prevent under reporting, despite of having considerable number of them in our hospital, we had to exclude them and limit our study only to the solid malignancies; we excluded retinoblastomas and bone tumors as well.
The change we observed in trends could have some biased result and might not be methodologically satisfactory enough which might be due to the increase number of admissions and more referrals to the hospital; however, as mentioned earlier the major role of malignant CNS tumors and SNS tumors in this increase cannot be fully explained and underestimated only with such justifications.
Strengths
Despite the rarity of cancer in children, we assessed a considerable amount of childhood malignancies in a 15 year period, in one of the largest pediatric referral centers in Iran.
All pathology records were kept well-organized at the pathology laboratory so all cases with uncertain diagnosis were excluded.
The diagnosis was confirmed by two pediatric pathologists and special tests such as immunohistochemistry had been implemented when needed.
As mentioned in the methods section, manual checks for duplicate records were performed by comparing names, age, gender, date of diagnosis, diagnosis and all duplicate cases whether due to recurrence or follow up, and they were excluded from the study.
Conclusion
Despite of all possible methodological difficulties due to the hospital-based nature of this study, the findings of changes in trend of some tumor categories can indicate a need for further research in higher level like provincial and national levels. In addition to evaluation of annual trends in our center, the gathered data can be used to do more accurate programs to control cancer and also to help the policy-makers with more evidence-based resource allocation, particularly at the hospital level. Finally, further detailed research on each tumor category is recommended and a more thorough follow-up study on survival, mortality and the survivors' quality of life is highly encouraged.
Figure 10.
Trend of CNS tumors [malignant or uncertain]
Figure 11.

Trend of malignant CNS tumors [without pilocytic astrocytoma and uncertain behavior tumors]
Acknowledgments
We wish to thank Dr. Seyed Hassan Tonekaboni Director of Medical Research and Development Center of Mofid Children's Hospital and respected members of the Research Council for approval and financial support in this study.
Footnotes
Conflicts of Interest
The authors have no conflict of interest in this article.
Authors' Contribution
Farzaneh Jadali supervised and contributed to the study design, conduction as well as writing of the manuscript. Hosein Aghayan Golkashani was responsible for the study design, data collection and analysis and also for drafting of the manuscript. Golareh Habibi revised and edited the manuscript. Mohsen Rouzrokh revised the manuscript and Fatemeh Gorji contributed to analysis.
REFERENCES
- 1.Health, United States, 2010 and US Mortality Data, 2006, National Center for Health Statistics, Centers for Disease Control and Prevention. Washington DC: U.S. Government Printing Office; 2011. [Google Scholar]
- 2.Howard SC, Metzger ML, Wilimas JA, Quintana Y, Pui CH, Robison LL, et al. Childhood cancer epidemiology in low-income countries. Cancer. 2008;112(3):461–72. doi: 10.1002/cncr.23205. [DOI] [PubMed] [Google Scholar]
- 3.Stiller CA. Epidemiology and genetics of childhood cancer. Oncogene. 2004;23(38):6429–44. doi: 10.1038/sj.onc.1207717. [DOI] [PubMed] [Google Scholar]
- 4.Kaatsch P, Steliarova-Foucher E, Crocetti E, Magnani C, Spix C, Zambon P. Time trends of cancer incidence in European children (1978-1997): report from the Automated Childhood Cancer Information System project. Eur J Cancer. 2006;42(13):1961–71. doi: 10.1016/j.ejca.2006.05.014. [DOI] [PubMed] [Google Scholar]
- 5.Spector LG, Linabery AM. Childhood cancer incidence: is it really going up? Pediatr Blood Cancer. 2009;53(1):1–2. doi: 10.1002/pbc.21994. [DOI] [PubMed] [Google Scholar]
- 6.Dreifaldt AC, Carlberg M, Hardell L. Increasing incidence rates of childhood malignant diseases in Sweden during the period 1960-1998. Eur J Cancer. 2004;40(9):1351–60. doi: 10.1016/j.ejca.2004.02.003. [DOI] [PubMed] [Google Scholar]
- 7.Bhurgri Y, Pervez S, Bhurgri A, Faridi N, Usman A, Kazi LA, et al. Increasing incidence of non-Hodgkin's lymphoma in Karachi, 1995-2002. Asian Pac J Cancer Prev. 2005;6(3):364–9. [PubMed] [Google Scholar]
- 8.Smith MA, Freidlin B, Ries LA, Simon R. Increased incidence rates but no space-time clustering of childhood astrocytoma in Sweden, 1973-1992: a population-based study of pediatric brain tumors. Cancer. 2000;88(6):1492–3. doi: 10.1002/(sici)1097-0142(20000315)88:6<1492::aid-cncr30>3.0.co;2-7. [DOI] [PubMed] [Google Scholar]
- 9.Wibmer C, Leithner A, Zielonke N, Sperl M, Windhager R. Increasing incidence rates of soft tissue sarcomas? A population-based epidemiologic study and literature review. Ann Oncol. 2010;21(5):1106–11. doi: 10.1093/annonc/mdp415. [DOI] [PubMed] [Google Scholar]
- 10.Magnani C, Dalmasso P, Pastore G, Terracini B, Martuzzi M, Mosso ML, et al. Increasing incidence of childhood leukemia in Northwest Italy, 1975-98. Int J Cancer. 2003;105(4):552–7. doi: 10.1002/ijc.11112. [DOI] [PubMed] [Google Scholar]
- 11.Stat bite: Incidence of selected childhood cancers by age group. J Natl Cancer Inst. 2004;96(24):1809. doi: 10.1093/jnci/96.24.1809. [DOI] [PubMed] [Google Scholar]
- 12.Stiller CA. Trends in neuroblastoma in Great Britain: incidence and mortality, 1971-1990. Eur J Cancer. 1993;29A(7):1008–12. doi: 10.1016/s0959-8049(05)80213-8. [DOI] [PubMed] [Google Scholar]
- 13.Parkin DM, Kramarova E, Draper G, Masuyer E, Michaelis J, Neglia JP. International incidence of childhood cancer. IARC Sci Publ. 1998;2:144. [Google Scholar]
- 14.Childhood Cancer by Site Incidence, Survival and Mortality [Internet]. 2009. Available from: http://seer.cancer.gov/csr/1975_2005/results_merged/sect_28_childhood_cancer pdf.
- 15.National estimates of incidence rates standardized to world standard population standard population [Internet] 2009. Available from: http://www-depiarcfr/accis/summaryincidencetablespdf.
- 16.Mousavi SM, Pourfeizi A, Dastgiri S. Childhood cancer in Iran. J Pediatr Hematol Oncol. 2010;32(5):376–82. doi: 10.1097/MPH.0b013e3181e003f7. [DOI] [PubMed] [Google Scholar]
- 17.Stiller C. Epidemiology of cancer in adolescents. Med Pediatr Oncol. 2002;39(3):149–55. doi: 10.1002/mpo.10142. [DOI] [PubMed] [Google Scholar]
- 18.Stiller CA, Marcos-Gragera R, Ardanaz E, Pannelli F, Almar Marques E, Canada Martinez A, et al. Geographical patterns of childhood cancer incidence in Europe, 1988-1997. Report from the Automated Childhood Cancer Information System project. Eur J Cancer. 2006;42(13):1952–60. doi: 10.1016/j.ejca.2006.05.017. [DOI] [PubMed] [Google Scholar]
- 19.Childhood cancer incidence statistics. 2011. Available from: http://infocancerresearchuk.org/cancerstats/childhoodcancer/incidence/.
- 20.Cancer Incidence and Survival Among Children and Adolescents: United States SEER Program 1975-1995. Bethesda: National Cancer Institute; 1999. [Google Scholar]
- 21.Ward EM, Thun MJ, Hannan LM, Jemal A. Interpreting cancer trends. Ann N Y Acad Sci. 2006;1076:29–53. doi: 10.1196/annals.1371.048. [DOI] [PubMed] [Google Scholar]
- 22.Adamson P, Law G, Roman E. Assessment of trends in childhood cancer incidence. Lancet. 2005;365(9461):753. doi: 10.1016/S0140-6736(05)17979-3. [DOI] [PubMed] [Google Scholar]
- 23.Linabery AM, Ross JA. Trends in childhood cancer incidence in the U.S. (1992-2004). Cancer. 2008;112(2):416–32. doi: 10.1002/cncr.23169. [DOI] [PubMed] [Google Scholar]
- 24.Baade PD, Youlden DR, Valery PC, Hassall T, Ward L, Green AC, et al. Trends in incidence of childhood cancer in Australia, 1983-2006. Br J Cancer. 2010;102(3):620–6. doi: 10.1038/sj.bjc.6605503. [DOI] [PMC free article] [PubMed] [Google Scholar]
- 25.Stiller C. Childhood Cancer in Britain: Incidence, survival, mortality. Oxford University Press. 2007 [Google Scholar]