Abstract
The thermo-responsive behavior of a unique biocompatible polymer, poly(N-substituted α/β-asparagine) derivative (PAD), has been studied with several NMR methods. The 1H and 13C solution NMR measurements of the PAD in DMSO-d6 were used to investigate the isolated polymer and perform spectral assignments. By systematic addition of D2O we have tracked structural changes due to aggregation and observed contraction of hydrophilic side chains. Solution and cross polarization / magic angle spinning (CP/MAS) 13C NMR approaches were implemented to investigate the aggregates of the PAD aqueous solution during the liquid to gel transition as the temperature was increased. At temperatures near 20 °C, all of the peaks from the PAD were observed in the 13C CP/MAS and 13C solution NMR spectra, indicating the presence of polymer chain nodes. Increasing the temperature to 40 °C resulted in a partial disentanglement of the nodes due to thermal agitation and further heating resulted in little to no additional structural changes. Deuterium T1–T2 and T2–T2 two-dimensional relaxation spectroscopies using an inverse Laplace transform, were also implemented to monitor the water–PAD interaction during the phase transition. At temperatures near 20 °C the dynamical characteristics of water were manifested into one peak in the deuterium T1–T2 map. Increasing the temperature to 40 °C resulted in several distinguishable reservoirs of water with different dynamical characteristics. The observation of several reservoirs of water at the temperature of gel formation at 40 °C is consistent with a physical picture of a gel involving a network of interconnected polymer chains trapping a fluid. Further increase in temperature to 70 °C resulted in two non-exchanging water reservoirs probed by deuterium T2–T2 measurements.
Introduction
Stimuli-responsive polymers are becoming increasingly attractive for biotechnology and pharmaceutical applications.1, 2 In particular there has been great interest in polymers exhibiting thermally reversible phase transitions. Poly(N-isopropylacrylamide) (PNIPAM) is one of the most extensively studied thermo-responsive polymers. PNIPAM exhibits a rapid and reversible hydration–dehydration in response to small temperature cycles around its lower critical solution temperature (LCST).3, 4 PNIPAM, NIPAM-containing copolymers, and PNIPAM-based cross-linked hydrogels have been widely used as matrices in a variety of applications such as in controlled drug delivery, biomedical materials, fillers for column chromatography, gene-transfection agents and as immobilized biocatalysts.5–8
Thermo-responsive polymers based on biodegradable and biocompatible poly(amino acid)s, poly(N-substituted α/β-asparagine) derivatives (PADs) that show a clear LCST and a sol–gel–sol phase transition in an aqueous solution have been developed.9–13 These poly(amino acid)s are expected to have important applications in biomedical fields due to their thermo-responsiveness, biodegradability, and high biocompatibility.14, 15 Thus far, the compounds which have shown physical properties such as a phase transition have been characterized by NMR, size exclusion chromatography, light scattering, fluorescence spectroscopy, electron microscopy, small-angle X-ray scattering, and field-flow fractionation.16–24 Among these techniques, NMR allows for observing physical characteristics without the requirement of special preparation of the samples. NMR has the additional advantage of simultaneous estimation of phase contents and dynamical properties (e.g., through relaxation times) at the same time scale. Therefore, by using NMR techniques, the dynamics, the structures, and the interactions of molecular and/or polymeric systems can be elucidated and the complex relationship between chemical structure and macroscopic behavior may be readily explored.25, 26
In this work we have used several NMR techniques to study the complex aggregation and dissociation process resulting in the liquid to gel transition of thermo-responsive aqueous solution PAD molecules. Both 13C solution and solid state CP/MAS NMR approaches were used to study the structure and dynamics of PAD molecules that gives rise to the observed phase transition.27–29 In addition, deuterium two-dimensional (2D) T1–T2 and T2–T2 relaxation spectroscopies30–32, based on an inverse Laplace transform (ILT)33, were used to monitor the distribution, dynamics, and exchange of water in the PAD–water mixture during the phase transition. The 2D T1–T2 relaxation approach has been previously used to study the dynamics and distribution of water molecules in numerous multi-compartment systems. For example, the technique was used to study the dynamical distribution of water in saturated sedimentary rock, processed starch and potato tissue, a variety of food products such as cheese and yogurt, cement paste and to probe the behavior of water in mechanically strained elastin.34–40 This relatively new experimental technique correlates the measured T1 and T2 relaxation times in a 2D map, analogous to chemical shift correlation methods (such as COSY) that are based on Fourier transformation. In the T2–T2 approach one makes use of two consecutive measurements of T2 relaxation times separated by an experimentally variable delay to probe exchange between reservoirs. The resulting 2D ILT may feature cross peaks indicating exchange between sites characterized by different T2 relaxation times. Combined with 13C NMR spectroscopy the use of the T1–T2 and T2–T2 2D schemes in this work have allowed for a direct measure of water dynamics in the aqueous solution PAD and added insight into the liquid to gel phase transition.
Experimental Section
Preparation of Thermo-responsive PAD (2)
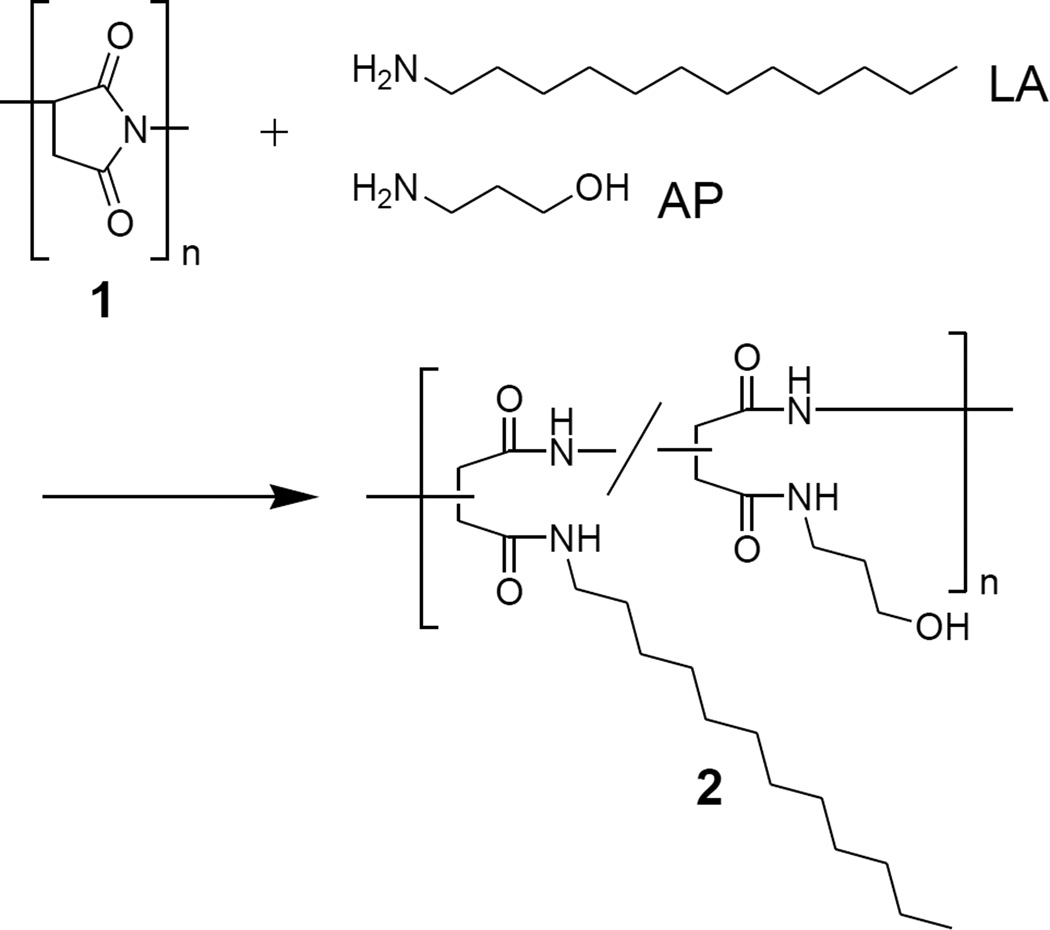
Poly(succinimide) (1) prepared by thermal polycondensation with Mw and Mw/Mn of 9.8 × 10⁴ and 1.45, respectively, was used as a precursor. The Mw and Mw/Mn of 1 was determined by size exclusion chromatography (SEC) analysis eluted by N,N-dimethylformamide (DMF) containing 0.1M LiBr with KD-804 (Shodex) column. Thermo-responsive PAD (2) was prepared from 1 with a mixture of laurylamine (LA) and 3-amino-1-propanol (AP) in DMF according to our previous work (Scheme 1).11, 13
Scheme 1.
Physical Properties
The dynamic viscosity of the PAD aqueous solutions was measured using a stress-control rheometer (Viscoanalyzer Var-50/100, Reologica Instrument, AB) equipped with a parallel plate geometry (40 mm diameter) at a heating ratio of 2.0 °C / min at a constant frequency (1.0 Hz). The temperature in all viscocity measurements was controlled to within 0.1 °C by a Peltier element.
1H and 13C solution NMR Spectroscopy
1H and 13C solution NMR spectra were obtained by using a Bruker AVANCE III 500 spectrometer operating at 500 MHz for the 1H nucleus and 125 MHz for the 13C nucleus at 25 °C. Deuterated water (D2O), dimethyl sulfoxide (DMSO-d6), and their mixture were used as solvents at a PAD sample concentration of 10 wt%. The chemical shifts were adjusted to the 1,4-dioxane methylene peak observed at 3.27 ppm for 1H NMR and 65.9 ppm for 13C NMR relative to tetramethylsilane at 0 ppm as an external standard. The conditions for 1H NMR were a 30 ° pulse angle, a 4.17 s delay between pulses, a 10.3 kHz spectral width, 32768 data points, and 4 scans. The conditions for 13C NMR were a 45 ° pulse angle, a 5.5 s delay between pulses, a 29.7 kHz spectral width, 65536 data points, and 2048 scans. The 1H–1H correlation spectroscopy (H–H COSY) spectrum was acquired in magnitude mode using 1 scan for each of the 128 t1 increments, a 1.97 s recovery delay, spectral widths in f1 and f2 of 5.8 kHz, an acquisition time of 0.176 s, and 10.0 µs 90 ° 1H pulses. Data were processed with sine bell weightings and zero-filled to a 1024 × 512 data matrix. The 1H–13C heteronuclear single quantum coherence (HSQC) spectrum was acquired in phase sensitive mode using 8 scans for each of the 256 t1 increments, a 1.5 s recovery delay, spectral widths in f1 and f2 of 8.8 and 5.0 kHz respectively, an evolution delay (2J)−1 = 3.45 ms, an acquisition time of 0.102 s, a 10.0 µs 90 ° 1H pulse, and a 10.0 µs 90 ° 13C pulse. Data were processed with squared sine bell weightings and zero-filled to a 1024 × 1024 data matrix.
13C CP/MAS NMR Spectroscopy
13C CP/MAS NMR spectra were recorded on a Chemagnetics CMX300 spectrometer operating at 75.6 MHz for 13C observation. These measurements were carried out on a 10 wt% D2O solution of sample 2-B at 25, 40, 50, 60, and 70 °C. The temperature was calibrated by using Pb(NO3)2 based on previous literature.41 The sample was contained in a cylindrical rotor made of zirconia and spun at 3 kHz. For cross polarization, the contact time was set to 3 ms and the pulse sequence recycle time was 5 s. The 13C 90 ° pulse length was approximately 5.5 µs. The 13C NMR chemical shifts were calibrated indirectly through the methylene peak of adamantane observed at 28.8 ppm relative to tetramethylsilane at 0 ppm.
13C Dipolar Decoupling / Magic Angle Spinning (DD/MAS) NMR Spectroscopy
13C DD/MAS NMR spectrum was recorded on a Chemagnetics CMX300 spectrometer measured with an approximately 1.8 µs 30 ° pulse length and 10 s pulse sequence recycle time. In these experiments the sample was also spun at 3 kHz. The measurement was carried out on a 10 wt% solution of sample 2-B in D2O with at 25 °C, operating at 75.6 MHz for 13C observation.
Deuterium 2DT1–T2, T2–T2 Correlation Experiments
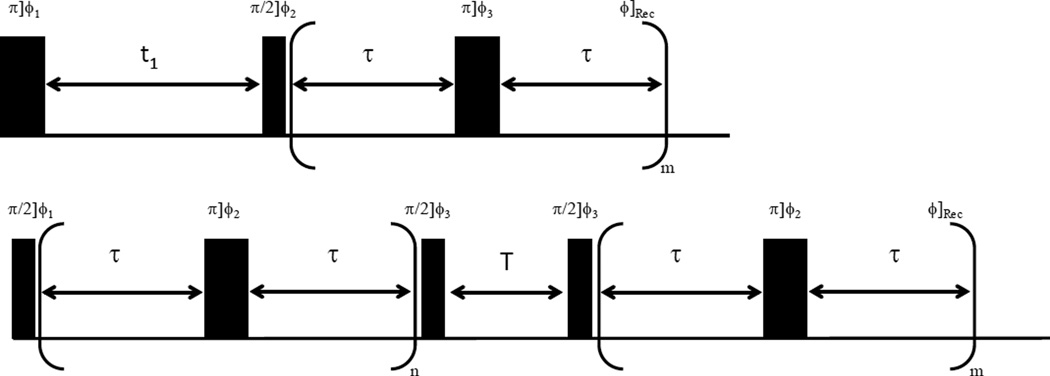
All of the experiments were carried out on a Varian Unity 200 MHz NMR spectrometer with a liquids probe. The radiofrequency pulse sequences for the T1–T2 and T2–T2 experiments used in this study are illustrated in Figure 1.31–33 The deuterium 90 ° pulse length was calibrated to 35 µs; the effect of this pulse width on the measured spin dynamics is negligible as the measured relaxation times were on the order of milliseconds. For the PAD sample 2-B the T1–T2 experiments were conducted at 20, 30, 40, 50, 60, and 70 °C. Additionally, T2–T2 exchange experiments were performed on PAD sample 2-B at 70 °C. Temperature throughout all studies was maintained within 2 °C. In the T1–T2 experiment shown in Figure 1 the magnetization is inverted by the initial 180 ° pulse and then recovers to thermal equilibrium during the variable delay t1 by relaxation time T1. The 90 ° pulse following the delay t1 rotates the magnetization into the transverse plane and the NMR signal is stroboscopically detected with a Carr–Purcell–Meiboom–Gill (CPMG) pulse train with τ set to 0.350 ms.42 Using a 2D ILT of the data, a T1–T2 correlation map is obtained. In the T2–T2 experiment an initial CPMG pulse train is applied by varying the number of applied 180 ° pulses denoted m in Figure 1. Following the initial CPMG pulse train a 90 ° pulse is applied to store the magnetization along the azimuthal axis for a time T. After the variable storage time T, the nuclear spins are again returned to the transverse plane and the T2 is measured with a stroboscopically detected CPMG train. Different than the T1–T2 correlation experiment, this approach correlates T2 relaxation times and allows for the probing of exchange between reservoirs distinguishable on the NMR time scale; water molecules exchanging between reservoirs correspond to cross peaks in the resulting T2–T2 ILT map. In the T1–T2 experiments t1 was logarithmically incremented from 1 ms to 10 s in 100 steps to enable an accurate measurement of T1 values from 10 ms to 1 s and m = 6000 points were stroboscopically collected for the T2 measurement. In the T2–T2 experiments the number of loops denoted n in the first CPMG train varied logarithmically from 1 to 6000 in 100 steps, and in the second dimension m = 6000 points were stroboscopically detected. In all experiments 16 scans were accumulated with a recycle delay of 10 s.
Figure 1.
Top) Radio frequency pulse sequence used for the 2D T1–T2 correlation experiments in this work; the phase cycling used was φ1 = {x, −x}, φ2 = {x, x, −x, −x}, and the receiver phase was φRec = {x, x, −x, −x}. In the experiment, the ω pulses where toggled as φ3 = {y,−y}. The details regarding the experimental values for m, t1 and τ are described in the text. Bottom) Radio frequency pulse sequence used for the 2D T2–T2 exchange measurements in this work; the phase cycling used was φ1 = {x, −x}, φ3 = {x, x, −x, −x} and the receiver phase was φRec = {x, −x}. The ω pulses were toggled using the phase scheme φ2 = {y, −y} and experimental values for time τ, the variables n and m, and the exchange time T are described in the text.
Results and Discussion
Physical Properties
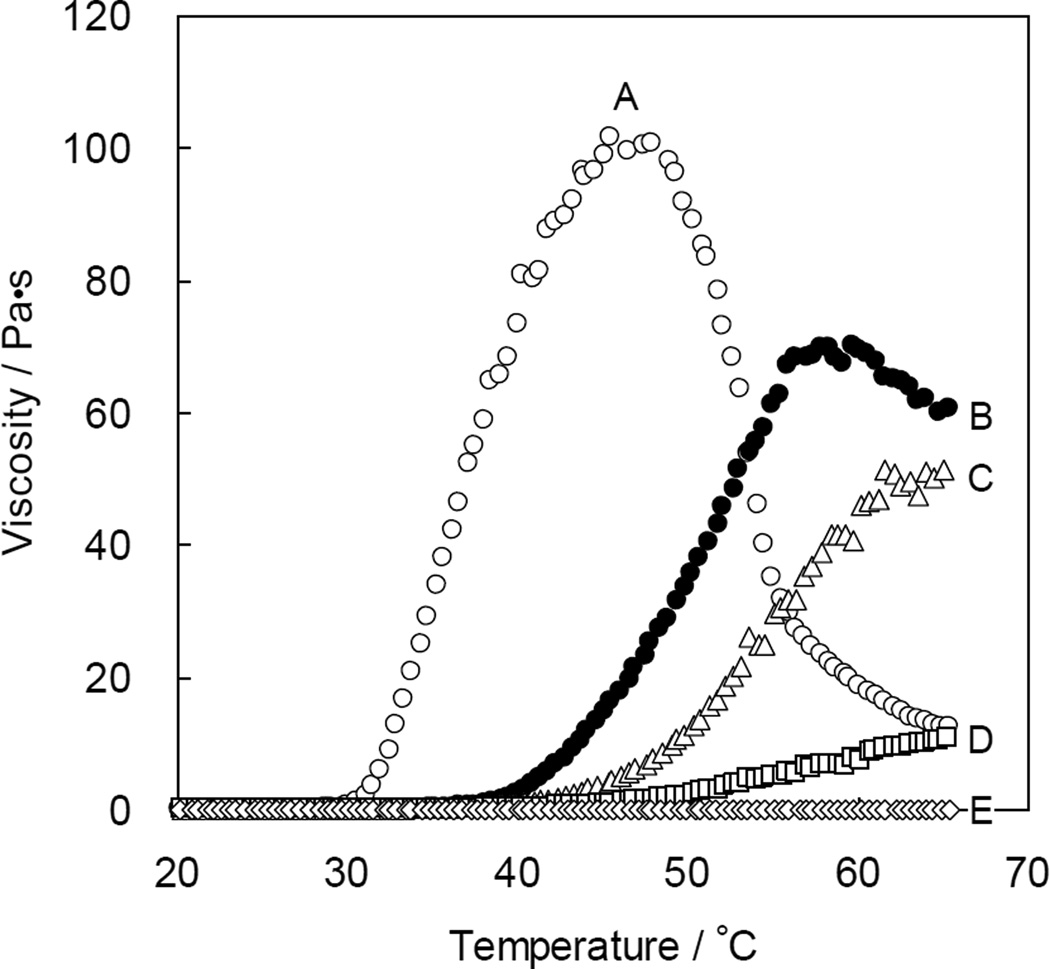
The viscosity of 10 wt% aqueous solution 2 was measured in the temperature range of 10 °C to 65 °C (Figure 2). The viscosity of the polymer solution with a higher content of LA as a hydrophobic alkyl group increased at lower temperature, and the maximum observed viscosity was higher than in other samples studied. On the other hand, the polymer solution with low content of LA such as sample 2-E did not show a strong thermo-responsive behavior. The 10 wt% aqueous solution of polymer sample 2-B showed a significant increase in viscosity around 40 °C and the maximum viscosity of this polymer solution was approximately 70 Pa·s at 58 °C. With further heating, the viscosity of sample 2-B decreased gradually; the observed thermo-responsive behavior was reproducible as the heating and cooling processes were repeated. Subsequent elucidation of the thermo-responsive behavior was carried out on sample 2-B.
Figure 2.
Temperature dependence of the viscosity of 10 wt% aqueous solutions of PAD sample 2; (A) LA/AP = 25/75, (B) LA/AP = 20/80, (C) LA/AP = 15/85, (D) LA/AP = 10/90, (E) LA/AP = 5/95. The rheometry measurements were carried out at a frequency of 1.0 Hz at a heating rate of 2.0 °C / min.
Assignment of 1H and 13C NMR Spectra of PAD
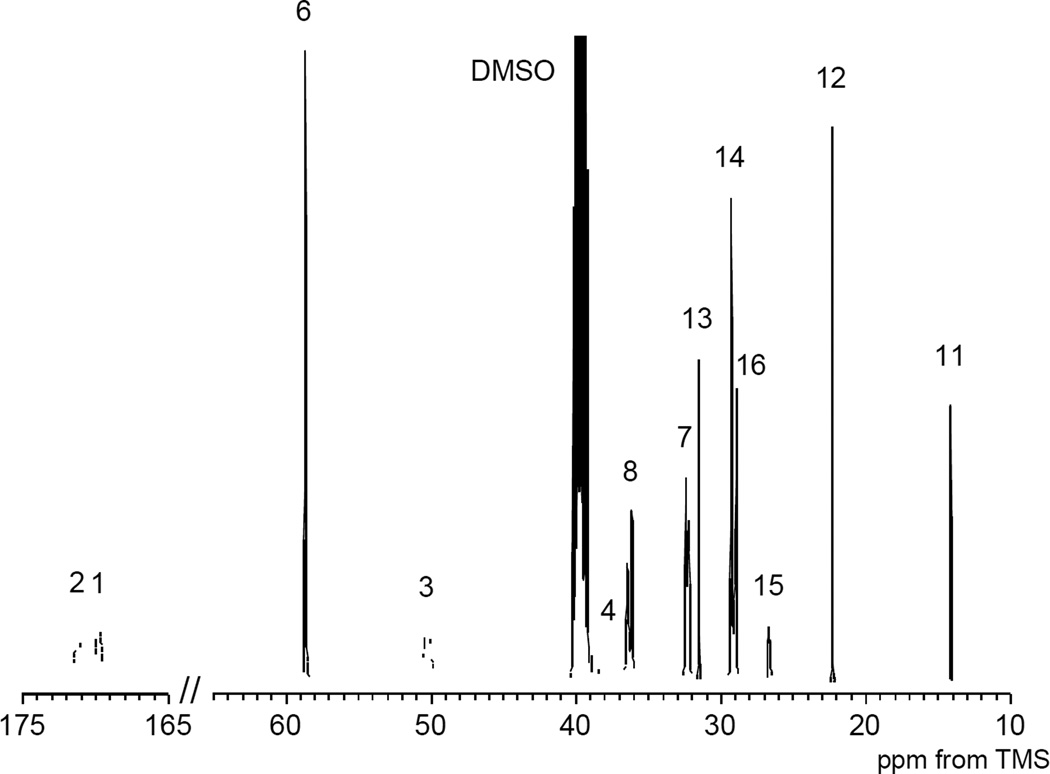
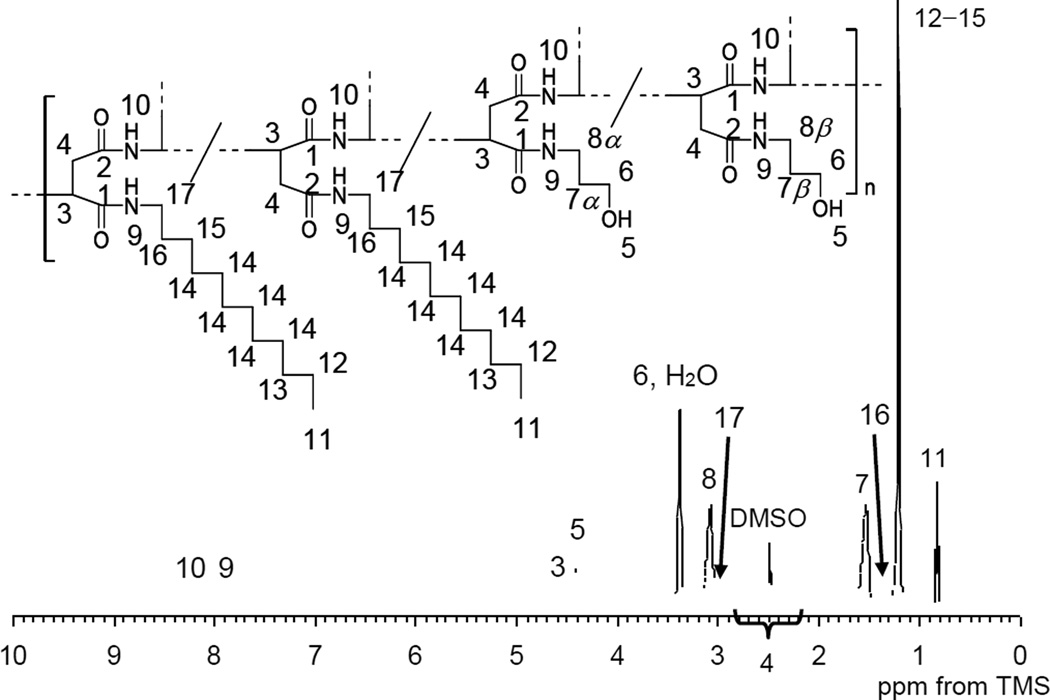
The structural analysis of the synthesized PAD was carried out in DMSO-d6 by NMR to keep the uncondensed and isolated structural information in detail; the observed thermal characteristics of the PAD sample were no different in DMSO than in water. The 1H and 13C NMR spectra of sample 2-B in the DMSO-d6 and assignments are shown in Figures 3 and 4 respectively. The assignments of the signals were obtained by a combination of the following methods that are detailed below: (1) the relative peak intensities in the NMR spectra, (2) analysis of the 1H–1H and/or 1H–13C connectivity in the conventional 2D NMR spectra and (3) the measured chemical shifts.
One key finding of our experimental results is the observation that the signal at 47.4 ppm disappeared completely in the 13C NMR spectrum (Figure 4) suggesting that all of the succinimide units converted into the N-substituted α/β-amide unit. The two carbonyl carbons adjacent to the methine (C-1) and methylene (C-2) carbons were assigned to the peaks at 169.8 and 171.2 ppm, respectively, in the 2D-INADEQUATE spectrum.43 The broad signal at 50.3 ppm was correlated to the methine carbon C-3 in the main chain and the broad signal at approximately 37.0 to 38.5 ppm was assigned to the methylene carbon C-4 in the main chain.44 The protons around 4.30–4.70 ppm (H-3) and 2.20–2.80 ppm (H-4) were directly attached to C-3 and C-4, respectively, in the HSQC spectrum. Based on the corresponding chemical shift the signal at 58.6 ppm was assigned to the methylene carbon C-6 adjacent to the hydroxyl group in the hydrophilic side chain that was derived from AP. The protons at 3.38 ppm (H-6) were directly bonded to C-6. The proton denoted H-6 resulted in a cross peak to the signal at 1.53 ppm (H-7). The proton denoted H-7 also gave cross peak to the signal at 3.08 ppm (H-8) and finally H-8 was coupled to the proton of the amide group (H-9). In addition, the carbons that were directly attached to H-7 and H-8 were assigned in the HSQC spectrum. The signals at 7.89 ppm (H-9) and 8.20 ppm (H-10) were assigned to the protons derived from the amide group in the side chain (directly attached to the methylene carbon) and in the main chain (directly attached to the methine carbon), respectively. In the same way as the assignment of the side chain from AP the long alkyl hydrophobic side chain derived from LA was assigned from the terminal methyl carbon at 14.1 ppm (C-11) and proton at 0.83 ppm (H-11). However, the signal of the methylene carbon (C-17) adjacent to the amide group was not observed because of partial overlap from the DMSO-d6 signal. The composition ratio of the side chain in sample 2-B was determined by the integrated ratio of peaks of the methyl proton of LA (3H, 0.83 ppm) and the central methylene protons derived from AP (2H, 1.53 ppm) in the 1H NMR spectrum.
Figure 4.
13C NMR spectrum of PAD sample 2-B in DMSO-d6 (10 wt%). The numbers in the spectrum corresponds to those in Figure 3.
Structural Features of Thermo-responsive PAD in Water
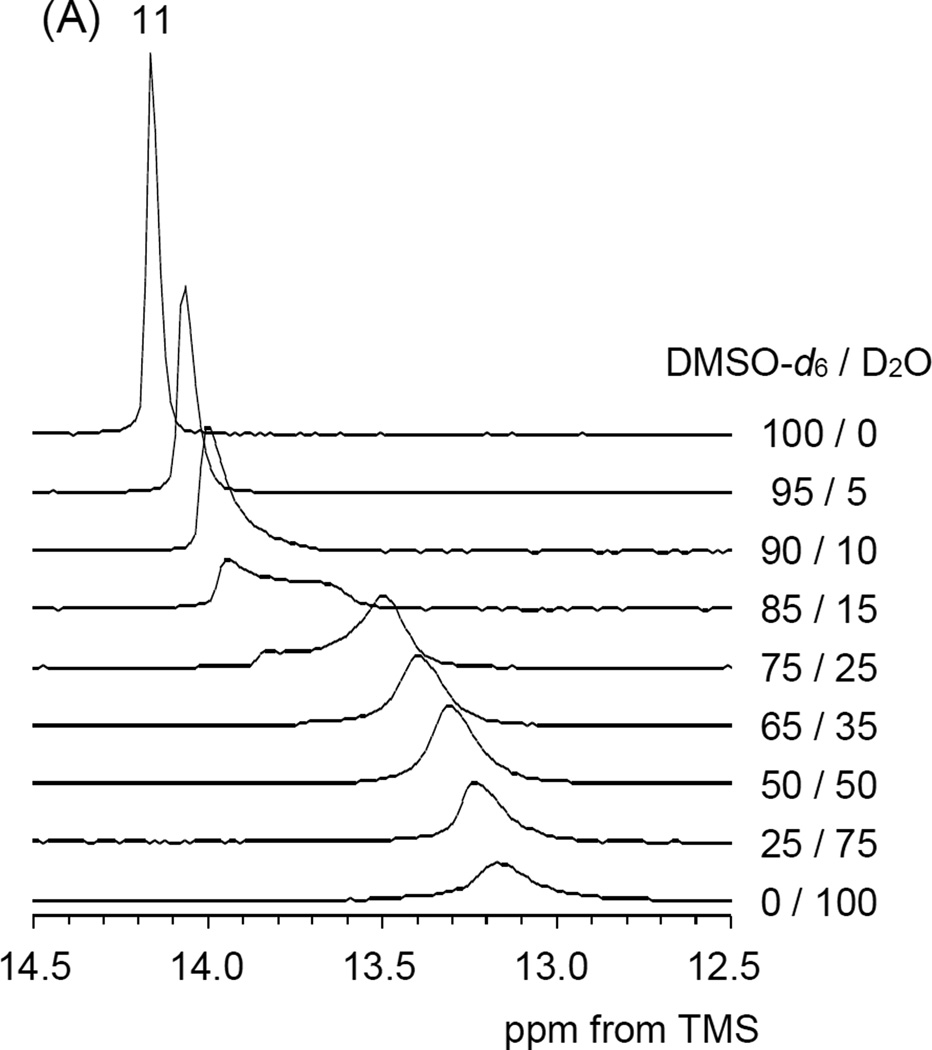
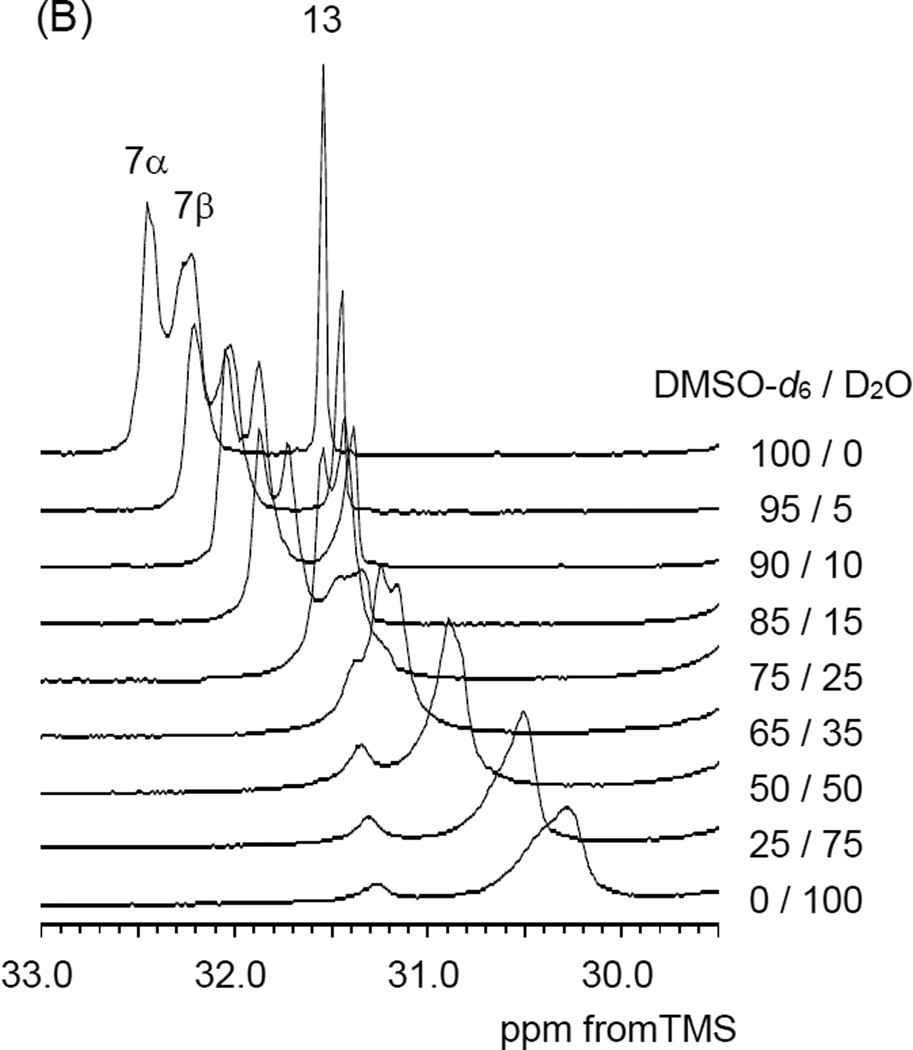
The structure of the thermo-responsive polymer sample 2-B in water was revealed by tracking changes in the chemical shifts and peak widths by gradually adding D2O to the DMSO-d6 solution. As a reference for the chemical shift and peak intensity, 1,4-dioxane was used. With increasing the D2O ratio all of the peaks in both 1H and 13C NMR spectra were broadened gradually. Such spectral broadening indicates a decrease in the mobility of polymer chain in water compared with that in DMSO. The terminal methyl group in the LA unit (C-11) and the central methylene group in the AP unit (C-7) showed a change in the 13C chemical shifts in addition to spectral broadening. The amount of the C-11 upfield shift was approximately 1.0 ppm and this shift was observed between the 75–85 % DMSO-d6 ratio in Figure 5 (A). Referring to Figure 5 (B) the amount of the C-7 upfield shift was also approximately 2.0 ppm. These upfield shifts are due to the γ-gauche effect in the 13C chemical shift.45 More specifically the terminal part in the LA side chain and the central part in the AP side chain appeared to change local conformation from all-trans to partial-gauche conformation in aqueous solution.
Figure 5.
Expanded PAD 13C NMR spectra as a function of the DMSO-d6 and D2O ratio (A) terminal methyl carbon region of the LA side chain, (B) central methylene carbon region of the AP side chain.
Structural Change of Thermo-responsive PAD with Heating
In general, 13C CP/MAS NMR peaks can be observed when strong nuclear spin dipolar interactions between carbons and protons exist. The observation of a high signal intensity in the 13C CP/MAS NMR spectra indicates restricted or anisotropic motion of 1H–13C dipolar interactions, but weaker or no peaks may be due to a high degree of isotropic mobility and/or an increased separation between 1H–13C nuclear distances. Thus, 13C CP/MAS NMR is a powerful tool for elucidating dynamical and structural features of the restrained part of sample 2-B in water. On the other hand the mobile component of sample 2-B in water was observed by 13C solution NMR methods. Thus, both the 13C CP/MAS NMR and 13C solution NMR spectra were observed with a 10 wt% D2O solution of sample 2-B as a function of temperature to monitor the changes in the mobility of the PAD chain in aqueous solution.
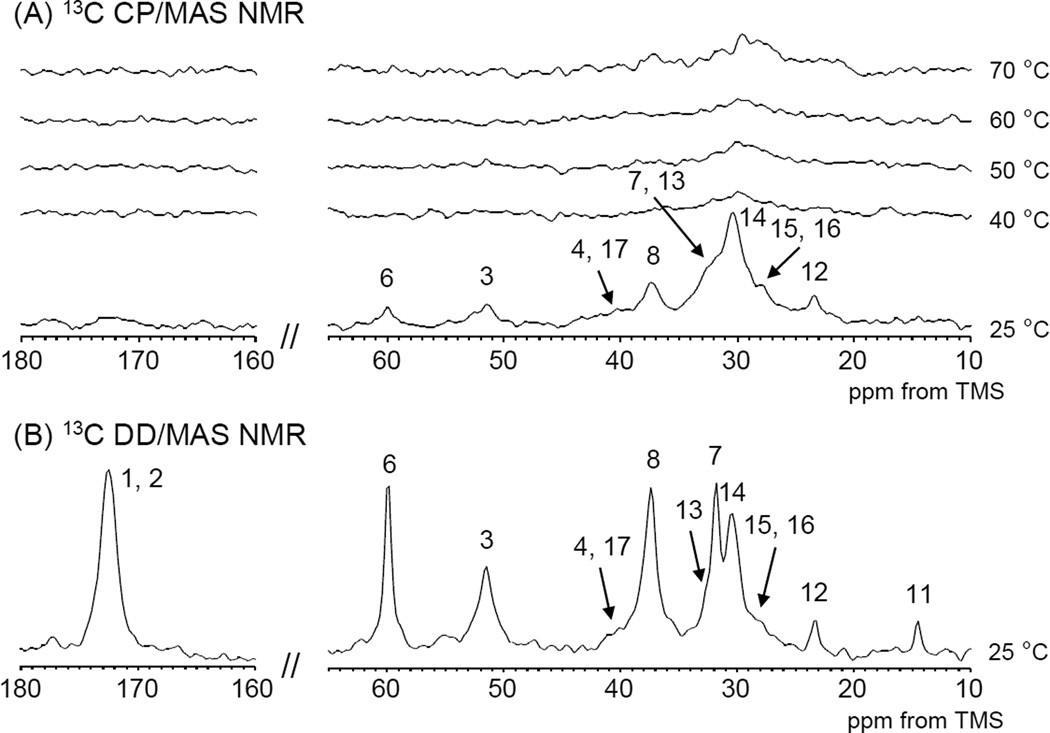
The 13C CP/MAS NMR spectra over a wide range of temperatures are shown in Figure 6 (A) together with 13C DD/MAS NMR spectrum at 25 °C in Figure 6 (B).
Figure 6.
(A)13C CP/MAS NMR spectra of PAD sample 2-B in D2O(10 wt%) as a function of temperature, (B)13C DD/MAS NMR spectrum of PAD sample 2-B in D2O(10 wt%) at 25 °C used for spectral assignment.
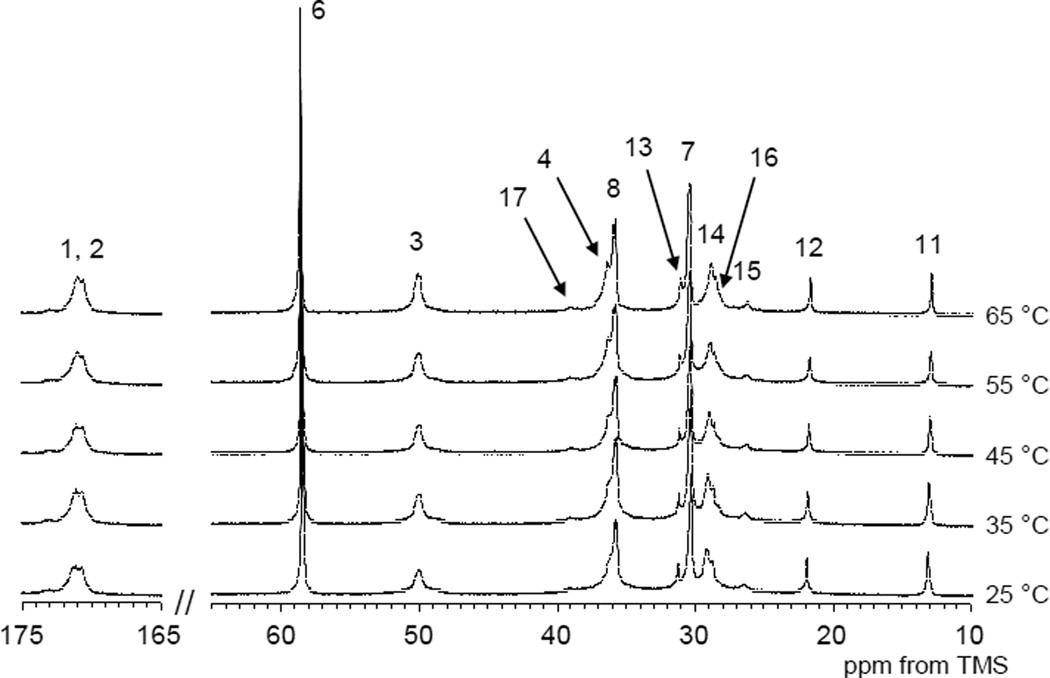
Most of the peaks except for the carbonyl carbon in the hydrophilic amide group and the terminal methyl group in the LA side chain were observed in the 13C CP/MAS NMR spectrum at 25 °C. Above 40 °C few 13C CP/MAS NMR peaks could be observed except for small alkyl peak. On the other hand the 13C solution NMR spectra were almost unchanged in both peak intensity and chemical shift (Figure 7) over temperature range studied.
Figure 7.
13C solution NMR spectra of PAD sample 2-B in D2O (10 wt%) at various temperatures.
These experimental findings appear to indicate that PAD molecules in aqueous solution are in a highly mobile state over the observed temperature range even at 25 °C. Only at 25 °C were all the peaks from the PAD observed in the 13C CP/MAS NMR spectra indicating the formation of strong interconnected polymer chains nodes, or polymer chains in very close proximity to one another. Increasing the temperature appears to result in a partial disentanglement of the nodes resulting from mobility or separation of the polymer chains and subsequent further heating results in little to no further structural variation.
Monitoring of the Water–PAD Interaction
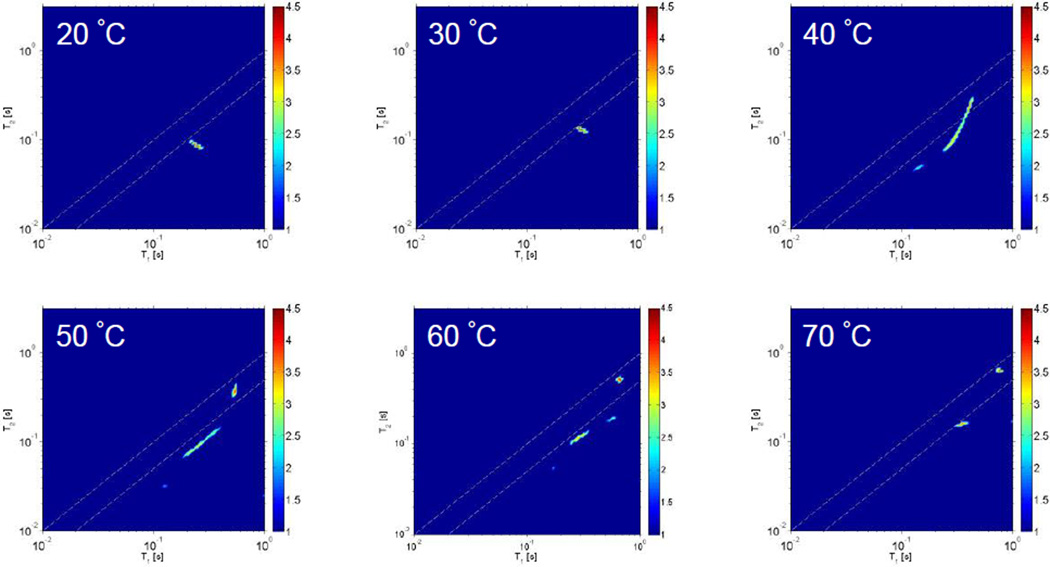
Deuterium T1–T2 and T2–T2 2D relaxation spectroscopies, using an ILT, were used to determine the dynamics, distribution and exchange of waters of hydration to monitor the water–PAD interaction during the phase transition.31 In the T1–T2 experiment the T2 relaxation times of a system are measured as a function of separate inversion recovery experiments that probe the T1 relaxation times. As described in ref 30, applying a 2D ILT of the experimental data the T1 and T2 NMR relaxation times are correlated and manifested into a peak in the 2D ILT map. The resulting 2D T1–T2 ILT maps at various temperatures are shown in Figure 8.
Figure 8.
Deuterium 2D T1–T2 ILT maps of PAD sample 2-B in D2O (10 wt%) as a function of temperature. The dashed lines in the images are intended to guide the eye for the region of the 2D map where T1 is approximately equal to T2. The signal intensity indicated by the color bar is on a logarithmic scale.
Referring to Figure 8, only one peak is observed in the T1–T2 map at 20 and 30 °C. At these temperatures T1 ≅ T2 indicating that the deuterium nucleus undergoes nearly isotropic and unrestricted motion. However, above 40 °C, several peaks are revealed in the T1–T2 map indicating at least three distinguishable reservoirs of water with different dynamical characteristics over the time scale of our measurement. For deuterium (spin I = 1) the 2H–2H dipolar interactions are usually negligible relative to the quadrupolar interaction and the expressions for T1 and T2 are given by46
In the above expressions Cq = {[eQ/ħ][∂2V/∂2z]}2 is the quadrupolar coupling constant, η is the asymmetry parameter of the potential V (η = 0 for 2H in water) and J(ω) is termed the spectral density function and is given by
In the spectral density function τc is termed the correlation time that characterizes the interaction of the nuclear quadrupolar moment with the electric field gradient. For the case of 2H in D2O the quadrupolar interaction is intramolecular in origin and the correlation time quantifies the tumbling nature of the molecule; a large correlation time corresponds to reduced tumbling motion of an individual water molecule. Using the above theoretical formalism the measured ratio of T1 and T2 allows for a determining the correlation time.
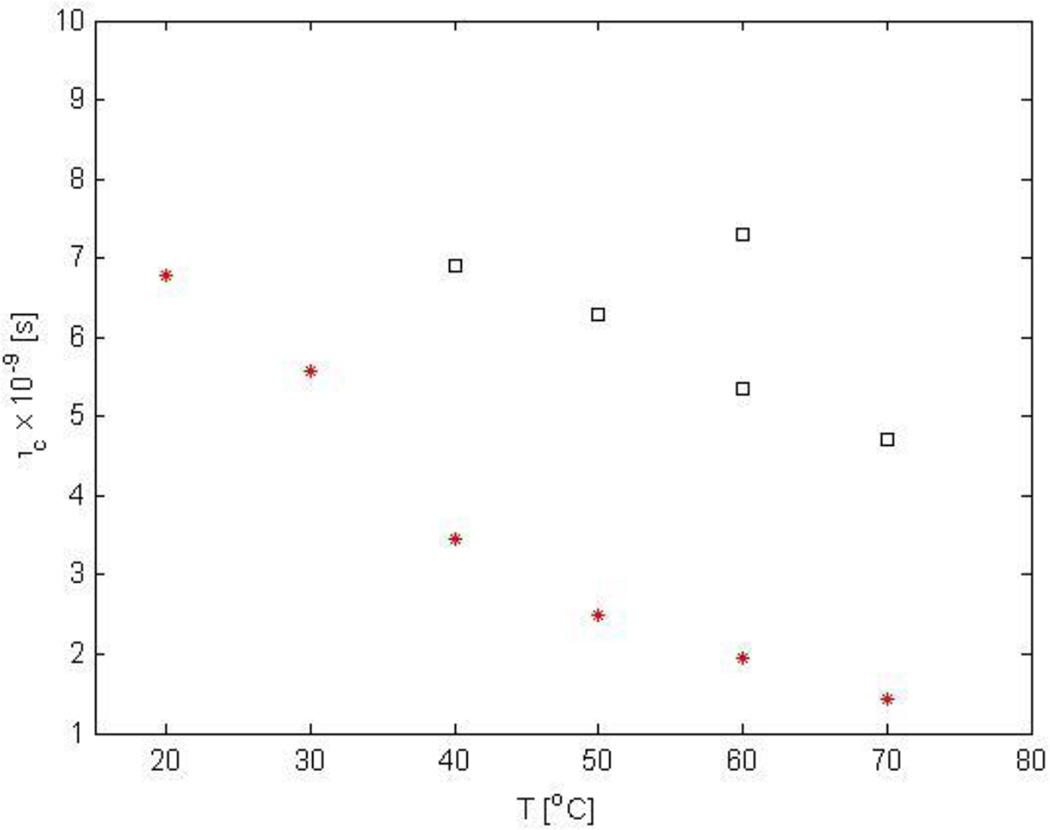
Table 1 summarizes the measured relaxation times at each temperature and the corresponding correlation times and relative proportions for each component observed in Figure 8. Any peak in the 2D ILT map provides a distribution of T1 and T2 values. The entries in Table 1 following a ± symbol should not be interpreted as experimental error bars but reflect the distribution of T1 and T2 values in a given peak in the 2D map. In addition, the number shown for the correlation time following the ± symbol again are not to be interpreted as experimental error bars but are propagated from the distribution of T1 and T2 values. The correlation times were plotted against temperature in Figure 9.
Table 1.
Summary of the measured T1 and T2 of the various components observed in the 2D T1–T2 ILT map of water in the PAD sample. As described in the text, the correlation time (τc) is determined from the ratio of T1 to T2 and quantifies the tumbling of the D2O molecule; the number following the ± symbol is not an error bar, but expresses the distribution of T1 and T2 values in the 2D ILT map which is propagated into the computation of τc. In cases where the T1–T2 ILT map was broadly distributed (at 40 and 50 °C, refer to Figure 8) the distribution value for T1 and T2 could not be accurately determined. The relative proportion was also determined based on the integrated signal intensity in the 2D T1–T2 ILT map at every temperature.
| Temperature (°C) | T1 (s) | T2 (s) | τc × 10−9 (s) | Relative Proportion |
|---|---|---|---|---|
| 20 | 0.247 ± 0.022 | 0.085 ± 0.005 | 6.78 ± 1.02 | 1 |
| 30 | 0.312 ± 0.016 | 0.129 ± 0.007 | 5.58 ± 0.68 | 1 |
| 40 | 0.413 | 0.245 | 3.45 | 0.976 |
| 0.142 ± 0.014 | 0.048 ± 0.002 | 6.90 ± 0.96 | 0.024 | |
| 50 | 0.546 ± 0.025 | 0.389 ± 0.042 | 2.50 ± 0.80 | 0.654 |
| 0.259 | 0.096 | 6.29 | 0.346 | |
| 60 | 0.658 ± 0.031 | 0.521 ± 0.029 | 1.95 ± 0.50 | 0.641 |
| 0.572 ± 0.051 | 0.183 ± 0.009 | 7.29 ± 0.90 | 0.035 | |
| 0.285 ± 0.037 | 0.122 ± 0.020 | 5.36 ± 2.00 | 0.324 | |
| 70 | 0.756 ± 0.036 | 0.658 ± 0.037 | 1.43 ± 0.57 | 0.643 |
| 0.343 ± 0.033 | 0.163 ± 0.009 | 4.72 ± 0.92 | 0.357 |
Figure 9.
Measured correlation times of water in PAD sample 2-B (10 wt%) as a function of temperature. The figure is replicates the information tabulated in Table 1, which is determined from the T1 and T2 values in figure 8, with the error bars removed for clarity. One component of the water (red stars) observed in the 2D ILT maps is observed at all temperatures characterized by a correlation time that decreases monotonically with increasing temperature. At 40, 50, 60, and 70 °C at least two components of water are revealed (black squares).
Our experimental data indicate that the measured correlation times are much larger than that of free water (free water has a correlation time on the order of 10−12 s at 20 °C). The reduced tumbling motion of the water molecule at any given temperature is due to the interaction with PAD chains that are present in the solution. The experimental data indicate a difference in mobility among the various sites at the different temperatures. One correlation time was obtained at 20 °C (6.78 ± 1.02 ns) and decreases when the temperature of the sample is raised to 30 °C (5.58 ± 0.68 ns), indicating an increase in the mobility of water molecules. However, increasing the temperature to 40 °C several water reservoirs are observed with different correlation times, which is the same temperature when the viscosity just starts to increase (Figure 2). The correlation times at 40 °C are largely distributed and at 50 °C, the tendency is similar, but also separates into two groups. Specifically, we observe one short correlation time (2.5 ± 0.80 ns) and a second correlation time ranging between 6.0 to 7.0 ns. At 60 °C, the distribution is similar. Specifically, we observe one short correlation time (1.95 ± 0.50 ns) and a second group of water reservoirs having a correlation times between 5 and 7 ns. At 70 °C, the experimental T1–T2 map reveals only two water reservoirs. Even at this temperature, where the viscosity of the sample is significantly higher than that at room temperature, we find that the correlation times of the water molecules differ by approximately a factor of 3 (1.43 ± 0.57 and 4.72 ± 0.92 ns).
The plots of the smallest τc value against temperature show a monotonic decrease (Figure 9, red stars), which indicates an increase in the mobility of one of the reservoirs; the fraction of these component was constant, 0.65 between 50 °C to 70 °C. From 60 °C to 70 °C, two τc values decrease, which appears to be correlated to the decrease in the viscosity shown in Figure 2. The most interesting phenomena is the appearance of the groups with larger τc values at 40 °C compared with the τc value at 30 °C. This corresponds to large increase in viscosity in Figure 2 which persists until 50 °C. Thus, the behavior of the large correlation times of water appears to be correlated to the observed changes in viscosity from 40 °C to 70 °C. It should be pointed out that at 40 °C and 50 °C the T1–T2 maps were widely distributed (Figure 8) due to a broad range of measured T1 and T2 values resolved by the ILT approach. As a consequence an accurate measurement of the T1 and T2 values and τc were not possible for one component at these temperatures.
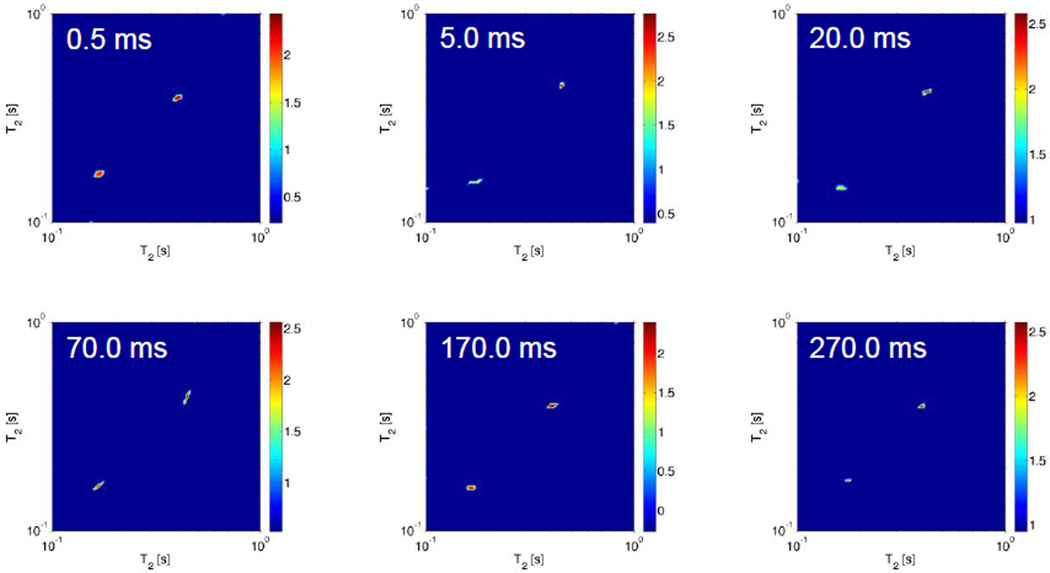
Figure 10 highlights the measurements of the T2–T2 exchange experiments performed at 70 °C on the PAD sample 2-B. As discussed earlier this experimental approach allows for probing exchange between sites; exchange between two reservoirs with distinguishable T2 relaxation times result in cross peaks in the resulting 2D ILT map. In Figure 10 we show experimental measurements where the exchange time T (Figure 1) was varied from 0.5 ms to 270.0 ms. Our experimental data indicate that the two sites do not exchange over the time scale probed (experimentally many intermittent times as well as for times less than 0.5 ms and greater than 270.0 ms were studied, however no cross peaks were observed).
Figure 10.
Deuterium 2D ILT map of the T2–T2 exchange measurements performed at 70 °C of PAD sample 2-B in D2O (10 wt%). In the results shown, the mixing time T (refer to figure 1) was experimentally varied from 0.5 ms to 270.0 ms. As discussed in the text, the observation of a cross peak would indicate exchange between the two sites, however none was observed over the exchange times probed. The signal intensity in all cases indicated by the color bar is on a logarithmic scale.
Referring to Figure 2, 40 °C corresponds to the temperature where the aqueous PAD sample exhibits a large change in viscosity. As discussed earlier, at this temperature the 13C CP/MAS NMR data indicated partial disentanglement of the nodes by thermal agitation of the polymer chains. In addition, at temperatures up to 60 °C, the aggregates disentangle and expand by activated molecular mobility and many reservoirs characterized by water having different dynamical characteristics are observed. By further heating, the T1–T2 and T2–T2 the experimental data suggest that the PAD aqueous solution appears to divide into two phases between the restrained water in the polymer rich phase and the water which is removed from the polymer phase at 70 °C.
Proposed Behavior of Thermo-responsive PAD
A cartoon of the thermo-responsive behavior of the amphipathic PAD aqueous solution revealed by the 13C CP/MAS NMR, 13C solution NMR, and 2D T1–T2 and T2–T2 NMR results is schematically depicted in Figure 11.
Figure 11.
A cartoon representation highlighting the thermal behavior of the aqueous PAD as a function of temperature. In the figure, spheres denote water molecules, black lines denote PAD chains and red is used to indicate restricted motion of the polymer chains due to inter-chain interactions, such as nodes. As described in the text, near 20 °C, polymer chain nodes are present and surrounding water has only one nearly isotropic dynamical characteristic over the time scale of the measured T1 and T2 relaxation times (refer to Figure 8). With increasing temperature, polymer chain nodes are broken due to thermal agitation resulting in the formation of a gel characterized by a network of PAD molecules with at least three interspersed reservoirs of water characterized by different dynamical characteristics (refer to Figure 8). At 70 °C only two water reservoirs are observed that do not exchange (refer again to Figures 8 and10).
At temperatures near 20 °C the PAD molecules are dispersed homogeneously in an aqueous media although some chains form nodes; these aggregates are also uniformly dispersed in water. At this temperature water molecules exhibit only one dynamical characteristic as evidenced by a single T1 and T2 relaxation times highlighted in Figure 8. Molecular mobility is activated with increasing temperature above 20 °C resulting in disentanglement and expansion of the aggregates; solid-like structures present at 20 °C disappear as evidenced by the reduction of the 13C CP/MAS signal when the temperature was increased from 25 °C to 70 °C highlighted in Figure 6A.
One simple physical picture of a gel involves connected polymer chains that entrap a fluid. Near 40 °C several peaks are observed in the deuterium 2D T1–T2 map indicating different water reservoirs characterized by distinguishable dynamical characteristics; at this temperature the PAD would appear to form a complex network that encases surrounding water molecules. By subsequent heating above 60 °C, molecular mobility is increased and the PAD network is divided into two phases between the restrained water which is captured into the polymer rich phase and the more mobile water which is removed from the polymer phase. Above 60 °C the viscosity of the polymer solution is reduced due to further thermal agitation resulting in a weakening of the polymer network that was formed in the gel state.
Conclusions
This study aimed to elucidate the behavior of a thermo-responsive amphiphilic poly(N-substituted α/β-asparagine) derivative that exhibits a significant viscosity change with increasing temperature in an aqueous solution. The detailed polymer structure at various temperatures was analyzed by 13C solution and CP/MAS NMR techniques, and the dynamical characteristics and distribution of the surrounding waters of hydration were studied by 2D T1–T2 and T2–T2 NMR methodology. It is expected that detailed knowledge of this unique thermo-responsive behavior presented herein may allow for further enhancement of the thermo-responsive behavior as well as novel targeted applications.
Figure 3.
1H NMR spectrum of PAD sample 2-B in DMSO-d6 (10 wt%).
Acknowledgements
The authors acknowledge support from Grant-in-Aid for Scientific Research from Ministry of Education, Science, Culture and Supports of Japan (23245045,25620169) and a Grant from the Ministry of Agriculture, Forestry and Fisheries of Japan (Agri-Health Translational Research Project). Research performed at Brooklyn College of the City University of New York was supported from award No. SC1GM086268-04 from the National Institute of General Medical Sciences. The content is solely the responsibility of the authors and does not necessarily represent the official views of the National Institute of General Medical Sciences or the National Institutes of Health (NIH). The authors thank Yi-Qiao Song of Schlumberger-Doll Research for allowing us to implement the ILT algorithm used in this study.
References and Notes
- 1.Stuart MAC, et al. Nature Materials. 2010;9:101. doi: 10.1038/nmat2614. [DOI] [PubMed] [Google Scholar]
- 2.Hoffman AS. Advanced drug delivery reviews. 2013;65:10. doi: 10.1016/j.addr.2012.11.004. [DOI] [PubMed] [Google Scholar]
- 3.Heskins M, Guillet JE. J. Macromol. Sci. Chem. Ed. 1968;A2:1441. [Google Scholar]
- 4.Chen G, Hoffman AS. Nature. 1995;373:49. doi: 10.1038/373049a0. [DOI] [PubMed] [Google Scholar]
- 5.Uyama H, Kobayashi S. Chem. Lett. 1992:1643. [Google Scholar]
- 6.Kurisawa M, Yokoyama Y, Okano T. J. Controlled Release. 2000;68:1. doi: 10.1016/s0168-3659(00)00246-7. [DOI] [PubMed] [Google Scholar]
- 7.Tuncel A, Ünsal E, Çicek H. J. Appl. Polym. Sci. 2000;77:3154. [Google Scholar]
- 8.Guan Y, Zhang Y. Soft Matter. 2011;7:6375. [Google Scholar]
- 9.Kang HS, Yang SR, Kim J-D, Han S-H, Chang I-S. Langmuir. 2001;17:7501. [Google Scholar]
- 10.Tachibana Y, Kurisawa M, Uyama H, Kakuchi T, Kobayashi S. Chem. Commun. 2003:106. doi: 10.1039/b210181e. [DOI] [PubMed] [Google Scholar]
- 11.Watanabe E, Tomoshige N. Chem. Lett. 2005:876. [Google Scholar]
- 12.Takeuchi Y, Uyama H, Tomoshige N, Watanabe E, Tachibana Y, Kobayashi S. J. Polym. Sci. Part A: Polym. Chem. 2006;44:671. [Google Scholar]
- 13.Watanabe E, Tomoshige N, Uyama H. Macromol. Symp. 2007;249–250:509. [Google Scholar]
- 14.Obst M, Steinbüchel A. Biomacromol. 2004;5:1166. doi: 10.1021/bm049949u. [DOI] [PubMed] [Google Scholar]
- 15.Moon JR, Jeon YS, Chung DJ, Kim D, Kim J-H. Macromol. Res. 2011;19:515. [Google Scholar]
- 16.Desjardins A, Eisenberg A. Macromolecules. 1991;24:5779. [Google Scholar]
- 17.Xu RL, Winnik MA, Hallett FR, Riess G, Croucher MD. Macromolecules. 1991;24:87. [Google Scholar]
- 18.Mortensen K, Talmon Y. Macromolecules. 1995;28:8829. [Google Scholar]
- 19.Jada A, Hurtrez G, Siffert B, Riess G. Macromol. Chem. Phys. 1996;197:3697. [Google Scholar]
- 20.Wittgren B, Wahlund KG, Derand H, Wesslen B. Macromolecules. 1996;29:268. [Google Scholar]
- 21.Akiyoshi K, Deguchi S, Tajima H, Nishikawa T, Sunamoto J. Macromolecules. 1997;30:857. [Google Scholar]
- 22.Kriz J, Masar B, Plestil J, Tuzar Z, Pospisil H, Doskocilova D. Macromolecules. 1998;31:41. [Google Scholar]
- 23.Mizusaki M, Morishima Y, Winnik FM. Macromolecules. 1999;32:4317. [Google Scholar]
- 24.Massey JA, Temple K, Cao L, Rharbi Y, Raez J, Winnik MA, Manners I. J. Am. Chem. Soc. 2000;122:11577. [Google Scholar]
- 25.Schaefer J, Stejskal EO. Top. Carbon-13 NMR Spectrosc. 1979;3:283. [Google Scholar]
- 26.Ando I, Asakura T, editors. Solid state NMR of polymers. Elsevier Amsterdam; 1998. pp. 1–1000. [Google Scholar]
- 27.Cheng HN, English AD. NMR Spectroscopy of Polymers in Solution and in the Solid State, ACS Symposium Series 834. Washington DC: Oxford University Press; 2003. [Google Scholar]
- 28.Cheng HN, Asakura T, English AD. NMR Spectroscopy of Polymers: Innovative Strategies for Complex Macromolecules, ACS Symposium Series, 1077. Washington DC: Oxford University Press; 2011. [Google Scholar]
- 29.Asakura T, Asano A, editors. Special Issue: NMR of Polymers, Polymer J. 2012;44:733–917. [Google Scholar]
- 30.Song Y-Q, Venkataramanan L, Hurlimann MD, Flaum M, Frulla P, Straley C. J. Magn. Reson. 2002;154:261. doi: 10.1006/jmre.2001.2474. [DOI] [PubMed] [Google Scholar]
- 31.Lee J-H, Labadie C, Springer Jr CS, Harbison GS. J. Am. Chem. Soc. 1993;115:7761. [Google Scholar]
- 32.Washburn KE, Callaghan PT. Phys. Rev. Lett. 2006;97:175502. doi: 10.1103/PhysRevLett.97.175502. [DOI] [PubMed] [Google Scholar]
- 33.Venkataramanan L, Song Y-Q, Hürlimann MD. IEEE T. Signal Proces. 2002;50:1017. [Google Scholar]
- 34.Hürlimann MD, Venkataramanan L. J. Magn. Reson. 2002;157:31. doi: 10.1006/jmre.2002.2567. [DOI] [PubMed] [Google Scholar]
- 35.Hürlimann MD, Burcaw L, Song Y-Q. J. Colloid. Interf. Sci. 2005;297:303. doi: 10.1016/j.jcis.2005.10.047. [DOI] [PubMed] [Google Scholar]
- 36.Hills B, Costa A, Marighet N, Wright K. Appl. Magn. Reson. 2005;28:13. [Google Scholar]
- 37.McDonald PJ, Korb J-P, Mitchell J, Monteilhet L. Phys. Rev. E. 2005;72:011409. doi: 10.1103/PhysRevE.72.011409. [DOI] [PubMed] [Google Scholar]
- 38.Sun C, Mitchell O, Huang J, Boutis GS. J. Phys. Chem. B. 2011;115:13935. doi: 10.1021/jp207607r. [DOI] [PMC free article] [PubMed] [Google Scholar]
- 39.Sun C, Boutis GS. New J. Physics. 2011;13:025026. doi: 10.1088/1367-2630/13/2/025026. [DOI] [PMC free article] [PubMed] [Google Scholar]
- 40.Ma X, Sun C, Huang J, Boutis GS. J. Phys. Chem. B. 2012;116:555. doi: 10.1021/jp208966k. [DOI] [PMC free article] [PubMed] [Google Scholar]
- 41.Takahashi T, Kawashima H, Sugisawa H, Baba T. Solid State Nucl. Mag. 1999;15:119. doi: 10.1016/s0926-2040(99)00039-9. [DOI] [PubMed] [Google Scholar]
- 42.Meiboom S, Gill D. Rev. Sci. Instrum. 1958;29:668. [Google Scholar]
- 43.Matsubara K, Nakato T, Tomida M. Macromolecules. 1997;30:2305. [Google Scholar]
- 44.Matsubara K, Nakato T, Tomida M. Macromolecules. 1998;31:1466. [Google Scholar]
- 45.Asakura T, Demura M, Nishiyama Y. Macromolecules. 1991;24:2334. [Google Scholar]
- 46.Abragam A. Principles of Nuclear Magnetism. New York: Oxford University Press; 1961. [Google Scholar]


