

Abstract
Circulating tumor cells (CTCs) disseminated into peripheral blood from a primary, or metastatic, tumor can be used for early detection, diagnosis and monitoring of solid malignancies. CTC isolation by size exclusion techniques have long interested researchers as a simple broad based approach, which is methodologically diverse for use in both genomic and protein detection platforms. Though a variety of these microfiltration systems are employed academically and commercially, the limited ability to easily alter microfilter designs has hindered the optimization for CTC capture. To overcome this problem, we studied a unique photo-definable material with a scalable and mass producible photolithographic fabrication method. We use this fabrication method to systematically study and optimize the parameters necessary for CTC isolation using a microfiltration approach, followed by a comparison to a “standard” filtration membrane. We demonstrate that properly designed microfilters can capture MCF-7 cancer cells at rate of 98 ± 2% if they consist of uniform patterned distributions, ≥160 000 pores, and 7 μm pore diameters.
Introduction
CTCs are cancer cells transiting the circulatory system which have originated from a primary tumor capable of being used as source information for cancer diagnosis and the monitoring of disease progression.1-12 Efficient isolation of CTCs from peripheral blood is challenging due to their extreme rarity (~1 CTC in every 109 total blood cells)3,10 and their high phenotypic heterogeneity (physical characteristic differences between cells from the same tumor).13-15 Further complicating the large scale clinical utilization of CTC separation is that devices must be adaptable for a number of detection platforms (PCR, FISH, immuno-staining, etc.),4-6,10,12 usable in a clinical setting and most importantly have scalable production capabilities.
Rapid isolation of CTCs by microfiltration has distinct advantages over current antibody capture methods as it is not reliant on variable, and inconsistent, surface marker expression.5,10,16-20 Antibody based CTC capture techniques have been adopted by a number of groups, including the FDA approved Cellsearch® Circulating Tumor Cell Test (Veridex LLC).1-3,14,21 This type of affinity capture approach, though shown to have clinical applications,1-3,14 is limited to capturing subgroups of CTCs with specific surface marker expression. This is problematic as CTCs, and primary tumors, have a high degree of surface marker expression heterogeneity.13-15 This is especially true of the most commonly used EpCAM surface marker, where expression can be lost in 20–30% of tumor cells.4,6,11,12,15,19,22-27 It is therefore logical to seek a non-affinity based system to achieve a consistent and reproducible enrichment of CTCs from all tumor subtypes.
Size based isolation is a general approach for CTC capture which eliminates the issue of phenotypic surface marker heterogeneity, can be used for genomic or proteomic detection platforms and can accommodate large sample sizes.11,19,26,28-31 Though separation of CTCs by size-based filtration have been studied for over 60 years, and a variety of microfilter membranes have been produced,22 only track-etch polycarbonate filters are currently available in a commercial setting. These filters available for CTC based applications, i.e. ScreenCell® or Rarecells's ISET filters, have been used to capture CTCs from metastatic patients in both research and clinical settings.32 However, track-etch filters were never designed specifically for CTC capture and have poor attributes for this use, including low porosity (3-5%)26,32-34 and non-uniform randomly distributed pores. These characteristics lead to high pressure mechanical destruction of CTCs, inconsistent capture, high amounts of nonspecific cell types, and slow filtration.16,20,26,29,30
Photolithographic fabrication has the capability of producing uniform patterned microfilters for use in CTC isolation. This method has been accomplished in various academic settings using parylene, silicon, silicon nitride and nickel substrates.16,19,29-31 In each case, photolithographic membranes showed good clinical applicability when tested for CTC capture from patient blood samples.16,20,26-31 Most notable is Lin et al.16 which showed high CTC capture using parylene microfilters, and compared favorably against the classic CellSearch® System. However, the parylene material is auto-fluorescent with complicated and labor intensive fabrication methods, e.g. reactive ion etching. This makes parylene micro-filters dificult to produce and complicated to implement on patients samples, as fluorescent identification is a requirement for clinical applications. Alternative membranes including silicon, silicon nitride and nickel filters require similar complicated reactive ion etching, or electroplating.16,26,29-31 Like parylene, these methods are hindered by high production costs, lack of high volume manufacturing, and limited scalability which inhibits large scale clinical testing. Further, silicon, silicon nitride and nickel filters are fragile, or difficult to handle, and support structures are needed to stabilize the membranes during filtration or analysis.16,19,20,26,29-31
A concern during the development of size based CTC micro-filtration was the lack of uniformity in research studies. We found major discordances between the basic criteria for CTC capture based on size exclusion.16,19,26,29-31 Pore sizes patterned onto CTC isolation technologies ranged from 5 to 11 μm. Differences in porosity comparisons could not be found, though technologies range from 2-36%.20,23,30,31 Pressure differences could be found from 0.1 psi up to ≥14 psi, with few papers comparing pressure differences using their system.20 Chemical and mechanical manipulation of CTCs was commonly used and rarely compared, but is of great importance as standard CTC enumeration is accomplished by morphology, and most CTC identification platforms require intact cells. Only in Coumans, et al. Could we find a comparison of blood cell contamination and a constant blood volume size used between different technologies.20 This was puzzling as CTC detection platforms (i.e. PCR, immunofluorescence, FISH, etc.) are hindered by high rates of cell contaminates and a standard blood volume has been set at 7.5 mL, according to the FDA.1,3
Here, we demonstrate and describe methods to maximize MCF-7 cancer cell capture from the standard volume of whole human blood using high porosity array patterned microfilters. MCF-7 being chosen as it is the most commonly used breast cancer cell line in literature. Photolithographic fabrication allows for the ability to precisely control the size, shape and pore distribution of the membrane's pores for in depth systematic testing of CTC isolation. With downstream applications in mind, we adapted an easy to use, universal assay system based on Zabaglo et al.,16,19,25,27,29,32 designed for a straight forward cross-laboratory comparative analysis. This system provides the capability to compare various membrane patterns and aid in providing a universal standard for the capture of CTCs using any membrane material.
Experimental
Microfilter fabrication
The microfilters are produced using a 10 μm thick modified SU-8 (MicroChem Corp., Newton, MA). The photo definable negative resist is sensitive to UV radiation.35,36 Briefly, the resist is coated on a substrate, an optical mask is used to pattern the pores with an MA6 mask aligner (SÜSS MicroTec AG, Garching, Germany).36 After the pores are opened in a developer, the resist is released from the substrate.36 Each optical mask is patterned to produce thirty 13 μm diameter microfilters within a 100 mm wafer (Fig. 1A). The pores are formed within a 9 mm diameter area in the center of the filter. Close up scanning electron microscope (SEM) images of the pores are shown in Fig. 1B and C. Pore sizes were measured for each wafer with an Axioplot microscope (Carl Zeiss) using Scopephoto (Scopetek) measurement software which was pre-calibrated with a calibration slide (Oplenic). Three different optical masks with different pore sizes were used to produce different pore distributions: ~70 000, ~110 000 or ~160 000 pores.
Fig. 1.

Images of the surface of a wafer membrane. (A) A photo of a single wafer batch with 30 fabricated microfilters, a 160 000 pore design and a 7 μm diameter pore opening (left). (B) A scanning electron microscope image (SEM) showing the hexagonal array pattern of the microfilter pores (upper right). (C) Enlarged SEM shows a single round uniform pore (lower right).
Cell culture and cell staining
MCF-7, MDA-MB-453, and SK-BR-3 human breast and LNCaP (clone FGC) and PC3 human prostate adenocarcinoma cancer cell lines (ATCC) were purchased from ATCC (Manassas, VA). All cell lines were grown to confluency in 10% FBS with their respective media, Eagle's minimum essential medium, Leibovitz's L-15 medium, McCoy's 5A modified medium, RPMI-1640 and F12-K (ATCC Manassas, VA). Cell lines were maintained in T-25 flasks using standard cell culture conditions (5% CO2, 37 °C) with media changes every 3–4 days, with the exception of MDA-MB-453 which was grown with no CO2. On the day of spiking experiments, cells were trypsinized in 1× Trypsin-EDTA solution (Sigma, St. Louis, MO), spun at 125 × g and re-suspended in respective media. Cell lines were then diluted to ~10^4 cell per mL in appropriate media and stored for no more than 2 hours at room temperature.
Diluted cell lines were centrifuged at 125 × g for 10 min and the cell culture media removed. Cell pellet was suspended in 1 mL staining solution, containing 1× PBS, 10 mg mL−1 acridine orange (Sigma, St. Louis, MO) and 5 μM DAPI dilacetate. Cells were incubated for 20 minutes, centrifuged at 125 × g for 10 min and the staining solution removed. The cell pellet was washed with 1 mL PBS, centrifuged at 125 × g for 10 min and finally suspended in 200 uL PBS. 2.5 μL of the stained cells were placed on a microscope slide and exact cell counts were obtained using both a DAPI and FITC fluorescent channels on a fluorescent microscope (Olympus). The microscope slides with stained pre-counted cells were then washed into 7.5 mL PBS (or 7.5 mL whole normal human blood), using 7.5 mL PBS (or Prefixation Buffer). The solution was then incubated for 15 min at room temperature and run accordingly.
Negative pressure system setup
In a sterile hood (Class II type A/B3, Nuaire), a 30 mL BD syringe (BD Biosciences, Franklin Lakes, NJ) without a plunger was clamped vertically. The bottom half of a filter holder assembly (Millipore, Billerica, MA), was attached to 3 inches of silicone tubing (Cole Parmer, Vernon Hills, IL) and placed into a stopper on top of a 250 mL glass Erlenmeyer flask. The Erlenmeyer arm was then attached to a VacuGene Pump (GE Healthcare Piscataway, NJ) with a regulated pressure gauge (Ashcroft). A fabricated microfilter was washed in 10 mL PBS, placed onto the filter holder and centered 5 mm beneath the 30 mL syringe (ESI, Fig. 1A-C†). This “open” system allows for a consistent vacuum exertion, without pressure build up across the membrane.
Three flow rates, and subsequent negative pressures exerted, were determined using both PBS and whole human blood. One filter was placed into a whole Swinnex filter holder (Millipore) and set up on the system. Vacuum pump was adjusted to reach flow rates (subsequent pressures in mbar) of 1 mL min−1 (10 mbar), 5 mL min−1 (15.1 mbar), and 10 mL min−1 (18.5 mbar). Pre-stained samples were prepared and were run in triplicate in 15 mL PBS, 7.5 mL PBS with 7.5 mL fixative, 7.5 mL whole blood with 7.5 mL PBS, and 7.5 mL Blood with 7.5 mL 1× fixative under the 3 flow rates described.
Fixation experiments
Prefixation Buffer (Creatv MicroTech), which consists of a basic organic aldehyde, was used to determine the effects of fixation concentrations on capture efficiencies in PBS. Pre-stained cell samples were prepared accordingly in 15 mL of PBS, 1×, 2.5× or 5× Prefixation buffer and incubated for 15 min before being run at 5 mL min−1.
Cell filtration
Using the MCF-7 Cell Line as a model cancer cell, 9 filters types were made of 70 000 porosity filters in 0.5 micrometer increments from 5 to 9 diameter pores. We spiked 50 pre-stained cells (22–81 cells), into 7.5 mL PBS using 1× Prefixation Buffer. Samples were incubated for 15 minutes and run according to Negative Pressure System Setup. Filters of 110 000 porosity (5–8 mm pore diameter) and filters of 160 000 porosity (5, 5.5, 6, 6.5, 7, 7.5, and 8 μm pore diameter) were then run in the same manner.
MCF-7, SKBR3 and MD-MBA-453 breast cell lines and PC3 and LNCaP prostate cell lines were used to verify the capture efficiencies. The optimal design consisting of 7 μm diameter pores array patterned with the 160 000 porosity was used. We spiked ~50 pre-stained cells (25–100) into 7.5 mL Blood (single donor) using 1× Prefixation Buffer (Fixed), or in PBS. Samples were incubated for 15 minutes, run according to Negative Pressure System Setup, and mounted with DAPI. All cell lines were run in triplicate.
To determine the diameter of cultured cells, each diluted cell line was individually loaded onto a hemocytometer (Reichert Scientific). A set of ten cells were picked at random and imaged using an Olympus BX51WI microscope using a 40× objective. Zen 2011 (Carl Zeiss) measurement software was calibrated by the manufacturer and verified using the 50 μm grid embedded into the hemocytometer, before measuring diameters (ESI, Table 1†).
Determining cellular contamination on the filter
Total contamination from 7.5 mL blood prefixed in 1× Prefixation buffer was estimated using DAPI positive cells after the complete assay. One filter each for size 5-8 μm diameter pores was tested for the 70 000, 110 000, and 160 000 porosity filters. Whole human blood, from a single donor, was fixed in 1× Prefixation buffer, incubated for 15 min, and run at 5 mL min−1. The filter was washed with 2 mL PBS, three times, placed onto a microscope slide and mounted with 5 uL of Fluoromount-G with DAPI. The filter was placed under an Olympus fluorescent microscope and five 0.09 mm2 areas (i.e. 5% of the total filtration area) was imaged under the 10× magnification, no statistical difference was seen between this estimated method and manually counting each DAPI event. The DAPI positive events for each of the 5 imaged areas were counted.
Further, blood from four additional healthy donors were then run against the 160 000 porosity filter using 5, 5.5, 6, 6.5, 7, 7.5, and 8 μm diameter pores, using the same protocol as above.
Comparing the negative pressure system using track-etch microfilters
As Track-etch filter membranes are the only other commercially available filters,18,19,32 we compared the capture effciency using the final design consisting of 7 μm diameter pores against 8 μm Track-etch membrane filters (Millipore). We also attempted the 5 μm Track-etch membranes, but the 7.5 mL blood samples would not pass through. We spiked ~50 pre-stained cells (25−100) into 7.5 mL blood (Normal E) using 1× Prefixation Buffer (Prefixed), or in PBS (Unfixed). Samples were incubated for 15 minutes, run according on Negative Pressure System Setup using the Track-etch membrane filters, in triplicate. We then ran the same experiment using the 7 μm diameter design, using the same Normal E blood, in triplicate.
Immunofluorescent assay
MCF-7, SKBR3 and MD-MBA-453 breast cell lines and PC3 and LNCaP prostate cell lines were used to develop a fluorescent immunoassay for CTC detection. The final design consisting of 7 μm diameter pores array patterned with the 160 000 porosity was used. Trypsinized cells suspended in media (concentration ~10^4 cell per mL) were diluted 1 : 1 in an Iodine solution (Fisher Scientific). Approximately 50 cells (25–100) were counted and spiked into 7.5 mL Blood (single donor) using 1× Prefixation Buffer. Samples were incubated for 15 minutes and run according to Negative Pressure System Setup. Filters were then fixed in 1× Postfixation Buffer for 15 min, permeabilized in 1× Permeabilization Buffer for 15 min and washed with 1× PBS. An antibody cocktail (Creatv Microtech, Inc.) of FITC conjugated anti-cytokeratin 8, FITC conjugated anti-cytokeratin 18, FITC conjugated anti-cytokeratin 19, PE conjugated anti-EpCAM (Epithelial Cell Adhesion Molecule), and Cy5 conjugated anti-CD45 was placed on the filter for 1 hour and then washed with 1× PBS + 0.1% Tween-20. Filters were then mounted using Fluoromount-G with DAPI (Southern Biotech). CTCs were identified on the filter by the presence of FITC, EpCAM, DAPI and lack of Cy5 signal, all cell lines were run in triplicate.
An Olympus BX54WI Fluorescent microscope with a Carl Zeiss AxioCam was used to image all of the filters after fluorescent staining. Exposures were set for 5 s for Cy5, 2 s for PE, 750 msec for FITC, and 10-50 msec for DAPI. A Zen 2011 Blue Edition (Carl Zeiss) was used to process the images.
Blood samples
Blood samples from healthy volunteers were purchased through Biological Specialty Corp or Lampire Biological Laboratories, with written informed consent and Institutional Review Board approvals. Samples were collected into Potassium EDTA as an anticoagulant and shipped at room temperature. All samples were run within 24 hours of draw time. Additionally, peripheral blood samples from 10 metastatic breast cancer patients were supplied through a collaboration agreement University of Maryland Baltimore according to the local IRB approval and with informed consent.
The optimized filter design was validated using 7.5 mL whole blood from 10 metastatic breast cancer patients. Peripheral blood was prefixed for 15 min, placed into the 30 mL syringe and drawn through the filter in rv3 min. The filter was washed with 6 mL PBS, postfixed for 15 min, and permeabilized for 15 min. The filter and cells were stained with the antibody cocktail of FITC conjugated anti-Cytokeratin 8, 18, 19; Phycoerythrin (PE) conjugated EpCAM; and Cy5 conjugated CD45 (Creatv Microtech, Inc.). Filters were washed with PBS + 0.1% Tween-20 (PBST), placed onto a microscope slide and mounted with Fluoromount-G with DAPI (Southern Biotech).
Results
Microfilter properties
We demonstrate that rapidly produce array patterned high porosity microfilters can be used to systematically study size based isolation of circulating tumor cells from whole blood (Fig. 1A-C). Using a photo-definable film allowed for high precision control of size, shape and distribution of pores using photolithographic methods.16,19,29-31 The filter material used was found to be transparent, flexible and non-fluorescent, which is optimally suited for microscope imaging applications. Further, photo-definable films have high tensile strength which allow for high porosity within a large filtration area, negating complicated mounting procedures or additional support structures.16,19,29-31
Microfilter parameters
As the filter geometry and pore distribution is determined by optical mask, filter specifications were pre-designed for a number of production lines. A variety of 13 mm microfilters were fabricated with 5–9 μm diameter pore sizes and ~70 000, ~110 000 and ~160 000 pores within a 9 mm diameter area. Fig. 1A shows an image of a wafer containing 30 individual filters, a photo of the pore array patterned on a filter, and an image of a single pore on a scanning electron microscope (SEM), respectively. The parameters of the microfilters shown in Fig. 1 are designed with 160 000 pores and pore diameters of 7 μm. The outer diameter of this microfilter is 13 mm with the pores distributed uniformly within a 9 mm diameter area at the center. The pores are spaced at 20 μm intervals (Fig. 1B) with approximately 160 000 pores.
Using a negative pressure system (ESI, Fig. 1A-C†) and a MCF-7 cell line as a model cancer cell, we optimized the recovery of pre-stained cancer cells (Fig. 2A-C) by testing the above designs. The material was found to have high strength, able to filter blood without a support structure and with rigidity for easy microscopy mounting. The selection of pore diameter and number of pores were determined experimentally using cancer cell lines and the results are described in sections below.
Fig. 2.

Capture efficiency experiments. (A) Flow rate and fixation affects capture efficiencies of MCF-7 cells spiked into blood or PBS, either fixed or unfixed. Samples were run at 1 mL min−1 (dark gray), 5 mL min−1 (light gray), or 10 mL min−1 (white) (upper left panel) (n = 3). *All 3 filters clogged with blood clots (B) Capture efficiencies of MCF-7 cells using porosity microfilters designs of 70 000 (diamond), 110 000 (square) or 160 000 (triangle) and pore diameters from 5–9 μm (lower panel, n = 3). (C) Capture efficiency of 5 cell lines using the 160 000 pore design, compared by spiking enumerated cells into blood with Prefixation Buffer (gray), or 1XPBS (white) (upper right panel) (n = 3; ~50 spiked cells).
Pressure/flow rate optimization using MCF-7
Initial assessment of pressure inputs showed that positive pressure through a microfilter, i.e. pushing samples through, caused massive cell loss (50–100%) due to lysis (data not shown). A Negative pressure system was developed as an open system to guarantee that the pressure was incapable of building above the membrane, avoiding undue shear stress on cells (ESI, Fig. 1A-C†). This design allows for different filter materials and patterns to be tested in a universal format for easy comparison.
Pressures of 10 mbar (~1 mL min−1), 15.1 mbar (~5 mL min−1) and 18.5 mbar (~10 mL min−1), were compared to determine the effects flow rate has on the capture efficiencies of MCF-7 cancer cells, Fig. 2A. Our results indicate that fixation of MCF-7 cells was a more important factor in maximizing cell capture than was pressure. In this open filtration system, it should be noted that pressure at ≤10 mbar in the presence of a fixative with blood caused clogging of the membrane. This is to be expected as blood would have additional time to “overfix” while slowly passing through the membrane. Further, it was seen that platelet aggregates and dried red blood cells would appear if the rate was dropped to ≤10 mbar, as the blood sample had additional time to react with oxygen from the environment.
Fixation stringency
As many isolation platforms use a fixation step to maximize recovery,16,19,27,29,32 we assessed the differences between unfixed cells and cells fixed at 3 different Prefixation Buffer concentrations (1×, 2.5× and 5×) (ESI, Fig. 2†). We saw no difference in capture efficiency between a 1× concentration of fixative and a 5× concentration of fixative, but observed a loss in efficiency with no fixative. This data correlated with our initial flow rate data (Fig. 2A and C) showing a loss of cell capture without fixation, and agree with most previous citations regarding blood fixation.16,19,26,29-31 Though, it should be noted that fixation concentrations above 1× would increase contamination, and at 5× could clog the filter pores from clotting of the blood. These data suggests that great care must be taken to use the minimal amount of fixative to prevent the formation of clots.
Pore size and porosity on MCF-7 capture efficiency
The ability to capture MCF-7 cancer cells was evaluated using microfilters with pore diameters ranging from 5–9 μm, and porosities of ~5.5% (70 000 pores), ~8.7% (110 000 pores) and ~12.5% (160 000 pores) (Fig. 2C). A flow rate of 5 mL min−1 and a 1× fixation concentration was used. It was seen that the optimal pore diameter varies according to the porosity, though the optimal range was between 6 and 7.5 μm. Low porosity (70 000 pores) filters had a narrow optimal capture range between the 7.5 and 8 μm pore diameters, with low capture efficiencies and high standard deviations. Higher porosity filters (110 000 and 160 000 pores) had broad optimal capture ranges, between the 6 and 7.5 μm pore diameters, with a low standard deviation and high capture efficiencies. These data suggest that size based isolation has an optimal pore size for cancer cell isolation which seems to be dependent on porosity.
Blood cell contamination
The three filter designs were compared for contamination using a single blood donor from 5 to 8 μm pores sizes (Fig. 3A). In each case red blood cell and platelet contamination was negligible however DAPI positive blood cells retained on the filter were higher at the pore diameters 5–6 μm. The amount of contamination plateaued at the 7 μm pore diameter design, with DAPI contamination rates of 1100-7000 events. This equates to an average of 106 to 107 fold purification from an original 7.5 mL of whole blood.
Fig. 3.
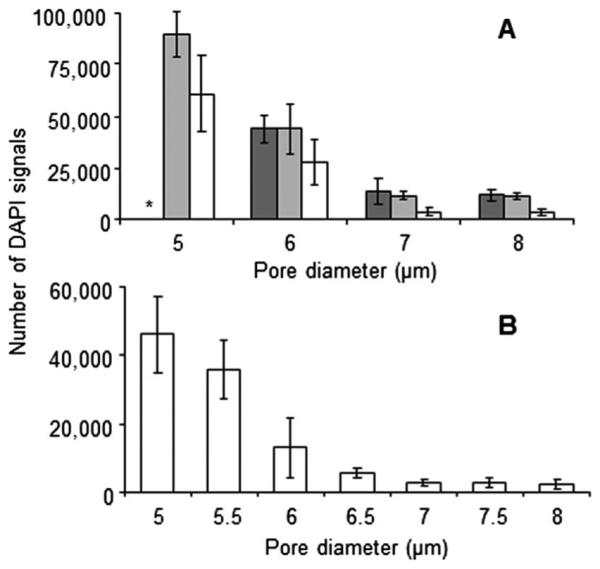
Blood cell contamination experiments. (A) DAPI contamination count after filtering whole human blood are compared using porosity microfilters of 70 000 (dark gray), 110 000 (light gray) or 160 000 (white). From a single blood donor, 7.5 mL whole blood with Prefixation Buffer is filtered, washed and mounted, with DAPI. A fluorescent microscope was used to count DAPI events (upper panel) (n = 5). *White blood cell plaque built up on filter. (B) The 160 000 microfilter design was tested with blood samples from healthy donors (n = 5). Pore diameters from 5–8 μm were compared (lower panel). A contamination plateau was seen at the ~7 μm pore diameter.
The 160 000 pore design, having the lowest overall contamination and highest CTC capture efficiency, was then tested using 4 additional healthy blood donors. Pore diameter increments of 0.5 μm, from 5 to 8 μm were used to refine the design. As shown in Fig. 3B, the lowest possible cell contamination is at the 7 μm pore diameter when using the 160 000 pore design. This 7 μm pore design had a total cellular contamination averaging 2744 (1900-3900) DAPI events (ESI, Table 2†).
Comparing the track-etch membrane filters
As Track-etched membrane filters are not available in 6, 7 or 9 μm, we could not run full comparative studies against all of the various pore sizes. The 5 μm pore membranes rapidly clogged and we were not able to filter the full 7.5 mL blood samples. We chose not to continue the use of the 5 μm in this study for this reason. The 8 μm track-etched membranes were able to capture the MCF-7 cell line with a capture efficiency of 73% ± 13% for prefixed samples and 50% ± 11% for unfixed samples (Fig. 4). This capture efficiency, though lower than the 7 μm filter design, does seem to also be lower than our own 8 μm pore design (Fig. 2B). An even more dramatic difference was seen in the contamination on the membranes. The 8 μm track-etched filter had a cell contamination of 47 840 ± 21 275, which was a log higher than the 7 μm filter design at 3920 ± 1,883, (Fig. 4). This was in spite of the fact that the 7 μm filter design pore size was a full micrometer smaller in diameter. This data, however, does correlate with previous analysis done testing the 8 μm track-etched filter.20,30
Fig. 4.
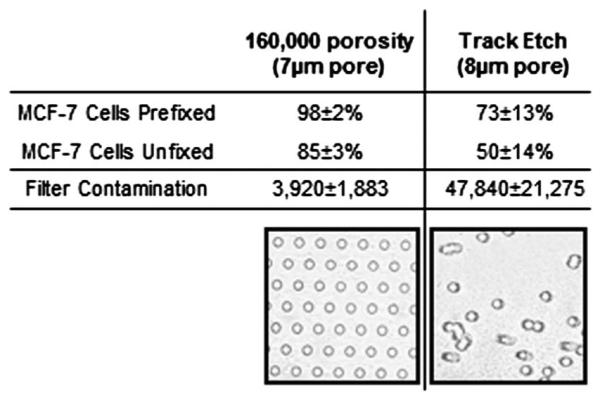
Capture efficiencies and contamination rates of Track-etch versus 160 000 pore design. Capture efficiency and standard deviation of MCF-7 cells either prefixed or unfixed (PBS) are shown using the 160 000 pore design or the 8 μm Track etch membrane (n = 3). DAPI contamination and standard deviation is compared from a single blood donor. 7.5 mL whole blood with Prefixation Buffer is filtered, washed and mounted with DAPI using the 160 000 pore design or the 8 μm Track etch membrane. Additionally, representative images of either the 160 000 pore array pattern filter or a standard 8 μm Track etch membrane are shown.
Final design capture efficiency tested of 5 cell lines
The 160 000 pore design with 7 μm pore was tested against three breast cancer cell lines and 2 prostate cell lines (Fig. 2C). Prestained cells were counted and spiked into 7.5 mL of whole blood from a single healthy blood donor. The sample was diluted with 7.5 mL PBS, or 7.5 mL 1× fixation Buffer. Concurrent with the MCF-7 data cancer cell capture in fixed blood resulted in an average capture efficiency of 98% ± 2% for all five cell lines, while the unfixed blood was 89% ± 6% (Fig. 2C).
By tracking each input cell by their morphological characteristics it was observed that late stage apoptotic cells did not retain on the filters in unfixed samples, this observation may account for the 9% loss rate between fixed and non-fixed conditions (Fig. 5A-D). We further observed that all precounted cell clusters remained intact on the filter, which should aid in the clinical identification of microemboli (Fig. 5 and 6), an important prognostic indicator in cancer patients.
Fig. 5.

Cancer cells captured regardless of cell health or protein expression. (A–D) MCF-7 cells pre-stained by Acridine orange and DAPI, filtered and imaged on a microfilter (upper row). (A) DAPI (blue) (B) Acridine Orange (green) (C) Visible light (D) Merged. Cell A-unhealthy late stage apoptotic cell, Cell B-unhealthy early stage apoptotic cell, Cell C-healthy cell. (E–I) Representative of the 5 spiked cell lines using the immunofluorescent assay, high resolution image example of PC-3 cells on a microfilter: (E) merged, (F) DAPI (blue), (G) FITC-Cytokeratin 8, 18, 19 (green) (H) PE-EpCAM (red) and (I) Cy5-CD45 (absent). The left cell has no cytokeratin expression while the right cell has high cytokeratin, microfiltration catches both types.
Fig. 6.

CTCs from a metastatic cancer patient can be identified after filtration. (A–C) Merged image of DAPI (blue), cytokeratin (green), EpCAM (red) and CD45 (magenta) on microfilter after filtration and immunofluorescent assay. CTCs can be easily identified by DAPI and cytokeratin stain presence (A) Under 10× magnification a representative image, from one of the 10 patient samples, of a CTC cluster can be seen by cytokeratin+, DAPI+, CD45-(scale bar,100 μm). (B) Under 40× magnification the CTC cluster can be easily seen and identified (scale bar, 50 μm). (C) Under 40× magnification and image enlarged, detailed cytological structures of the CTC cluster can be easily seen (scale bar, 10 μm). (D) DAPI (blue) and the abnormal chromatin pattern associated with cancerous cells are seen (scale bar, 10 μm). (E) Cytokeratin is identified with a filamentous stain pattern (scale bar, 10 μm). (F) EpCAM of these CTCs is either negative or below the threshold of the assay, antibody capture systems would likely not capture this cell (scale bar, 10 μm). (G) CD45 is negative in these CTCs, this is the standard negative control marker used for CTC identification (scale bar, 10 μm).
Post filtration CTC identification using fluorescent antibodies
To use the filter as a detection platform on clinical samples, an immunofluorescent detection assay was developed to identify CTCs spiked into whole peripheral blood post filtration. The 7 μm pore design was again tested against the three breast cancer and 2 prostate cell lines. Cells were stained using an Iodine Solution, counted and spiked into 7.5 mL whole blood. The sample was diluted with 7.5 mL 1× fixation Buffer and run using the optimized conditions. after wash, filters were fixed, permeabilized and stained with an antibody cocktail specific for CTCs. CTCs were identified in 97% ± 4% of the cell lines (ESI, Table 1†). The properties of the filter allowed for high resolution images which resulted in definitive identification of CTCs versus other cell contaminants (Fig. 5 and 6).
CTC and contamination from metastatic breast cancer patients
We were able to consistently filter 7.5 mL blood from metastatic cancer patients with an average CTC count of 56 ± 35 cells (Table 1). The contamination averaged 5297 ± 3486 DAPI positive cells though most contaminates were CD45+, or cytokertain negative cells. The remaining CD45-/cytokeratin negative cells were likely blood cell progenitor cells, endothelial cells, and other common circulating cells.19,20,25,32 This contamination validated the previous contamination of healthy normal blood samples (ESI, Table 2†). Interestingly the 3 samples which we were unable to run the same day had a contamination rate of ~3× that of fresh samples, run ≤3 hours. Like cell lines, CTCs were easily identifiable by size, cytokeratin presence and abnormal chromatin patterns. It was interesting to note that the expression patterns of the cytokeratin and the nucleus morphology was highly heterogeneous in the CTCs from cancer patients. This heterogeneity is a documented observation, and the low fluorescent background of this filter material seems to allow for detailed cytological analysis under fluorescence.
Table 1.
CTC enumeration and DAPI contamination filtered with 7.5 mL whole peripheral blood from metastatic cancer patients. (*FDA defines CTCs as DAPI+/CK+/CD45−)1,3
| Patient | *DAPl+/Cytokeratin+/ CD45-cells |
DAPl+cells | Age of blood |
CTC purity* |
|---|---|---|---|---|
| 01 | 94 | 3181 | 3 hours | 3.0% |
| 02 | 53 | 2528 | 2 hours | 2.1% |
| 03 | 73 | 1756 | 1 hours | 4.2% |
| 04 | 120 | 5100 | 1 hours | 2.4% |
| 05 | 43 | 4180 | 2 hours | 1.0% |
| 06 | 84 | 2920 | 1 hours | 2.9% |
| 07 | 29 | 3580 | 2 hours | 0.8% |
| 08 | 32 | 7220 | 18 hours | 0.4% |
| 09 | 21 | 11 580 | 18 hours | 0.2% |
| 10 | 12 | 10 920 | 18 hours | 0.1% |
| Average | 56 ± 35 | 5297 ± 3486 | 1.7% ± 1.4% |
Discussion
We present photolithographically fabricated array patterned high porosity microfilters for the large scale systematic study of isolating cancer cells, focusing on a single MCF-7 model cell line. We use the MCF-7 as it is the most commonly used model cell line.37 Filter parameters were specifically designed for studying and optimizing size based isolation of circulating tumor cells from whole blood. A high yield manufacturing method allowed for a precision testing of microfilter size, shape and pore distribution in the context of a biological application. Unlike alternative filter materials, this method allowed for high resolution microscopy of cells for use in tracking and identifying the morphology of internal cellular structures.16,19,29-31 An apparent high tensile strength allowed for high throughput testing of various sample types without the need for complicated support structures and dificult mounting procedures. Future testing may consider testing the maximum pressures allowed for this particular substrate to determine if this apparent tensile strength is preferable.
Concurrent with previous publications, this method was highly eficient at isolating the MCF-7 cell line, as well as a variety of cancer cells, in both a non-fixed and fixed dilution solutions. The microfilters allowed for uninterrupted flow and high-speed processing of large volume samples of peripheral blood, with a contamination rate of ~900-3900 cells. The scalable nature of the fabrication method allowed for the production of multiple designs, and the subsequent systematic optimization of CTC capture using these designs. Our work suggests that many CTC microfilters do not have suficient porosities, most being <10%.22,25,29,31-33 Further, for the MCF-7 model cell line, our data suggests that pore diameters should be kept to <8 μm, with an optimal diameter of 7 μm. Finally, we found that a low flow negative pressure (<18.5 mbar) is necessary for maximum capture efficiency and to preserve morphologic structure, and internal nucleic signature.
As Track-etch filters are the only other commercially available filters for testing blood filtration, we attempted to compare 5 and 8 μm Track-etch filters against our optimized design. We found that the 5 μm track-etch filters were unable to filter blood samples, which matches previous work using these filters.20,28 We also found similar capture efficiencies and contamination rates as previously determined in alternative comparison studies using the 8 μm membranes.19,20,25,28,30 These results also match to our filtration experiments where 5 μm pores clog during filtration of 7.5 mL of blood and 8 μm pores have lower capture efficiency.
Though many technologies exist for producing microfilters, most literature on size based CTC isolation provided limited systematic testing of single model cell lines, but rather focused few experiments on a number of different cell lines16,20,22,25,26,28,29,31. Here we took a different approach, focusing on a single cell line to better understand the effects of mircofilter parameters on a particular model cell line. Our results were designed to lay the foundation for microfilter optimization by detailing the capture efficiency on a specific cell line with consistent characteristics. Future studies should include the same systematic approach to optimize microfilter parameters in relation to each separate cell line tested. This should give better insight into cancer cell behavior in relation to size based isolation.
As antibody based capture using the Cellsearch® Circulating Tumor Cell Test is the only validated assay for CTC isolation and detection, our continued studies have included this test to compare the CTC enumeration rates. It was revealing that like many publications regarding non-antibody based capture, our breast cancer patients had a high number of CTCs. Now that we have shown the detailed cytological analysis possible on our filtration system, it is of interest to compare the individual CTC cell populations isolated on the filter to that of the Cellsearch® system.
The microfiltration of CTCs can be applied as a front end platform technology and may allow for multiple downstream detection applications. The general use filtration approach may expand current detection assays by allowing immunofluorescent assays to better enumerate CTCs from patient samples for in depth prognosticative monitoring; H&E staining for pathological identification; FISH analysis for CTC sub-typing and therapeutic determination; PCR for mutation analysis for point-of-care (POC) directed therapy; as well as single cell sequencing and culture.
Supplementary Material
Acknowledgements
We would like to thank all of the patients and healthy volunteers who contributed to this study. C.M. Tang, O. Makarova, and P. Amstutz have patent applications pending related to the methods and materials in this work, application numbers PCT/US2011/030966 and US20100181288A1. This research was funded in part by Maryland TEDCO under MTTCF Phase I award, grants R01-CA154624 from the National Cancer Institute, and KG100240 from the Susan G. Komen Foundation.
Footnotes
Electronic supplementary information (ESI) available. See DOI: 10.1039/c3ra46839a
References
- 1.Allard WJ, Matera J, Miller MC, Repollet M, Connelly MC, Rao C, Tibbe AG, Uhr JW, Terstappen LW. Clin. Cancer Res. 2004;10:6897–6904. doi: 10.1158/1078-0432.CCR-04-0378. [DOI] [PubMed] [Google Scholar]
- 2.Cohen SJ, Punt CJ, Iannotti N, Saidman BH, Sabbath KD, Gabrail NY, Picus J, Morse M, Mitchell E, Miller MC, Doyle GV, Tissing H, Terstappen LW, Meropol NJ. J. Clin. Oncol. 2008;26:3213–3221. doi: 10.1200/JCO.2007.15.8923. [DOI] [PubMed] [Google Scholar]
- 3.Cristofanilli M, Budd GT, Ellis MJ, Stopeck A, Matera J, Miller MC, Reuben JM, Doyle GV, Allard WJ, Terstappen LW, Hayes DF. N. Engl. J. Med. 2004;351:781–791. doi: 10.1056/NEJMoa040766. [DOI] [PubMed] [Google Scholar]
- 4.Hou JM, Krebs MG, Lancashire L, Sloane R, Backen A, Swain RK, Priest LJ, Greystoke A, Zhou C, Morris K, Ward T, Blackhall FH, Dive C. J. Clin. Oncol. 2012;30:525–532. doi: 10.1200/JCO.2010.33.3716. [DOI] [PubMed] [Google Scholar]
- 5.Lianidou ES, Markou A. Clin. Chem. Lab. Med. 2011;49:1579–1590. doi: 10.1515/CCLM.2011.628. [DOI] [PubMed] [Google Scholar]
- 6.Mostert B, Sleijfer S, Foekens JA, Gratama JW. Cancer Treat. Rev. 2009;35:463–474. doi: 10.1016/j.ctrv.2009.03.004. [DOI] [PubMed] [Google Scholar]
- 7.Nagrath S, Sequist LV, Maheswaran S, Bell DW, Irimia D, Ulkus L, Smith MR, Kwak EL, Digumarthy S, Muzikansky A, Ryan P, Balis UJ, Tompkins RG, Haber DA, Toner M. Nature. 2007;450:1235–1239. doi: 10.1038/nature06385. [DOI] [PMC free article] [PubMed] [Google Scholar]
- 8.Pachmann K, Camara O, Kavallaris A, Krauspe S, Malarski N, Gajda M, Kroll T, Jorke C, Hammer U, Altendorf-Hofmann A, Rabenstein C, Pachmann U, Runnebaum I, Hoffen K. J. Clin. Oncol. 2008;26:1208–1215. doi: 10.1200/JCO.2007.13.6523. [DOI] [PubMed] [Google Scholar]
- 9.Pachmann K, Clement JH, Schneider CP, Willen B, Camara O, Pachmann U, Hoffen K. Clin. Chem. Lab. Med. 2005;43:617–627. doi: 10.1515/CCLM.2005.107. [DOI] [PubMed] [Google Scholar]
- 10.Paterlini-Brechot P, Benali NL. Cancer Lett. 2007;253:180–204. doi: 10.1016/j.canlet.2006.12.014. [DOI] [PubMed] [Google Scholar]
- 11.Wong NS, Kahn HJ, Zhang L, Oldfield S, Yang LY, Marks A, Trudeau ME. Breast Cancer Res. Treat. 2006;99:63–69. doi: 10.1007/s10549-006-9181-4. [DOI] [PubMed] [Google Scholar]
- 12.Yu M, Stott S, Toner M, Maheswaran S, Haber DA. J. Cell Biol. 2011;192:373–382. doi: 10.1083/jcb.201010021. [DOI] [PMC free article] [PubMed] [Google Scholar]
- 13.Mikolajczyk SD, Millar LS, Tsinberg P, Coutts SM, Zomorrodi M, Pham T, Bischoff FZ, Pircher TJ. J. Oncol. 2011;2011:252361. doi: 10.1155/2011/252361. [DOI] [PMC free article] [PubMed] [Google Scholar]
- 14.Punnoose EA, Atwal SK, Spoerke JM, Savage H, Pandita A, Yeh RF, Pirzkall A, Fine BM, Amler LC, Chen DS, Lackner MR. PLoS One. 2010;5:e12517. doi: 10.1371/journal.pone.0012517. [DOI] [PMC free article] [PubMed] [Google Scholar]
- 15.Went PT, Lugli A, Meier S, Bundi M, Mirlacher M, Sauter G, Dirnhofer S. Hum. Pathol. 2004;35:122–128. doi: 10.1016/j.humpath.2003.08.026. [DOI] [PubMed] [Google Scholar]
- 16.Lin HK, Zheng S, Williams AJ, Balic M, Groshen S, Scher HI, Fleisher M, Stadler W, Datar RH, Tai YC, Cote RJ. Clin. Cancer Res. 2010;16:5011–5018. doi: 10.1158/1078-0432.CCR-10-1105. [DOI] [PMC free article] [PubMed] [Google Scholar]
- 17.Pinzani P, Salvadori B, Simi L, Bianchi S, Distante V, Cataliotti L, Pazzagli M, Orlando C. Hum. Pathol. 2006;37:711–718. doi: 10.1016/j.humpath.2006.01.026. [DOI] [PubMed] [Google Scholar]
- 18.Vona G, Estepa L, Beroud C, Damotte D, Capron F, Nalpas B, Mineur A, Franco D, Lacour B, Pol S, Brechot C, Paterlini-Brechot P. Hepatology. 2004;39:792–797. doi: 10.1002/hep.20091. [DOI] [PubMed] [Google Scholar]
- 19.Vona G, Sabile A, Louha M, Sitruk V, Romana S, Schutze K, Capron F, Franco D, Pazzagli M, Vekemans M, Lacour B, Brechot C, Paterlini-Brechot P. Am. J. Pathol. 2000;156:57–63. doi: 10.1016/S0002-9440(10)64706-2. [DOI] [PMC free article] [PubMed] [Google Scholar]
- 20.Coumans FA, van Dalum G, Beck M, Terstappen LW. PLoS One. 2013;8:e61770. doi: 10.1371/journal.pone.0061770. [DOI] [PMC free article] [PubMed] [Google Scholar]
- 21.Stefansson S, Adams DL, Tang C-M. Chromatogr. Res. Int. 2013;2013:1–6. [Google Scholar]
- 22.Farace F, Massard C, Vimond N, Drusch F, Jacques N, Billiot F, Laplanche A, Chauchereau A, Lacroix L, Planchard D, Le Moulec S, Andre F, Fizazi K, Soria JC, Vielh P. Br. J. Cancer. 2011;105:847–853. doi: 10.1038/bjc.2011.294. [DOI] [PMC free article] [PubMed] [Google Scholar]
- 23.Tan SJ, Yobas L, Lee GY, Ong CN, Lim CT. Biomed. Microdevices. 2009;11:883–892. doi: 10.1007/s10544-009-9305-9. [DOI] [PubMed] [Google Scholar]
- 24.Xu W, Cao L, Chen L, Li J, Zhang XF, Qian HH, Kang XY, Zhang Y, Liao J, Shi LH, Yang YF, Wu MC, Yin ZF. Clin. Cancer Res. 2011;17:3783–3793. doi: 10.1158/1078-0432.CCR-10-0498. [DOI] [PubMed] [Google Scholar]
- 25.Zabaglo L, Ormerod MG, Parton M, Ring A, Smith IE, Dowsett M. Cytometry, Part A. 2003;55:102–108. doi: 10.1002/cyto.a.10071. [DOI] [PubMed] [Google Scholar]
- 26.Zheng S, Lin H, Liu JQ, Balic M, Datar R, Cote RJ, Tai YC. J. Chromatogr., A. 2007;1162:154–161. doi: 10.1016/j.chroma.2007.05.064. [DOI] [PubMed] [Google Scholar]
- 27.Kuo JS, Zhao Y, Schiro PG, Ng L, Lim DS, Shelby JP, Chiu DT. Lab Chip. 2010;10:837–842. doi: 10.1039/b922301k. [DOI] [PubMed] [Google Scholar]
- 28.Seal SH. Cancer. 1964;17:637–642. doi: 10.1002/1097-0142(196405)17:5<637::aid-cncr2820170512>3.0.co;2-i. [DOI] [PubMed] [Google Scholar]
- 29.Hosokawa M, Hayata T, Fukuda Y, Arakaki A, Yoshino T, Tanaka T, Matsunaga T. Anal. Chem. 2010;82:6629–6635. doi: 10.1021/ac101222x. [DOI] [PubMed] [Google Scholar]
- 30.Lim LS, Hu M, Huang MC, Cheong WC, Gan AT, Looi XL, Leong SM, Koay ES, Li MH. Lab Chip. 2012;12:4388–4396. doi: 10.1039/c2lc20750h. [DOI] [PubMed] [Google Scholar]
- 31.Xu T, Lu B, Tai YC, Goldkorn A. Cancer Res. 2010;70:6420–6426. doi: 10.1158/0008-5472.CAN-10-0686. [DOI] [PMC free article] [PubMed] [Google Scholar]
- 32.Desitter I, Guerrouahen BS, Benali-Furet N, Wechsler J, Janne PA, Kuang Y, Yanagita M, Wang L, Berkowitz JA, Distel RJ, Cayre YE. Anticancer Res. 2011;31:427–441. [PubMed] [Google Scholar]
- 33.Holdich R, Kosvintsev S, Cumming I, Zhdanov S. Philos. Trans. R. Soc. London, Ser. A. 2006;364:161–174. doi: 10.1098/rsta.2005.1690. [DOI] [PubMed] [Google Scholar]
- 34.Chang M, Deka JR, Tszeng CT, Cheng PR. Desalination. 2007;234:66–73. [Google Scholar]
- 35.Ralu D, Makarova OV, Skoog S, Narayan R, Sumant AV, Tang CM, Moldovan N. Microsyst. Technol. 2013:1–6. [Google Scholar]
- 36.Ebrahimi Warkiani M, Lou CP, Gong HQ. Biomicrofluidics. 2011;5:36504–365049. doi: 10.1063/1.3637630. [DOI] [PMC free article] [PubMed] [Google Scholar]
- 37.Holiday DL, Speirs V. Breast Cancer Res. 2011;13:215. doi: 10.1186/bcr2889. [DOI] [PMC free article] [PubMed] [Google Scholar]
Associated Data
This section collects any data citations, data availability statements, or supplementary materials included in this article.