Abstract
Background
Conventional measures of gestational weight gain (GWG) are correlated with pregnancy duration, and may induce bias to studies of GWG and perinatal outcomes. A maternal weight-gain-for-gestational-age z-score chart is a new tool that allows total GWG to be classified as a standardized z-score that is independent of gestational duration. Our objective was to compare associations with perinatal outcomes when GWG was assessed using gestational age-standardized z-scores and conventional GWG measures.
Methods
We studied normal-weight (n=522,120) and overweight (n=237,923) women who delivered live-born, singleton infants in Pennsylvania, 2003-2011. GWG was expressed using gestational age-standardized z-scores and three traditional measures: total GWG (kg), rate of GWG (kg per week of gestation) and the GWG adequacy ratio (observed GWG/GWG recommended by the Institute of Medicine). Log-binomial regression models were used to assess associations between GWG and preterm birth and small- and large-for-gestational-age births while adjusting for race/ethnicity, education, smoking, and other confounders.
Results
The association between GWG z-score and preterm birth was approximately U-shaped. The risk of preterm birth associated with weight gain <10th percentile of each measure was substantially overestimated when GWG was classified using total kg and was moderately overestimated using rate of GWG or GWG adequacy ratio. All GWG measures had similar associations with small- or large-for-gestational-age birth.
Conclusions
Our findings suggest that studies of gestational age-dependent outcomes misspecify associations if total GWG, rate of GWG, or GWG adequacy ratio are used. The potential for gestational age-related bias can be eliminated by using z-score charts to classify total GWG.
Introduction
Scientists and clinicians have been interested in gestational weight gain (GWG) as a potentially modifiable risk factor for adverse perinatal outcomes for over 40 years.1, 2 Yet, little attention has been paid to the importance of appropriately untangling the effects of GWG from effects of gestational age on adverse outcomes. Shorter pregnancies present less opportunity for mothers to gain weight,2 so studies of total GWG in relation to risk of prematurity-related outcomes cannot separate the risks associated with low weight gain from the risks of younger gestational at delivery.3 Despite this bias, total GWG continues to be used in studies of gestational age-dependent perinatal outcomes.4-6
One way that researchers have attempted to account for pregnancy duration is to divide total GWG by gestational age at delivery, which is referred to as “rate of GWG.” When using this measure, researchers assume that women gain weight at a constant rate across pregnancy. In reality, rate of weight gain is slower in the first trimester than the second and third trimesters.2, 7 As a result, rate of total GWG misclassifies women to a greater degree the earlier they deliver.3 A second measure that researchers commonly use is the GWG adequacy ratio, a ratio of the observed total GWG to the Institute of Medicine (IOM)-recommended GWG at the gestational age of delivery.7, 8 While this measure attempts to account for the slower rate of weight gain in the first trimester, misclassification can result if women gain well above or below the assumed total amounts of weight in the first trimester.3 A recent simulation study suggested that residual confounding by gestational age remains a problem using these two traditional measures.3
A weight-gain-for-gestational-age z-score chart is a new tool for classifying total GWG that is independent of gestational duration.9, 10 Similar to birthweight or estimated fetal weight-for-gestational-age charts, the chart presents the mean and standard deviation of weight gain for each week of gestation. It was developed in a longitudinal cohort of healthy pregnancies delivered at term, which ensures that the resulting weight gain z-scores are uncorrelated with the length of pregnancy. Any association between GWG and preterm birth when using z-scores cannot be due to this residual gestational age confounding.
The objective of the present study was to answer several questions on the different measures available for classifying GWG. Is maternal weight gain associated with preterm birth once we use a measure of GWG that is not correlated with gestational age (i.e., when GWG is assessed as a gestational age-standardized z-score)? What is the magnitude and direction of the bias that arises from using conventional GWG measures to study preterm birth? Is there bias when conventional GWG measures are used to study SGA and LGA (which are independent of gestational age)?
Methods
Data came from the Penn MOMS study, a project using 1,265,257 linked infant birth-death records in Pennsylvania from 2003-2011 to explore associations between GWG and adverse birth outcomes. We included singleton births to normal weight or overweight women who had plausible GWG and complete data on BMI, GWG, birth weight, gestational age, insurance, and other covariates in our final model (n=760,043). Our analyses were restricted to normal weight or overweight women because GWG z-scores have been developed for these groups. We used our clinical experience to define plausible GWG as −3-50 kg for normal weight and −5-50 kg for overweight women.
The 2003 revised version of the U.S. birth certificate gathers prepregnancy weight and height through an interview with the mother before she is discharged from the hospital.11
Hospital staff members document maternal weight at delivery on the birth certificate using either the last measured weight from prenatal records or weight documented on the labor and delivery admission history and physical (which may be measured or self-reported).12
Total GWG (in kilograms) was defined as maternal weight at delivery minus prepregnancy weight. We also expressed GWG as rate of GWG (total GWG divided by gestational age at delivery, kg/week) and the GWG adequacy ratio (observed total GWG divided by IOM-recommended GWG at the gestational age of delivery given prepregnancy BMI category).7, 13 Finally, for comparison purposes, we expressed total GWG as a prepregnancy BMI-specific gestational age-standardized z-score.9 Z-score charts were developed using serial prenatal weight measurements available through medical record abstraction at Magee-Womens Hospital in Pittsburgh, PA (1998-2008) in a random sample of normal weight and overweight women with uncomplicated singleton term pregnancies and no preexisting conditions.9
Perinatal outcomes are documented on the birth certificate by a hospital staff member. The best obstetric estimate of gestational age at delivery is “the birth attendant's final estimate of gestation based on all perinatal factors and assessments, but not the neonatal exam”.12 We examined risks of preterm birth, small-for-gestational-age birth (SGA) and large-for-gestationalage birth (LGA). We defined preterm birth and early preterm birth as the delivery of a live-born infant at <37 and <32 completed weeks gestation, respectively. Small- and large-for-gestational age births were classified using ultrasound-based intrauterine fetal weight standards at <10th percentile or >90th percentile, respectively.14
Key covariates collected by interview of the mothers before discharge included maternal race/ethnicity (non-Hispanic white, non-Hispanic black, Hispanic, non-Hispanic other), maternal education, marital status, and smoking in the three months before pregnancy. Hospital staff used medical records to ascertain information on the birth certificate for parity, source of payment, trimester of entry into prenatal care and address of primary residence. Urban residence was defined using geocoded residential addresses at birth merged with the U.S. Department of Agriculture Economic Research Service Urban-Rural Continuum Codes.15 The neonatal intensive unit level of care for the birth facility was classified as I, II, and III.
Statistical analysis
Multivariable log-binomial regression models were used to estimate adjusted risks, risk differences and their corresponding 95% confidence intervals (CI) for associations between each GWG measure and each outcome of interest. The excess number of cases per 100 births was calculated by multiplying the risk difference and the 95% confidence limits by 100. We decided a priori to stratify models by prepregnancy BMI category and to adjust for all potential confounders identified using theory-based causal diagrams 16 (maternal age, race/ethnicity, education, marital status, parity, smoking, height, payment source, trimester of prenatal care entry, urban residence, facility NICU level, and year of birth). Each GWG measure was modeled as a restricted cubic spline with 5 knots determined by Harrell's default percentiles 17 to capture nonlinear relations. The adjusted risks and 95% CI were plotted with all covariates set to the population mean values. To simplify comparisons, we also categorized each GWG measure based on percentiles of the distribution; women with GWG in the 50th to <75th percentile were used as the reference group (conclusions did not differ when 25th to <50th percentile was the referent). The median total GWG, rate of GWG, GWG adequacy ratio, and GWG z-score by percentile category are shown in Online Table 1.
Results
There were 1,265,257 births of singleton infants in our cohort. Excluding records with gestational age at delivery >42 weeks (0.06%, n=818) or with missing data on birth weight or a gestational age at delivery (1.8%, n=22,920), prepregnancy weight (4.6%, n=58,344), height (0.3%, n=3,255), weight at delivery (5.9%, n=74,086), insurance (4.5%, n=57,330) or other covariates in the final model (2.3%, n=29,240) left 1,019,264 records. The 245,993 births with missing data were more likely than births with complete data to deliver preterm (11.1% vs. 7.7%), to be non-Hispanic black (24% vs. 12%) or unmarried (47% vs. 37%), and to have less than a high school education (21% vs. 15%). There were no meaningful differences in GWG, age, or smoking status (data not shown). Unadjusted associations between GWG z-score and perinatal outcomes did not differ between those with and without missing data (data not shown). We retained 523,422 normal weight (prepregnancy body mass index (BMI) [weight(kg)/height(m)2] 18.5 −24.9 kg/m2), and 239,304 overweight (BMI 25.0-29.9 kg/m2), and lastly excluded 1, 302 normal women and 1, 381 overweight women with implausible total GWG values. There were 760,043 records in the final analysis.
Mothers in our final cohort were predominantly multiparous, married, and non-smokers, resided in urban metropolitan areas, and had greater than a high-school education and private health insurance (Table 1). Approximately 25% of mothers reported a race/ethnicity other than non-Hispanic white. The mean weight gain among normal weight and overweight mothers was 15.8 kg and 14.8 kg, respectively. Overweight women were more likely than normal weight women to deliver an LGA infant and less likely to deliver an SGA infant, but rates of preterm birth at <32 weeks and <37 weeks were similar.
Table 1.
Characteristics of births to normal weight and overweight mothers, Pennsylvania birth certificates, 2003-2011
| Normal Weight n=522,120 N (%) or mean (SD) | Overweight n=237,923 N (%) or mean (SD) | |
|---|---|---|
| Race | ||
| Non-Hispanic White | 403,499 (77.2) | 174,051 (73.2) |
| Non-Hispanic Black | 49,442 (9.5) | 33,172 (13.9) |
| Hispanic | 40,601 (7.8) | 22,648 (9.5) |
| Other | 28,578 (5.5) | 8,052 (3.4) |
| Age, years | 27.9 (6.1) | 28.2 (5.9) |
| Mother's Education | ||
| Less than high school | 78,210 (15.0) | 35,245 (14.8) |
| High school or equivalent | 122,764 (23.5) | 64,693 (27.2) |
| More than high school | 321,146 (61.5) | 137,985 (58.0) |
| Married | 339, 526 (65.0) | 149,508 (62.8) |
| Primiparous | 233,538 (44.7) | 92,400 (38.8) |
| Smoked before pregnancy | 112,687 (21.6) | 53,873 (22.6) |
| Insurance | ||
| Private | 342,790 (65.7) | 148,453 (62.4) |
| Medicaid | 134,491 (25.8) | 68,307 (28.7) |
| Other | 44,839 (8.5) | 21,163 (8.9) |
| Urbanicity Index | ||
| > 1 million | 259,206 (49.6) | 112,461 (47.2) |
| 250,000 to 1 million | 160,360 (30.7) | 75,059 (31.6) |
| Metro but <250,000 | 47,797 (9.2) | 22,905 (9.6) |
| Non-metro | 54,757 (10.5) | 27,498 (11.6) |
| Delivery in a hospital with a Level 3 NICU | 318,882 (61.1) | 143,260 (60.2) |
| Gestational weight gain, kg | 15.8 (6.1) | 14.8 (7.5) |
| Gestational weight gain z-score, SD | −0.15 (1.1) | −0.26 (1.2) |
| Rate of gestational weight gain, kg/wk | 0.41 (0.2) | 0.38 (0.2) |
| Gestational weight gain adequacy ratio | 1.2 (0.5) | 1.8 (0.9) |
| Preterm birth (<32 weeks) | 4,934 (1.0) | 2,535 (1.1) |
| Preterm birth (<37 weeks) | 37,971 (7.3) | 17,452 (7.3) |
| Small-for-gestational-age | 51,726 (9.9) | 19,579 (8.2) |
| Large-for-gestational-age | 37,721 (7.2) | 25,439 (10.7) |
NICU, neonatal intensive care unit; SD, standard deviations
The correlation between GWG z-scores and each traditional GWG measure depended on gestational age at delivery. Among term births to normal weight mothers, total GWG (Online Figure 1, Panel A), rate of GWG (Panel C) and GWG adequacy ratio (Panel E) were highly correlated with GWG z-scores. But among preterm births, there was less agreement. Total GWG was systematically lower than the z-scores throughout the distribution (Online Figure 1, Panel B). Rate of GWG also underestimated z-scores at the low end of the distribution (Panel D), while GWG adequacy ratio often underestimated the z-score at low weight gains and overestimated z-score at high weight gains (Panel E). Results were similar for overweight women (data not shown).
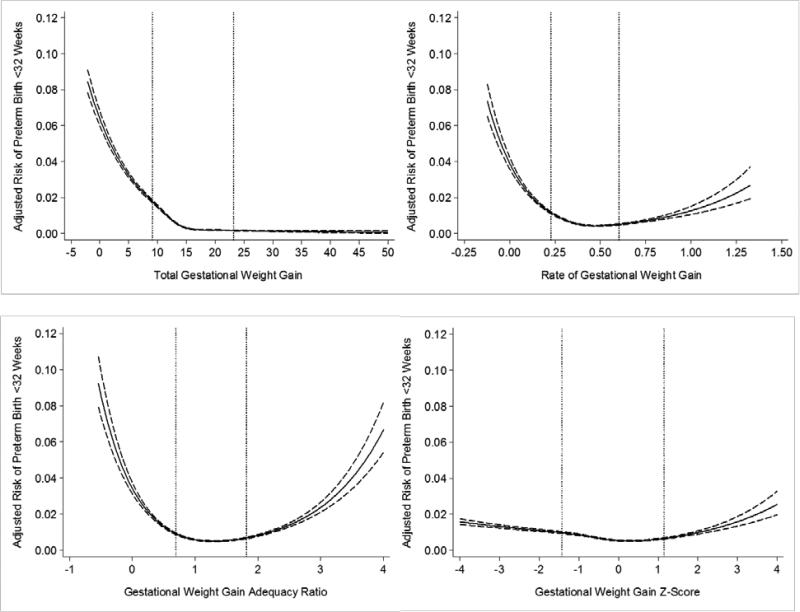
The shape of the risk curves for preterm birth <32 weeks varied greatly depending on the GWG measure. For total GWG among normal-weight women, there was a steep decline in the adjusted risk of preterm birth <32 weeks as total GWG increased, followed by a leveling off at approximately 15 kg (Figure 1, Panel A). Total GWG <10th percentile was associated with 3.3 [95% confidence interval: 3.1, 3.5] excess cases of preterm birth per 100 births compared with total GWG 50th-<75th percentile (Table 2). There was a major reduction in the number of excess of early preterm birth when rate of GWG or GWG adequacy ratio were used; weight gain <10th percentile was associated with 1.5 [1.4, 1.7] and 1.1 [0.9, 1.2] excess early preterm birth cases, respectively, compared with weight gain 50th-<75th percentile (Table 2). Further, the U-shaped associations observed with rate of GWG and GWG adequacy ratio illustrated an increased risk of early preterm birth at high weight gain (Figure 1, Panels B and C). When GWG z-scores were used, low and high weight gain remained related to early preterm birth (Figure 1, Panel D), but the association was further attenuated at the <10th percentile (0.7 [0.6, 0.8] excess early preterm births vs. 50th-<75th percentile).
Figure 1.
Adjusted risk of preterm birth <32 weeks in relation to gestational weight gain measures among normal weight women (n=522,120). The dotted lines represent the 10th and 90th percentiles of each gestational weight gain measure's distribution. Panel A: total gestational weight gain; Panel B: rate of gestational weight gain; Panel C: gestational weight gain adequacy ratio; Panel D: gestational weight gain z-score. Gestational weight gain z-scores have been truncated to show 99% of the population (−4SD to 4SD).
Table 2.
Adjusted number of excess cases of preterm birth at <32 weeks and <37 weeks gestation by categories of total GWG, rate of gestational weight gain, gestational weight gain adequacy ratio, and gestational weight gain z-scores among normal weight (n= 522,120) and overweight (n=237,923) women, Pennsylvania births (2003-2011).
| Preterm birth <32 weeks gestation Adjusteda number of excess cases (95% CI) | Preterm birth <37 weeks gestation Adjusteda number of excess cases (95% CI) | |||||||
|---|---|---|---|---|---|---|---|---|
| GWG percentile | Total GWG | Rate of GWG | GWG adequacy ratio | GWG z-score | Total GWG | Rate of GWG | GWG adequacy ratio | GWG z-score |
| Normal weight b | ||||||||
| <10th | 3.3 [3.1, 3.5] | 1.5 [1.4, 1.7] | 1.1 [0.9, 1.2] | 0.7 [0.6, 0.8] | 10.2 [9.9, 10.6] | 6.0 [5.7, 6.3] | 4.3 [4.1, 4.6] | 5.0 [4.7, 5.3] |
| 10th- <25th | 0.8 [0.8, 0.9] | 0.4 [0.3, 0.4] | 0.2 [0.2, 0.3] | 0.2 [0.2, 0.3] | 4.3 [4.1, 4.6] | 2.0 [1.8, 2.2] | 0.8 [.6, 1.0] | 1.8 [1.6, 1.9] |
| 25th- <50th | 0.2 [0.1, 0.2] | 0.1 [0.1, 0.2] | 0.1 [0.1, 0.2] | 0.1 [0.1, 0.2] | 1.5 [1.4, 1.7] | 1.3 [1.1, 1.4] | 0.6 [0.5, 0.8] | 1.2 [1.0, 1.4] |
| 50th- <75th | Reference | Reference | Reference | Reference | Reference | Reference | Reference | Reference |
| 75th- <90th | −0.1 [−0.1, −0.1] | 0 [−0.1, 0.1] | 0.1 [0.1, 0.2] | 0 [−0.02, 0.1] | −0.8 [−0.9, −0.6] | 0.9 [0.8, 1.2] | 0.6 [0.4, 0.8] | 0.8 [0.6, 0.9] |
| ≥90th | −0.1 [−0.2, −0.1] | 0.2 [0.1, 0.2] | 0.5 [0.4, 0.6] | 0.3 [0.2, 0.4] | −1.1 [−1.3, −0.9] | 1.6 [1.4, 1.9] | 2.6 [2.3, 2.8] | 1.9 [1.7, 2.2] |
| Overweight | ||||||||
| <10th | 2.1 [1.9, 2.3] | 1.1 [0.9, 1.3] | 0.9 [0.8, 1.1] | 0.5 [0.3, 0.6] | 6.3 [5.8, 6.7] | 4.1 [3.7, 4.5] | 3.2 [2.8, 3.6] | 2.9 [2.6, 3.4] |
| 10th- <25th | 1.1 [0.9, 1.2] | 0.4 [0.3, 0.5] | 0.2 [0.1, 0.3] | 0.2 [0.1, 0.3] | 3.8 [3.5, 4.2] | 0.8 [0.5, 1.2] | −0.1 [−0.4, 0.2] | 0.7 [0.3, 0.9] |
| 25th- <50th | 0.3 [0.3, 0.4] | 0.1 [0, 0.2] | 0.1 [0, 0.1] | 0.04 [0, 0.1] | 1.4 [1.2, 1.7] | 0.1 [−0.2, 0.4] | −0.1 [−0.4, 0.1] | −0.1 [−0.4, 0.1] |
| 50th- <75th | Reference | Reference | Reference | Reference | Reference | Reference | Reference | Reference |
| 75th- <90th | −0.1 [−0.2, 0] | 0 [−0.1, 0.1] | 0.2 [0.1, 0.2] | 0.1 [0, 0.2] | −0.7 [−0.9, −0.4] | 0.2 [−0.1, 0.5] | 1.0 [0.7, 1.3] | 0.2 [−0.1, 0.5] |
| >90th | −0.1 [−0.2, −0.1] | 0.3 [0.2, 0.4] | 0.8 [0.7, 0.9] | 0.6 [0.5, 0.7] | −1.1 [−1.4, −0.8] | 1.8 [1.5, 2.2] | 3.5 [3.1, 3.9] | 2.8 [2.4, 3.2] |
CI, confidence interval; GWG, gestational weight gain
Adjusted for maternal race, age, education, insurance, marital status, parity, prepregnancy smoking status, maternal height, year of birth, urbanicity index, and NICU hospital level.
Number of excess cases is calculated as the risk difference multiplied by 100.
Normal weight, body mass index 18.5 to 24.9 kg/m2; overweight, body mass index 25 to 29.9 kg/m2
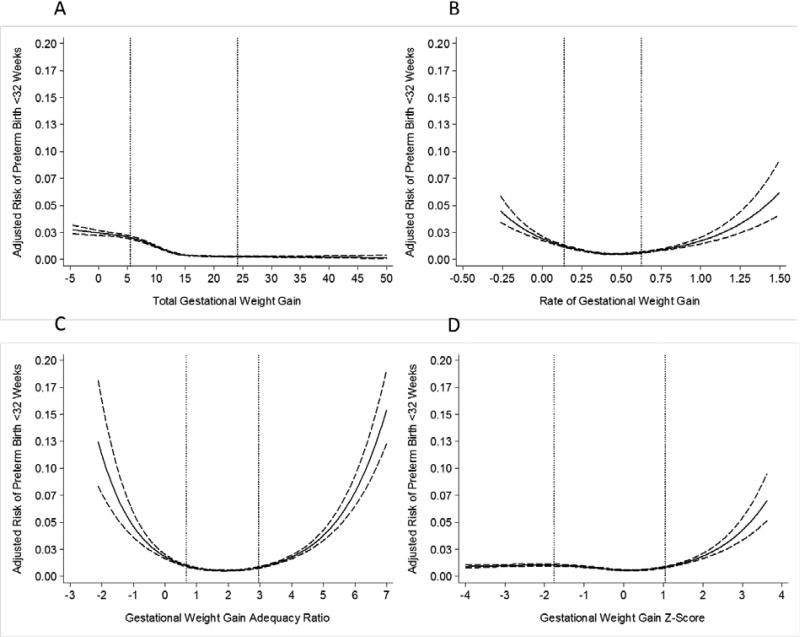
For overweight women, early preterm birth risk curves varied across weight gain measures as noted above for normal weight women (Figure 2). There was also a similar attenuation in the number of excess cases associated with weight gain <10th percentile from 2.1 for total GWG, 1.1 for rate of GWG, 0.9 for GWG adequacy ratio, and 0.5 for GWG z-score compared with weight gain 50th- 75th percentile (Table 2).
Figure 2.
Adjusted risk of preterm birth <32 weeks in relation to gestational weight gain measures among overweight women (n=237,923). The dotted lines represent the 10th and 90th percentiles of each gestational weight gain measure's distribution. Panel A: total gestational weight gain; Panel B: rate of gestational weight gain; Panel C: gestational weight gain adequacy ratio; Panel D: gestational weight gain z-score. Gestational weight gain z-scores have been truncated to show 99% of the population (−4SD to 4SD).
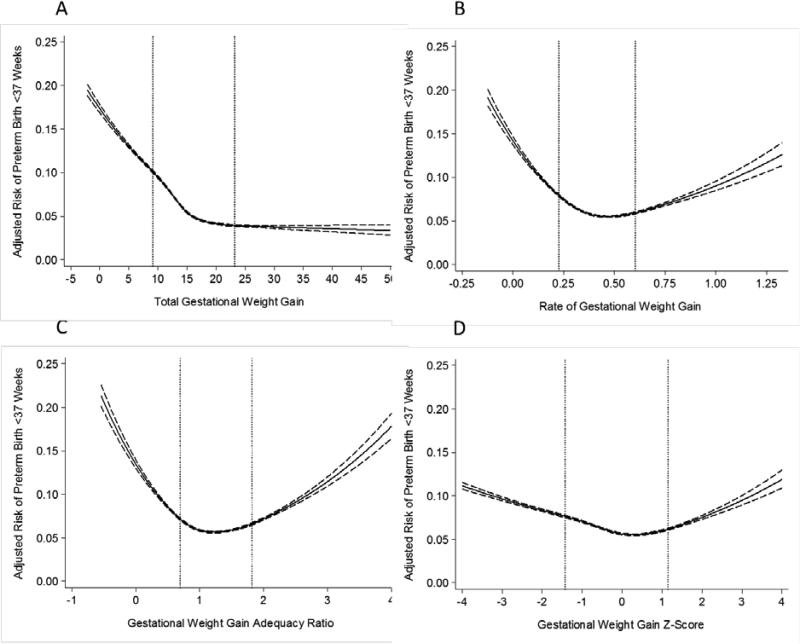
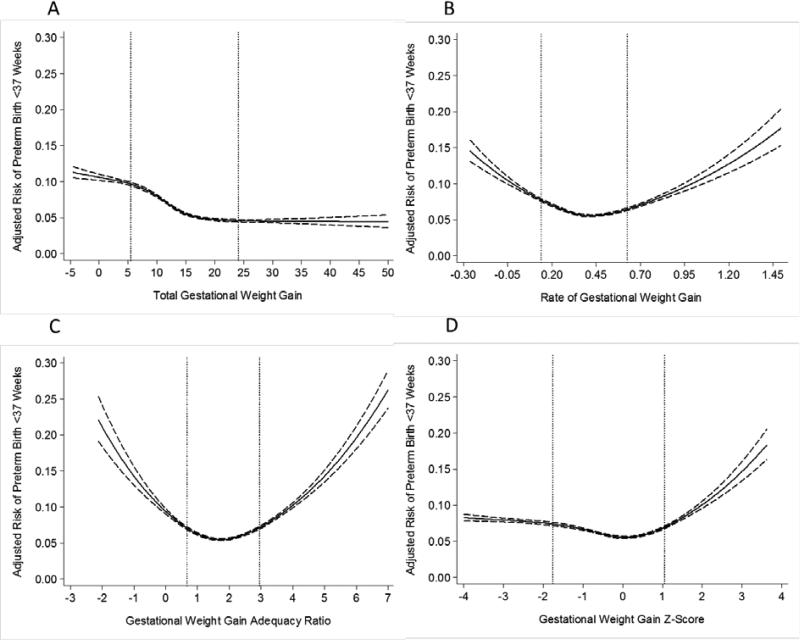
For preterm birth <37 weeks, the patterns were similar to early preterm births among both normal weight (Figure 3) and overweight women (Figure 4), but the attenuation at the lower tail of the distribution was not as great when GWG z-scores were used instead of rate of GWG or GWG adequacy ratio (Figure 2; Table 2).
Figure 3.
Adjusted risk of preterm birth <37 weeks in relation to gestational weight gain measures among normal weight women (n=522,120). The dotted lines represent the 10th and 90th percentiles of each gestational weight gain measure's distribution. Panel A: total gestational weight gain; Panel B: rate of gestational weight gain; Panel C: gestational weight gain adequacy ratio; Panel D: gestational weight gain z-score. Gestational weight gain z-scores have been truncated to show 99% of the population (−4SD to 4SD).
Figure 4.
Adjusted risk of preterm birth <37 weeks in relation to gestational weight gain measures among overweight women (n=237,923). The dotted lines represent the 10th and 90th percentiles of each gestational weight gain measure's distribution. Panel A: total gestational weight gain; Panel B: rate of gestational weight gain; Panel C: gestational weight gain adequacy ratio; Panel D: gestational weight gain z-score. Gestational weight gain z-scores have been truncated to show 99% of the population (−4SD to 4SD).
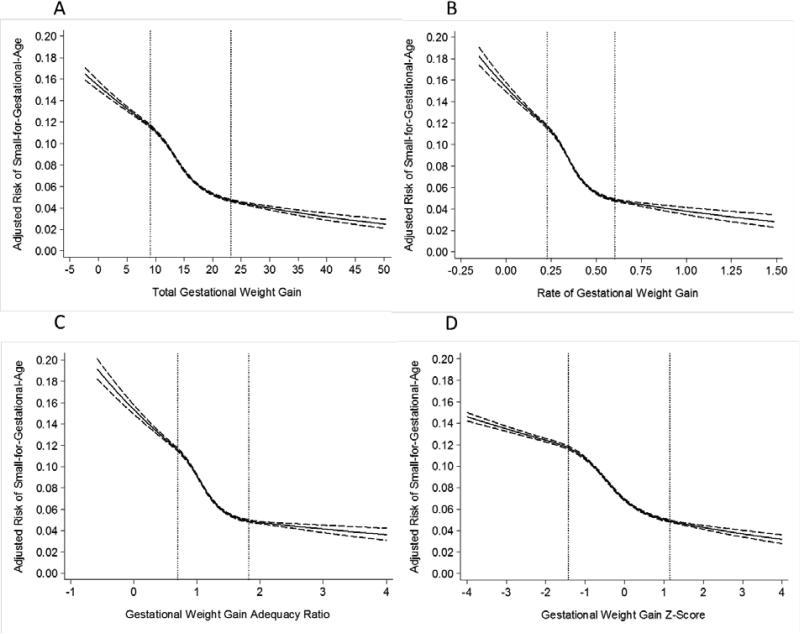
Total GWG, rate of GWG, GWG adequacy ratio, and GWG z-score had similar strong, negative associations with risk of SGA (Figure 5) and strong, positive associations with risk of LGA among normal weight women (Online Figure 2) and overweight women (data not shown).
Figure 5.
Adjusted risk of small-for-gestational-age birth in relation to gestational weight gain measures among normal weight women (n=522,120). The dotted lines represent the 10th and 90th percentiles of each gestational weight gain measure's distribution. Panel A: total gestational weight gain; Panel B: rate of gestational weight gain; Panel C: gestational weight gain adequacy ratio; Panel D: gestational weight gain z-score. Gestational weight gain z-scores have been truncated to show 99% of the population (−4SD to 4SD).
In contrast with preterm birth, the adjusted number of excess SGA (online Table 2) or LGA (online Table 3) cases was nearly identical for each GWG measure.
Results were not meaningfully different when we restricted the sample to those with a GWG z-score from -4SD to 4SD, when we used GWG 25th to <50th percentile as the referent group in models, or when we did not restrict the sample based on implausible GWG values (results available upon request).
Discussion
Using our large population-based cohort of normal weight and overweight women, we related GWG z-scores to preterm birth and observed that both low and high z-scores were associated with preterm birth at <32 and <37 weeks. However, the preterm birth effect estimates observed at low weight gains were substantially weaker than what was observed using total GWG and also tended to be somewhat weaker than estimates observed using rate of GWG or GWG adequacy ratio. The overestimation of associations using traditional measures was particularly notable for early preterm birth because there is more disagreement between these measures and z-scores as gestational age at delivery decreases.
This overestimation of preterm birth risk with traditional GWG measures has implications for national guidance on maternal weight gain. Public health officials aiming to establish optimal GWG ranges for women in each BMI category must balance risks of low GWG with those of high GWG.7 Accurate estimation of the risks of poor maternal and child health outcomes is essential for establishing recommended weight gain ranges. Our results suggest that studies that use conventional GWG measures overestimate the risk of preterm birth and preterm- related outcomes with low GWG. If results generated from these measures are used to set recommended GWG ranges, the guidelines may be too high. We believe that this may be of greatest concern for heavy mothers because of the contentious debate regarding the safety of low GWG.18, 19 Understanding the magnitude of preterm birth risk related to low and high GWG for women in all BMI groups is also critical for evaluating the utility of targeting GWG in preterm birth prevention.
The choice of the measure of GWG had no noticeable impact on the relationship with SGA or LGA. This is not surprising because by definition, SGA and LGA should be independent of gestational age. We felt that it was important to document the similarity in effect estimates using conventional GWG measures and GWG z-scores because SGA and LGA are widely studied in the weight gain literature and current national guidance for maternal weight gain is heavily influenced by research on these outcomes.
We could not include obese women in our analysis because finalized z-scores are unavailable for this BMI group. We also limited our analysis to preterm birth and infant size-forgestational-age as outcomes because state birth certificates are not valid sources of data on serious newborn morbidity. Research is needed to evaluate associations between GWG and more functionally defined outcomes of newborn health.20 Future prospective studies should also separate spontaneous from indicated preterm births (which is not possible with birth certificate data), examine additional outcomes (focusing primarily on outcomes that are associated with gestational age at birth, including stillbirth, infant mortality and other downstream consequences of prematurity like cognitive dysfunction and child growth), and include women in other prepregnancy BMI categories to provide a more complete understanding of the potential bias of traditional GWG measures. We used a very large population-based cohort, but approximately 20% of women were dropped because of missing data. However, our sensitivity analyses suggested that it is unlikely that these exclusions had an important impact on our findings and should not affect the internal validity of our results. Finally, the impact of maternal weight misreporting on associations with adverse outcomes is being investigated 21, 22 and will be the subject of a future report. Misclassification would influence all models in the present analysis equally and would therefore not alter our conclusions regarding bias in conventional GWG measures.
Our findings suggest that while the use of total GWG, rate of GWG, and GWG adequacy ratio adequately describe the relationship between GWG and SGA or LGA, use of these measures will misspecify associations with gestational age-dependent outcomes. Therefore, researchers who study GWG and preterm birth and related conditions should take care to eliminate the potential for gestational age-related bias by using z-score charts to assess total GWG. Published GWG z-score charts from selected populations are currently available,10, 14 but future work to develop GWG z-score charts from widely representative populations of healthy, term pregnancies would be ideal.
Supplementary Material
Acknowledgements
This project was supported by NIH grant R21 HD065807 and the Thrasher Research Fund (#9181). JAH holds New Investigators Awards from the Canadian Institutes of Health Research and the Michael Smith Foundation for Health Research.
References
- 1.NRC . Maternal Nutrition and the Course of Pregnancy. National Academies Press; Washington, DC: 1970. [Google Scholar]
- 2.Institute of Medicine . Nutrition during Pregnancy. National Academy Press; Washington, D.C.: 1990. [Google Scholar]
- 3.Hutcheon JA, Bodnar LM, Joseph KS, Abrams B, Simhan HN, Platt RW. The bias in current measures of gestational weight gain. Paediatric and Perinatal Epidemiology. 2012;26:109–116. doi: 10.1111/j.1365-3016.2011.01254.x. [DOI] [PMC free article] [PubMed] [Google Scholar]
- 4.Yeh J, Shelton JA. Association of pre-pregnancy maternal body mass and maternal weight gain to newborn outcomes in twin pregnancies. Acta Obstetricia et Gynecologica Scandinavica. 2007;86:1051–1057. doi: 10.1080/00016340701417026. [DOI] [PubMed] [Google Scholar]
- 5.Davis RR, Hofferth SL. The association between inadequate gestational weight gain and infant mortality among u.s. Infants born in 2002. Maternal & Child Health Journal. 2012;16:119–124. doi: 10.1007/s10995-010-0713-5. [DOI] [PMC free article] [PubMed] [Google Scholar]
- 6.Davis RR, Hofferth SL, Shenassa ED. Gestational weight gain and risk of infant death in the United States. American Journal of Public Health. 2014;104(Suppl 1):S90–95. doi: 10.2105/AJPH.2013.301425. [DOI] [PMC free article] [PubMed] [Google Scholar]
- 7.Institute of Medicine . Weight Gain During Pregnancy: Reexamining the Guidelines. National Academies Press; Washington, DC: 2009. [PubMed] [Google Scholar]
- 8.Bodnar LM, Hutcheon JA, Platt RW, Himes KP, Simhan HN, Abrams B. Should gestational weight gain recommendations be tailored by maternal characteristics? American Journal of Epidemiology. 2011;174:136–146. doi: 10.1093/aje/kwr064. [DOI] [PMC free article] [PubMed] [Google Scholar]
- 9.Hutcheon JA, Platt RW, Abrams B, Himes KP, Simhan HN, Bodnar LM. A weight-gain-for-gestational-age z score chart for the assessment of maternal weight gain in pregnancy. American Journal of Clinical Nutrition. 2013;97:1062–1067. doi: 10.3945/ajcn.112.051706. [DOI] [PMC free article] [PubMed] [Google Scholar]
- 10.Xu J, Luntamo M, Kulmala T, Ashorn P, Cheung YB. A longitudinal study of weight gain in pregnancy in Malawi: unconditional and conditional standards. American Journal of Clinical Nutrition. 2014;99:296–301. doi: 10.3945/ajcn.113.074120. [DOI] [PubMed] [Google Scholar]
- 11.CDC National Center for Health Statistics Birth Edit Specifications for the 2003 Proposed Revision of the U.S. Standard Certificate of Birth. 2003 http://www.cdc.gov/nchs/data/dvs/birth_edit_specifications.pdf.
- 12.Centers for Disease Control and Prevention. National Center for Health Statistics VitalStats. 2012 Jan 17; http://www.cdc.gov/nchs/vitalstats.htm.
- 13.Bodnar LM, Siega-Riz AM, Simhan HN, Himes KP, Abrams B. Severe obesity, gestational weight gain, and adverse birth outcomes. American Journal of Clinical Nutrition. 2010;91:1642–1648. doi: 10.3945/ajcn.2009.29008. [DOI] [PMC free article] [PubMed] [Google Scholar]
- 14.Hadlock FP, Harrist RB, Martinez-Poyer J. In utero analysis of fetal growth: a sonographic weight standard. Radiology. 1991;181:129–133. doi: 10.1148/radiology.181.1.1887021. [DOI] [PubMed] [Google Scholar]
- 15.USDA Economic Research Service [May 10, 2013];Rural-Urban Comtinuum Codes. 2013 [May 5, 2014]; Available from: http://www.ers.usda.gov/data-products/rural-urban-continuum-codes.aspx#.U7WgCvldUg0.
- 16.Hernan MA, Hernandez-Diaz S, Werler MM, Mitchell AA. Causal knowledge as a prerequisite for confounding evaluation: an application to birth defects epidemiology. American Journal of Epidemiology. 2002;155:176–184. doi: 10.1093/aje/155.2.176. [DOI] [PubMed] [Google Scholar]
- 17.Harrell FE, Jr., Lee KL, Pollock BG. Regression models in clinical studies: determining relationships between predictors and response. Journal of the National Cancer Institute. 1988;80:1198–1202. doi: 10.1093/jnci/80.15.1198. [DOI] [PubMed] [Google Scholar]
- 18.Artal R, Lockwood CJ, Brown HL. Weight gain recommendations in pregnancy and the obesity epidemic. Obstetrics & Gynecology. 2010;115:152–155. doi: 10.1097/AOG.0b013e3181c51908. [DOI] [PubMed] [Google Scholar]
- 19.Rasmussen KM, Abrams B, Bodnar LM, Butte NF, Catalano PM, Maria Siega-Riz A. Recommendations for weight gain during pregnancy in the context of the obesity epidemic. Obstetrics & Gynecology. 2010;116:1191–1195. doi: 10.1097/AOG.0b013e3181f60da7. [DOI] [PMC free article] [PubMed] [Google Scholar]
- 20.Joseph KS, Fahey J, Platt RW, Liston RM, Lee SK, Sauve R, et al. An outcome-based approach for the creation of fetal growth standards: do singletons and twins need separate standards? American Journal of Epidemiology. 2009;169:616–624. doi: 10.1093/aje/kwn374. [DOI] [PMC free article] [PubMed] [Google Scholar]
- 21.Bodnar LM, Abrams B, Bertolet M, Gernand AD, Parisi SM, Himes KP, et al. Validity of birth certificate-derived maternal weight data. Paediatric and Perinatal Epidemiology. 2014;28:203–212. doi: 10.1111/ppe.12120. [DOI] [PMC free article] [PubMed] [Google Scholar]
- 22.Lash TL, Abrams B, Bodnar LM. Comparison of Bias Analysis Strategies Applied to a Large Data Set. Epidemiology. Jul. 2014;25(4):576–82. doi: 10.1097/EDE.0000000000000102. [DOI] [PMC free article] [PubMed] [Google Scholar]
Associated Data
This section collects any data citations, data availability statements, or supplementary materials included in this article.


