

Abstract
Multiple systems tauopathy with presenile dementia (MSTD), a form of frontotemporal dementia with parkinsonism-17 with tau inclusions (FTDP-17T), is a neurodegenerative disorder caused by an (a) to (g) transition at position +3 of intron 10 of the microtubule associated protein tau (MAPT) gene. The mutation causes overexpression of 4 repeat (4R) tau isoforms with increased 4R/3R ratio leading to neurodegeneration. Clinically, these patients primarily present with behavioral variant FTD (bvFTD) and show disinhibition, disordered social comportment, and impaired executive function, memory, and speech. While altered glucose metabolism has been reported in subjects with sporadic bvFTD, it has yet to be investigated in an FTDP-17 sample of this size. In this study, eleven mutation carriers (5 males; mean age = 48.0 ± 6.9 years) and eight non-carriers (2 males; mean age = 43.7 ± 12.0 years) from a MSTD family were imaged using [18F]fluorodeoxyglucose (FDG) positron emission tomography (PET). Eight of the MAPT intron 10 +3 mutation carriers met diagnostic criteria for bvFTD at the time of the PET scan, while three MAPT intron 10 +3 carriers were not cognitively impaired at the time of scan. Non-carriers had no clinically-relevant cognitive impairment at the time of the PET scan. Additionally, ten mutation carriers (5 males; mean age = 48.04 ± 2.1 years) and seven non-carriers (2 males; mean age 46.1 ± 4.1 years) underwent magnetic resonance imaging (MRI) which is an expanded sample size from a previous study. Seven MAPT mutation carriers met diagnostic criteria for bvFTD at the time of the MRI scan. Images were assessed on a voxel-wise basis for the effect of mutation carrier status. SPM8 was used for preprocessing and statistical analyses. Compared to non-carriers, MAPT mutation carriers showed lower [18F]FDG uptake bilaterally in the medial temporal lobe, and the parietal and frontal cortices. Anatomical changes were predominantly seen bilaterally in the medial temporal lobe areas which substantially overlapped with the hypometabolism findings. These anatomical and metabolic changes overlap previously described patterns of neurodegeneration in MSTD patients and are consistent with the characteristics of their cognitive dysfunction. These results suggest that neuroimaging can describe the neuropathology associated with this MAPT mutation.
Keywords: Multiple system tauopathy with presenile dementia (MSTD), frontotemporal dementia with parkinsonism-17 with tau inclusions (FTDP-17T), behavioral variant frontotemporal dementia, [18F]fluorodeoxyglucose positron emission tomography ([18F]FDG PET), microtubule associated protein tau (MAPT), magentic resonance imaging (MRI), neuroimaging
Introduction
Frontotemporal dementia (FTD) is a clinically, genetically, and pathologically heterogeneous neurodegenerative disorder which is considered to be the second leading cause of early onset dementia after Alzheimer’s disease [1]. FTD is characterized by marked changes in behavior, personality, executive function, and language.
Approximately 40-50% of patients with FTD report a positive family history of dementia, with 10% of these cases having an autosomal dominant inheritance pattern [2]. Up to 30% of familial FTD cases have been linked to genetic variations in the microtubule associated protein tau (MAPT) gene located at 17q21 [3]. These patients typically present with FTD with parkinsonism and with tau inclusions (FTDP-17T). Additional mutations in progranulin (PGRN), which is also located at 17q21, have been linked to familial FTD. However, histopathologically, mutations in PGRN are not associated with tau inclusions, while MAPT mutations are associated with tau pathology [4-6].
A family with multiple systems tauopathy with presenile dementia (MSTD), a form of FTDP-17T, was discovered by our group to have an (a) to (g) transition in MAPT intron 10 +3 [7-10]. In the normal adult human brain, six tau isoforms are expressed from the alternative splicing of MAPT exons 2, 3, and 10. The exclusion or inclusion of exon 10 leads to the expression of three (3R) or four (4R) repeat microtubule-binding domains, respectively, at a balanced ratio [11,12]. The (a) to (g) transition in this family leads to an overproduction of the 4R tau isoform. Clinically, these patients have heterogeneous presentations, but present frequently as behavioral variant FTD with changes in personality, such as disinhibition and disordered social conduct, and impaired executive function, memory, and speech [13,14]. Both clinical imaging and post-mortem assessment show marked neurodegeneration in medial temporal and frontal regions [15].
Previous studies have investigated grey matter (GM) loss and hypometabolism in sporadic bvFTD. Reduced glucose uptake measured using [18F]fluorodeoxyglucose ([18F]FDG) positron emission tomography (PET) has previously been identified in the frontal and temporal lobes, anterior cingulate cortex, anterior insula, and subcortical regions [16-23]. Additionally, [18F]FDG PET studies with other FTDP-17 families showed a reduction in glucose metabolism in temporal cortices, parietal cortices, hippocampi, and the amygdalae, although these samples were quite small [24-26]. Studies have also shown GM loss in the frontotemporal lobe regions, insula, and putamen [16,25,27,28]. However, anatomical changes and glucose metabolism in the brain has yet to be reported in this MSTD family or in a FTDP-17 sample of this size.
The goal of the present study is to investigate changes in glucose metabolism with [18F]FDG PET in MSTD to better define the metabolic features associated with MAPT mutations and further characterize this large MSTD family. Magnetic resonance was also utilized for comparison with [18F]FDG PET using an expanded sample from Spina et al [15]. While the information derived from these two imaging modalities may identify similar abnormalities in the same structure, there may be a temporal ordering of the onset of abnormalities detected by these complementary techniques. For example, glucose hypometabolism may precede GM atrophy as is observed in other familial neurodegenerative disorders [29]. We hypothesized that the MAPT intron 10 +3 mutation causes reduced glucose metabolism in carriers within this MSTD family, particularly in the medial temporal and frontal areas that are known to be susceptible to atrophy in bvFTD. We also hypothesized that clinically-affected mutation carriers would show greater glucose hypometabolism in target areas than carriers who are not yet cognitively impaired.
Methods
Subjects
Nineteen participants, including eleven MAPT intron 10 +3 mutation carriers ((eight symptomatic (SC), three asymptomatic (AC)) and eight non-carriers (NC; Table 1), underwent neurological and cognitive assessments, as well as [18F]FDG PET and structural magnetic resonance imaging (MRI) at the Indiana Alzheimer Disease Center. Demographic information for four of these SCs has previously been reported [15]. Participants were diagnosed with bvFTD using standard criteria [13,30] from neuropsychological testing, neurological examination, informant interviews, and past medical records.
Table 1.
Demographic and neuropsychological data
| Symptomatic carrier (n = 8) | Asymptomatic carrier (n = 3) | Non-carrier (n = 8) | p-value | |
|---|---|---|---|---|
| Age (years) | 50.1 ± 5.4 | 42.55 ± 8.7 | 43.7 ± 12.0 | 0.313 |
| Gender (M, F) | 5, 3 | 0, 3 | 2, 6 | 0.106 |
| Education (years) | 12.75 ± 0.9 | 14.3 ± 2.1 | 13.4 ± 1.3 | 0.764 |
| % APOE ε4+ | 25 | 0 | 62.5 | 0.106 |
| MMSE Total Score | 23.6 ± 5.6 | 28.3 ± 0.6 | 27 ± 1.6 | 0.189 |
| COWA Total Score * | 22.1 ± 10.6 | 33.7 ± 6.7 | 38.86 ± 10 | 0.045*** |
| Block Design Total * | 23.4 ± 12.8 | 33.3 ± 10 | 34.43 ± 4.2 | 0.235 |
| Word List Imm Total ** | 11.75 ± 5.5 | 28 ± 1.4* | 21.9 ± 4.6 | 0.006*** |
| Word List Del Total ** | 2.75 ± 2 | 9.5 ± 0.7* | 8.13 ± 1.6 | < 0.001*** |
M = male; F = female; MMSE = Mini-Mental State Exam; COWA = Controlled Oral Word Association; Word List Imm = CERAD Word List – Immediate Recall; Word List Del = CERAD Word List – Delayed Recall. Mean ± Standard Deviation.
Missing one non-carrier.
Missing one asymptomatic carrier.
Significant at p < 0.05.
Genotyping
Genotyping of the MAPT intron 10 +3 mutation was performed as previously described [15]. Briefly, genomic DNA was extracted using standard protocols [15] and the purified DNA product from PCR amplification was compared to the known MAPT exon 10 sequence previously determined [7].
Magnetic resonance imaging acquisition and processing
All participants underwent a structural MRI scan within 1.00 ± 1.11 days (range: 1-5 days) of the [18F]FDG PET scan. Seventeen participants, including ten MAPT intron 10 +3 mutation carriers (7 SCs, 3 ACs) and seven NCs, underwent a single T1-weighted SPGR volumetric scan on a 1.5T GE Signa scanner as previously described [15]. Two participants, one affected mutation carrier and one non-carrier, received a single T1-weighted MPRAGE volumetric scan on a 3T Siemens Trio scanner. Structural MRI scans were processed using voxel based morphometry (VBM) in SPM8 (http://www.fil.ion.ucl.ac.uk/spm/) using previously described techniques [31]. Briefly, scans were co-registered to a T1-weighted template and segmented into GM, white matter, and cerebrospinal fluid compartments using standard templates with bias correction. Unmodulated GM images were normalized to Montreal Neurologic Institute (MNI) space as 1 x 1 x 1 mm voxels and smoothed with an 8mm full-width half maximum (FWHM) Gaussian kernel. All scans underwent extensive quality control at all processing steps. Only smoothed, normalized GM images generated from the SPGR volumes acquired on the 1.5T GE scanner were used in the VBM analysis, given the differences in data acquisition for 3T scans. Parameters generated from the structural MRI segmentation were also used for [18F]FDG PET processing as described below (see PET Data Acquisition and Imaging Processing).
PET data acquisition and image processing
All participants also underwent a [18F]FDG PET scan, acquired on a Siemens EXACT HR+ scanner. After positioning within the scanner, a 10-minute transmission scan using three internal rod sources was acquired for attenuation correction. A 60-min dynamic acquisition protocol was then initiated with the injection of approximately 10 mCi of [18F]FDG using the following frame sequence: 12 x 5 s, 4 x 15 s, 2 x 30 s, 7 x 60 s, 10 x 300 s. [18F]FDG scans were reconstructed using the manufacturer’s software (CTI Molecular Imaging Inc.; Knoxville, TN) with the filtered back-projection algorithm. Corrections for scatter, randoms, and attenuation were applied.
Reconstructed [18F]FDG scans were processed using standard techniques. Using SPM8, scans were converted from ECAT to NiFTI format, coregistered to the structural MRI scan from the same visit, motion corrected, and normalized to MNI space using matrices from the same time-point MRI segmentation. A static [18F]FDG image from 30-60 minutes was created from the appropriate frames, intensity normalized using a cerebellar GM reference region to create a standardized uptake value ratio (SUVR) image for each participant, and smoothed with an 8 mm FWHM kernel. The SUVR images were then used for further analysis as described below.
Image analysis
Within the SPM8 framework, an analysis of covariance (ANCOVA) was performed on normalized MRI GM density and [18F]FDG PET SUVR maps to compare the effect of mutation status (carrier vs. non-carrier) on GM density and [18F]FDG uptake on a voxel-by-voxel basis. Age at scan and gender were used as covariates for the [18F]FDG PET analysis. Age, gender, and total intracranial volume (ICV) were used as covariates for the GM density contrasts. In addition, since five of the NCs and two of the SCs were positive for apolipoprotein (APOE) ε4 allele, which has been shown to affect glucose metabolism in late mid-life [32], we computed similar analyses for both [18F]FDG and GM density that also included APOE ε4 carrier status as a covariate. However, the inclusion of APOE ε4 carrier status did not significantly affect the observed results and thus was not included in the final reported results (data not shown). An explicit GM mask was applied to both MRI and PET analyses to restrict the search area. Significant findings were displayed using a threshold of p < 0.001 (uncorrected) for MRI, and a threshold of p < 0.01 (uncorrected) for [18F]FDG PET; for both analyses, minimum cluster size was (k) = 50 voxels. A composite image using the significant clusters for MRI and [18F]FDG PET was created to determine areas of MRI and PET overlap between mutation carriers and NCs. MarsBaR toolbox (version 0.42) in SPM was used to extract mean GM density and mean glucose uptake for the significant medial temporal lobe (MTL) clusters from MRI and PET analyses, respectively. Note that MRI results for four MAPT 10 +3 mutation carriers has been previously reported [15].
Statistical analysis
While the three diagnostic groups were too small to do voxel-based imaging analysis, we had a special interest in the AC group and wanted to determine if they showed any regional metabolic, GM density, and/or neuropsychological differences from NC and SC participants. An ANCOVA was used to test for the association of continuous demographic variables and neuropsychological test performance with mutation and diagnostic status. Gender was assessed with mutation and diagnostic status using a chi-square test. Age and years of education were used as covariates when evaluating neuropsychological test scores. Z-scores of left and right mean MTL GM density and MTL glucose uptake from the significant MTL clusters identified in previous voxel-wise analyses were calculated for each participant using means and standard deviations from the NC group. The left and right z-scores were then averaged to create a bilateral mean GM density and bilateral mean glucose uptake z-score for each participant. ANCOVA was again used to test the association of diagnostic/mutation groups (SC, AC, NC) with MTL GM density and glucose uptake z-scores. Age and gender were used as covariates for the assessment of MTL glucose uptake, while age, gender, and ICV were used as covariates for the evaluation of MTL GM density. Pairwise contrasts between groups were adjusted for multiple comparisons using a Bonferroni correction. Linear regression was used to compare MTL GM density and MTL glucose uptake. All statistical analyses were done in SPSS (version 20.0, Chicago, IL) and all graphs were created using SigmaPlot (version 10.0).
Results
Neuropsychological assessment
Demographics and neuropsychological test results are displayed in Table 1. Although not statistically significant, SCs were on average older and more likely to be male than the other groups. Thus, age and gender were used as covariates in all subsequent neuroimaging analyses. As expected, a significant association between diagnostic/mutation status group and neuropsychological performance was observed on the COWA (p = 0.045) and the CERAD Word List Immediate Recall (p = 0.006) and Delayed Recall (p < 0.001). Upon post-hoc analysis, SCs showed poorer performance on the COWA than NCs (p = 0.044). In addition, ACs and NCs showed better performance than SCs on the CERAD Word List Immediate Recall (SC vs. AC, p = 0.022; SC vs. NC, p = 0.012) and Delayed Recall (SC vs. AC, p = 0.004; SC vs. NC, p < 0.001).
MRI
Cerebral atrophy was observed in MAPT mutation carriers relative to NCs. Specifically, decreased GM density was observed bilaterally in the MTL, including in the parahippocampal gyri, hippocampi, entorhinal cortices, uncus, and amygdala, as well as in the caudate nucleus (Figure 1; voxel-wise threshold of p < 0.001 (uncorrected for multiple comparisons); k = 50 voxels). GM atrophy was also observed in mutation carriers in the precuneus, insula, medial and superior frontal gyri, and the precentral gyrus, in addition to other regions of the frontal, parietal, occipital, and lateral temporal lobes (Figure 1). However, unlike in previous bvFTD studies, there were surprisingly few differences between mutation carriers and NCs in the prefrontal cortex and cingulate gyrus.
Figure 1.

Voxel-wise analysis of the effect of MAPT intron 10 +3 mutation status on GM density. Whole-brain GM density was compared between carriers of the MAPT intron 10 +3 mutation and non-carriers. Mutation carriers show GM atrophy relative to non-carriers in regions of the medial temporal lobe (A) and other cortical and subcortical regions (B). Differences between mutation carriers and non-carriers are displayed at a voxel-wise threshold of p < 0.001 (uncorrected for multiple comparisons) and minimum cluster size (k) = 50 voxels. Age, gender, and total intracranial volume were used as covariates.
The most striking GM atrophy in mutation carriers was seen bilaterally in the MTL (Figure 1), as has been previously shown [15]. Further analysis of these regions to evaluate distribution of atrophy among diagnostic/mutation groups showed a significant overall difference in GM density z-score (Figure 3, p < 0.001). Pairwise comparisons showed reduced GM density in both AC and SC relative to NC (NC vs. AC, p = 0.022; NC vs. SC, p < 0.001). GM atrophy in AC was intermediate between that of NC and SC, with significantly more atrophy than NC but less atrophy than SC (AC vs SC, p = 0.01).
Figure 3.

Medial temporal lobe (MTL) GM density and glucose metabolism in carriers and non-carriers of the MAPT intron 10 +3 mutation. Mean GM density and glucose metabolism were extracted from the MTL clusters identified in the voxel-wise comparisons (Figures 1 and 2) using MarsBaR. Z-scores were then calculated and the effect of mutation and clinical status on GM atrophy and glucose hypometabolism was evaluated, covaried for age and gender. Total intracranial volume was also included in the analysis of GM atrophy. Significant differences between groups were observed for both GM density (p < 0.001) and glucose uptake (p < 0.001). Post-hoc comparisons of GM density showed a significant difference between all group pairs, with symptomatic carriers (SC) showing the greatest MTL atrophy and asymptomatic carriers (AC) showing intermediate MTL atrophy between SC and mutation non-carriers (NC; NC vs. AC, p = 0.022; NC vs. SC, p < 0.001; AC vs SC, p = 0.01). Post-hoc comparisons of glucose uptake demonstrated significant greater glucose metabolism in NC relative to both carrier groups (NC vs. AC (p = 0.004) and NC vs. SC (p < 0.001)), but no difference between carriers based on clinical status (p = 0.154).
[18F]FDG PET
Bilateral hypometabolism was observed in mutation carriers relative to NCs in regions of the MTL and limbic system, including the parahippocampal gyri, hippocampi, entorhinal cortices, amygdala, uncus, and the anterior cingulate cortex, as well as in the caudate nucleus (Figure 2, Table 2). Some lateralization of hypometabolism in mutation carriers relative to non-carriers was observed with more reductions in glucose metabolism in the right anterolateral temporal lobe than in the left. Other frontal and parietal cortical regions also showed hypometabolism in mutation carriers relative to non-carriers, including in the anterior prefrontal cortex, the medial and superior frontal gyri, and the postcentral gyrus (Figure 2).
Figure 2.
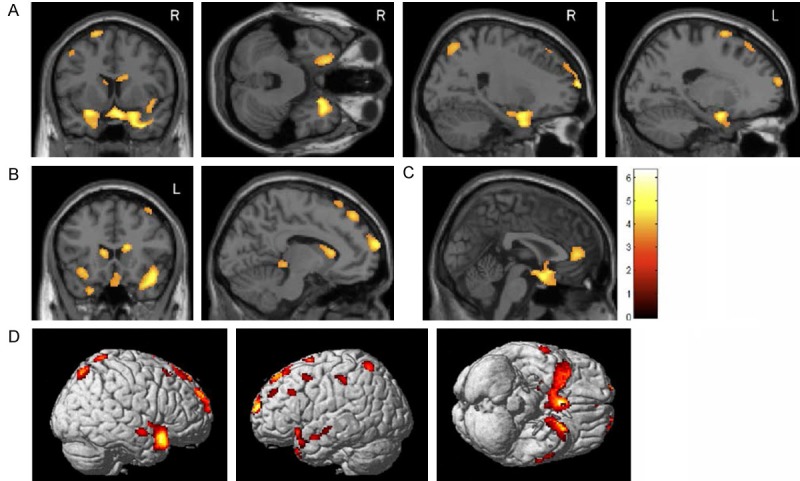
Voxel-wise analysis of the effect of MAPT intron 10 +3 mutation status on glucose metabolism. Whole-brain glucose metabolism was compared between carriers of the MAPT intron 10 +3 mutation and non-carriers. Mutation carriers showed hypometabolism relative to non-carriers in the medial temporal lobe (A), caudate nucleus (B), anterior cingulate gyrus (C), and in frontal, parietal, and temporal cortices (D). Group differences are displayed at a voxel-wise threshold of p < 0.01 (uncorrected for multiple comparisons) and minimum cluster size (k) = 50 voxels. Age and gender were used as covariates.
Table 2.
Anatomical distribution of reduced glucose metabolism for in MAPT intron 10 +3 carriers relative to non-carriers
| MNI Coordinates | ||||||
|---|---|---|---|---|---|---|
|
|
||||||
| Location | BA | T-value | x | y | z | p-value |
| L. Inferior Frontal Gyrus | 47 | 4.58 | -26 | 10 | -18 | 0.000 |
| L. Inferior Parietal Lobule | 40 | 3.11 | -58 | -32 | 46 | 0.004 |
| L. Middle Frontal Gyrus | 10 | 3.38 | -26 | 66 | 12 | 0.002 |
| 6 | 2.92 | -46 | 10 | 50 | 0.005 | |
| 9 | 3.03 | -52 | 26 | 34 | 0.004 | |
| L. Middle Temporal Gyrus | 21 | 3.29 | -56 | 2 | -18 | 0.002 |
| 2.98 | -64 | -10 | -12 | 0.005 | ||
| 2.68 | -58 | -18 | -6 | 0.009 | ||
| L. Superior Frontal Gyrus | 10 | 2.83 | -36 | 48 | 32 | 0.006 |
| 6 | 3.55 | -20 | 6 | 70 | 0.001 | |
| 3 | -8 | 28 | 66 | 0.004 | ||
| 8 | 3.96 | -6 | 44 | 52 | 0.001 | |
| 3.13 | -22 | 32 | 56 | 0.003 | ||
| L. Superior Parietal Lobule | 7 | 3.34 | -28 | -58 | 64 | 0.002 |
| L. Superior Temporal Gyrus | 10 | 4.77 | -14 | 70 | 18 | 0.000 |
| 38 | 3.85 | -22 | 14 | -34 | 0.001 | |
| L. Thalamus | 3.22 | -8 | -32 | -4 | 0.003 | |
| L. Uncus | 34 | 4.42 | -18 | 2 | -22 | 0.000 |
| R. Anterior Cingulate | 32 | 3.71 | 2 | 46 | 6 | 0.001 |
| R. Caudate Body | 3.98 | 16 | 22 | 16 | 0.001 | |
| 3.57 | 14 | 12 | 20 | 0.001 | ||
| R. Medial Frontal Gyrus | 25 | 5.29 | 8 | 6 | -22 | 0.000 |
| R. Middle Frontal Gyrus | 8 | 3.1 | 40 | 24 | 56 | 0.004 |
| R. Middle Temporal Gyrus | 21 | 3.92 | 64 | -6 | -12 | 0.001 |
| R. Postcentral Gyrus | 7 | 3.16 | 16 | -52 | 72 | 0.003 |
| R. Superior Frontal Gyrus | 10 | 4.66 | 22 | 68 | 14 | 0.000 |
| 4.1 | 16 | 62 | 28 | 0.000 | ||
| 6 | 3.11 | 14 | 32 | 60 | 0.004 | |
| 8 | 2.94 | 20 | 38 | 52 | 0.005 | |
| R. Superior Parietal Lobule | 7 | 3.47 | 18 | -68 | 58 | 0.002 |
| R. Superior Temporal Gyrus* | 38 | 5.99 | 44 | 16 | -22 | 0.000 |
| R. Uncus | 34 | 4.57 | 20 | 4 | -22 | 0.000 |
BA = Brodmann area; MNI = Montreal Neurologic Institute; L. = left; R. = right. p < 0.01, uncorrected.
Significant cluster for p < 0.05 at FWE-corrected.
Further examination of the difference in glucose metabolism among the three groups in the MTL showed a significant association of diagnostic/mutation status with mean MTL glucose SUVR z-score (Figure 3; p < 0.001). The ACs again showed mean MTL glucose uptake intermediate between the NC and SC. Comparisons of NC and AC (p = 0.004) and NC and SC (p < 0.001) reached statistical significance, whereas the AC and SC groups (p = 0.154) were not significantly different.
Comparison of MRI and [18F]FDG
In other familial neurodegenerative disorders (i.e. familial Alzheimer’s disease), hypometabolism may precede brain atrophy [29]. Therefore, we investigated the relationship between MRI and PET findings in the MSTD sample. There was moderate overlap of the regions showing neurodegeneration and those showing glucose hypometabolism in mutation carriers relative to NCs, most especially in the MTL (Figure 4). While significant overlap can be seen in MTL structures such as the uncus, hippocampus, and parahippocampal gyrus, atrophy appeared to be more widespread than hypometabolism in mutation carriers relative to NCs (Figures 3 and 4). However, other regions, including the anterior cingulate cortex and caudate nucleus, showed very little or no overlap of GM atrophy and reduced glucose metabolism. When MTL atrophy and glucose metabolism measures were directly compared, reduced GM density was highly associated with reduced glucose hypometabolism (left: r = 0.93, p < 0.001; right: r = 0.88, p < 0.001; Figure 5).
Figure 4.

Anatomical overlap of GM atrophy and glucose hypometabolism in MAPT intron 10 +3 mutation carriers relative to non-carriers. The overlap of regions showing significantly reduced GM density (red) and [18F]FDG uptake (blue) for MAPT intron 10 +3 carriers relative to non-carriers is presented. Significant overlap is observed in the medial temporal lobe and other temporal regions, while little overlap is seen in cortical and striatal regions. Images shown here are displayed at a voxel-wise threshold of p < 0.001 (uncorrected for multiple comparisons) for GM density and p < 0.01 (uncorrected for multiple comparisons) for glucose uptake, both with minimum cluster size (k) = 50 voxels. The GM density comparison was covaried for age, gender, and total intracranial volume, while the [18F]FDG PET analysis was covaried for age and gender.
Figure 5.
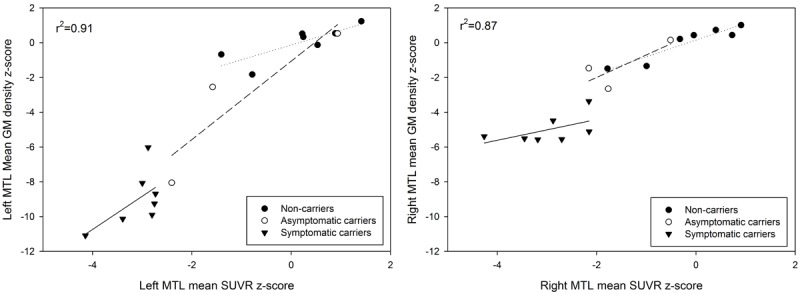
Relationship between medial temporal lobe (MTL) atrophy and hypometabolism in carriers and non-carriers of the MAPT intron 10 +3 mutation. A significant association between GM density and glucose metabolism in the left and right MTL was observed across and within groups. Individual data points represent raw GM density and [18 F]FDG SUVR values. The reported R-squared value corresponds to the correlation across all participants, covaried for age, gender, and total intracranial volume. Linear fits are shown for individual groups, including non-carriers (dotted line), asymptomatic carriers (dashed line), and symptomatic carriers (solid line).
Discussion
Although MRI and [18F]FDG PET studies have been reported for sporadic bvFTD [16-21,24], few studies have investigated changes in glucose metabolism or brain atrophy in FTDP-17T [24,33]. Our findings show that individuals with the MAPT mutation at position +3 of intron 10 have prominent GM atrophy bilaterally in the MTL regions and reduced glucose metabolism in MTL regions and the prefrontal cortex, when compared to NCs. Furthermore, ACs showed anatomical and metabolic changes intermediate between the SC and NC participants. We also observed substantial overlap in cortical atrophy and hypometabolism, specifically in MTL regions.
MRI findings
VBM results for four of the eleven MSTD patients used in this study have been previously reported, and showed extensive GM loss in the hippocampus, parahippocampal gyrus, insular cortex, and to a lesser extent, the anterior cingulate cortex, head of the caudate nucleus, posterolateral orbital cortex, and insular cortex [15]. Results in the expanded sample are similar to the previous findings by Spina et al. [15] with increased statistical power. The prominent atrophy in mutation carriers compared to NCs in the MTL is similar to findings from studies of other familial FTD with MAPT mutations [25,27,28,33-35]. However, contrary to other bvFTD studies, our results showed very little GM atrophy in the frontal lobes [36]. The MSTD patients did show anterior temporal atrophy, which is consistent with the new diagnostic criteria for bvFTD [14]. The AC group showed a level of atrophy intermediate between the NC and SC groups, with significant differences detected between all groups. This suggests that neurodegeneration occurs prior to clinical decline in mutation carriers, perhaps years before expected clinically significant decline. However, it is of importance to note that the sample size of the AC group prohibited voxel-based analysis, thus further studies should be done to increase the power of this analysis.
[18F]FDG PET metabolism
Prior bvFTD studies have demonstrated hypometabolism in frontal and temporal lobes, anterior cingulate cortex, anterior insula, and subcortical regions [16-23]. MSTD mutation carriers showed near symmetrical hypometabolism in the MTL, parietal cortex, and frontal cortex relative to NCs. Consistent with the diagnosis for probable bvFTD [14], anterior temporal hypometabolism was observed, affecting the right hemisphere more than the left. Several subcortical structures, many of which belong to the limbic system known to regulate emotion and memory, showed glucose hypometabolism in the MAPT intron 10 +3 mutation carriers when compared to NCs, consistent with the clinical presentation of these participants. These regions include the cingulate gyrus, uncus, parahippocampal gyri, entorhinal cortex, and amygdala. The most notable reduction in glucose uptake was seen in the MTL, which is similar to other studies in FTDP-17T [24,25]. Interestingly, glucose uptake in the AC group was between that of the NC and SC groups, suggesting a reduction in glucose metabolism prior to clinical decline. Utility of this FDG PET predictor biomarker will require future longitudinal follow-up studies. No significant difference in glucose metabolism was observed between AC and SC, which may be a function of the small size of the AC group or may suggest the majority of the metabolic decline occurs prior to significant clinical symptomatology. Larger samples and longitudinal follow-up should be completed to help resolve this issue.
Comparison of cortical atrophy and glucose metabolism
Cortical atrophy and hypometabolism in the MTL were strongly associated in the present study. The distribution of metabolic changes also overlaps previously described patterns of neurodegeneration in MSTD patients and are consistent with the clinical characteristics of their cognitive dysfunction [15]. The striking similarity between the MRI and [18F]FDG PET results and the high correlation of mean GM density and [18F]FDG uptake in this region also raises a question as to whether the observed hypometabolism is due to a reduction in local GM tissue in the MTL. However, given the marked effect of the MSTD mutation, it seems likely that the functional hypometabolism and structural neurodegenerative changes are occurring concurrently in these patients as two aspects of the underlying disease process. Both MTL glucose uptake and cortical atrophy in the AC group were intermediate between the NC and SC groups. The differences in cortical atrophy were significant between all groups, whereas the AC and SC participants were not significantly different in glucose uptake. In other words, the hypometabolism in ACs before onset of clinical symptomatology is similar to SC, while the change in MTL atrophy is intermediate. These results suggest the possibility that hypometabolism may occur before atrophic changes are detectable, which would support the hypothesis that the change in metabolism is not of direct consequence of atrophy, as similar findings have been observed in a previous study of Alzheimer’s disease [37]. The lack of observable atrophy in hypometabolic regions in the anterior cingulate cortex and caudate nucleus also support the hypothesis that dysfunctional glucose metabolism may precede atrophy in disease-associated regions. However, these differences between cortical atrophy and glucose metabolism, or lack thereof, could also be due to different variability in the [18F]FDG PET and structural MRI measures, which complicates interpretation.
As previously indicated, the present study contains limitations. First, the AC group was small, which permitted quantitative ROI analysis but not voxel-based mapping of differences between the three groups. Further studies with a larger samples would provide the power needed to better detect the structural and metabolic differences in ACs and would offer a better assessment of the impact of mutation status and clinical symptoms on the relative rates of cortical atrophy and cognitive dysfunction. Additionally, it is possible that the hypometabolism observed by the mutation-positive group was an effect of the cortical atrophy, as quantitative analysis of the MTL also showed the two variables (metabolism, atrophy) were highly correlated. While mutation status appeared to be causal for both the lower GM density and glucose uptake, once again, the small sample size of the AC group prevented us from having the power to fully determine the topography of differences across groups. Prospective longitudinal studies will be important in order to investigate the temporal relationships between metabolic and structural neuroimaging changes. Other functional imaging modalities could also prove informative with regard to early changes in brain networks, activation dynamics, and regional cerebral blood flow. Future studies with recently developed tau-specific PET tracers are also likely to elucidate the pattern of early changes and may provide better prediction of neurodegeneration and cognitive decline [38,39]. Overall, these results suggest that neuroimaging, in addition to genetic testing, may provide useful insights into the sequence of disease processes and characterization of the effects of MAPT mutation, especially in the prodromal stage of MSTD.
In summary, cortical atrophy and hypometabolism were observed in MSTD patients, especially in the MTL. These changes in brain structure and function are consistent with the observed cognitive dysfunction in these patients. Furthermore, reduced glucose metabolism and atrophy in the MTL were observed in ACs, suggesting these changes precede clinical onset. Future studies of expanded samples with longitudinal follow-up are needed to replicate the observed results and further elucidate the role of structural and functional brain changes in patients with MSTD.
Acknowledgements
We would like to thank the MSTD family members for their participation in this study. We would also like to thank John D. West and Tamiko R. Magee for their assistance with this project. This research was supported, in part, by grants from the National Institute on Aging (P30 AG10133, R01 AG19771) and the National Library of Medicine (R01 LM011360).
Disclosure of conflict of interest
None to declare.
References
- 1.Knopman DS, Roberts RO. Estimating the number of persons with frontotemporal lobar degeneration in the US population. J Mol Neurosci. 2011;45:330–335. doi: 10.1007/s12031-011-9538-y. [DOI] [PMC free article] [PubMed] [Google Scholar]
- 2.Rohrer JD, Guerreiro R, Vandrovcova J, Uphill J, Reiman D, Beck J, Isaacs AM, Authier A, Ferrari R, Fox NC, Mackenzie IR, Warren JD, de Silva R, Holton J, Revesz T, Hardy J, Mead S, Rossor MN. The heritability and genetics of frontotemporal lobar degeneration. Neurology. 2009;73:1451–1456. doi: 10.1212/WNL.0b013e3181bf997a. [DOI] [PMC free article] [PubMed] [Google Scholar]
- 3.Poorkaj P, Grossman M, Steinbart E, Payami H, Sadovnick A, Nochlin D, Tabira T, Trojanowski JQ, Borson S, Galasko D, Reich S, Quinn B, Schellenberg G, Bird TD. Frequency of tau gene mutations in familial and sporadic cases of non-Alzheimer dementia. Arch Neurol. 2001;58:383–387. doi: 10.1001/archneur.58.3.383. [DOI] [PubMed] [Google Scholar]
- 4.Cruts M, Kumar-Singh S, Van Broeckhoven C. Progranulin mutations in ubiquitin-positive frontotemporal dementia linked to chromosome 17q21. Curr Alzheimer Res. 2006;3:485–491. doi: 10.2174/156720506779025251. [DOI] [PubMed] [Google Scholar]
- 5.Cruts M, Gijselinck I, van der Zee J, Engelborghs S, Wils H, Pirici D, Rademakers R, Vandenberghe R, Dermaut B, Martin JJ, van Duijn C, Peeters K, Sciot R, Santens P, De Pooter T, Mattheijssens M, Van den Broeck M, Cuijt I, Vennekens K, De Deyn PP, Kumar-Singh S, Van Broeckhoven C. Null mutations in progranulin cause ubiquitin-positive frontotemporal dementia linked to chromosome 17q21. Nature. 2006;442:920–924. doi: 10.1038/nature05017. [DOI] [PubMed] [Google Scholar]
- 6.Baker M, Mackenzie IR, Pickering-Brown SM, Gass J, Rademakers R, Lindholm C, Snowden J, Adamson J, Sadovnick AD, Rollinson S, Cannon A, Dwosh E, Neary D, Melquist S, Richardson A, Dickson D, Berger Z, Eriksen J, Robinson T, Zehr C, Dickey CA, Crook R, McGowan E, Mann D, Boeve B, Feldman H, Hutton M. Mutations in progranulin cause tau-negative frontotemporal dementia linked to chromosome 17. Nature. 2006;442:916–919. doi: 10.1038/nature05016. [DOI] [PubMed] [Google Scholar]
- 7.Spillantini MG, Murrell JR, Goedert M, Farlow MR, Klug A, Ghetti B. Mutation in the tau gene in familial multiple system tauopathy with presenile dementia. Proc Natl Acad Sci U S A. 1998;95:7737–7741. doi: 10.1073/pnas.95.13.7737. [DOI] [PMC free article] [PubMed] [Google Scholar]
- 8.Murrell JR, Koller D, Foroud T, Goedert M, Spillantini MG, Edenberg HJ, Farlow MR, Ghetti B. Familial multiple-system tauopathy with presenile dementia is localized to chromosome 17. Am J Hum Genet. 1997;61:1131–1138. doi: 10.1086/301594. [DOI] [PMC free article] [PubMed] [Google Scholar]
- 9.Spillantini MG, Goedert M, Crowther RA, Murrell JR, Farlow MR, Ghetti B. Familial multiple system tauopathy with presenile dementia: a disease with abundant neuronal and glial tau filaments. Proc Natl Acad Sci U S A. 1997;94:4113–4118. doi: 10.1073/pnas.94.8.4113. [DOI] [PMC free article] [PubMed] [Google Scholar]
- 10.Spillantini MG, Bird TD, Ghetti B. Frontotemporal dementia and Parkinsonism linked to chromosome 17: a new group of tauopathies. Brain Pathol. 1998;8:387–402. doi: 10.1111/j.1750-3639.1998.tb00162.x. [DOI] [PMC free article] [PubMed] [Google Scholar]
- 11.Goedert M, Spillantini MG, Potier MC, Ulrich J, Crowther RA. Cloning and sequencing of the cDNA encoding an isoform of microtubule-associated protein tau containing four tandem repeats: differential expression of tau protein mRNAs in human brain. EMBO J. 1989;8:393–399. doi: 10.1002/j.1460-2075.1989.tb03390.x. [DOI] [PMC free article] [PubMed] [Google Scholar]
- 12.Goedert M, Spillantini MG, Jakes R, Rutherford D, Crowther RA. Multiple isoforms of human microtubule-associated protein tau: sequences and localization in neurofibrillary tangles of Alzheimer’s disease. Neuron. 1989;3:519–526. doi: 10.1016/0896-6273(89)90210-9. [DOI] [PubMed] [Google Scholar]
- 13.Neary D, Snowden JS, Gustafson L, Passant U, Stuss D, Black S, Freedman M, Kertesz A, Robert PH, Albert M, Boone K, Miller BL, Cummings J, Benson DF. Frontotemporal lobar degeneration: a consensus on clinical diagnostic criteria. Neurology. 1998;51:1546–1554. doi: 10.1212/wnl.51.6.1546. [DOI] [PubMed] [Google Scholar]
- 14.Rascovsky K, Hodges JR, Knopman D, Mendez MF, Kramer JH, Neuhaus J, van Swieten JC, Seelaar H, Dopper EG, Onyike CU, Hillis AE, Josephs KA, Boeve BF, Kertesz A, Seeley WW, Rankin KP, Johnson JK, Gorno-Tempini ML, Rosen H, Prioleau-Latham CE, Lee A, Kipps CM, Lillo P, Piguet O, Rohrer JD, Rossor MN, Warren JD, Fox NC, Galasko D, Salmon DP, Black SE, Mesulam M, Weintraub S, Dickerson BC, Diehl-Schmid J, Pasquier F, Deramecourt V, Lebert F, Pijnenburg Y, Chow TW, Manes F, Grafman J, Cappa SF, Freedman M, Grossman M, Miller BL. Sensitivity of revised diagnostic criteria for the behavioural variant of frontotemporal dementia. Brain. 2011;134:2456–2477. doi: 10.1093/brain/awr179. [DOI] [PMC free article] [PubMed] [Google Scholar]
- 15.Spina S, Farlow MR, Unverzagt FW, Kareken DA, Murrell JR, Fraser G, Epperson F, Crowther RA, Spillantini MG, Goedert M, Ghetti B. The tauopathy associated with mutation +3 in intron 10 of Tau: characterization of the MSTD family. Brain. 2008;131:72–89. doi: 10.1093/brain/awm280. [DOI] [PMC free article] [PubMed] [Google Scholar]
- 16.Kanda T, Ishii K, Uemura T, Miyamoto N, Yoshikawa T, Kono AK, Mori E. Comparison of grey matter and metabolic reductions in frontotemporal dementia using FDG-PET and voxel- based morphometric MR studies. Eur J Nucl Med Mol Imaging. 2008;35:2227–2234. doi: 10.1007/s00259-008-0871-5. [DOI] [PubMed] [Google Scholar]
- 17.Ishii K, Sakamoto S, Sasaki M, Kitagaki H, Yamaji S, Hashimoto M, Imamura T, Shimomura T, Hirono N, Mori E. Cerebral glucose metabolism in patients with frontotemporal dementia. J Nucl Med. 1998;39:1875–1878. [PubMed] [Google Scholar]
- 18.Jeong Y, Cho SS, Park JM, Kang SJ, Lee JS, Kang E, Na DL, Kim SE. 18F-FDG PET findings in frontotemporal dementia: an SPM analysis of 29 patients. J Nucl Med. 2005;46:233–239. [PubMed] [Google Scholar]
- 19.Hoffmann M. Frontal network syndrome testing: clinical tests and positron emission tomography brain imaging help distinguish the 3 most common dementia subtypes. Am J Alzheimers Dis Other Demen. 2013;28:477–484. doi: 10.1177/1533317513488920. [DOI] [PMC free article] [PubMed] [Google Scholar]
- 20.Bastin C, Feyers D, Souchay C, Guillaume B, Pepin JL, Lemaire C, Degueldre C, Collette F, Salmon E. Frontal and posterior cingulate metabolic impairment in the behavioral variant of frontotemporal dementia with impaired autonoetic consciousness. Hum Brain Mapp. 2012;33:1268–1278. doi: 10.1002/hbm.21282. [DOI] [PMC free article] [PubMed] [Google Scholar]
- 21.Teune LK, Bartels AL, de Jong BM, Willemsen AT, Eshuis SA, de Vries JJ, van Oostrom JC, Leenders KL. Typical cerebral metabolic patterns in neurodegenerative brain diseases. Mov Disord. 2010;25:2395–2404. doi: 10.1002/mds.23291. [DOI] [PubMed] [Google Scholar]
- 22.Peters F, Perani D, Herholz K, Holthoff V, Beuthien- Baumann B, Sorbi S, Pupi A, Degueldre C, Lemaire C, Collette F, Salmon E. Orbitofrontal dysfunction related to both apathy and disinhibition in frontotemporal dementia. Dement Geriatr Cogn Disord. 2006;21:373–379. doi: 10.1159/000091898. [DOI] [PubMed] [Google Scholar]
- 23.Salmon E, Garraux G, Delbeuck X, Collette F, Kalbe E, Zuendorf G, Perani D, Fazio F, Herholz K. Predominant ventromedial frontopolar metabolic impairment in frontotemporal dementia. Neuroimage. 2003;20:435–440. doi: 10.1016/s1053-8119(03)00346-x. [DOI] [PubMed] [Google Scholar]
- 24.Lindquist SG, Holm IE, Schwartz M, Law I, Stokholm J, Batbayli M, Waldemar G, Nielsen JE. Alzheimer disease-like clinical phenotype in a family with FTDP-17 caused by a MAPT R406W mutation. Eur J Neurol. 2008;15:377–385. doi: 10.1111/j.1468-1331.2008.02069.x. [DOI] [PubMed] [Google Scholar]
- 25.Arvanitakis Z, Witte RJ, Dickson DW, Tsuboi Y, Uitti RJ, Slowinski J, Hutton ML, Lin SC, Boeve BF, Cheshire WP, Pooley RA, Liss JM, Caviness JN, Strongosky AJ, Wszolek ZK. Clinical-pathologic study of biomarkers in FTDP-17 (PPND family with N279K tau mutation) Parkinsonism Relat Disord. 2007;13:230–239. doi: 10.1016/j.parkreldis.2006.10.007. [DOI] [PubMed] [Google Scholar]
- 26.Lossos A, Reches A, Gal A, Newman JP, Soffer D, Gomori JM, Boher M, Ekstein D, Biran I, Meiner Z, Abramsky O, Rosenmann H. Frontotemporal dementia and parkinsonism with the P301S tau gene mutation in a Jewish family. J Neurol. 2003;250:733–740. doi: 10.1007/s00415-003-1074-4. [DOI] [PubMed] [Google Scholar]
- 27.Whitwell JL, Weigand SD, Boeve BF, Senjem ML, Gunter JL, DeJesus-Hernandez M, Rutherford NJ, Baker M, Knopman DS, Wszolek ZK, Parisi JE, Dickson DW, Petersen RC, Rademakers R, Jack CR Jr, Josephs KA. Neuroimaging signatures of frontotemporal dementia genetics: C9ORF72, tau, progranulin and sporadics. Brain. 2012;135:794–806. doi: 10.1093/brain/aws001. [DOI] [PMC free article] [PubMed] [Google Scholar]
- 28.Whitwell JL, Jack CR Jr, Boeve BF, Senjem ML, Baker M, Rademakers R, Ivnik RJ, Knopman DS, Wszolek ZK, Petersen RC, Josephs KA. Voxel-based morphometry patterns of atrophy in FTLD with mutations in MAPT or PGRN. Neurology. 2009;72:813–820. doi: 10.1212/01.wnl.0000343851.46573.67. [DOI] [PMC free article] [PubMed] [Google Scholar]
- 29.Bateman RJ, Xiong C, Benzinger TL, Fagan AM, Goate A, Fox NC, Marcus DS, Cairns NJ, Xie X, Blazey TM, Holtzman DM, Santacruz A, Buckles V, Oliver A, Moulder K, Aisen PS, Ghetti B, Klunk WE, McDade E, Martins RN, Masters CL, Mayeux R, Ringman JM, Rossor MN, Schofield PR, Sperling RA, Salloway S, Morris JC Dominantly Inherited Alzheimer Network. Clinical and biomarker changes in dominantly inherited Alzheimer’s disease. N Engl J Med. 2012;367:795–804. doi: 10.1056/NEJMoa1202753. [DOI] [PMC free article] [PubMed] [Google Scholar]
- 30.McKhann GM, Albert MS, Grossman M, Miller B, Dickson D, Trojanowski JQ Work Group on Frontotemporal Dementia and Pick’s Disease. Clinical and pathological diagnosis of frontotemporal dementia: report of the Work Group on Frontotemporal Dementia and Pick’s Disease. Arch Neurol. 2001;58:1803–1809. doi: 10.1001/archneur.58.11.1803. [DOI] [PubMed] [Google Scholar]
- 31.Risacher SL, Kim S, Shen L, Nho K, Foroud T, Green RC, Petersen RC, Jack CR Jr, Aisen PS, Koeppe RA, Jagust WJ, Shaw LM, Trojanowski JQ, Weiner MW, Saykin AJ Alzheimer’s Disease Neuroimaging Initiative (ADNI)†. The role of apolipoprotein E (APOE) genotype in early mild cognitive impairment (E-MCI) Front Aging Neurosci. 2013;5:11. doi: 10.3389/fnagi.2013.00011. [DOI] [PMC free article] [PubMed] [Google Scholar]
- 32.Reiman EM, Caselli RJ, Yun LS, Chen K, Bandy D, Minoshima S, Thibodeau SN, Osborne D. Preclinical evidence of Alzheimer’s disease in persons homozygous for the epsilon 4 allele for apolipoprotein E. N Engl J Med. 1996;334:752–758. doi: 10.1056/NEJM199603213341202. [DOI] [PubMed] [Google Scholar]
- 33.Miyoshi M, Shinotoh H, Wszolek ZK, Strongosky AJ, Shimada H, Arakawa R, Higuchi M, Ikoma Y, Yasuno F, Fukushi K, Irie T, Ito H, Suhara T. In vivo detection of neuropathologic changes in presymptomatic MAPT mutation carriers: a PET and MRI study. Parkinsonism Relat Disord. 2010;16:404–408. doi: 10.1016/j.parkreldis.2010.04.004. [DOI] [PubMed] [Google Scholar]
- 34.Whitwell JL, Josephs KA, Rossor MN, Stevens JM, Revesz T, Holton JL, Al-Sarraj S, Godbolt AK, Fox NC, Warren JD. Magnetic resonance imaging signatures of tissue pathology in frontotemporal dementia. Arch Neurol. 2005;62:1402–1408. doi: 10.1001/archneur.62.9.1402. [DOI] [PubMed] [Google Scholar]
- 35.Rohrer JD. Imaging in familial FTD: results of the Genetic FTD Initiative. Paper presented at the 9th International Conference on Frontotemporal Dementias, Vancouver, Canada. 2014 [Google Scholar]
- 36.Rosen HJ, Gorno-Tempini ML, Goldman WP, Perry RJ, Schuff N, Weiner M, Feiwell R, Kramer JH, Miller BL. Patterns of brain atrophy in frontotemporal dementia and semantic dementia. Neurology. 2002;58:198–208. doi: 10.1212/wnl.58.2.198. [DOI] [PubMed] [Google Scholar]
- 37.Ibanez V, Pietrini P, Alexander GE, Furey ML, Teichberg D, Rajapakse JC, Rapoport SI, Schapiro MB, Horwitz B. Regional glucose metabolic abnormalities are not the result of atrophy in Alzheimer’s disease. Neurology. 1998;50:1585–1593. doi: 10.1212/wnl.50.6.1585. [DOI] [PubMed] [Google Scholar]
- 38.Chien DT, Szardenings AK, Bahri S, Walsh JC, Mu F, Xia C, Shankle WR, Lerner AJ, Su MY, Elizarov A, Kolb HC. Early clinical PET imaging results with the novel PHF-tau radioligand [F18] -T808. J Alzheimers Dis. 2014;38:171–184. doi: 10.3233/JAD-130098. [DOI] [PubMed] [Google Scholar]
- 39.Chien DT, Bahri S, Szardenings AK, Walsh JC, Mu F, Su MY, Shankle WR, Elizarov A, Kolb HC. Early clinical PET imaging results with the novel PHF-tau radioligand [F-18] -T807. J Alzheimers Dis. 2013;34:457–468. doi: 10.3233/JAD-122059. [DOI] [PubMed] [Google Scholar]