

Abstract
Multiple sclerosis (MS) is characterized by the formation of demyelinating lesions in the white matter (WM). However, the timecourse of the evolution of healthy white matter into fully demyelinated lesions in MS is not well understood. We use a recently proposed technique to examine magnetization transfer ratio (MTR) timecourses in lesions segmented from MTR images in patients with relapsing–remitting MS (RRMS) and secondary progressive MS (SPMS). In both groups we found MTR lesions forming both in previously normal appearing WM (de novo lesions) as well as in previously lesional tissue that appears to be experiencing a second round of inflammatory demyelination (repeat lesions). Both de novo and repeat lesions exhibited significant, but incomplete MTR recovery, suggesting partial remyelination; post-lesion MTR values in de novo lesions were similar to pre-lesion values in repeat lesions. Both de novo and repeat lesions were found in subjects in relapsing–remitting and secondary progressive stages of MS, and repeat lesions appeared relatively more common in the secondary progressive phase. These observations support the hypothesis that entirely demyelinated lesions found on histopathology are the result of multiple episodes of demyelination and incomplete remyelination, and may have implications for MS treatment development efforts aimed at neuroprotection and enhancing remyelination.
Keywords: Magnetic resonance imaging, Multiple sclerosis, Magnetization transfer ratio, Remyelination
Highlights
-
•
We imaged multiple sclerosis lesions with magnetization transfer ratio (MTR) MRI.
-
•
MTR is sensitive and reasonably specific to changes in myelin in MS.
-
•
MTR decrease and recovery (de- and re-myelination) occurred in new and old lesions.
-
•
Fully demyelinated lesions may not be the result of complete failure to remyelinate.
-
•
MS lesions may undergo multiple episodes of demyelination and partial remyelination.
1. Introduction
Multiple sclerosis (MS) is an inflammatory demyelinating disease of the central nervous system. The most prominent feature of MS is the formation of demyelinated lesions in the white matter (WM), which are associated with a breakdown in the blood–brain barrier (BBB) and invasion of peripheral immune cells into brain tissue, causing inflammatory demyelination. Although very effective remyelination routinely occurs following demyelination associated with traumatic injury (Lasiene et al., 2008), in many experimental models of MS, and even in many MS lesions (Fancy et al., 2010; Patrikios et al., 2006; Salgado-Ceballos et al., 1998), histopathological studies show that remyelination does frequently fail (Patrikios et al., 2006). Lesions with no evidence of remyelination are typical at autopsy (Miller et al., 1996). Discovering the reasons for this failure is particularly important as drug discovery efforts have expanded to include neuroprotective and remyelination promoting strategies (Franklin et al., 2002).
Histopathological studies can examine in great detail various aspects of the inflammatory, demyelinating and remyelinating processes occurring in MS, but can only indirectly examine the dynamic process of lesion formation and repair. Additionally, tissue available for histopathological investigation is dominated by samples from patients who have died of either long-standing or particularly aggressive MS. Because of this, the detailed timecourse of the evolution of healthy white matter into fully demyelinated lesions in MS is not well understood. Histopathological studies have provided apparently divergent results (Patrikios et al., 2006), and some authors have concluded that remyelination is only transient, with newly remyelinated tissue quickly demyelinating again (Frohman et al., 2006) or that it fails more frequently in chronic forms of the disease (Goldschmidt et al., 2009).
One longstanding hypothesis proposes that MS lesions routinely remyelinate, although not completely, and the fully demyelinated chronic lesions seen at autopsy are the result of repeated episodes of demyelination in the same tissue (Ludwin, 1980). Histopathological observations of what appear to be demyelinated lesions partially overlapping shadow plaques (Prineas et al., 1993) provide indirect evidence for this hypothesis. Several studies have induced repeated demyelination in predictable locations using animals fed Cuprizone (Johnson and Ludwin, 1981; Mason et al., 2001) or injection of demyelination-inducing compounds directly into the brain or spinal cord (Penderis et al., 2003) with results ranging from no sign of impaired remyelination after repeated demyelination (Penderis et al., 2003) to slower, less complete remyelination (Johnson and Ludwin, 1981).
MS lesions can also be visualized using magnetic resonance imaging (MRI) and serial MRI studies can provide information about the dynamic nature of MS lesion formation. While conventional MRI is not myelin-specific, several MRI techniques have emerged that may provide a more direct means of investigating demyelination, remyelination and lesion development over time. Myelin water fraction (MWF), derived from multicomponent T2 mapping (Mackay et al., 1994); restricted proton pool size, derived from quantitative magnetization transfer (qMT) imaging (Sled and Pike, 2001); and magnetization transfer ratio (MTR) (Wolff and Balaban, 1989) provide change measures that are sensitive and reasonably specific to changes in myelin content in MS white matter. MTR, in particular, is easy to compute from conventional images acquired with and without a magnetization transfer prepulse, is available as a stock sequence option on most recent scanners, and is therefore suitable for use in clinical trials. MTR has been histopathologically validated as a marker of myelin content in both humans and animals, and has a specificity similar to Luxol fast blue (Barkhof et al., 2003; Chen et al., 2007; Deloire-Grassin et al., 2000; Dousset et al., 1992; Pike et al., 2000; Schmierer et al., 2004).
Several studies to date have used these imaging techniques to look for overall abnormalities in the WM (Filippi et al., 2000; Levesque et al., 2010; Rocca et al., 1999; van Buchem et al., 1999), or within conventional MRI lesion types (Chen et al., 2007, 2008; Richer et al., 2001). Recently we have demonstrated a technique, based on MTR imaging, for identifying “∆MTR lesions”: focal areas of significant MTR change (Brown et al., 2012) that are more specific to changes in myelin than in lesions on T1-weighted (T1), T2-weighted (T2) or gadolinium contrast-enhanced (Gd) images and can also identify recurrent demyelination. Analysis of the longitudinal changes in MTR within ∆MTR lesions is a statistically powerful method for determining differences in MTR recovery (Brown et al., 2012).
In this study we examined MTR timecourses in ∆MTR lesions that appeared either in NAWM or in previously T2 hyperintense tissue. T2 hyperintensity (i.e. a T2 lesion) is generally used as a marker of a previous focal inflammatory demyelinating episode in MS. Therefore, while ∆MTR lesions arising in NAWM (de novo lesions) might be examples of initial foci of demyelination, those found in already T2 hyperintense tissue (repeat lesions) may be subsequent demyelination in tissue that has already experienced a cycle of demyelination followed by remyelination. Thus, we investigated the hypothesis that white matter experiences repeated episodes of focal demyelination and remyelination.
2. Methods
2.1. Data and processing
Two datasets were used (demographic values are mean ± standard deviation): (1) a group of 18 relapsing–remitting MS (RRMS) patients (11 females, age 39 ± 8 years, disease duration 7 ± 9 years) and (2) a group of 88 subjects with secondary progressive MS (SPMS). Detailed demographic information was not available for the SPMS group. However, these were a subset of the group described in Freedman et al. (2011) (64% females; mean age 50, range 23–72 years; disease duration 9 years); all subjects from imaging sites that had at least one scan of a normal control, required for MTR normalization, were used.
Subjects in the RRMS group were treated with teriflunomide and imaged approximately monthly for 2 years. The SPMS group was scanned at baseline and at three, six, twelve and eighteen months and treated with MBP8298. For both groups, image contrasts acquired at each timepoint included T1, T2 and proton density weighted (PD) scans, plus images with and without a magnetization transfer preparation pulse (MTon and MToff). Imaging for the RRMS group was performed on a 1.5 T Phillips ACS II and the MT imaging consisted of a T1-FFE sequence (TR = 35 ms; TE = 10 ms; 40° flip angle) with and without an MT pre-pulse (on-resonance, binomial 1-2′-1 pulse; length 1200 µs). The SPMS group was a subset of a multicenter trial; subjects scanned at sites that had MTR data from a normal control, required for normalization, were used. The subjects used were scanned at 14 sites using stock MTR sequences on each 1.5 T scanner. These were GE: 3D SPGR, TR/TE 33–35/8–10 ms, 15° flip + 8 ms Fermi pulse, 1200 Hz off- resonance; Siemens: 3D FLASH, TR/TE 30/11 ms, 15° flip + Gaussian 7.68 ms 250 Hz bandwidth, 1500 Hz offset, 500° effective flip; Phillips: 3D T1-FFE, TR/TE 40/8 ms, 15° flip + Gaussian 1200 Hz off-resonance. Images for both groups had 1 × 1 × 3 mm voxels and whole brain (60 slices) coverage.
Since the subjects in each group were scanned on different machines, enrolled in different studies and treated with different agents, the two groups are not directly comparable. However, we examined both separately, using the same methods, for evidence of repeated demyelination in both RRMS and SPMS.
MTon and MToff scans were coregistered and used to calculate an MTR image using previously published techniques (Brown et al., 2012). The MToff and other scans from each timepoint were also co-registered to the T1w scan, and each T1w scan coregistered to the T1w scan from the subject's first timepoint. The resulting set of transforms allowed all images from each subject to be transformed into a common space for analysis. All coregistration used a six degree of freedom (translation and rotation) linear transform (minctracc, McConnell Brain Imaging Centre, Montreal) (Collins et al., 1994). MTR data from different scanners were normalized and ∆MTR lesions were segmented using the procedures in Brown et al. (2012). MTR normalization not only allowed the pooling of data from different scanners, but also placed the MTR measurements on a calibrated scale (Brown et al., 2011a, b). On this scale, normal white matter has a value of 1.0 and normal gray matter 0.0. Thus, the difference between normal gray and white matter is one unit.
Lesions were divided into de novo and repeat lesions. We assumed that ∆MTR lesions appearing in previously NAWM represented a first round of demyelination, while those occurring in previously T2 hyperintense tissue were a subsequent, repeat round of demyelination. Individual lesions that consisted of both a de novo and a repeat portion were split into separate de novo and repeat lesions. This is consistent with the histopathological observation that new demyelinating lesions sometimes overlap shadow plaques (Prineas et al., 1993).
MTR timecourses for each lesion were constructed. Each timecourse consisted of at least one MTR measurement at a minimum of 1 month prior to lesion appearance (baseline), one measurement at the time the lesion first became evident (acute), and a number of follow-up measurements at least 3 months after lesion appearance (follow-up).
Data were collected with the written informed consent of the subjects involved and the approval of the institutional ethics review boards of the collecting sites.
2.2. Analysis
MTR timecourses in lesions were modeled with a general linear mixed model, according to the R formula:
where acuteLesion and postLesion are binary variables indicating whether the measurement was from the acute or post-lesion phase (both of these equal to zero indicates the baseline state) and lesionType is a categorical variable equal to either “denovo” or “repeat”. A “:” indicates an interaction between two variables. The last term, in brackets, is a random effect of lesion nested within timepoint, within subject. This term allows a lesion-specific random intercept and allows for correlation among measurements in lesions in the same subject and at the same timepoint. This model was fit to each of the RRMS and SPMS datasets individually. During fitting, observations were weighted by the volume of the lesion. Since the measured MTR values are averages over the voxels in each lesion, measurements from larger lesions are expected to have lower variance.
The overall fit of each model was evaluated by comparing the log-likelihoods of the model and a null model using a χ2 test. If this was significant, f-tests were performed on the individual effects. Denominator degrees of freedom for the f-tests were estimated using a Satterthwaite approximation. R2 values were produced according to Nakagawa and Schielzeth (2012), where the marginal R2 is the variance explained by the fixed effects alone, and the conditional R2 includes the contribution of the random effects.
Image processing and statistical analysis were performed using custom software written in Python (Python Software Foundation, http://python.org) using the MINC tools (MINC tools, McConnell Brain Imaging Centre, Montreal), the Scientific Python package (SciPy, http://www.scipy.org), the RPy2 module (RPy2, http://rpy.sourceforge.net) the R statistical package (R Team, 2010) and the lme4 (Bates et al., 2011) and MixMod (Kuznetsova and Brockhoff, 2012) R modules. Error bars and values are 95% confidence intervals.
3. Results
Both de novo and repeat lesions were successfully segmented, with some examples shown in Fig. 1. Characteristic MTR timecourses were obtained for both lesion types, from both groups (Fig. 2).
Fig. 1.
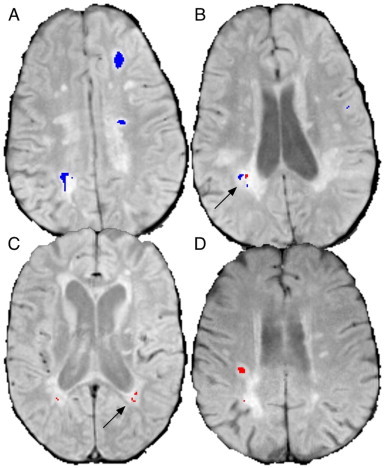
Examples of segmented de novo and repeat lesions. (A) shows large de novo (blue) lesions and (B), a lower slice from the same subject, shows de novo and repeat (red) lesions in close proximity (arrow). (C) shows periventricular repeat lesions with no de novo activity (arrow) and (D) shows a large repeat lesion.
Fig. 2.
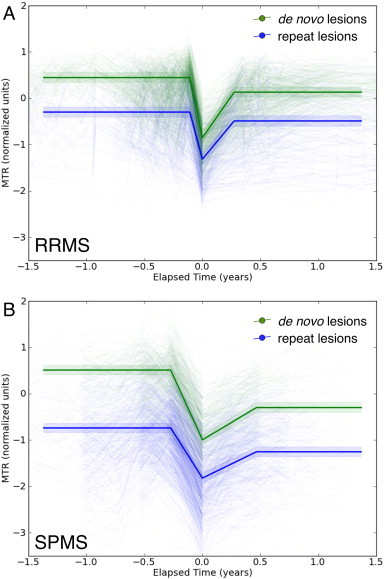
MTR timecourses in de novo (green) and repeat (blue) ∆MTR lesions from subjects with RRMS (A) and SPMS (B). All lesions showed characteristic timecourses with MTR decreasing at the time of lesion formation (time 0), then recovering partially afterward. Pre-lesion MTR values in repeat lesions were similar, though lower, to post-recovery values in de novo lesions. Heavy lines are predictions from the model while light lines are individual lesion timecourses. Shaded areas indicate 95% confidence intervals.
Table 1 contains descriptive statistics on the observed numbers and volumes of de novo and repeat lesions, as well as the ratio between them. De novo lesions were more common in the RRMS group, with a median volume ratio of 3:1, but repeat lesions were slightly more common in the SPMS group, with the de novo to repeat volume ratio at 0.75:1.
Table 1.
Descriptive statistics for lesions. STD is standard deviation and IQR is the inter-quartile ratio. De novo lesions were more common than repeat lesions in the RRMS group. The SPMS group had fewer lesions and a more even ratio between de novo and repeat.
| Lesion type | Mean (STD) | Median (IQR) | Mean (STD)/year | Median (IQR)/year | |
|---|---|---|---|---|---|
| RRMS | |||||
| Volume (mm3) |
T2 | 7374 (8729) | 2315 (10,125) | ||
| de novo | 181 (249) | 42 (298) | 2426 (3718) | 710 (2838) | |
| repeat | 43 (72) | 7.9 (50) | 818 (1246) | 252 (878) | |
| Volume (% of T2) |
de novo | 3.5 (5.7) | 1.4 (3.8) | 36 (56) | 18 (34) |
| repeat | 0.64 (1.0) | 0.19 (0.94) | 11 (16) | 0.19 (0.94) | |
| Count | de novo | 5.4 (6.6) | 2.0 (9.0) | 76 (114) | 26 (88) |
| repeat | 2.5 (3.8) | 1.0 (3.0) | 47 (72) | 19 (42) | |
| Volume ratio | de novo : repeat | 11 (22) | 3.2 (9.3) | ||
| Count ratio | 3.5 (5.7) | 1.0 (4.0) | |||
| SPMS | |||||
| Volume (mm3) |
T2 | 10,867 (10,292) | 8201 (11,083) | ||
| de novo | 79.8 (152) | 26 (86) | 411 (670) | 189 (305) | |
| repeat | 95 (126) | 49 (137) | 544 (713) | 251 (438) | |
| Volume (% of T2) |
de novo | 0.91 (2.1) | 0.28 (0.77) | 4.4 (8.8) | 1.6 (3.9) |
| repeat | 0.83 (1.1) | 0.43 (1.1) | 3.9 (6.3) | 2.5 (3.5) | |
| Count | de novo | 2.1 (2.6) | 1.0 (3.0) | 11 (12) | 7.0 (8.6) |
| repeat | 3.4 (4.0) | 2.0 (5.0) | 16 (17) | 10 (17) | |
| Volume ratio | de novo : repeat | 2.3 (4.9) | 0.75 (1.6) | ||
| Count ratio | 0.97 (1.9) | 0.0 (1.0) | |||
Results of modeling the MTR timecourses are in Table 2, with the timecourses themselves shown in Fig. 2. MTR decreased as lesions formed (p < 0.0001) and increased on follow-up (p < 0.0001). The intercepts of 0.45 in RRMS and 0.51 in SPMS suggest that MTR values were low even in the NAWM preceding the formation of de novo lesions (normal WM has a median value of 1.0). Follow-up MTR in de novo lesions in both groups was lower than that at baseline, though higher than that at the acute timepoint, indicating partial recovery after the severe drop at the time of lesion formation. The timecourses in repeat lesions were very similar to those in de novo lesions, but with initial, pre-lesion MTR values that were much lower than those in de novo lesions (p < 0.0001). Average recovery of repeat lesions was poorer than that of de novo lesions, relative to their pre-lesion values, but this difference was only significant in the SPMS group (SPMS: p = 0.017; RRMS: p = 0.068).
Table 2.
Fixed effect estimates for the general linear mixed model of MTR in ∆MTR lesions for subjects with RRMS. The model is significant with 9022 samples from 120 subject-timepoints in 18 subjects, χ2 = 5925 on 5 degrees of freedom, p < 0.0001. The ‘:’ in an effect denotes an interaction. dDF is the estimated denominator degrees of freedom. Predictions are included to help interpretation but statistics apply to the effect estimates.
|
RRMS subjects, 120 timepoints, 1037 lesions, 9022 samples | ||||||
|---|---|---|---|---|---|---|
| χ2 = 5925; 5 | DF; p < 0.0001; R2 marginal |
= 0.45; R2 conditional = 0.67 |
||||
| Effect | Prediction (nMU) |
Estimate (nMU) |
Std Error |
dDF | f | p |
| Intercept (de novo lesions, baseline) |
0.45 | 0.45 | 0.053 | |||
| Acute | −0.85 | −1.29 | 0.016 | 8072 | 4087 | <0.0001 |
| Post-recovery | 0.13 | −0.31 | 0.014 | 7985 | 146 | <0.0001 |
| Repeat lesions | −0.29 | −0.74 | 0.025 | 5171 | 865 | <0.0001 |
| Repeat lesions: acute | −1.31 | 0.28 | 0.037 | 8119 | 20.6 | <0.0001 |
| Repeat lesions: follow-up | −0.49 | 0.12 | 0.030 | 8789 | 3.34 | 0.068 |
|
SPMS subjects, 221 timepoints, 1283 lesions, 5548 samples | ||||||
|---|---|---|---|---|---|---|
| χ2 = 4794; 5 | DF; p < 0.0001; R2 marginal |
= 0.47; R2 conditional = 0.78 |
||||
| Effect | Prediction (nMU) |
Estimate (nMU) |
Std Error |
dDF | f | p |
| Intercept (de novo lesions, baseline) |
0.51 | 0.51 | 0.051 | |||
| Acute | −0.99 | −1.51 | 0.025 | 4295 | 4485 | >0.0001 |
| Post-recovery | −0.30 | −0.81 | 0.030 | 4410 | 700 | >0.0001 |
| Repeat lesions | −0.74 | −1.25 | 0.029 | 5144 | 1612 | >0.0001 |
| Repeat lesions: acute | −1.82 | 0.42 | 0.033 | 4323 | 20.4 | >0.0001 |
| Repeat lesions: follow-up | −1.25 | 0.29 | 0.039 | 4655 | 5.70 | 0.017 |
Note that the interactions listed in Table 2 indicate effects over and above the main effects. For example, the non-significant repeat lesions:follow-up effect in the RRMS group does not mean that repeat lesions in the RRMS group did not experience significant MTR recovery. Rather, these lesions did not experience a significantly different amount of recovery than did de novo lesions in the RRMS group.
4. Discussion
We observed abnormally low MTR values in normal appearing white matter before the formation of a de novo lesion, consistent with studies that have found evidence for diffuse damage in normal appearing tissue in MS (De Stefano et al., 2002) and focal MTR decrease up to 2 years before lesion formation (Filippi et al., 1998; Goodkin et al., 1998; Pike et al., 2000). We also measured significant MTR recovery in both lesion types in both groups, suggesting that remyelination is common in both forms of MS. This observation is consistent with histopathological studies that have found extensive remyelination (Patrikios et al., 2006). However, mean MTR did not recover to pre-lesion levels, indicating that remyelination was incomplete.
By examining novel ∆MTR lesions, we were able to identify MTR changes not only in previously normal appearing tissue, but also in existing T2 lesions. These repeat ∆MTR lesions were as common as de novo lesions in SPMS, (Table 1), and exhibited MTR timecourses that were remarkably similar in shape to those in de novo lesions, but with baseline MTR values somewhat lower than follow-up values in de novo lesions. This latter observation suggests that the repeat lesions could be a subsequent round of demyelination in already damaged tissue. The difference between follow-up de novo lesion MTR and baseline repeat lesion MTR could be due to repeat lesions being a mixture of second, third or subsequent episodes, or a slow decline in MTR between major inflammatory events. To address this, we refit our models with an additional term measuring the slope of the baseline MTR timecourses. MTR in repeat lesions was not significantly decreasing prior to repeat lesion formation in either RRMS or SPMS; the mean baseline MTR rose slightly, though not significantly (RRMS: p = 0.81, SPMS: p = 0.14) in both groups.
Both de novo and repeat lesions experienced only partial MTR recovery. This may be due to a combination of three mechanisms: (1) microscopic inspection has shown that the myelin sheaths produced by remyelination are thinner (Bruck et al., 2003; Perier and Gregoire, 1965; Prineas and Connell, 1979; Rodriguez and Scheithauer, 1994); (2) apparently chronically demyelinated axons are commonly observed in lesions, suggesting that some axons may remain viable even without remyelination (Craner et al., 2003); and (3) acute axonal damage, including transection, is common in MS lesions (Kornek et al., 2000; Trapp et al., 1998) and quantitative histopathology reveals that 30% (Schmierer et al., 2004, 2007) to 60% (Mews et al., 1998) of axons may be lost in remyelinated lesions. MTR imaging is limited in that it cannot differentiate between these processes. While remyelination-promoting therapies in development are generally aimed at stimulating remyelination of axons that would otherwise remain bare, the results of Schmierer et al. (2004, 2007) and Mews et al. (1998) suggest that axonal loss is a major mechanism of incomplete lesion recovery. However, as remyelination protects axons against delayed axonal degeneration (Kornek et al., 2000), improved remyelination will also help preserve axons.
Ideally, repeated episodes of demyelination and remyelination would be studied by direct observation of these events in the same lesions. However, if remyelinated tissue is not much more likely to experience subsequent demyelination, as has been observed by our group and others, a second demyelinating episode in a given lesion may not occur for years. Therefore, direct observation of a statistically meaningful sample of repeated episodes of demyelination may require a longitudinal imaging study spanning many years. Our own data was limited to less than 2 years of scanning in both groups, requiring the assumption that a T2 lesion indicated a previous demyelinating episode.
Our results support the hypothesis that focal white matter lesions may undergo multiple demyelination and remyelination episodes. We observed MTR to recover to stable values, consistent with the findings of others (Brown et al., 2012; Chen et al., 2008; Richert et al., 2001), suggesting that remyelination is not a transient phenomenon. This suggests a model in which demyelination in lesions occurs mostly during acute inflammatory episodes, and is routinely followed by partial remyelination; the severe lesions containing little or no myelin seen at autopsy would be the end result of a series of inflammatory episodes with incremental net myelin loss resulting from each. This model of lesion development may have implications for treatment: with the availability of drugs that effectively control inflammation and reduce the formation of new lesions, there is growing interest in neuroprotective and remyelination promoting agents. Imaging of not only the first cycle of demyelination and remyelination but also subsequent episodes may help determine the mechanisms behind incomplete remyelination and identify possible treatment targets. Additionally, the relative abundance of repeat lesions in SPMS may mean that focal inflammatory activity in this phase of the disease has been underappreciated. In our SPMS group more than half of the ∆MTR lesions were repeat lesions, which would not be captured by measurements of new T2 lesions or T2 lesion volume.
We used a new technique involving analysis of MTR timecourses in ∆MTR lesions to examine demyelination and remyelination in MS. Standard T2 lesions have low specificity and, since T2 hyperintensity often persists, cannot reliably identify repeated episodes of demyelination in the same tissue. ∆MTR lesions are segmented from semi-quantitative MTR images so they are more specific to changes in myelin and can identify repeated demyelination. This allowed us to test the longstanding hypothesis that the completely demyelinated MS lesions seen at autopsy are not the result of a complete failure of remyelination, but rather are the end product of a series of demyelination events followed by robust, but incomplete, remyelination. Our results support this hypothesis and demonstrate that repeat demyelination is a common, and likely important, process in MS.
Dr. Arnold has an ownership interest and receives income from NeuroRx Research Inc., and has received, through McGill University, research funding from Bayer Healthcare. Drs. Narayanan and Brown have received financial compensation from NeuroRx Research for consulting services.
Acknowledgments
This work was supported by grants from the Multiple Sclerosis Society of Canada (MSSC) and the Canadian Institutes of Health Research (CIHR). R.A.B. has received personal support from the MSSC and the CIHR Neuroinflammation Training Program.
Contributor Information
Robert A. Brown, Email: robert.brown@mcgill.ca.
Sridar Narayanan, Email: sridar.narayanan@mcgill.ca.
Douglas L. Arnold, Email: douglas.arnold@mcgill.ca.
References
- Barkhof F. Remyelinated lesions in multiple sclerosis: magnetic resonance image appearance. Archives of Neurology. 2003;60:1073. doi: 10.1001/archneur.60.8.1073. 12925362 [DOI] [PubMed] [Google Scholar]
- Bates D., Maechler M., Bolker B. lme4: Linear Mixed-Effects Models Using S4 Classes. 2011. [Google Scholar]
- Brown R.A., Narayanan S., Arnold D.L. Normalization of MTR imaging for multi-centre clinical trials. International Society /or Magnetic Resonance in Medicine White Matter Study Group Meeting. 2011 [Google Scholar]
- Brown R.A., Narayanan S., Arnold D.L. Segmentation of magnetization transfer ratio lesions for longitudinal analysis of demyelination and remyelination in multiple sclerosis. Neuroimage. 2012;66:103–109. doi: 10.1016/j.neuroimage.2012.10.059. 23110887 [DOI] [PubMed] [Google Scholar]
- Brown R.A., Narayanan S., Freedman M., Atkins H.L., Arnold D.L. International Society for Magnetic Resonance in Medicine Annual Conference and Exhibition. International Society for Magnetic Resonance in Medicine; 2011. Normalization of magnetization transfer ratio MRI for multicentre clinical trials; p. 4082. [Google Scholar]
- Brück W., Kuhlmann T., Stadelmann C. Remyelination in multiple sclerosis. Journal of the Neurological Sciences. 2003;206:181–185. doi: 10.1016/s0022-510x(02)00191-0. 12559508 [DOI] [PubMed] [Google Scholar]
- Chen J.T., Collins D.L., Atkins H.L., Freedman M.S., Arnold D.L. Magnetization transfer ratio evolution with demyelination and remyelination in multiple sclerosis lesions. Annals of Neurology. 2008;63:254–262. doi: 10.1002/ana.21302. 18257039 [DOI] [PubMed] [Google Scholar]
- Chen J.T. Voxel-based analysis of the evolution of magnetization transfer ratio to quantify remyelination and demyelination with histopathological validation in a multiple sclerosis lesion. Neuroimage. 2007;36:1152–1158. doi: 10.1016/j.neuroimage.2007.03.073. 17543541 [DOI] [PubMed] [Google Scholar]
- Collins D.L., Peters T.M., Evans A.C. Automated 3D nonlinear deformation procedure for determination of gross morphometric variability in human brain. Proceedings of SPIE. 1994;2359:180. [Google Scholar]
- Craner M.J., Lo A.C., Black J.A., Waxman S.G. Abnormal sodium channel distribution in optic nerve axons in a model of inflammatory demyelination. Brain. 2003;126:1552–1561. doi: 10.1093/brain/awg153. 12805113 [DOI] [PubMed] [Google Scholar]
- De Stefano N. Diffuse axonal and tissue injury in patients with multiple sclerosis with low cerebral lesion load and no disability. Archives of Neurology. 2002;59:1565. doi: 10.1001/archneur.59.10.1565. 12374493 [DOI] [PubMed] [Google Scholar]
- Deloire-Grassin M.S.A. In vivo evaluation of remyelination in rat brain by magnetization transfer imaging. Journal of the Neurological Sciences. 2000;178:10–16. doi: 10.1016/s0022-510x(00)00331-2. 11018243 [DOI] [PubMed] [Google Scholar]
- Dousset V. Experimental allergic encephalomyelitis and multiple sclerosis: lesion characterization with magnetization transfer imaging. Radiology. 1992;182:483–491. doi: 10.1148/radiology.182.2.1732968. 1732968 [DOI] [PubMed] [Google Scholar]
- Fancy S.P.J. Overcoming remyelination failure in multiple sclerosis and other myelin disorders. Experimental Neurology. 2010;225:18–23. doi: 10.1016/j.expneurol.2009.12.020. 20044992 [DOI] [PubMed] [Google Scholar]
- Filippi M. Magnetization transfer imaging to monitor the evolution of MS: a 1-year follow-up study. Neurology. 2000;55:940–946. doi: 10.1212/wnl.55.7.940. 11061248 [DOI] [PubMed] [Google Scholar]
- Filippi M., Rocca M.A., Martino G., Horsfield M.A., Comi G. Magnetization transfer changes in the normal appearing white matter precede the appearance of enhancing lesions in patients with multiple sclerosis. Annals of Neurology. 1998;43:809–814. doi: 10.1002/ana.410430616. 9629851 [DOI] [PubMed] [Google Scholar]
- Franklin R.J.M., Zhao C., Sim F.J. Ageing and CNS remyelination. Neuroreport. 2002;13:923–928. doi: 10.1097/00001756-200205240-00001. 12004191 [DOI] [PubMed] [Google Scholar]
- Freedman M.S. A phase III study evaluating the efficacy and safety of MBP8298 in secondary progressive MS. Neurology. 2011;77:1551–1560. doi: 10.1212/WNL.0b013e318233b240. 21975206 [DOI] [PubMed] [Google Scholar]
- Frohman E.M., Racke M.K., Raine C.S. Multiple sclerosis — the plaque and its pathogenesis. New England Journal of Medicine. 2006;354:942–955. doi: 10.1056/NEJMra052130. 16510748 [DOI] [PubMed] [Google Scholar]
- Goldschmidt T., Antel J., König F.B., Brück W., Kuhlmann T. Remyelination capacity of the MS brain decreases with disease chronicity. Neurology. 2009;72:1914–1921. doi: 10.1212/WNL.0b013e3181a8260a. 19487649 [DOI] [PubMed] [Google Scholar]
- Goodkin D.E. A serial study of new MS lesions and the white matter from which they arise. Neurology. 1998;51:1689–1697. doi: 10.1212/wnl.51.6.1689. 9855524 [DOI] [PubMed] [Google Scholar]
- Johnson E.S., Ludwin S.K. The demonstration of recurrent demyelination and remyelination of axons in the central nervous system. Acta Neuropathologica. 1981;53:93–98. doi: 10.1007/BF00689988. 7211208 [DOI] [PubMed] [Google Scholar]
- Kornek B. Multiple sclerosis and chronic autoimmune encephalomyelitis: a comparative quantitative study of axonal injury in active, inactive, and remyelinated lesions. American Journal of Pathology. 2000;157:267–276. doi: 10.1016/S0002-9440(10)64537-3. 10880396 [DOI] [PMC free article] [PubMed] [Google Scholar]
- Kuznetsova A., Brockhoff P.B. MixMod: Analysis of Mixed Models. R Package Version 1. 2012. [Google Scholar]
- Lasiene J., Shupe L., Perlmutter S., Horner P. No evidence for chronic demyelination in spared axons after spinal cord injury in a mouse. The Journal of Neuroscience. 2008;28:3887–3896. doi: 10.1523/JNEUROSCI.4756-07.2008. 18400887 [DOI] [PMC free article] [PubMed] [Google Scholar]
- Levesque I.R. Quantitative magnetization transfer and myelin water imaging of the evolution of acute multiple sclerosis lesions. Magnetic Resonance in Medicine: Official Journal of the Society of Magnetic Resonance in Medicine / Society of Magnetic Resonance in Medicine. 2010;63:633–640. doi: 10.1002/mrm.22244. 20146232 [DOI] [PubMed] [Google Scholar]
- Ludwin S.K. Chronic demyelination inhibits remyelination in the central nervous system. An analysis of contributing factors. Laboratory Investigation; a Journal of Technical Methods and Pathology. 1980;43:382–387. 7442125 [PubMed] [Google Scholar]
- Mackay A. In vivo visualization of myelin water in brain by magnetic resonance. Magnetic Resonance in Medicine: Official Journal of the Society of Magnetic Resonance in Medicine / Society of Magnetic Resonance in Medicine. 1994;31:673–677. doi: 10.1002/mrm.1910310614. 8057820 [DOI] [PubMed] [Google Scholar]
- Mason J.L., Langaman C., Morell P., Suzuki K., Matsushima G.K. Episodic demyelination and subsequent remyelination within the murine central nervous system: changes in axonal calibre. Neuropathology and Applied Neurobiology. 2001;27:50–58. doi: 10.1046/j.0305-1846.2001.00301.x. 11299002 [DOI] [PubMed] [Google Scholar]
- Mews I., Bergmann M., Bunkowski S., Gullotta F., Brück W. Oligodendrocyte and axon pathology in clinically silent multiple sclerosis lesions. Multiple Sclerosis (Houndmills, Basingstoke, England) 1998;62:55–62. doi: 10.1177/135245859800400203. 9599334 [DOI] [PubMed] [Google Scholar]
- Miller D.J., Asakura K., Rodriguez M. Central nervous system remyelination clinical application of basic neuroscience principles. Brain Pathology (Zurich, Switzerland) 1996;6:331–344. doi: 10.1111/j.1750-3639.1996.tb00859.x. 8864288 [DOI] [PubMed] [Google Scholar]
- Nakagawa S., Schielzeth H. A general and simple method for obtaining R2 from generalized linear mixed-effects models. Methods in Ecology and Evolution. 2013;4:133–142. [Google Scholar]
- Patrikios P. Remyelination is extensive in a subset of multiple sclerosis patients. Brain: A Journal of Neurology. 2006;129:3165–3172. doi: 10.1093/brain/awl217. 16921173 [DOI] [PubMed] [Google Scholar]
- Penderis J., Shields S.A., Franklin R.J.M. Impaired remyelination and depletion of oligodendrocyte progenitors does not occur following repeated episodes of focal demyelination in the rat central nervous system. Brain. 2003;126:1382. doi: 10.1093/brain/awg126. 12764059 [DOI] [PubMed] [Google Scholar]
- Périer O., Grégoire A. Electron microscopic features of multiple sclerosis lesions. Brain: A Journal of Neurology. 1965;88:937–952. doi: 10.1093/brain/88.5.937. 5864468 [DOI] [PubMed] [Google Scholar]
- Pike G.B. Multiple sclerosis: magnetization transfer MR imaging of white matter before lesion appearance on T2-weighted images. Radiology. 2000;215:824–830. doi: 10.1148/radiology.215.3.r00jn02824. 10831705 [DOI] [PubMed] [Google Scholar]
- Prineas J.W. Multiple sclerosis. Pathology of recurrent lesions. Brain: A Journal of Neurology. 1993;116:681–693. doi: 10.1093/brain/116.3.681. 8513397 [DOI] [PubMed] [Google Scholar]
- Prineas J.W., Connell F. Remyelination in multiple sclerosis. Annals of Neurology. 1979;5:22–31. doi: 10.1002/ana.410050105. 426466 [DOI] [PubMed] [Google Scholar]
- R Team . R: A Language and Environment for Statistical Computing. R Foundation/Or Statistical Computing Vienna; Austria: 2010. [Google Scholar]
- Richert N.D. Interferon beta-1b and intravenous methylprednisolone promote lesion recovery in multiple sclerosis. Multiple Sclerosis (Houndmills, Basingstoke, England) 2001;7:49–58. doi: 10.1177/135245850100700109. 11321194 [DOI] [PubMed] [Google Scholar]
- Rocca M.A., Mastronardo G., Rodegher M., Comi G., Filippi M. Long-term changes of magnetization transfer-derived measures from patients with relapsing–remitting and secondary progressive multiple sclerosis. AJNR. American Journal of Neuroradiology. 1999;20:821–827. 10369352 [PMC free article] [PubMed] [Google Scholar]
- Rodriguez M., Scheithauer B. Ultrastructure of multiple sclerosis. Ultrastructural Pathology. 1994;18:3–13. doi: 10.3109/01913129409016267. 8191643 [DOI] [PubMed] [Google Scholar]
- Salgado-Ceballos H. Spontaneous long-term remyelination after traumatic spinal cord injury in rats. Brain Research. 1998;782:126–135. doi: 10.1016/s0006-8993(97)01252-3. 9519256 [DOI] [PubMed] [Google Scholar]
- Schmierer K., Scaravilli F., Altmann D.R., Barker G.J., Miller D.H. Magnetization transfer ratio and myelin in postmortem multiple sclerosis brain. Annals of Neurology. 2004;56:407–415. doi: 10.1002/ana.20202. 15349868 [DOI] [PubMed] [Google Scholar]
- Schmierer K. Quantitative magnetization transfer imaging in postmortem multiple sclerosis brain. Journal of Magnetic Resonance Imaging: JMRI. 2007;26:41–51. doi: 10.1002/jmri.20984. 17659567 [DOI] [PMC free article] [PubMed] [Google Scholar]
- Sled J.G., Pike G.B. Quantitative imaging of magnetization transfer exchange and relaxation properties in vivo using MRI. Magnetic Resonance in Medicine. 2001;46:923–931. doi: 10.1002/mrm.1278. 11675644 [DOI] [PubMed] [Google Scholar]
- Trapp B.D. Axonal transection in the lesions of multiple sclerosis. New England Journal of Medicine. 1998;338:278–285. doi: 10.1056/NEJM199801293380502. 9445407 [DOI] [PubMed] [Google Scholar]
- van Buchem M.A., McGowan J.C., Grossman R.I. Magnetization transfer histogram methodology: its clinical and neuropsychological correlates. Neurology. 1999;53:S23–S28. 10496207 [PubMed] [Google Scholar]
- Wolff S.D., Balaban R.S. Magnetization transfer contrast (MTC) and tissue water proton relaxation in vivo. Magnetic Resonance in Medicine: Official Journal of the Society of Magnetic Resonance in Medicine / Society of Magnetic Resonance in Medicine. 1989;10:135–144. doi: 10.1002/mrm.1910100113. 2547135 [DOI] [PubMed] [Google Scholar]