

Abstract
Amyloid imaging is a valuable tool for research and diagnosis in dementing disorders. As positron emission tomography (PET) scanners have limited spatial resolution, measured signals are distorted by partial volume effects. Various techniques have been proposed for correcting partial volume effects, but there is no consensus as to whether these techniques are necessary in amyloid imaging, and, if so, how they should be implemented. We evaluated a two-component partial volume correction technique and a regional spread function technique using both simulated and human Pittsburgh compound B (PiB) PET imaging data. Both correction techniques compensated for partial volume effects and yielded improved detection of subtle changes in PiB retention. However, the regional spread function technique was more accurate in application to simulated data. Because PiB retention estimates depend on the correction technique, standardization is necessary to compare results across groups. Partial volume correction has sometimes been avoided because it increases the sensitivity to inaccuracy in image registration and segmentation. However, our results indicate that appropriate PVC may enhance our ability to detect changes in amyloid deposition.
Keywords: PET, partial volume correction, PiB, amyloid imaging
1. Introduction
Alzheimer’s disease (AD) is the most common form of dementia (Holtzman et al., 2011). The prevalence of AD is expected to increase dramatically worldwide over the next 50 years (Brookmeyer et al., 2007). It is well established that the pathological hallmarks of AD are amyloid plaques and neurofibrillary tangles (Holtzman et al., 2011). However, the underlying disease mechanisms remain under study. There currently are no proven disease-modifying treatments (Aisen, 2009; Aisen et al., 2011; Doody et al., 2013; Huang and Mucke, 2012). Evidence suggests that pathological changes begin 10 to 20 years before the onset of clinical symptoms (Bateman et al., 2012; Morris and Price, 2001), which implies that successful treatment of AD may require early intervention. Hence, validated surrogate biomarkers for AD are needed for the design of therapeutic trials in asymptomatic individuals (Aisen, 2009; Aisen et al., 2011).
Positron emission tomography (PET) imaging of beta-amyloid (Aβ) plaques with tracers such as [11C]PiB (N-methyl-[11C]2-(4-methylaminophenyl)-6-hydroxybenzothiazole) (Klunk et al., 2004), [18F]florbetapir (Wong et al., 2010), [18F]florbetaben (Rowe et al., 2008) and [18F]flutemetamol (Vandenberghe et al., 2010), enables in vivo measurement of fibrillar Aβ deposition, which provides an early indicator of AD pathology. Accurate quantification of Aβ burden is essential to better understand disease mechanisms, to develop early diagnostic techniques, and to identify suitable surrogate indicators for treatment monitoring.
Partial volume effect (PVE) in positron emission tomography (PET) is a consequence of the poor spatial resolution of PET scanners, which typically is 5 to 6 mm full-width-half-max (FWHM). Because of PVE, the intensity of a particular voxel reflects the tracer concentration not only of the tissue within that voxel but also the surrounding area. In addition, PVE depends on the physical size and the shape of a region-of-interest (ROI) and its relative contrast with surrounding regions (Soret et al., 2007). When PET is used to measure amyloid burden, the impact of PVE becomes more complicated. Previous studies indicate that amyloid plaques primarily develop in the cortical and subcortical gray matter while the signal observed in white matter mainly comes from non-specific binding (Klunk et al., 2004). Non-specific PiB binding in white matter would not be a problem if the spatial resolution of PET permitted imaging gray matter without partial volume contributions from white matter. However, the resolution of PET is only ~5–6 mm. Hence, partial volume effect cannot be avoided. Without appropriate partial volume correction (PVC), quantification based on the raw PET images yields only a qualitative representation of the amyloid burden, not a quantitative one. Only when we apply appropriate PVC can we obtain quantitative measurement of amyloid burden. For a simple demonstration please refer to the supplementary material.
Currently, the approach to addressing PVE differs from one group to another and there is no consensus regarding whether correction for PVE is necessary and, if so, what type of correction should be used. We believe that this uncertainty is attributable to the limited understanding of the impact of PVE on quantitative amyloid imaging. In a recent longitudinal study (Villemagne et al., 2011), PVC increased the estimated regional standard uptake value ratios (SUVRs), but similar trends were obtained with and without PVC. The authors elected to not report PVC results to avoid potential inaccuracies resulting from segmentation errors (Villemagne et al., 2011). Other groups (Aizenstein et al., 2008; Lopresti et al., 2005; Lowe et al., 2009) use two-component PVC (Meltzer et al., 1996), which defines two types of tissue, i.e., brain and non-brain, and corrects for the underestimation of signal due to PVE caused by non-brain tissue. In a comparative study of two- vs. three-component (gray matter, white matter, and non-brain) PVC, it was concluded that the two-component method is better because it is less sensitive to registration and segmentation errors, although the three-component method is capable of more accurate absolute quantification (Meltzer et al., 1999). In contrast, a more recent paper (Thomas et al., 2011) advocates a region-based voxel-wise correction method to improve quantitative accuracy.
The goal of this study is to evaluate the impact of PVE on quantitative amyloid imaging in both cross sectional and longitudinal studies using simulated and human research data. In addition, we specifically examine the impact of individual variability in cortical thickness and brain atrophy upon quantification. We also investigate the test-retest reliability of PVC attributable to variability in registration and segmentation.
2. Methods
2.1. Participants
Three cohorts were involved in this study (Table I). The first cohort included 16 participants recruited from the Knight Alzheimer Disease Research Center (ADRC). One of the 16 participants had a CDR score of 0.5 (very mild dementia) while the CDR ratings for the rest were 0 (cognitively normal). This cohort was studied using a MRI test-retest (MRTRT) design to examine the sensitivity of PVC to uncertainty related to MRI images used as anatomical reference. Each participant in the MRTRT cohort underwent two separate MR scans on different days, using different MR sequences, and on different MR scanners, as described below in the imaging protocol. Another MRTRT experiment with anatomical MR acquired twice during the same imaging session was described in supplementary 2. The second cohort comprised 74 participants recruited at multiple sites as part of the international Dominantly Inherited Alzheimer Network (DIAN) initiative (Morris et al., 2012). The DIAN cohort included only individuals known to carry an autosomal dominant mutation leading to early onset AD. The DIAN cohort was analyzed to investigate the impact of PVC on cross sectional studies. The estimated year-to-onset (EYO) was calculated for each individual in this cohort as the difference of the age of mutation carrier at the time of study and the parental age at onset (Bateman et al., 2012). EYO was used as the reference indicator of disease stage. The third cohort (LONG) included 42 participants from Knight ADRC, studied to investigate the impact of PVC on longitudinal studies. Six participants had a baseline CDR score of 0.5 while the rest had a CDR score of 0. Each LONG participant had a baseline visit and a follow-up visit at a mean interval of 2.2 years. The LONG cohort included only individuals with a baseline mean cortical binding potential (MCBP) greater than 0.06, as measured by PiB PET imaging (Mintun et al., 2006), to enhance the probability of observing an increase in amyloid deposition at the second visit (Sojkova et al., 2011). All three cohorts were independent and there was no overlap among the cohorts.
Table I.
Demographics for this study
| Cohort | MRTRT | DIAN | LONG |
|---|---|---|---|
| N | 16 | 74 | 42 |
| Age (SD) years | 63.0(9.0) | 39.1(11.3) | 70.7(5.5) |
| EYO (SD) years | - | −8.1(11.1) | - |
| Education (SD) years | 15.5(2.4) | 14.4(2.5) | 15.6(2.3) |
| Male (%) | 8(50.0) | 36(48.6) | 16(38.1) |
| CDR>0 (%) | 1(6.3) | 21(28.4) | 6(14.3) |
| APOE4+ (%) | 3(19.7) | 30(40.5) | 22(52.4) |
| PET interval (SD) years | - | - | 2.2(0.85) |
MRTRT (MR test-retest); DIAN (Dominantly Inherited Alzheimer’s Network); LONG (longitudinal cohort from Knight ADRC); CDR: Clinical Demential Rating; APOE4+: carrier of at least one copy of E4 version of apolipoprotein gene; EYO; estimaged year to onset.
2.1.1 Ethics Statement
All assessment and imaging procedures were approved by Washington University’s (WashU) Human Research Protection Office. Written informed consent was obtained from all individuals or their care givers. Local institutional review boards also approved the collection of scans for archiving and future study at each non-WashU study site.
2.2. Imaging
In all cohorts, PET imaging for quantitative estimation of amyloid deposition was performed using [11C]PiB, prepared according to the published protocol (Mathis et al., 2003). In the MRTRT cohort, dynamic PET imaging was conducted for one hour with a Biograph 40 PET/CT scanner (Siemens Medical Solutions, Erlangen, Germany) in three-dimensional mode after intravenous administration of approximately 12mCi of PiB. The images were reconstructed on a 128 × 128 × 109 matrix (2.32 × 2.32 × 2.03 mm voxels) using filtered back-projection. Typical dynamic scans had 12 × 10-second frames, 3 × 60-second frames, and 11 × 5-minute frames. Anatomic MRI were acquired with an unaccelerated T1-weighted magnetization-prepared rapid gradient echo (MPRAGE) sequence (1 mm isotropic voxels) using a Siemens Trio 3T scanner (Siemens Medical Solutions, Erlangen, Germany). In order to assess the sensitivity of PET quantification to variability in MRI acquisition, MRI processing (i.e. segmentation), and PET to MRI registration, a separate sagittal MPRAGE scan within 2 weeks from the PET/CT session was obtained on a Siemens Biograph mMR scanner (Siemens Medical Solutions, Erlangen, Germany) using an accelerated 3D Generalized Autocalibrating Partially Parallel Acquisition (GRAPPA) sequence with 1.1 × 1.1 × 1.2 mm voxels.
In the DIAN cohort, structural MRI was performed using the Alzheimer’s Disease Neuroimaging Initiative (ADNI) protocol (Jack et al., 2010; Jack et al., 2008). A 3T scanner (Philips 3.0 T Achieva scanner (Philip Healthcare, Best, Netherlands) and a Siemens Trio 3T scanner was used at all participating sites; the scanners were required to pass initial and regular follow-up quality control assessments to insure acquisition uniformity. The MRI protocol included an accelerated 3D GRAPPA sequence for MPRAGE acquisition same as the sequence used in the MRTRT study on the Biograph mMR. These images were screened for artifacts and protocol compliance by the ADNI MR Imaging Core before further analysis. For PET imaging, each site underwent an initial evaluation to insure compliance with the common PiB PET ADNI protocol. The PET scanners included in this study were EXACT 962 HR+ scanner (Siemens Medical Solutions, Erlangen, Germany) or a Biograph 40 PET/CT scanner. Dynamic PiB PET acquisition consisted of either a 70-minute scan starting at injection or a 30-minute scan beginning 40 minutes post-injection. Only full dynamic scans (70-minute) were included in this study. Reconstruction was performed using filtered back-projection (128 × 128 × 63 matrix, 2.12 × 2.12 × 2.43 mm voxels on the HR+ scanner; 128 × 128 × 109 matrix, 2.32 × 2.32 × 2.03 mm voxels on the Biograph 40 scanner).
The LONG cohort imaging protocol was similar to that of the MRTRT cohort. MPRAGE scans were acquired with a Siemens Trio 3T scanner. PiB PET was acquired on an EXACT 962 HR+ scanner or a Biograph 40 PET/CT scanner. Each LONG participant contributed MRI and PET data acquired during initial and follow-up visits.
2.3. Image Analysis
FreeSurfer v5.1 (Martinos Center for Biomedical Imaging, Charlestown, Massachusetts, USA) (https://surfer.nmr.mgh.harvard.edu/fswiki) was used to automatically segment the brain into various regions (as defined in the wmparc.mgz file, please refer to FreeSurfer wiki for the output files from FreeSurfer analysis of the brain). Visual inspection of the automated segmentation results was performed for quality assurance purposes in all datasets. Corrections were made when necessary according to the FreeSurfer manual. Reconstructed PET images were smoothed to achieve a common spatial resolution of 8mm to minimize scanner differences (Joshi et al., 2009). Inter-frame motion correction for the dynamic PET images was performed using standard image registration techniques (Hajnal et al., 1995) implemented with in-house software (Eisenstein et al., 2012). PET-MR registration was performed using a vector-gradient algorithm (VGM) (Rowland et al., 2005) in a symmetric fashion (i.e. average transformation for PET->MR and inverse of MR->PET was used as the final transformation matrix). Regional time-activity curves for each ROI were extracted by resampling the PET data to patient MR space. Regional binding potentials (BPND) were estimated using Logan graphical analysis (Logan et al., 1990) with the cerebellar cortex serving as the reference (Logan et al., 1996). BPND calculation was based on the first 60 minutes of data. Although the brainstem has been used as the reference region in prior analyses of the DIAN cohort (Bateman et al., 2012), the cerebellar cortex was used here to obtain consistency across all three cohorts. Mean cortical binding potentials (MCBP) (Mintun et al., 2006) were calculated based on a selected set of cortical regions (Su et al., 2013). The washout rate constant (k2) of the reference region (cerebellum) was set to 0.16/minute (Mintun et al., 2006). The impact of PVC technique was assessed using BPND measures evaluated in three regions of interest. To assess the impact of different PVC techniques, (i) MCBP (Mintun et al., 2006) was examined to assess global effects; (ii) precuneus was chosen as representative cortical region with known high predisposition to amyloid deposition (Mintun et al., 2006); and (iii) putamen was chosen as an example of a subcortical region that can have elevated PiB uptake in AD (Su et al., 2013).
2.4. Partial Volume Correction
Two PVC methods were compared in this study. The first method is the two-component (PVC2C) approach (Meltzer et al., 1996), which is most widely represented in amyloid imaging literature (Aizenstein et al., 2008; Lopresti et al., 2005; Lowe et al., 2009; Rosario et al., 2011). In our implementation, a brain tissue mask is generated based on FreeSurfer segmentation, a CSF dilution factor is calculated for each region, and the raw time activity curve for each region is corrected by this dilution factor before BPND is calculated. The second method is based on computation of the regional spread function (RSF) (Rousset et al., 2008; Rousset et al., 1998), which has also been extensively applied in PET imaging analysis (Kim et al., 2013; Kuhn et al., 2014; Le Pogam et al., 2011). Our implementation of RSF PVC also included additional ROIs outside the brain (hence, not defined by FreeSurfer) to account for tracer uptake in non-brain tissue. The combined ROI set was used as the basis for RSF PVC, in which a matrix of regional transfer coefficients (Rousset et al., 1998) was calculated using the ROI map and an 8-mm FWHM Gaussian smoothing kernel. Corrected ROI values were calculated by solving a linear system relating regional transfer coefficients to observed regional values (Eq. 1):
| (1) |
where, O is a column vector corresponds to the observed regional mean intensity for n ROIs, and T is a column vector representing the true intensity values in regions 1 to n. Each element (wij) in the matrix W on the right hand side of Eq. 1 is a regional transfer coefficient that determines the signal spillover from region i to region j. In other words, PVC2C performs the correction by scaling the regional measurement by a pre-computed correction factor which only depends on the scanner point spread function and relative location of the voxel/ROI to the boundary. These correction factors ignore gray-white contrast and therefore remain constant throughout a dynamic scan. On the other hand, after RSF PVC correction, the corrected/uncorrected ratio takes into account the local contrast which changes over time. Because of this difference the PVC2C only changes the magnitude of a TAC while the RSF-based PVC restore both the shape and magnitude of a TAC, two attributes that ultimately determine the estimated binding parameters at each voxel or region.
2.5. Simulation study
Simulation was conducted to evaluate the impact of brain atrophy and partial volume effects on amyloid imaging quantification. The procedure for generating simulated PiB PET imaging data was similar to that previously described (Su and Shoghi, 2008) and is summarized in Figure 1. MR images of six participants with different cortical thicknesses (2.3–2.8mm), as measured using FreeSurfer, were chosen from our Knight ADRC cohort (see Fig 2A and 2B as an example). To generate simulated dynamic PET data, each region was assigned a time-activity curve (TAC) similar to Fig 2C. These TACs were obtained from actual patient data with 5 different level of amyloid load as measured by PiB PET imaging. After assignment of regional TACs, an example frame was shown in Fig. 2D. An 8mm FWHM Gaussian kernel was used to smooth the simulated data (Fig. 2E). Noise was added to the PET data in sinogram space (Su and Shoghi, 2008). Poisson distributed noise was added and the magnitude of the noise is controlled by the counts, which was calibrated to the typical counting statistics of our patient imaging data. The sinogram were then reconstructed using filtered back-projection (FBP) technique. FBP based reconstruction was also performed on the noiseless version of the sinogram data and the difference between the reconstructed images created with and without sinogram noise was calculated as the noise image. The noise image is added back to the original simulated noiseless imaging data (Fig. 2E) to generate the final simulated PiB PET data (Fig. 2F). This procedure is to ensure the simulated PET image indeed has 8mm resolution while also has realistic imaging noise. A total of 30 simulated dynamic PET datasets were created for different combinations of MR and PET. To simulate longitudinal studies, a follow up MRI scan more than a year apart of the same participant from three of the six subjects was also used to create additional simulations to evaluate the impact of atrophy.
Figure 1.

Demonstration of the simulation procedure. A) Example MR data. B) FreeSurfer segmentation of the MR data. A time-activity curve (TAC) was assigned to each ROI. C) Example regional TAC D) Example frame of simulated data after assigning a TAC to each region. E) PET frame smoothed to PET resolution. F) Final simulated dynamic PET frame including noise.
Figure 2.

Estimated binding potentials with and without partial volume correction for simulations created with different cortical thickness and amyloid load.
2.6. MR Test-Retest Variability
One concern in applying MRI-based PVC techniques in quantitative PET is that variability related to MRI acquisition and processing may propagate to the final correction and increase noise (Frouin et al., 2002; Zaidi et al., 2006). To examine this issue, a MR test-retest study was performed in the MRTRT cohort, in which each participant underwent two separate MPRAGE scanning using different scanners, MR sequences, and on different days. Quantification with and without PVC was performed using these two MPRAGE images with the same PET scan. Each image was independently segmented by FreeSurfer and co-registered with the PiB PET. A mean test-retest variability measurement was calculated for each region with and without PVC according to Eq. 2:
| (2) |
where N is the total number of participants (16); i indexes participant; BPNDi1 was calculated based on MPRAGE acquired on the Trio scanner; and BPNDi2 was calculated based on MPRAGE acquired on the mMR scanner. In addition, a volumetric variability measurement was also calculated for each region based on the repeated MPRAGE and FreeSurfer outputs following Eq. 3:
| (3) |
where VOLi1 and VOLi2 are the volumes in each FreeSurfer region obtained from Trio and mMR scans respectively, indexed by participant (i).
3. Results
3.1. Simulation Study
The simulation study demonstrated that, without PVC, lower cortical thicknesses led to a greater underestimation of the binding potential for both global (MCBP) and local measurements (Fig. 2). This outcome is expected on the basis of PVE principles. The estimated binding potential without PVC positively correlated with cortical thickness. The slope of the linear relationship, as calculated by linear regression of BPND vs. thickness, increased with increasing amyloid load. For each millimeter loss in cortical thickness, the estimated MCBP was reduced by 0.11 to 0.24, depending on the underlying amyloid load. The estimated precuneus binding potential was reduced by 0.21 to 0.43 for each mm loss in precuneus thickness. Both PVC techniques corrected the estimated binding potentials so that BPND remained constant across different cortical thicknesses. However, the PVC2C method differentially underestimated the “true” binding potential depending on amyloid burden. This underestimation was minimal at low amyloid load and large at high amyloid load. The impact of PVE was greater in high Aβ regions such as the precuneus as compared to global measures.
Similar partial volume effect was observed in the simulated longitudinal data (Fig. 3). PiB binding was modeled as constant over both time points. In general, without PVC, the estimated binding potentials decreased with decreasing cortical thickness and this effect was more pronounced at higher amyloid loads. Underestimation of MCBP ranged from 0.14 per millimeter decrease in cortical thickness at low amyloid load to 0.36 per millimeter decrease in cortical thickness at high amyloid load. The slope of decrease for the precuneus BPND ranged from 0.27 per millimeter decrease in cortical thickness to 0.61 per millimeter decrease in cortical thickness. Therefore, it is possible to observe false decreases in BPND if PVC is not performed when atrophy occurs during longitudinal studies. Both PVC techniques reduced the impact of PVE but the RSF technique was more stable.
Figure 3.

Impact of partial volume effects to binding potential estimation due to longitudinal changes in cortical thickness based on the simulation study.
3.2. MR Test-Retest Variability
The MRTRT dataset showed low variability in estimated BPND (Table II). For MCBP, the average RBP% was 1.57±1.01% without PVC, 1.41±2.13% using PVC2C and 2.09±1.78% using RSF PVC. In comparison, the variability for FreeSurfer ROI volumes was greater than ~2% or more for all regions.
Table II.
Reproducibility of PiB measurements using MPRAGEs acquired on different days with different scanners and sequences (mean±SD).
| ROI | Volume (cc) | RVOL% | RBP% (Raw) | RBP% (PVC2C) | RBP% (RSF) |
|---|---|---|---|---|---|
| Left Precuneus | 8.4±0.9 | 4.18±4.20 | 1.39±0.79 | 1.85±1.54 | 2.95±1.97 |
| Left Putamen | 5.3±0.6 | 4.91±3.66 | 1.28±0.71 | 1.58±1.27 | 2.26±1.31 |
| MC | 148.6±13.7 | 1.89±1.17 | 1.57±1.01 | 1.41±2.13 | 2.09±1.78 |
| CALL | 425.9±38.9 | 2.37±1.63 | 1.40±0.80 | 1.25±1.59 | 1.66±1.27 |
MC: contains regions that went into the calculation of MCBP using a FreeSurfer based approach (Su et al., 2013) including ctx-lateralorbitofrontal, ctx-medialorbitofrontal, ctx-precuneus, ctx-rostralmiddlefrontal, ctx-superiorfrontal, ctx-superiortemporal, and ctx-middletemporal; CALL: all cortical gray matter region.
3.3. Cross-sectional Patient Study
Partial volume correction generally resulted in higher estimated binding potentials in cortical regions (Fig. 4). In left precuneus, the estimated PiB binding was approximately 2.2 times higher on average using the RSF method than without PVC and ~1.2 times higher on average using PVC2C. In the putamen, PVC2C resulted in lower PiB binding estimation (0.45 times the uncorrected version for left putamen); and RSF resulted in slightly higher PiB binding estimation (1.1 times the uncorrected values for left putamen).
Figure 4.

Trajectories of PiB binding estimated with cross sectional first-degree LOESS curves with and without PVC (top row). And regional time-activity curve with and without PVC for an example subject (bottom row).
Figure 5 shows the relation between PiB binding potentials estimated with PVC (two methods) vs. without PVC. These relations are remarkably linear (r = 0.99) across participants with varying levels of Aβ accumulation. However, the slope and intercept of these linear relationships based on particular brain regions are strongly regionally specific.
Figure 5.
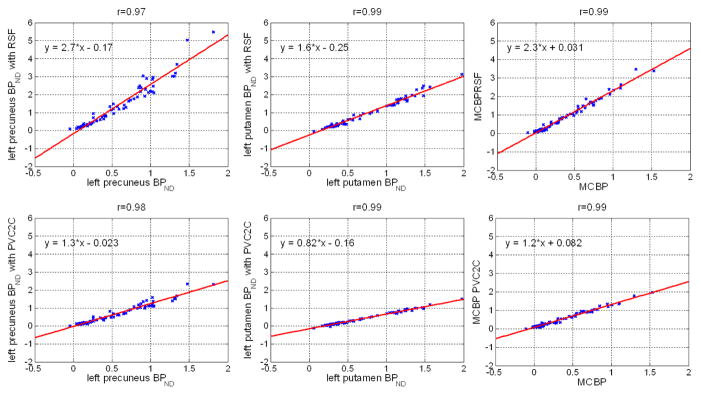
Regional binding potentials with and without PVC. Although for individual regions, the PVC corrected BPND were highly correlated with the uncorrected version, the slope of the linear relationship varies from one region to another. On average, the estimaged BPND increased 41±33%, 8±14%, and 31±22% for left precuneus, left putamen and MCBP respectively when RSF PVC is applied; the estimated BPND increased 7±8% for left precuneus, decreased 17±2% for left putamen, and increased 12±5% for MCBP when PVC2C is applied. The percent change is calculated as (BPPVC−BPraw)/(1+BPraw)×100%.
3.4. Longitudinal Study
The results of the longitudinal study are summarized in Table III. On average, the left precuneus lost volume at a rate of 0.04 cc/year (0.42%/year); and the left putamen lost volume at a rate of 0.05 cc/year (0.93%/year). Without PVC, BPND increased at a rate of 0.021/year (1.57%/year) in left precuneus and increased at 0.012/year (0.87%/year) in left putamen. With RSF PVC, BPND increased at a rate of 0.077/year (4.23%/year) in the left precuneus and increased 0.033/year (2.26%/year) in the left putamen. The PVC2C results fell in between the uncorrected and the RSF PVC measurements. The significance of longitudinal difference in BPND appears to be enhanced with RSF PVC, as manifested by more significant p-values in a two-tailed paired t-test. The p-value changed only moderately when PVC2C was applied. Without PVC, decreased MCBP was observed in 9 participants and decreased precuneus BPND was observed in 11. When RSF PVC was performed, 4 of the 9 decreases in MCBP reversed, and 7 of the 11 decreases in precuneus BPND reversed. This indicates the observed decrease in BPND without PVC maybe an artifact of brain atrophy.
Table III.
Longitudinal study results (mean±SD where applicable).
| left precuneus | left putamen | MC | CALL | |
|---|---|---|---|---|
| Baseline Vol (cc) | 8.5±1.2 | 5.0±0.7 | 143.4±15.0 | 411.8±42.5 |
| ΔVol/year (cc/year) | −0.04±0.15 | −0.05±0.15 | −0.83±1.91 | −2.08±5.35 |
| ΔVol%/year (%/year) | −0.42±1.82 | −0.93±3.17 | −0.58±1.31 | −0.49±1.30 |
| p-value | 7.9E-02 | 3.6E-02 | 6.0E-03 | 1.1E-02 |
| Baseline BPND | 0.42±0.28 | 0.46±0.20 | 0.32±0.26 | 0.26±0.21 |
| ΔBPND/year (/year) | 0.021±0.04 | 0.012±0.07 | 0.016±0.03 | 0.009±0.03 |
| ΔBP%/year (/year) | 1.57±2.29 | 0.87±3.70 | 1.28±1.88 | 0.78±1.73 |
| p-value | 6.5E-05 | 6.1E-02 | 8.0E-05 | 2.7E-03 |
| Baseline BPND (PVC2C) | 0.50±0.32 | 0.19±0.16 | 0.50±0.32 | 0.42±0.25 |
| ΔBPND/year (PVC2C) (/year) | 0.028±0.05 | 0.010±0.05 | 0.025±0.4 | 0.015±0.03 |
| ΔBP%/year (PVC2C) (/year) | 1.88±2.38 | 0.83±3.57 | 1.71±1.99 | 1.12±1.66 |
| p-value | 1.7E-05 | 9.5E-02 | 1.0E-05 | 1.4E-04 |
| Baseline BPND (RSF) | 0.85±0.66 | 0.39±0.28 | 0.64±0.55 | 0.52±0.43 |
| ΔBPND/year (RSF) (/year) | 0.077±0.08 | 0.033±0.11 | 0.054±0.06 | 0.036±0.05 |
| ΔBP%/year (RSF) (/year) | 4.23±3.75 | 2.26±6.03 | 3.41±2.90 | 2.46±2.46 |
| p-value | 1.3E-07 | 5.6E-03 | 5.9E-08 | 1.3E-06 |
MC: contains regions that went into the calculation of MCBP using a FreeSurfer based approach (Su et al., 2013) including ctx-lateralorbitofrontal, ctx-medialorbitofrontal, ctx-precuneus, ctx-rostralmiddlefrontal, ctx-superiorfrontal, ctx-superiortemporal, and ctx-middletemporal; CALL: all cortical gray matter region; p-value refers to two-tailed paired student t-test result between the follow up visit and the baseline visit; ΔBP% was calculated according to Eq. 1 and ΔVOL% was calculated according to Eq. 2.
4. Discussion
We compared two partial volume correction techniques in the context of quantitative PET amyloid imaging using both simulated and participant data. Both PVC methods reduced bias caused by partial volume effects. RSF PVC yielded more accurate binding potential estimations based on the simulation study. The simulation (forward model) accounted for time activity curves in gray matter, white matter, and non-brain regions. Thus, the forward model can be viewed as an expansion of three-component approach (Meltzer et al., 1999) except that each ROI was independently assigned its own TAC. That RSF PVC performed best with the simulations is expected because it effectively inverts the forward model except for the addition of noise. The RSF technique assumes within region homogeneity in tracer uptake, while in reality the variability may not follow anatomical driven ROI definition. Other PVC technique such as the region-based (RBV) correction (Thomas et al., 2011) or the Gaussian mixture deconvolution (GMD) (Bousse et al., 2012) are voxel-wise methods. Such methods potentially preserve greater detail at the voxel level but should give similar results at regional level. Further investigation is needed to understand the robustness and accuracy of these techniques.
It should be pointed out that while we adopted the resolution normalization technique (Joshi et al., 2009) to achieve approximately 8mm in spatial resolution across different scanners, the scanner resolution is inherently spatially varying, and our normalization filtering cannot fully account for this which may lead to subtle differences between scanners. This can potentially be improved by measuring the individual scanner point spread function using physical phantoms and performing PVC based on that. It should also be pointed out that our imaging analysis procedure assumes the different MR scanners have the same spatial resolution, while in fact there are small between scanner differences in scanner resolution, these factors may further complicate the PET quantification.
The objective of PVC is to reduce bias in point estimates of gray matter Aβ burden. The cost of PVC is that it can amplify noise in PET quantification attributable to PET to MR registration and segmentation of anatomical MR data (Meltzer et al., 1999). We examined this issue using an MPRAGE test-retest design and confirmed the general principle. The observed change in binding potential (BPND) estimates attributable to the variability in MPRAGE registration and segmentation was less than 3% with and without PVC. In comparison, full test-retest BPND variability has been reported to be approximately 5% (Lopresti et al., 2005). It has been demonstrated that differences in imaging sequence, scanner, and magnet strength can cause discrepancy in brain segmentation (Han et al., 2006; Jovicich et al., 2009). It is important to keep this in mind in study design to minimize possible complications. As demonstrated in another MR test-retest study using repeated MPRAGE scans acquired within the same imaging session using the same MR sequence the MR test-retest variability is substantially smaller at less than 1% (Supplementary 2), which gives us an idea of how much improvements we can possibly achieve by limiting the variability in MR acquisition.
The impact of PVC to the estimated BPND is highly regional specific as demonstrated by the relationship between BPND and EYO (Fig. 4) and corrected vs. uncorrected BPND (Fig. 5). This can be explained by examining the regional TACs with and without PVC, as shown in lower panel of Fig. 4. A substantially greater intensity value for the precuneus cortex and a slightly lower intensity value for the cerebellar cortex (the reference) resulted in a large increase in estimated BPND using RSF PVC. On the other hand, PVC2C resulted in higher ROI values for both precuneus and cerebellar cortex, hence, only a slightly increased BPND. For a subcortical region such as the putamen, neither PVC technique significantly changed PET image intensity values; altered BPND values were mainly attributable to differences in the reference region TAC with and without PVC. Increased cerebellar cortex intensity with PVC2C resulted in lower BPND of putamen; slightly lower cerebellar cortex intensity with RSF PVC resulted in slightly higher BPND. These regionally specific constants reflect the interaction between limited PET resolution and varying levels of non-specific vs. specific tracer binding as well as ROI shape. Thus, quantitative PiB imaging strongly depends on use of PVC and type of PVC.
The high levels of linear correlation between BPND with and without PVC in the cross sectional study (Fig. 5) may seem counter-intuitive. In theory, as the disease progresses, more severe atrophy should result in a larger impact of PVE, as demonstrated in Fig. 4, therefore a non-linear relationship would be expected. This may because our participants are either asymptomatic or early symptomatic AD patients and the amount of atrophy is relatively small. In addition, people with high BPND do not necessarily have more atrophy because of the high variability of amyloid deposition at a given cortical thickness level. PVC is expected to be more critical for measuring amyloid deposition in brain with more severe atrophy.
Based on our longitudinal study, the annual rate of amyloid accumulation (signal) was 3.4 times greater when RSF PVC is applied and 1.59 times greater with PVC2C in comparison to the values without PVC (Table III), while the standard deviation in the rate of amyloid accumulation (noise) was only 1.82 and 1.24 times greater with RSF PVC and PVC2C respectively. In addition, the observed difference in amyloid load between the baseline and follow-up study in the LONG cohort was more significant (smaller p values) when PVC was applied, especially with the RSF PVC technique. Therefore, we believe PVC will improve our ability to detect amyloid load change in longitudinal studies.
Finally, comparisons of amyloid load across different regions within the same subject would be difficult without PVC, because of the differential impact of partial volume effects on regions of different size and shape as shown by the regionally different slopes in Fig. 5. Our study demonstrates that, if the goal of amyloid imaging is to obtain a single numerical measurement of amyloid load, for example to provide diagnostic information, then PVC only provide minor additional information because of the highly linear relationship between the uncorrected and corrected binding potentials. However, if the goal of amyloid imaging is to better understand the disease mechanism, to assess the regional differences in the amyloid plaque pathology, then PVC is an important step.
5. Conclusion
The impact of partial volume correction (PVC) on quantitative amyloid imaging was investigated using both simulated and participant data. PVC compensates for partial volume effects, which, if uncorrected, lead to underestimation of amyloid load. A theoretical cost of PVC is that it increases the noise of amyloid load measurement due to uncertainties in image registration and segmentation. However, our data demonstrate that PVC improved the sensitivity of detecting subtle changes in amyloid binding, especially when using the RSF technique. We therefore recommend PVC be performed in all amyloid imaging studies, although standardization of the PVC technique is needed to compare studies across different groups.
Supplementary Material
Highlights.
Two PVC techniques were examined for quantification of PiB imaging data.
Performance was compared using simulated, MR test-retest, cross-sectional and longitudinal data.
Both PVC techniques were able to compensate for partial volume effects.
Regional Spread Function technique was able to generate more accurate results.
PVC improves the capability in detecting subtle changes in PiB retention.
Acknowledgments
This research was supported by the Knight Alzheimer’s Disease Research Center grants (P50AG005681, P01AG003991, P01AG026276, U19AG032438, and P30NS048056). Support was also provided by the Charles F. and Joanne Knight Alzheimer’s Initiative, the David and Betty Farrell Medical Research Fund, and the generous support of F Simmons and O Mohan.
We acknowledge the altruism of the DIAN participants and their families and contributions of the DIAN research. We acknowledge the DIAN genetics core for APOE genotype and mutation status; the DIAN clinical core for providing CDR status; the DIAN imaging core for image analysis; the DIAN informatics core for data archiving; and the DIAN biostatistics, neuropathology, and biomarker cores for their assistance in the DIAN project. We acknowledge each of the participating sites (list follows in alphabetical order) and their staff for their contributions to this study: Brigham and Women’s Hospital–Massachusetts General Hospital; Brown University-Butler Hospital; Columbia University; Edith Cowan University, Perth; German Center for Neurodegenerative Diseases (DZNE) Munich; German Center for Neurodegenerative Diseases (DZNE) Tübingen; Indiana University; Mayo Clinic Jacksonville; Neuroscience Research Australia; University College London; University of California, Los Angeles; University of Melbourne; University of Pittsburgh; and Washington University in St. Louis. We also acknowledge Alzheimer’s Disease Cooperative Study (ADCS) for coordination of clinical and neuropsychological evaluations and monitoring of the acquisition of imaging studies and collection of biological fluids; Mayo Clinic Rochester for MRI site training and standardization; University of Michigan for PET site training and standardization; and San Francisco Veteran’s Administration Medical Center and Alzheimer’s Disease Neuroimaging Initiative (ADNI) for the assistance in the conduct of project research. For additional information about the DIAN project, please see the DIAN website (www.DIAN-info.org)
Footnotes
Publisher's Disclaimer: This is a PDF file of an unedited manuscript that has been accepted for publication. As a service to our customers we are providing this early version of the manuscript. The manuscript will undergo copyediting, typesetting, and review of the resulting proof before it is published in its final citable form. Please note that during the production process errors may be discovered which could affect the content, and all legal disclaimers that apply to the journal pertain.
References
- Aisen PS. Alzheimer’s disease therapeutic research: the path forward. Alzheimers Res Ther. 2009;1:2. doi: 10.1186/alzrt2. [DOI] [PMC free article] [PubMed] [Google Scholar]
- Aisen PS, Andrieu S, Sampaio C, Carrillo M, Khachaturian ZS, Dubois B, Feldman HH, Petersen RC, Siemers E, Doody RS, Hendrix SB, Grundman M, Schneider LS, Schindler RJ, Salmon E, Potter WZ, Thomas RG, Salmon D, Donohue M, Bednar MM, Touchon J, Vellas B. Report of the task force on designing clinical trials in early (predementia) AD. Neurology. 2011;76:280–286. doi: 10.1212/WNL.0b013e318207b1b9. [DOI] [PMC free article] [PubMed] [Google Scholar]
- Aizenstein HJ, Nebes RD, Saxton JA, Price JC, Mathis CA, Tsopelas ND, Ziolko SK, James JA, Snitz BE, Houck PR, Bi W, Cohen AD, Lopresti BJ, DeKosky ST, Halligan EM, Klunk WE. Frequent amyloid deposition without significant cognitive impairment among the elderly. Arch Neurol. 2008;65:1509–1517. doi: 10.1001/archneur.65.11.1509. [DOI] [PMC free article] [PubMed] [Google Scholar]
- Bateman RJ, Xiong C, Benzinger TL, Fagan AM, Goate A, Fox NC, Marcus DS, Cairns NJ, Xie X, Blazey TM, Holtzman DM, Santacruz A, Buckles V, Oliver A, Moulder K, Aisen PS, Ghetti B, Klunk WE, McDade E, Martins RN, Masters CL, Mayeux R, Ringman JM, Rossor MN, Schofield PR, Sperling RA, Salloway S, Morris JC. Clinical and biomarker changes in dominantly inherited Alzheimer’s disease. N Engl J Med. 2012;367:795–804. doi: 10.1056/NEJMoa1202753. [DOI] [PMC free article] [PubMed] [Google Scholar]
- Bousse A, Pedemonte S, Thomas BA, Erlandsson K, Ourselin S, Arridge S, Hutton BF. Markov random field and Gaussian mixture for segmented MRI-based partial volume correction in PET. Phys Med Biol. 2012;57:6681–6705. doi: 10.1088/0031-9155/57/20/6681. [DOI] [PubMed] [Google Scholar]
- Brookmeyer R, Johnson E, Ziegler-Graham K, Arrighi HM. Forecasting the global burden of Alzheimer’s disease. Alzheimer’s and Dementia. 2007;3:186–191. doi: 10.1016/j.jalz.2007.04.381. [DOI] [PubMed] [Google Scholar]
- Doody RS, Raman R, Farlow M, Iwatsubo T, Vellas B, Joffe S, Kieburtz K, He F, Sun X, Thomas RG, Aisen PS, Siemers E, Sethuraman G, Mohs R. A phase 3 trial of semagacestat for treatment of Alzheimer’s disease. N Engl J Med. 2013;369:341–350. doi: 10.1056/NEJMoa1210951. [DOI] [PubMed] [Google Scholar]
- Eisenstein SA, Koller JM, Piccirillo M, Kim A, Antenor-Dorsey JA, Videen TO, Snyder AZ, Karimi M, Moerlein SM, Black KJ, Perlmutter JS, Hershey T. Characterization of extrastriatal D2 in vivo specific binding of [(1)(8)F](N-methyl)benperidol using PET. Synapse. 2012;66:770–780. doi: 10.1002/syn.21566. [DOI] [PMC free article] [PubMed] [Google Scholar]
- Frouin V, Comtat C, Reilhac A, Gregoire MC. Correction of partial-volume effect for PET striatal imaging: fast implementation and study of robustness. J Nucl Med. 2002;43:1715–1726. [PubMed] [Google Scholar]
- Hajnal JV, Saeed N, Soar EJ, Oatridge A, Young IR, Bydder GM. A registration and interpolation procedure for subvoxel matching of serially acquired MR images. J Comput Assist Tomogr. 1995;19:289–296. doi: 10.1097/00004728-199503000-00022. [DOI] [PubMed] [Google Scholar]
- Han X, Jovicich J, Salat D, van der Kouwe A, Quinn B, Czanner S, Busa E, Pacheco J, Albert M, Killiany R, Maguire P, Rosas D, Makris N, Dale A, Dickerson B, Fischl B. Reliability of MRI-derived measurements of human cerebral cortical thickness: the effects of field strength, scanner upgrade and manufacturer. Neuroimage. 2006;32:180–194. doi: 10.1016/j.neuroimage.2006.02.051. [DOI] [PubMed] [Google Scholar]
- Holtzman DM, Morris JC, Goate AM. Alzheimer’s Disease: The Challenge of the Second Century. Science Translational Medicine. 2011;3:77sr71–77sr71. doi: 10.1126/scitranslmed.3002369. [DOI] [PMC free article] [PubMed] [Google Scholar]
- Huang Y, Mucke L. Alzheimer mechanisms and therapeutic strategies. Cell. 2012;148:1204–1222. doi: 10.1016/j.cell.2012.02.040. [DOI] [PMC free article] [PubMed] [Google Scholar]
- Jack CR, Jr, Bernstein MA, Borowski BJ, Gunter JL, Fox NC, Thompson PM, Schuff N, Krueger G, Killiany RJ, Decarli CS, Dale AM, Carmichael OW, Tosun D, Weiner MW. Update on the magnetic resonance imaging core of the Alzheimer’s disease neuroimaging initiative. Alzheimers Dement. 2010;6:212–220. doi: 10.1016/j.jalz.2010.03.004. [DOI] [PMC free article] [PubMed] [Google Scholar]
- Jack CR, Jr, Bernstein MA, Fox NC, Thompson P, Alexander G, Harvey D, Borowski B, Britson PJ, JLW, Ward C, Dale AM, Felmlee JP, Gunter JL, Hill DL, Killiany R, Schuff N, Fox-Bosetti S, Lin C, Studholme C, DeCarli CS, Krueger G, Ward HA, Metzger GJ, Scott KT, Mallozzi R, Blezek D, Levy J, Debbins JP, Fleisher AS, Albert M, Green R, Bartzokis G, Glover G, Mugler J, Weiner MW. The Alzheimer’s Disease Neuroimaging Initiative (ADNI): MRI methods. J Magn Reson Imaging. 2008;27:685–691. doi: 10.1002/jmri.21049. [DOI] [PMC free article] [PubMed] [Google Scholar]
- Joshi A, Koeppe RA, Fessler JA. Reducing between scanner differences in multi-center PET studies. Neuroimage. 2009;46:154–159. doi: 10.1016/j.neuroimage.2009.01.057. [DOI] [PMC free article] [PubMed] [Google Scholar]
- Jovicich J, Czanner S, Han X, Salat D, van der Kouwe A, Quinn B, Pacheco J, Albert M, Killiany R, Blacker D, Maguire P, Rosas D, Makris N, Gollub R, Dale A, Dickerson BC, Fischl B. MRI-derived measurements of human subcortical, ventricular and intracranial brain volumes: Reliability effects of scan sessions, acquisition sequences, data analyses, scanner upgrade, scanner vendors and field strengths. Neuroimage. 2009;46:177–192. doi: 10.1016/j.neuroimage.2009.02.010. [DOI] [PMC free article] [PubMed] [Google Scholar]
- Kim E, Shidahara M, Tsoumpas C, McGinnity CJ, Kwon JS, Howes OD, Turkheimer FE. Partial volume correction using structural-functional synergistic resolution recovery: comparison with geometric transfer matrix method. J Cereb Blood Flow Metab. 2013;33:914–920. doi: 10.1038/jcbfm.2013.29. [DOI] [PMC free article] [PubMed] [Google Scholar]
- Klunk WE, Engler H, Nordberg A, Wang Y, Blomqvist G, Holt DP, Bergstrom M, Savitcheva I, Huang GF, Estrada S, Ausen B, Debnath ML, Barletta J, Price JC, Sandell J, Lopresti BJ, Wall A, Koivisto P, Antoni G, Mathis CA, Langstrom B. Imaging brain amyloid in Alzheimer’s disease with Pittsburgh Compound-B. Ann Neurol. 2004;55:306–319. doi: 10.1002/ana.20009. [DOI] [PubMed] [Google Scholar]
- Kuhn FP, Warnock GI, Burger C, Ledermann K, Martin-Soelch C, Buck A. Comparison of PET template-based and MRI-based image processing in the quantitative analysis of C11-raclopride PET. EJNMMI Res. 2014;4:7. doi: 10.1186/2191-219X-4-7. [DOI] [PMC free article] [PubMed] [Google Scholar]
- Le Pogam A, Hatt M, Descourt P, Boussion N, Tsoumpas C, Turkheimer FE, Prunier-Aesch C, Baulieu JL, Guilloteau D, Visvikis D. Evaluation of a 3D local multiresolution algorithm for the correction of partial volume effects in positron emission tomography. Med Phys. 2011;38:4920–4923. doi: 10.1118/1.3608907. [DOI] [PMC free article] [PubMed] [Google Scholar]
- Logan J, Fowler JS, Volkow ND, Wang GJ, Ding YS, Alexoff DL. Distribution volume ratios without blood sampling from graphical analysis of PET data. Journal of Cerebral Blood Flow and Metabolism. 1996;16:834–840. doi: 10.1097/00004647-199609000-00008. [DOI] [PubMed] [Google Scholar]
- Logan J, Fowler JS, Volkow ND, Wolf AP, Dewey SL, Schlyer DJ, MacGregor RR, Hitzemann R, Bendriem B, Gatley SJ, et al. Graphical analysis of reversible radioligand binding from time-activity measurements applied to [N-11C-methyl]-(−)-cocaine PET studies in human subjects. J Cereb Blood Flow Metab. 1990;10:740–747. doi: 10.1038/jcbfm.1990.127. [DOI] [PubMed] [Google Scholar]
- Lopresti BJ, Klunk WE, Mathis CA, Hoge JA, Ziolko SK, Lu X, Meltzer CC, Schimmel K, Tsopelas ND, DeKosky ST, Price JC. Simplified quantification of Pittsburgh Compound B amyloid imaging PET studies: a comparative analysis. J Nucl Med. 2005;46:1959–1972. [PubMed] [Google Scholar]
- Lowe VJ, Kemp BJ, Jack CR, Jr, Senjem M, Weigand S, Shiung M, Smith G, Knopman D, Boeve B, Mullan B, Petersen RC. Comparison of 18F-FDG and PiB PET in cognitive impairment. J Nucl Med. 2009;50:878–886. doi: 10.2967/jnumed.108.058529. [DOI] [PMC free article] [PubMed] [Google Scholar]
- Mathis CA, Wang Y, Holt DP, Huang GF, Debnath ML, Klunk WE. Synthesis and evaluation of 11C-labeled 6-substituted 2-arylbenzothiazoles as amyloid imaging agents. J Med Chem. 2003;46:2740–2754. doi: 10.1021/jm030026b. [DOI] [PubMed] [Google Scholar]
- Meltzer CC, Kinahan PE, Greer PJ, Nichols TE, Comtat C, Cantwell MN, Lin MP, Price JC. Comparative evaluation of MR-based partial-volume correction schemes for PET. J Nucl Med. 1999;40:2053–2065. [PubMed] [Google Scholar]
- Meltzer CC, Zubieta JK, Brandt J, Tune LE, Mayberg HS, Frost JJ. Regional hypometabolism in Alzheimer’s disease as measured by positron emission tomography after correction for effects of partial volume averaging. Neurology. 1996;47:454–461. doi: 10.1212/wnl.47.2.454. [DOI] [PubMed] [Google Scholar]
- Mintun MA, Larossa GN, Sheline YI, Dence CS, Lee SY, Mach RH, Klunk WE, Mathis CA, DeKosky ST, Morris JC. [11C]PIB in a nondemented population: potential antecedent marker of Alzheimer disease. Neurology. 2006;67:446–452. doi: 10.1212/01.wnl.0000228230.26044.a4. [DOI] [PubMed] [Google Scholar]
- Morris JC, Aisen PS, Bateman RJ, Benzinger TL, Cairns NJ, Fagan AM, Ghetti B, Goate AM, Holtzman DM, Klunk WE, McDade E, Marcus DS, Martins RN, Masters CL, Mayeux R, Oliver A, Quaid K, Ringman JM, Rossor MN, Salloway S, Schofield PR, Selsor NJ, Sperling RA, Weiner MW, Xiong C, Moulder KL, Buckles VD. Developing an international network for Alzheimer research: The Dominantly Inherited Alzheimer Network. Clin Investig (Lond) 2012;2:975–984. doi: 10.4155/cli.12.93. [DOI] [PMC free article] [PubMed] [Google Scholar]
- Morris JC, Price AL. Pathologic correlates of nondemented aging, mild cognitive impairment, and early-stage Alzheimer’s disease. J Mol Neurosci. 2001;17:101–118. doi: 10.1385/jmn:17:2:101. [DOI] [PubMed] [Google Scholar]
- Rosario BL, Weissfeld LA, Laymon CM, Mathis CA, Klunk WE, Berginc MD, James JA, Hoge JA, Price JC. Inter-rater reliability of manual and automated region-of-interest delineation for PiB PET. Neuroimage. 2011;55:933–941. doi: 10.1016/j.neuroimage.2010.12.070. [DOI] [PMC free article] [PubMed] [Google Scholar]
- Rousset OG, Collins DL, Rahmim A, Wong DF. Design and implementation of an automated partial volume correction in PET: application to dopamine receptor quantification in the normal human striatum. J Nucl Med. 2008;49:1097–1106. doi: 10.2967/jnumed.107.048330. [DOI] [PMC free article] [PubMed] [Google Scholar]
- Rousset OG, Ma Y, Evans AC. Correction for partial volume effects in PET: principle and validation. J Nucl Med. 1998;39:904–911. [PubMed] [Google Scholar]
- Rowe CC, Ackerman U, Browne W, Mulligan R, Pike KL, O’Keefe G, Tochon-Danguy H, Chan G, Berlangieri SU, Jones G, Dickinson-Rowe KL, Kung HP, Zhang W, Kung MP, Skovronsky D, Dyrks T, Holl G, Krause S, Friebe M, Lehman L, Lindemann S, Dinkelborg LM, Masters CL, Villemagne VL. Imaging of amyloid beta in Alzheimer’s disease with 18F-BAY94-9172, a novel PET tracer: proof of mechanism. Lancet Neurol. 2008;7:129–135. doi: 10.1016/S1474-4422(08)70001-2. [DOI] [PubMed] [Google Scholar]
- Rowland DJ, Garbow JR, Laforest R, Snyder AZ. Registration of [18F]FDG microPET and small-animal MRI. Nucl Med Biol. 2005;32:567–572. doi: 10.1016/j.nucmedbio.2005.05.002. [DOI] [PubMed] [Google Scholar]
- Sojkova J, Zhou Y, An Y, Kraut MA, Ferrucci L, Wong DF, Resnick SM. Longitudinal patterns of beta-amyloid deposition in nondemented older adults. Arch Neurol. 2011;68:644–649. doi: 10.1001/archneurol.2011.77. [DOI] [PMC free article] [PubMed] [Google Scholar]
- Soret M, Bacharach SL, Buvat I. Partial-volume effect in PET tumor imaging. J Nucl Med. 2007;48:932–945. doi: 10.2967/jnumed.106.035774. [DOI] [PubMed] [Google Scholar]
- Su Y, D’Angelo GM, Vlassenko AG, Zhou G, Snyder AZ, Marcus DS, Blazey TM, Christensen JJ, Vora S, Morris JC, Mintun MA, Benzinger TL. Quantitative analysis of PiB-PET with FreeSurfer ROIs. PLoS ONE. 2013;8:e73377. doi: 10.1371/journal.pone.0073377. [DOI] [PMC free article] [PubMed] [Google Scholar]
- Su Y, Shoghi KI. Wavelet denoising in voxel-based parametric estimation of small animal PET images: a systematic evaluation of spatial constraints and noise reduction algorithms. Phys Med Biol. 2008;53:5899–5915. doi: 10.1088/0031-9155/53/21/001. [DOI] [PMC free article] [PubMed] [Google Scholar]
- Thomas BA, Erlandsson K, Modat M, Thurfjell L, Vandenberghe R, Ourselin S, Hutton BF. The importance of appropriate partial volume correction for PET quantification in Alzheimer’s disease. Eur J Nucl Med Mol Imaging. 2011;38:1104–1119. doi: 10.1007/s00259-011-1745-9. [DOI] [PubMed] [Google Scholar]
- Vandenberghe R, Van Laere K, Ivanoiu A, Salmon E, Bastin C, Triau E, Hasselbalch S, Law I, Andersen A, Korner A, Minthon L, Garraux G, Nelissen N, Bormans G, Buckley C, Owenius R, Thurfjell L, Farrar G, Brooks DJ. 18F-flutemetamol amyloid imaging in Alzheimer disease and mild cognitive impairment: a phase 2 trial. Ann Neurol. 2010;68:319–329. doi: 10.1002/ana.22068. [DOI] [PubMed] [Google Scholar]
- Villemagne VL, Pike KE, Chetelat G, Ellis KA, Mulligan RS, Bourgeat P, Ackermann U, Jones G, Szoeke C, Salvado O, Martins R, O’Keefe G, Mathis CA, Klunk WE, Ames D, Masters CL, Rowe CC. Longitudinal assessment of Abeta and cognition in aging and Alzheimer disease. Ann Neurol. 2011;69:181–192. doi: 10.1002/ana.22248. [DOI] [PMC free article] [PubMed] [Google Scholar]
- Wong DF, Rosenberg PB, Zhou Y, Kumar A, Raymont V, Ravert HT, Dannals RF, Nandi A, Brasic JR, Ye W, Hilton J, Lyketsos C, Kung HF, Joshi AD, Skovronsky DM, Pontecorvo MJ. In vivo imaging of amyloid deposition in Alzheimer disease using the radioligand 18F-AV-45 (florbetapir [corrected] F 18) J Nucl Med. 2010;51:913–920. doi: 10.2967/jnumed.109.069088. [DOI] [PMC free article] [PubMed] [Google Scholar]
- Zaidi H, Ruest T, Schoenahl F, Montandon ML. Comparative assessment of statistical brain MR image segmentation algorithms and their impact on partial volume correction in PET. Neuroimage. 2006;32:1591–1607. doi: 10.1016/j.neuroimage.2006.05.031. [DOI] [PubMed] [Google Scholar]
Associated Data
This section collects any data citations, data availability statements, or supplementary materials included in this article.