

Abstract
Rett syndrome (RTT) is a neurodevelopment disorder associated with intellectual disabilities and caused by loss-of-function mutations in the gene encoding the transcriptional regulator Methyl-CpG-binding Protein-2 (MeCP2). Neuronal dysfunction and changes in cortical excitability occur in RTT individuals and Mecp2-deficient mice, including hippocampal network hyperactivity and higher frequency of spontaneous multi-unit spikes in the CA3 cell body layer. Here, we describe impaired synaptic inhibition and an excitation/inhibition (E/I) imbalance in area CA3 of acute slices from symptomatic Mecp2 knockout male mice (referred to as Mecp2-/y). The amplitude of TTX-resistant miniature inhibitory postsynaptic currents (mIPSC) was smaller in CA3 pyramidal neurons of Mecp2-/y slices than in wildtype controls, while the amplitude of miniature excitatory postsynaptic currents (mEPSC) was significantly larger in Mecp2-/y neurons. Consistently, quantitative confocal immunohistochemistry revealed significantly lower intensity of the alpha-1 subunit of GABAARs in the CA3 cell body layer of Mecp2-/y mice, while GluA1 puncta intensities were significantly higher in the CA3 dendritic layers of Mecp2-/y mice. In addition, the input/output (I/O) relationship of evoked IPSCs had a shallower slope in CA3 pyramidal neurons Mecp2-/y neurons. Consistent with the absence of neuronal degeneration in RTT and MeCP2-based mouse models, the density of parvalbumin- and somatostatin-expressing interneurons in area CA3 was not affected in Mecp2-/y mice. Furthermore, the intrinsic membrane properties of several interneuron subtypes in area CA3 were not affected by Mecp2 loss. However, mEPSCs are smaller and less frequent in CA3 fast-spiking basket cells of Mecp2-/y mice, suggesting an impaired glutamatergic drive in this interneuron population. These results demonstrate that a loss-of-function mutation in Mecp2 causes impaired E/I balance onto CA3 pyramidal neurons, leading to a hyperactive hippocampal network, likely contributing to limbic seizures in Mecp2-/y mice and RTT individuals.
INTRODUCTION
Partial and generalized convulsive or silent seizures occur in Rett syndrome (RTT), a neurodevelopmental disorder caused by mutations in MECP2 (Amir et al., 1999). Consistent with the seizures observed in RTT individuals (Glaze et al., 1987, Steffenburg et al., 2001, Nissenkorn et al., 2010, Pintaudi et al., 2010, Cardoza et al., 2011), several lines of MeCP2-deficent mice exhibit seizure disorders (reviewed by Calfa et al., 2011b). Mice expressing a non-functional truncated protein (Mecp2308) display repetitive generalized myoclonic jerks associated with high-amplitude bilateral cortical spikes and wave discharges in the electroencephalogram (EEG) (Shahbazian et al., 2002). Mecp2 knockout mice also have seizure episodes with recurrent atypical EEG discharges in somatosensory cortex (Pelka et al., 2006, Chao et al., 2010, D’Cruz et al., 2010).
Electrophysiological recordings from principal neurons in slices from somatosensory cortex or thalamus, as well as from cultured hippocampal neurons from Mecp2 knockout mice have shown reduced neuronal activity caused by a selective impairment in excitatory synaptic transmission (Dani et al., 2005, Nelson et al., 2006, Chao et al., 2007, Dani and Nelson, 2009, Noutel et al., 2011); but see (Nelson et al., 2011, Zhang et al., 2014), while a stronger innervation of pyramidal neurons by parvalbumin-expressing GABAergic interneurons causes a reduction in network activity in the visual cortex (Durand et al., 2012). On the other hand, neuronal activity in other brain regions is elevated, such as the hippocampus (Zhang et al., 2008, Calfa et al., 2011a) and brainstem (Kline et al., 2010). Using voltage-sensitive dye imaging, we demonstrated that hippocampal slices from male symptomatic Mecp2 knockout mice (Mecp2-/y) are hyperactive and more sensitive to epileptiform agents, which originates from a higher frequency of spontaneous spikes in CA3 pyramidal neurons (Calfa et al., 2011a). Here, we describe an imbalance of excitation/inhibition (E/I) inputs onto CA3 pyramidal neurons of symptomatic Mecp2-/y mice due to impaired synaptic inhibition, which drives the hyperactivity of the hippocampal network and likely contributes to atypical EEG and seizures disorders in MeCP2-deficient mice and RTT individuals.
MATERIAL AND METHODS
Animals
Female heterozygous Mecp2 mice with deletions of exon 3 (Mecp2tm1.1Jae “Jaenisch line”) (Chen et al., 2001) were obtained from the Mutant Mouse Regional Resource Center (University of California, Davis), and maintained in a pure C57/BL6 background by crossing them with wildtype C57/BL6 male mice. All experimental subjects were male hemizygous Mecp2tm1.1Jae knockout males (referred to as Mecp2-/y) aged between postnatal days 40–60, when they exhibited RTT-like motor symptoms such as hypoactivity, hind limb clasping, and reflex impairments; age-matched wildtype male littermates were used as controls. Animals were handled and housed according to the Committee on Laboratory Animal Resources of the National Institutes of Health. All experimental protocols were reviewed and approved annually by the Institutional Animals Care and Use Committee of UAB.
Acute hippocampal slices
Mice were anesthetized with ketamine (100 mg/kg, i.p.) and transcardially perfused with ice-cold “cutting” artificial cerebrospinal fluid (aCSF) containing (mM): 110 choline-Cl, 26 glucose, 7 MgCl2, 2.5 KCl, 1.25 NaH2PO4, 0.5 CaCl2, 11.6 Na-ascorbate, 3 Na-pyruvate, 11 NaHCO3, which was bubbled with 95% O2/5% CO2. Ventral hippocampal slices (300μm-thick) were prepared using a vibratome (Leica VT1200S), and allowed to recover for at least 1hr at room temperature in a submerged chamber filled with aCSF containing (in mM): 129 NaCl, 3.5 KCl, 1.8 MgSO4, 1.6 CaCl2, 1.25 NaH2PO4, 26 NaHCO3, 26 glucose; pH 7.4; saturated with 95% O2/5% CO2.
Whole-cell intracellular recordings
Individual acute slices were transferred to a recording chamber mounted on a fixed-stage upright microscope (Leica DM-LFS, or Zeiss Axioskop-FS), and continuously perfused (2mL/min) with aCSF at room temperature (24°C), containing (in mM): 121 NaCl, 5 KCl, 1.24 KH2PO4, 1.3 MgSO4, 17.6 NaHCO3, 2.5 CaCl2, 10 glucose, and 29.2 sucrose (310–320mOsm); aCSF was bubbled with 95% O2/5% CO2 (pH 7.4). Superficial pyramidal neurons in CA3 stratum pyramidale and interneurons within CA3 stratum oriens or stratum lucidum were visualized with a water-immersion 63X objective (0.9NA) using IR-DIC microscopy. Current-clamp experiments from pyramidal neurons were performed with unpolished whole-cell pipettes containing (in mM): 120 K-Gluconate, 17.5 KCl, 10 Na-HEPES, 4 Mg-ATP, 0.4 Na-GTP, 10 Na2-creatine phosphate, 0.2 Na-EGTA; 290–300mOsm; pH 7.3 (final resistance 3–4MΩ), and the aCSF contained CNQX (20μM), APV (100μM) and picrotoxin (50μM). Voltage-clamp recordings from pyramidal neurons were performed with unpolished whole-cell pipettes containing (in mM): 120 Cs-gluconate, 17.5 CsCl, 10 Na-HEPES, 4 Mg-ATP, 0.4 Na-GTP, 10 Na2-creatine phosphate, 0.2 Na-EGTA; 290–300mOsm; pH 7.3 (final resistance 3–4MΩ). Spontaneous mEPSCs in 1μM TTX were recorded first at −60mV, followed by recordings of mIPSCs at 0mV in the same cells. Recordings of mEPSCs and spontaneous firing from interneurons were performed with unpolished whole-cell pipettes containing (in mM): 125 K-Gluconate, 10 KCl, 10 Na-HEPES, 2 Mg-ATP, 0.2 Na-GTP, 10 Na2-creatine phosphate, 0.2 Na-EGTA; 290–300mOsm; pH 7.3 (final resistance 3–4MΩ). Recordings of mIPSC from interneurons were performed with pipettes containing (in mM): 137.5 KCl, 10 KCl, 10 Na-HEPES, 4 Mg-ATP, 0.4 Na-GTP, 10 Na2-creatine phosphate, 0.2 Na-EGTA. Whole-cell pipettes for interneuron recordings also contained 2mg/mL biocytin for post-hoc morphological characterization. Slices were fixed in 4% paraformaldehyde in 100mM phosphate buffer (PB), rinsed in PB saline (PBS, incubated with 1:250 Streptavidin Alexa-488, mounted on glass slides, and imaged by confocal microscopy (Olympus FV300, Argon laser, FITC filter, oil-immersion 60X 1.4NA objective).
Synaptic responses were evoked by stimulation of local interneurons within CA3 stratum lucidum and stratum oriens with 100μsec constant current pulses from a stimulus isolation unit (ISO-Flex, AMPI) connected to a patch electrode filled with oxygenated aCSF (final resistance 3–4MΩ). IPSCs were evoked at 0mV and isolated by using CNQX (20μM) and APV (100μM). Membrane currents and voltages were acquired with Axopatch-200B amplifiers (Molecular Devices), filtered at 2kHz and digitized at 10kHz with ITC-18 A/D-D/A interfaces (Instrutech) controlled by custom-written software in G5 PowerMac computers (TI-Work_Bench, provided by Dr. Takafumi Inoue). Spontaneous events were analyzed using MiniAnalysis (Synaptosoft).
Immunohistochemistry
Mice were anesthetized with ketamine and transcardially perfused with cold 4% paraformaldehyde in 100 mM PBS for 15 min. Brains were dissected by posterior craniotomy, placed in the above fixative at 4°C for 12 hrs, and cryoprotected by serial incubation in 15% and then 30% sucrose in 0.1 M PBS at 4°C (until sinking in every sucrose step). Brains were rinsed, dabbed dry, embedded in OCT (Tissue-Tek) and kept at −80°C. Brains were mounted and trimmed along the anterior-posterior axis to the vicinity of hippocampal formation using a Leica Jung CM3000 cryostat. Twenty five micron coronal sections were cut and affixed to gelatin-subbed glass slides, which were kept at −20°C. Sections were allowed to warm to room temperature before rehydrating twice in 0.1 M PBS for 5 min; all following steps and solutions were at room temperature unless otherwise noted and performed with optimal volume on the glass slide by using a PAP pen (ImmEdge, Vector). Incubations longer than 10 min were performed in a humidified chamber.
For immunohistochemistry of GABAergic neurons, sections were permeabilized by incubation with 0.1% Triton-X 100 in 0.1 M PBS (PBST) for 10 min. Antigen retrieval was performed by incubating sections twice with 10mM sodium citrate, pH 3.0 with 0.05% Tween-20 for 10 min each, and then washing five times with PBST. Sections were blocked for 60 min with 10% normal goat serum (Sigma) in PBST followed by washing five times with PBST. Sections were incubated at 4°C for 16 hrs with 1:750 mouse anti-GAD67 (Millipore, MAB5406) and either 1:1000 rabbit anti-parvalbumin (Abcam, ab11427) or 1:1670 rabbit anti-somatostatin (Immunostar, 20089). After incubation slides were washed seven times with PBST prior to incubation for 2 hrs with 1:1000 goat anti-mouse secondary antibody conjugated with AlexaFluor 568 and 1:1000 goat anti-rabbit conjugated with AlexaFluor 488 (Invitrogen). Slides were washed seven times with PBS, covered with VectaShield (Vector), coverslipped, and stored at 4°C. Sections were imaged in a laser-scanning confocal microscope (Olympus FV300) using an oil-immersion 20X 0.85 NA objective, and argon and HeNe green lasers for excitation. Eight optical sections at 2.5μm intervals were acquired from each fluorophore sequentially (FITC and TRITC emission filters; Semrock), and then displayed as maximum-intensity projections for cell counting (ImageJ; NIH). Four different cryostat sections through the hippocampus were imaged and analyzed per animal. Adjacent images were stitched together as needed using an ImageJ plugin (Preibisch et al., 2009). The CA3 region was defined as a wedge extending from the lateral tips of the dentate gyrus around to the point of inflection of Cornu Ammonis. Stacks of optical sections from each channel were analyzed separately from each other; positively stained cells were identified and counted per channel before blending; coincident positively stained cells were counted as positive for both antigens.
For immunohistochemistry of postsynaptic receptors containing either the GluA1 subunit of AMPA-type glutamate receptors, or the alpha-1 subunit of GABAA receptors, sections were permeabilized for 1 hr with 0.25% Triton-X 100 in PBS, and blocked for 1hr with 10% normal serum. Sections were incubated at 4°C overnight with 1:200 rabbit anti-GluA1 (Millipore, AB1504) or anti- GABAA receptors α1 (Millipore, 06-868), followed by incubation with 1:300 anti-rabbit secondary antibody conjugated with AlexFluor 568 (Invitrogen). For the GABAA immunostaining, to visualize pyramidal cell nuclei sections were co-incubated with mouse anti-NeuN (MAB377) and anti-mouse AlexFluor 488 secondary antibody (Invitrogen). Optical sections at 1μm intervals were acquired with an oil-immersion 60X 1.42 NA objective, and displayed for the CA3 region as described above. Laser power and photomultiplier gain were set at the same levels for all sections imaged to allow quantitative comparisons of immunolabeling intensities of between wildtype and Mecp2 knockout sections. The number of puncta within each layer of area CA3, stratum oriens (SO), stratum pyramidale (SP), stratum lucidum (SL) and stratum radiatum (SR), was counted with a particle analysis plug-in of ImageJ using a defined puncta size range.
Statistical analyses
For all quantitative analyses, the experimenters were blind to the genotype. All data are shown as the mean ± s.e.m, and compared by parametric unpaired Student’s t-test, or non-parametric Mann-Whitney, or Kolmogorov-Smirnov tests using Prism (GraphPad) and MiniAnalysis programs. Differences between group means were considered significant at p<0.05.
RESULTS AND DISCUSSION
Voltage-sensitive dye imaging revealed that hippocampal slices from symptomatic Mecp2 male knockout mice (Mecp2-/y) are hyperactive, and more sensitive to the epileptiform agent 4-AP (Calfa et al., 2011a). Network hyperactivity originated from area CA3, which showed a higher frequency of spontaneous multi-unit spikes (Calfa et al., 2011a). To find the cellular origin of such network hyperactivity, we first characterized the intrinsic membrane properties of CA3 pyramidal neurons under current-clamp and in the absence of excitatory and inhibitory inputs (DL-APV, CNQX, and picrotoxin). All intrinsic membrane properties were comparable in CA3 pyramidal neurons from both genotypes (Supplemental Table 1; p>0.05). Intrinsic excitability was estimated by the number of spikes fired at different amplitudes of direct current injection (Suppl. Fig. 1A). The fitted slopes (m) of the linear portion of such firing-input (F-I) curves (Suppl. Fig. 1B) were similar in wildtype (0.12±0.02, n=5 cells/3 mice) and Mecp2-/y mice (0.17±0.02, n=6/3; p=0.124). Also, the amplitudes of the fast afterhyperpolarization (fAHP; Suppl. Fig. 1C), and the slow AHP (sAHP; Suppl. Fig. 1D) were similar in both genotypes (p>0.05). Consistent with an earlier study in the Bird line of Mecp2 knockout mice (Zhang et al., 2008), these data indicate that the intrinsic excitability of CA3 pyramidal neurons is not affected by Mecp2 deletion, and thus should not contribute to hippocampal network hyperactivity.
Next, we recorded TTX-resistant miniature inhibitory and excitatory postsynaptic currents (mIPSC and mEPSC, respectively; 1μM TTX) to evaluate spontaneous quantal synaptic input onto CA3 pyramidal neurons (Fig. 1A, 1E). The cumulative probability distribution of mIPSC amplitude and charge recorded in Mecp2-/y CA3 pyramidal neurons (n=8 cells/7 mice) was shifted towards the left compared to wildtype neurons (n=6/5; p<0.001, Kolmogorov-Smirnov test: KS-Z value=5.3 for mIPSC amplitude; KS-Z value=7.59 for mIPSC charge) (Fig. 1B, 1C). Intriguingly, the cumulative probability distribution of mIPSC inter-event intervals in Mecp2-/y CA3 pyramidal neurons was shifted towards the left compared to wildtype neurons, i.e. higher mIPSC frequency (p<0.001, KS-Z value=6.6) (Fig. 1D). On the other hand, the cumulative probability distribution of mEPSC amplitude and charge recorded in Mecp2-/y CA3 pyramidal neurons (n=6 cells/5 mice) was shifted towards the right compared to wildtype neurons (n=6/5; p<0.001; KS-Z value=4.4 for mEPSC amplitude; KS-Z value=5.8 for mEPSC charge) (Fig. 1F, 1G). The cumulative probability distribution of mEPSC inter-event intervals in Mecp2-/y CA3 pyramidal neurons was shifted towards the right compared to wildtype neurons, i.e. a lower mEPSC frequency (p=0.0001; KS-Z value=2.2) (Fig. 1H). No significant changes were observed in the kinetics of individual mEPSCs and mIPSCs between wildtype and Mecp2-/y neurons (Table 1; p>0.05 Mann Whitney test).
Figure 1. Spontaneous quantal synaptic transmission onto CA3 pyramidal neurons.

A, Representative examples of mIPSCs. B, The cumulative probability distribution of mIPSC amplitudes recorded in Mecp2-/y CA3 pyramidal neurons was shifted towards the left compared to wildtype neurons. C, The cumulative probability distribution of mIPSC charges in Mecp2-/y CA3 pyramidal neurons was shifted towards the left compared to wildtype neurons. D, The cumulative probability distribution of mIPSC inter-event intervals in Mecp2-/y CA3 pyramidal neurons was shifted towards the left compared to wildtype neurons, i.e. higher mIPSC frequency. E, Representative examples of mEPSCs. F, The cumulative probability distribution of mEPSC amplitudes recorded in Mecp2-/y CA3 pyramidal neurons was shifted towards the right compared to wildtype neurons. G, The cumulative probability distribution of mEPSC charge in Mecp2-/y CA3 pyramidal neurons was shifted towards the right compared to wildtype neurons. H, The cumulative probability distribution of mEPSC inter-event intervals in Mecp2-/y CA3 pyramidal neurons was shifted towards the right compared to wildtype neurons, i.e. lower mEPSC frequency. I, The ratio of the amplitudes of mEPSCs to mIPSCs in CA3 pyramidal neurons is higher in Mecp2-/y mice compared to wildtype mice. These mEPSCs and mIPSCs where obtained from the same cells at different holding potentials. J, The ratio of the charges of mEPSCs to mIPSCs in CA3 pyramidal neurons is higher in Mecp2-/y mice compared to wildtype mice; same cells as in I.
Table 1.
Kinetics of mIPSC and mEPSC recorded from CA3 pyramidal neurons in acute slices from wildtype and Mecp2-/y mice.
| mIPSC | Wildtype (n=6 cells/5 mice) | Mecp2-/y (n=8 cells/7 mice) |
|---|---|---|
| Rise time (ms) | 2.3 (2 – 2.8) | 1.9 (1.8 – 2.5) |
| Decay time (ms) | 13.5 (12.2 – 15.6) | 13.8 (12.3 – 15.6) |
| mEPSC | Wildtype (n=6 cells/5 mice) | Mecp2-/y (n=6 cells/5 mice) |
|---|---|---|
| Rise time (ms) | 1.5 (1.2 – 2.1) | 1.7 (1.5 – 2.6) |
| Decay time (ms) | 6.6 (5.7 – 7.9) | 8.4 (6.5 – 12.5) |
Data is expressed as medians (quartiles in parentheses), and it was analyzed with Mann Whitney test (p>0.05).
Calculating the ratio of mEPSC and mIPSC amplitudes recorded from the same CA3 pyramidal neurons at different holding potentials (−65mV for mEPSCs, 0mV for mIPSCs) yielded a larger E/I ratio in Mecp2-/y neurons (1.25±0.3; n=6 cells/5 mice) compared to wildtype neurons (0.8±0.1; n=6/5; p=0.039) (Fig. 1I). Similarly, the ratio of mEPSC charge to mIPSC charge obtained from the same CA3 pyramidal neurons is higher in Mecp2-/y neurons (0.7±0.1) compared to wildtype ones (0.5±0.1; p=0.0036) (Fig. 1J). This analysis demonstrates an imbalance in the excitation-to-inhibition ratio of spontaneous quantal synaptic transmission arriving onto CA3 pyramidal neurons.
We next performed quantitative analyses of confocal immunohistochemical staining of postsynaptic receptors at inhibitory and excitatory hippocampal synapses. For inhibitory synapses, we chose the alpha-1 subunit of GABAARs because it is expressed in area CA3 (Hortnagl et al., 2013) in a punctate pattern in principal cells (Frola et al., 2013). The pixel intensity of fluorescent puncta immunopositive for the alpha-1 subunit of GABAARs was significantly lower in the CA3 pyramidal cell body layer of Mecp2-/y mice (stratum pyramidale; 357.9±38.9; n=15; p=0.005), while their numerical density was significantly higher on their basal dendrites in stratum oriens (30±1.3; n=14; p=0.046; Fig. 2A). These observations are consistent with the higher frequency of smaller mIPSCs recorded from Mecp2-/y CA3 pyramidal neurons (Fig. 1), which originate from proximal presynaptic terminals. Furthermore, the pixel intensity of GluA1 puncta was significantly higher in the distal apical dendrites of stratum radiatum (652.1±75.9; n=10; p=0.036), the basal dendrites in stratum oriens (781.5±93.9; n=9; p=0.029), and the cell body layer (2113±296.4; n=11; p=0.026) of Mecp2-/y mice (Fig. 2B), which is consistent with larger mEPSCs, which mainly originate from distal presynaptic terminals (Lawrence and McBain, 2003). On the other hand, differences in the numerical density of GluA1 puncta did not reach statistical significance in any of the CA3 layers (p>0.05; Fig. 2B).
Figure 2. Inhibitory and excitatory postsynaptic puncta in area CA3.

A top, Representative confocal microscopy images of dual immunolabeling of GABAAα1 and the neuronal nuclear marker NeuN in area CA3 of wildtype (left) and Mecp2-/y mice (right). Region inside white box is enlarged at the bottom, and shows postsynaptic GABAAR clusters around CA3 pyramidal neurons. bottom, Quantification of the pixel intensity and numerical density of GABAAα1 immunopositive puncta in the different layers of area CA3 (S.O. stratum oriens; S.P. stratum pyramidale; S.L. stratum lucidum; S.R. stratum radiatum). B top, Representative confocal microscopy images of immunolabeling of GluA1 in area CA3 of wildtype (left) and Mecp2-/y mice (right). Region inside white box is enlarged at the bottom, and shows postsynaptic AMPAR clusters in the dendritic regions of CA3. Scale bars are 50μm (top) and 10μm (insets). bottom, Quantification of the pixel intensity and numerical density of GluA1 immunopositive puncta in the different layers of area CA3; asterisks denote p<005.
To determine whether action potential-driven synaptic inhibition was also affected by Mecp2 deletion, we evoked IPSCs in CA3 pyramidal neurons clamped at 0mV by stimulating local interneurons in CA3 stratum lucidum in the presence of APV and CNQX (Fig. 3A). The fitted slope (m) of the linear portion of input-output (I-O) relationships of evoked IPSCs was significantly smaller in Mecp2-/y slices (m=79±7; n=16 cells/8 mice; R2=0.99) than in wildtype slices (m=133±15; n=13/7; R2=0.97; p=0.0018) (Fig. 3B), indicating weaker inhibitory synaptic transmission onto Mecp2-/y CA3 pyramidal neurons.
Figure 3. Evoked synaptic inhibition onto CA3 pyramidal neurons.
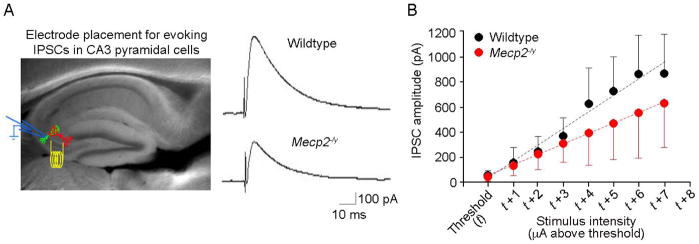
A, Electrode placement and representative examples of IPSCs evoked in CA3 pyramidal neurons clamped at 0mV by stimulation of local interneurons within CA3 stratum lucidum in the presence of APV/CNQX. B, Input-Output (I-O) relationship between the amplitude of evoked IPSCs and stimulation intensity. The fitted slope (m) of the linear portion of the I-O curve was significantly smaller in Mecp2-/y slices than in wildtype slices.
To begin searching the causes of impaired inhibitory synaptic transmission, we first performed a quantitative analysis of interneuron cell density in area CA3 by immunohistochemistry. The density of glutamic acid decarboxylase 1 (GAD1) positive interneurons was comparable in area CA3 of both genotypes (wildtype 971.1±85.0, n=3 vs. Mecp2-/y 946.3±111.6, n=4; p=0.8752; Fig. 4A). Similarly, the density of parvalbumin (PV) and GAD1 double-positive interneurons, which mostly target the somata of CA3 pyramidal neurons as basket cells, was not affected by Mecp2 deletion (wildtype 387.8±94.9 vs. Mecp2-/y 373.0±70.5, n=3; p=0.9065; Fig. 4B). Also, the density of somatostatin (SOM) and GAD1 double-positive interneurons, which target more distal dendritic regions of CA3 pyramidal neurons, was comparable in mice from both genotypes (wildtype 309.0±21.1 vs. Mecp2-/y 344.2±30.9, n=3; p=0.3993; Fig. 4C).
Figure 4. Interneuron cell density in area CA3.

A left, Representative example of a wildtype brain section including the hippocampus, which was immunostained with anti-GAD1 antibodies to illustrate the region used for quantitative analyses of interneuron cell density (confocal microscopy). Lines enclose the region analyzed for cell density: the wedge of dorsal hippocampus from the tips of the dentate gyrus laterally to the point of inflection of Cornu Ammonis. Arrowheads point to GAD1 immunopositive cells. right, number of GAD1 positive cells per mm2 of area CA3. B left, Representative examples of PV and GAD1 double immunostaining in area CA3 of wildtype (top) and Mecp2-/y (bottom) mice. Arrowheads point to PV/GAD1 double-positive cells. right, number of PV/GAD1 double-positive positive cells per mm2 of area CA3. C left, Representative examples of SST and GAD1 immunostaining in area CA3 of wildtype (top) and Mecp2-/y (bottom) mice. Arrowheads point to SST/GAD1 double-positive cells. right, number of SST/GAD1 double-positive positive cells per mm2 of area CA3.
Next, we performed whole-cell recordings from 4 different subtypes of interneurons present in area CA3 identifying them by their intrinsic firing properties (Suppl. Fig. 2), location, and morphology: fast-spiking basket cells, regular-spiking basket cells, spiny lucidum cells, and mossy fiber-associated cells (Szabadics and Soltesz, 2009). All intrinsic membrane properties were comparable in all these interneuron types from both genotypes (Table 2; p>0.05; Fig. 5A–F for fast-spiking basket cells; Suppl. Fig. 3 for regular-spiking basket cells; Suppl. Fig. 4 for spiny lucidum cells; Suppl. Fig. 5 for mossy fiber-associated cells). Notably, the frequency of spontaneous action potentials in fast-spiking basket cells was significantly smaller in Mecp2-/y mice compared to wildtype littermates (wildtype n=14 cells/8 mice, Mecp2-/y n=23/11; K-S test p<0.001; Fig. 5H, I). Analyses of asynchronous transmitter release onto CA3 interneurons revealed that fast-spiking basket cells received smaller mEPSCs with a slower frequency in Mecp2-/y knockouts than in wildtype mice (wildtype n=7/6 vs. Mecp2-/y n=13 cells/8 mice; K-S test p<0.001; Fig. 5J–L). These results suggest that asynchronous excitatory drive onto one of the most critical interneuron types in CA3 is weaker in Mecp2-/y knockouts.
Table 2.
Intrinsic properties of different CA3 interneuron types in acute slices from wildtype and Mecp2-/y mice.
| Fast-spiking basket cells | Wildtype (n=24 cells/15 mice) | Mecp2-/y (n=29 cells/16 mice) |
|---|---|---|
| Resting potential (mV) | −46.5±0.7 | −44.7±0.7 |
| Delay to first spike (ms) | 7.3±0.6 | 6.9±0.5 |
| Spike threshold (mV) | −34.7±3.1 | −32.1±3.7 |
| Spike amplitude (mV) | 77.2±2.1 | 71.9±1.8 |
| Spike width at half amplitude (ms) | 1.00±0.04 | 1.05±0.03 |
| Accommodation ratio | 1.87±0.13 | 1.87±0.12 |
| Regular-spiking basket cells | Wildtype (n=9 cells/7 mice) | Mecp2-/y (n=9 cells/9 mice) |
|---|---|---|
| Resting potential (mV) | −45.1±0.9 | −44.4±1.5 |
| Delay to first spike (ms) | 5.8±0.9 | 5.4±0.5 |
| Spike threshold (mV) | −38.1±1.1 | −38.5±1.5 |
| Spike amplitude (mV) | 73.1±4.2 | 67.8±2.7 |
| Spike width at half amplitude (ms) | 1.27±0.06 | 1.33±0.03 |
| Accommodation ratio | 2.39±0.21 | 2.67±0.31 |
| Spiny lucidum cells | Wildtype (n=5 cells/5 mice) | Mecp2-/y (n=6 cells/4 mice) |
|---|---|---|
| Resting potential (mV) | −46.2±1.6 | −47.5±1.7 |
| Delay to first spike (ms) | 8.9±1.2 | 9.1±1.4 |
| Spike threshold (mV) | −38.3±1.2 | −40.6±1.6 |
| Spike amplitude (mV) | 70.3±6.4 | 73.9±7.2 |
| Spike width at half amplitude (ms) | 1.19±0.11 | 1.15±0.09 |
| Accommodation ratio | 2.61±0.34 | 2.27±0.23 |
| Mossy fiber-associated cell | Wildtype (n=7 cells/7 mice) | Mecp2-/y (n=6 cells/5 mice) |
|---|---|---|
| Resting potential (mV) | −44.7±0.9 | −46.3±0.8 |
| Delay to first spike (ms) | 7.8±1.1 | 6.7±0.6 |
| Spike threshold (mV) | −38.8±1.5 | −40.7±1.1 |
| Spike amplitude (mV) | 59.3±5.5 | 65.1±3.4 |
| Spike width at half amplitude (ms) | 1.42±0.11 | 1.43±0.19 |
| Accommodation ratio | 2.41±0.19 | 2.72±0.11 |
Data was analyzed with Mann Whitney test (p>0.05).
Figure 5. Intrinsic and synaptic properties of CA3 fast-spiking basket interneurons.

A. Representative subthreshold voltage responses in CA3 fast-spiking basket cells of wildtype (left) and Mecp2-/y mice (right). Current injections from −100 to 60pA in 20pA increments. B. I-O relationship between current intensity and subthreshold voltage responses. No significant differences were observed between wildtype (n=24 cells/14 mice) and Mecp2-/y interneurons (n=29 cells/20 mice). C,D. The amplitudes of the fAHP (C) and sAHP (D) were similar between two genotypes. E. Representative firing responses of fast-spiking basket cells from wildtype (left) and Mecp2-/y mice (right) evoked by 80pA (top) and 200pA (bottom) current injections. F. I-O relationship between current intensity and the number of action potentials. Two-way repeated ANOVA analysis shows significant differences between two genotypes (p=0.003); post hoc comparisons indicate tendency to significance for fewer spikes in Mecp2-/y mice for the low current injection groups (60pA, p=0.068; 80pA, p=0.079; 100pA, p=0.078). G. Representative example of a wildtype fast-spiking basket cell filled with biocytin, stained with Alexa-488-conjugated streptavidin, and imaged by confocal microscopy; scale bar=100μm. H. Representative examples of spontaneous firing recorded in CA3 fast-spiking basket cells. I. Cumulative probability distribution of spontaneous firing in Mecp2 knockout interneurons was shifted towards the right (wildtype n=14 cells/8 mice, Mecp2-/y n=23 cells/11 mice; K-S test p<0.001). J. Representative examples of mEPSCs in CA3 fast-spiking basket cells of wildtype (top) and Mecp2-/y mice (bottom). K,L. Cumulative probability distribution of mEPSC amplitude (K) in Mecp2 knockout interneurons was shifted towards the left (wildtype n=7 cells/6 mice, Mecp2-/y n=13 cells/8 mice; K-S test p<0.001), and that of mEPSC inter-event intervals (L) towards the right (K-S test p<0.001).
The consequences of MeCP2 dysfunction on neuronal network function, as well as on synaptic function and plasticity vary in different brain regions ought to specific time courses and sequences of excitatory and inhibitory synapse formation in each area (Shepherd and Katz, 2011, Kron et al., 2012). For example, principal neurons in slices from somatosensory cortex or thalamus from Mecp2 knockout mice have reduced neuronal activity caused by a selective impairment in excitatory synaptic transmission, as well as by hypo-connectivity between excitatory neurons (Dani et al., 2005, Dani and Nelson, 2009, Noutel et al., 2011; but see Nelson et al., 2011, Zhang et al., 2014). Intriguingly, the visual cortex of Mecp2 knockout mice shows a similar reduction of pyramidal neuron and network activity, but due to stronger inhibition from a hyper-innervation by parvalbumin-expressing interneurons (Durand et al., 2012). In addition, a recent report demonstrated that deletion of Mecp2 specifically in excitatory neurons caused impaired GABAergic transmission onto cortical pyramidal neurons, which led to seizures and cortical hyperexcitation (Zhang et al., 2014). On the other hand, neuronal activity in other brain regions of Mecp2 knockout mice is elevated, such as the hippocampus (Zhang et al., 2008, Calfa et al., 2011a) and brainstem (Kline et al., 2010). Consistent with our results and those in mice with selective Mecp2 deletion in excitatory neurons (Zhang et al., 2014), impaired GABAergic inhibition was also described in the thalamus (Zhang et al., 2010) and brainstem (Medrihan et al., 2008), and it involved a reduction in the number of GABAergic synapses onto principal neurons. Indeed, selective deletion of Mecp2 in GABAergic neurons led to impaired GABAergic transmission, cortical hyperexcitability and several neurological features of RTT and autism spectrum disorders (Chao et al., 2010).
An unbalance of the excitation-to-inhibition ratio has emerged as common feature in several neurodevelopmental disorders, including autism-spectrum disorders, Tourette syndrome and Down syndrome (Rubenstein and Merzenich, 2003, Di Cristo, 2007). Of relevance to the intellectual disability associated to RTT, the cognitive deficits observed in mouse models of Down syndrome (Ts65Dn) (Kleschevnikov et al., 2004), neurofibromatosis (Costa et al., 2002, Li et al., 2005) and Fragile X (Gibson et al., 2008) are caused by an excitatory/inhibitory imbalance of synaptic function in the hippocampus. Intriguingly, these impairments can be reverted by pharmacological manipulations in adult symptomatic animals (Costa et al., 2002, Li et al., 2005, Fernandez et al., 2007, Rueda et al., 2008); reviewed by (Ehninger et al., 2008).
Since MeCP2 controls BDNF expression (reviewed by Li and Pozzo-Miller, 2014), and BDNF modulates the development of GABAergic neurons and synapses (reviewed by Vicario-Abejon et al., 2002), all the above observations suggest that impaired BDNF signaling in Mecp2-deficient brains is unable to support proper GABAergic synapse formation. In fact, deletion of BDNF in individual cells results in reduced GABAergic innervation on each neuron lacking BDNF (Kohara et al., 2007). Notably, increasing BDNF levels or its TrkB-mediated signaling improves neurological symptoms in Mecp2 deficient mice (Chang et al., 2006, Ogier et al., 2007, Kline et al., 2010, Schmid et al., 2012). Taken together, these results indicate that the balance of synaptic inhibition is weakened in area CA3, a situation that favors runaway excitation of the highly interconnected network of CA3 pyramidal neurons and possibly leads to hippocampal hyperactivity and limbic seizures in Mecp2-/y mice and RTT individuals.
Supplementary Material
S1. Intrinsic properties of CA3 pyramidal neurons
A, Representative spiking responses of CA3 pyramidal neurons from wildtype (top) and Mecp2-/y mice (bottom) evoked by a 100pA current injection (in APV, CNQX, picrotoxin). B, relationship between firing frequency and injected current (F-I curve). The fitted slopes (m) of the linear portion of the F-I curve were similar in wildtype and Mecp2-/y mice. C,D, the amplitudes of the fast afterhyperpolarization (fAHP, C), and the slow AHP (sAHP, D) were similar in both genotypes.
S2. Intrinsic membrane properties of 4 different types of interneurons in area CA3
A, fast-spiking basket cell. B, regular-spiking basket cell. C, spiny lucidum cell. D, mossy fiber-associated cell.
S3. CA3 regular-spiking basket cells
A. Representative subthreshold voltage responses in CA3 regular-spiking basket cells of wildtype (left) and Mecp2-/y mice (right). B. I-O relationship between current intensity and subthreshold voltage responses. Significant differences were found between wildtype (n=9 cells/6 mice) and Mecp2-/y interneurons (n=6 cells/5 mice) in −100, −80, −60 pA current injection groups (P<0.05, t test). C,D. The amplitudes of the fAHP (C) and sAHP (D) were similar between two genotypes. E. Representative firing responses of fast-spiking basket cells from wildtype (left) and Mecp2-/y mice (right) evoked by 80pA (top) and 200pA (bottom) current injections. F. I-O relationship between current intensity and the number of action potentials. Mecp2-/y mice have more number of action potential at 200 pA current injection.
S4. CA3 spiny lucidum cells
A. Representative subthreshold voltage responses in CA3 spiny lucidum cells of wildtype (left) and Mecp2-/y mice (right). B. I-O relationship between current intensity and subthreshold voltage responses. Significant differences were found between wildtype (n=11 cells/8 mice) and Mecp2-/y interneurons (n=7 cells/5 mice) in lower and higher current injection groups (P<0.05, t test). C,D. The amplitudes of the fAHP (C) and sAHP (D) were similar between two genotypes. E. Representative firing responses of spiny lucidum cells from wildtype (left) and Mecp2-/y mice (right) evoked by 80pA (top) and 200pA (bottom) current injections. F. I-O relationship between current intensity and the number of action potentials. Significant differences were found in 60 pA current injection.
S5. CA3 mossy fiber-associated cells
A. Representative subthreshold voltage responses in CA3 mossy fiber-associated cells of wildtype (left) and Mecp2-/y mice (right). B. I-O relationship between current intensity and subthreshold voltage responses. Significant differences were found between wildtype (n=9 cells/8 mice) and Mecp2-/y interneurons (n=6 cells/5 mice) in lower current injection groups (P<0.05, t test). C,D. The amplitudes of the fAHP (C) and sAHP (D) were similar between two genotypes. E. Representative firing responses of mossy fiber-associated cells from wildtype (left) and Mecp2-/y mice (right) evoked by 80pA (top) and 200pA (bottom) current injections. F. I-O relationship between current intensity and the number of action potentials. Significant differences were found at 60, 80, 100pA current injection groups.
Acknowledgments
This work was supported by NIH grants NS-065027 and NS-40593 (to LP-M), and IRSF Postdoctoral Fellowships IRSF0804 (to GC) and IRSF2824 (to WL). We thank Ms. Lili Mao for mouse colony management, Dr. Xin Xu for comments on the manuscript, and Dr. Takafumi Inoue (Waseda University, Tokyo, Japan) for data acquisition and analysis software. We are thankful for pilot immunohistochemistry imaging of presynaptic puncta performed by Dr. Jennifer Larimore (Agnes Scott College, Decatur, GA). The Alabama Neuroscience Blueprint Core Center (NS-57098), the UAB Intellectual and Developmental Disabilities Research Center (HD-38985), and the UAB Neuroscience Core (NS-47466) provided instrumentation.
Footnotes
The authors do not have competing financial interests
References
- Amir RE, Van den Veyver IB, Wan M, Tran CQ, Francke U, Zoghbi HY. Rett syndrome is caused by mutations in X-linked MECP2, encoding methyl-CpG-binding protein 2. Nat Genet. 1999;23:185–8. doi: 10.1038/13810. [DOI] [PubMed] [Google Scholar]
- Calfa G, Hablitz JJ, Pozzo-Miller L. Network hyperexcitability in hippocampal slices from Mecp2 mutant mice revealed by voltage-sensitive dye imaging. J Neurophysiol. 2011a;105:1768–84. doi: 10.1152/jn.00800.2010. [DOI] [PMC free article] [PubMed] [Google Scholar]
- Calfa G, Percy AK, Pozzo-Miller L. Experimental models of Rett syndrome based on Mecp2 dysfunction. Exp Biol Med (Maywood) 2011b;236:3–19. doi: 10.1258/ebm.2010.010261. [DOI] [PMC free article] [PubMed] [Google Scholar]
- Cardoza B, Clarke A, Wilcox J, Gibbon F, Smith PE, Archer H, Hryniewiecka-Jaworska A, Kerr M. Epilepsy in Rett syndrome: association between phenotype and genotype, and implications for practice. Seizure. 2011;20:646–9. doi: 10.1016/j.seizure.2011.06.010. [DOI] [PubMed] [Google Scholar]
- Chang Q, Khare G, Dani V, Nelson S, Jaenisch R. The disease progression of Mecp2 mutant mice is affected by the level of BDNF expression. Neuron. 2006;49:341–8. doi: 10.1016/j.neuron.2005.12.027. [DOI] [PubMed] [Google Scholar]
- Chao HT, Chen H, Samaco RC, Xue M, Chahrour M, Yoo J, Neul JL, Gong S, Lu HC, Heintz N, Ekker M, Rubenstein JL, Noebels JL, Rosenmund C, Zoghbi HY. Dysfunction in GABA signalling mediates autism-like stereotypies and Rett syndrome phenotypes. Nature. 2010;468:263–9. doi: 10.1038/nature09582. [DOI] [PMC free article] [PubMed] [Google Scholar]
- Chao HT, Zoghbi HY, Rosenmund C. MeCP2 controls excitatory synaptic strength by regulating glutamatergic synapse number. Neuron. 2007;56:58–65. doi: 10.1016/j.neuron.2007.08.018. [DOI] [PMC free article] [PubMed] [Google Scholar]
- Chen RZ, Akbarian S, Tudor M, Jaenisch R. Deficiency of methyl-CpG binding protein-2 in CNS neurons results in a Rett-like phenotype in mice. Nat Genet. 2001;27:327–31. doi: 10.1038/85906. [DOI] [PubMed] [Google Scholar]
- Costa RM, Federov NB, Kogan JH, Murphy GG, Stern J, Ohno M, Kucherlapati R, Jacks T, Silva AJ. Mechanism for the learning deficits in a mouse model of neurofibromatosis type 1. Nature. 2002;415:526–30. doi: 10.1038/nature711. [DOI] [PubMed] [Google Scholar]
- D’Cruz JA, Wu C, Zahid T, El-Hayek Y, Zhang L, Eubanks JH. Alterations of cortical and hippocampal EEG activity in MeCP2-deficient mice. Neurobiol Dis. 2010;38:8–16. doi: 10.1016/j.nbd.2009.12.018. [DOI] [PubMed] [Google Scholar]
- Dani VS, Chang Q, Maffei A, Turrigiano GG, Jaenisch R, Nelson SB. Reduced cortical activity due to a shift in the balance between excitation and inhibition in a mouse model of Rett syndrome. Proc Natl Acad Sci U S A. 2005;102:12560–5. doi: 10.1073/pnas.0506071102. [DOI] [PMC free article] [PubMed] [Google Scholar]
- Dani VS, Nelson SB. Intact long-term potentiation but reduced connectivity between neocortical layer 5 pyramidal neurons in a mouse model of Rett syndrome. J Neurosci. 2009;29:11263–70. doi: 10.1523/JNEUROSCI.1019-09.2009. [DOI] [PMC free article] [PubMed] [Google Scholar]
- Di Cristo G. Development of cortical GABAergic circuits and its implications for neurodevelopmental disorders. Clin Genet. 2007;72:1–8. doi: 10.1111/j.1399-0004.2007.00822.x. [DOI] [PubMed] [Google Scholar]
- Durand S, Patrizi A, Quast KB, Hachigian L, Pavlyuk R, Saxena A, Carninci P, Hensch TK, Fagiolini M. NMDA receptor regulation prevents regression of visual cortical function in the absence of Mecp2. Neuron. 2012;76:1078–90. doi: 10.1016/j.neuron.2012.12.004. [DOI] [PMC free article] [PubMed] [Google Scholar]
- Ehninger D, Li W, Fox K, Stryker MP, Silva AJ. Reversing neurodevelopmental disorders in adults. Neuron. 2008;60:950–60. doi: 10.1016/j.neuron.2008.12.007. [DOI] [PMC free article] [PubMed] [Google Scholar]
- Fernandez F, Morishita W, Zuniga E, Nguyen J, Blank M, Malenka RC, Garner CC. Pharmacotherapy for cognitive impairment in a mouse model of Down syndrome. Nat Neurosci. 2007;10:411–3. doi: 10.1038/nn1860. [DOI] [PubMed] [Google Scholar]
- Frola E, Patrizi A, Goetz T, Medrihan L, Petrini EM, Barberis A, Wulff P, Wisden W, Sassoe-Pognetto M. Synaptic competition sculpts the development of GABAergic axo-dendritic but not perisomatic synapses. PLoS One. 2013;8:e56311. doi: 10.1371/journal.pone.0056311. [DOI] [PMC free article] [PubMed] [Google Scholar]
- Gibson JR, Bartley AF, Hays SA, Huber KM. Imbalance of neocortical excitation and inhibition and altered UP states reflect network hyperexcitability in the mouse model of fragile X syndrome. J Neurophysiol. 2008;100:2615–26. doi: 10.1152/jn.90752.2008. [DOI] [PMC free article] [PubMed] [Google Scholar]
- Glaze DG, Frost JD, Jr, Zoghbi HY, Percy AK. Rett’s syndrome. Correlation of electroencephalographic characteristics with clinical staging. Arch Neurol. 1987;44:1053–6. doi: 10.1001/archneur.1987.00520220051016. [DOI] [PubMed] [Google Scholar]
- Hortnagl H, Tasan RO, Wieselthaler A, Kirchmair E, Sieghart W, Sperk G. Patterns of mRNA and protein expression for 12 GABAA receptor subunits in the mouse brain. Neuroscience. 2013;236:345–72. doi: 10.1016/j.neuroscience.2013.01.008. [DOI] [PMC free article] [PubMed] [Google Scholar]
- Kleschevnikov AM, Belichenko PV, Villar AJ, Epstein CJ, Malenka RC, Mobley WC. Hippocampal long-term potentiation suppressed by increased inhibition in the Ts65Dn mouse, a genetic model of Down syndrome. J Neurosci. 2004;24:8153–60. doi: 10.1523/JNEUROSCI.1766-04.2004. [DOI] [PMC free article] [PubMed] [Google Scholar]
- Kline DD, Ogier M, Kunze DL, Katz DM. Exogenous brain-derived neurotrophic factor rescues synaptic dysfunction in Mecp2-null mice. J Neurosci. 2010;30:5303–10. doi: 10.1523/JNEUROSCI.5503-09.2010. [DOI] [PMC free article] [PubMed] [Google Scholar]
- Kohara K, Yasuda H, Huang Y, Adachi N, Sohya K, Tsumoto T. A local reduction in cortical GABAergic synapses after a loss of endogenous brain-derived neurotrophic factor, as revealed by single-cell gene knock-out method. J Neurosci. 2007;27:7234–44. doi: 10.1523/JNEUROSCI.1943-07.2007. [DOI] [PMC free article] [PubMed] [Google Scholar]
- Kron M, Howell CJ, Adams IT, Ransbottom M, Christian D, Ogier M, Katz DM. Brain activity mapping in Mecp2 mutant mice reveals functional deficits in forebrain circuits, including key nodes in the default mode network, that are reversed with ketamine treatment. J Neurosci. 2012;32:13860–72. doi: 10.1523/JNEUROSCI.2159-12.2012. [DOI] [PMC free article] [PubMed] [Google Scholar]
- Lawrence JJ, McBain CJ. Interneuron diversity series: containing the detonation--feedforward inhibition in the CA3 hippocampus. Trends Neurosci. 2003;26:631–40. doi: 10.1016/j.tins.2003.09.007. [DOI] [PubMed] [Google Scholar]
- Li W, Cui Y, Kushner SA, Brown RA, Jentsch JD, Frankland PW, Cannon TD, Silva AJ. The HMG-CoA reductase inhibitor lovastatin reverses the learning and attention deficits in a mouse model of neurofibromatosis type 1. Curr Biol. 2005;15:1961–7. doi: 10.1016/j.cub.2005.09.043. [DOI] [PubMed] [Google Scholar]
- Li W, Pozzo-Miller L. BDNF deregulation in Rett syndrome. Neuropharmacology. 2014;76(Pt C):737–46. doi: 10.1016/j.neuropharm.2013.03.024. [DOI] [PMC free article] [PubMed] [Google Scholar]
- Medrihan L, Tantalaki E, Aramuni G, Sargsyan V, Dudanova I, Missler M, Zhang W. Early defects of GABAergic synapses in the brain stem of a MeCP2 mouse model of Rett syndrome. J Neurophysiol. 2008;99:112–21. doi: 10.1152/jn.00826.2007. [DOI] [PubMed] [Google Scholar]
- Nelson ED, Bal M, Kavalali ET, Monteggia LM. Selective impact of MeCP2 and associated histone deacetylases on the dynamics of evoked excitatory neurotransmission. J Neurophysiol. 2011;106:193–201. doi: 10.1152/jn.00751.2010. [DOI] [PMC free article] [PubMed] [Google Scholar]
- Nelson ED, Kavalali ET, Monteggia LM. MeCP2-dependent transcriptional repression regulates excitatory neurotransmission. Curr Biol. 2006;16:710–6. doi: 10.1016/j.cub.2006.02.062. [DOI] [PubMed] [Google Scholar]
- Nissenkorn A, Gak E, Vecsler M, Reznik H, Menascu S, Ben Zeev B. Epilepsy in Rett syndrome---the experience of a National Rett Center. Epilepsia. 2010;51:1252–8. doi: 10.1111/j.1528-1167.2010.02597.x. [DOI] [PubMed] [Google Scholar]
- Noutel J, Hong YK, Leu B, Kang E, Chen C. Experience-dependent retinogeniculate synapse remodeling is abnormal in MeCP2-deficient mice. Neuron. 2011;70:35–42. doi: 10.1016/j.neuron.2011.03.001. [DOI] [PMC free article] [PubMed] [Google Scholar]
- Ogier M, Wang H, Hong E, Wang Q, Greenberg ME, Katz DM. Brain-derived neurotrophic factor expression and respiratory function improve after ampakine treatment in a mouse model of Rett syndrome. J Neurosci. 2007;27:10912–7. doi: 10.1523/JNEUROSCI.1869-07.2007. [DOI] [PMC free article] [PubMed] [Google Scholar]
- Pelka GJ, Watson CM, Radziewic T, Hayward M, Lahooti H, Christodoulou J, Tam PP. Mecp2 deficiency is associated with learning and cognitive deficits and altered gene activity in the hippocampal region of mice. Brain. 2006;129:887–98. doi: 10.1093/brain/awl022. [DOI] [PubMed] [Google Scholar]
- Pintaudi M, Calevo MG, Vignoli A, Parodi E, Aiello F, Baglietto MG, Hayek Y, Buoni S, Renieri A, Russo S, Cogliati F, Giordano L, Canevini M, Veneselli E. Epilepsy in Rett syndrome: clinical and genetic features. Epilepsy Behav. 2010;19:296–300. doi: 10.1016/j.yebeh.2010.06.051. [DOI] [PubMed] [Google Scholar]
- Preibisch S, Saalfeld S, Tomancak P. Globally optimal stitching of tiled 3D microscopic image acquisitions. Bioinformatics. 2009;25:1463–5. doi: 10.1093/bioinformatics/btp184. [DOI] [PMC free article] [PubMed] [Google Scholar]
- Rubenstein JL, Merzenich MM. Model of autism: increased ratio of excitation/inhibition in key neural systems. Genes Brain Behav. 2003;2:255–67. doi: 10.1034/j.1601-183x.2003.00037.x. [DOI] [PMC free article] [PubMed] [Google Scholar]
- Rueda N, Florez J, Martinez-Cue C. Chronic pentylenetetrazole but not donepezil treatment rescues spatial cognition in Ts65Dn mice, a model for Down syndrome. Neurosci Lett. 2008;433:22–7. doi: 10.1016/j.neulet.2007.12.039. [DOI] [PubMed] [Google Scholar]
- Schmid DA, Yang T, Ogier M, Adams I, Mirakhur Y, Wang Q, Massa SM, Longo FM, Katz DM. A TrkB small molecule partial agonist rescues TrkB phosphorylation deficits and improves respiratory function in a mouse model of Rett syndrome. J Neurosci. 2012;32:1803–10. doi: 10.1523/JNEUROSCI.0865-11.2012. [DOI] [PMC free article] [PubMed] [Google Scholar]
- Shahbazian M, Young J, Yuva-Paylor L, Spencer C, Antalffy B, Noebels J, Armstrong D, Paylor R, Zoghbi H. Mice with truncated MeCP2 recapitulate many Rett syndrome features and display hyperacetylation of histone H3. Neuron. 2002;35:243–54. doi: 10.1016/s0896-6273(02)00768-7. [DOI] [PubMed] [Google Scholar]
- Shepherd GM, Katz DM. Synaptic microcircuit dysfunction in genetic models of neurodevelopmental disorders: focus on Mecp2 and Met. Curr Opin Neurobiol. 2011;21:827–33. doi: 10.1016/j.conb.2011.06.006. [DOI] [PMC free article] [PubMed] [Google Scholar]
- Steffenburg U, Hagberg G, Hagberg B. Epilepsy in a representative series of Rett syndrome. Acta Paediatr. 2001;90:34–9. doi: 10.1080/080352501750064842. [DOI] [PubMed] [Google Scholar]
- Szabadics J, Soltesz I. Functional specificity of mossy fiber innervation of GABAergic cells in the hippocampus. J Neurosci. 2009;29:4239–51. doi: 10.1523/JNEUROSCI.5390-08.2009. [DOI] [PMC free article] [PubMed] [Google Scholar]
- Vicario-Abejon C, Owens D, McKay R, Segal M. Role of neurotrophins in central synapse formation and stabilization. Nat Rev Neurosci. 2002;3:965–74. doi: 10.1038/nrn988. [DOI] [PubMed] [Google Scholar]
- Zhang L, He J, Jugloff DG, Eubanks JH. The MeCP2-null mouse hippocampus displays altered basal inhibitory rhythms and is prone to hyperexcitability. Hippocampus. 2008;18:294–309. doi: 10.1002/hipo.20389. [DOI] [PubMed] [Google Scholar]
- Zhang W, Peterson M, Beyer B, Frankel WN, Zhang ZW. Loss of MeCP2 From Forebrain Excitatory Neurons Leads to Cortical Hyperexcitation and Seizures. J Neurosci. 2014;34:2754–63. doi: 10.1523/JNEUROSCI.4900-12.2014. [DOI] [PMC free article] [PubMed] [Google Scholar]
- Zhang ZW, Zak JD, Liu H. MeCP2 is required for normal development of GABAergic circuits in the thalamus. J Neurophysiol. 2010;103:2470–81. doi: 10.1152/jn.00601.2009. [DOI] [PMC free article] [PubMed] [Google Scholar]
Associated Data
This section collects any data citations, data availability statements, or supplementary materials included in this article.
Supplementary Materials
S1. Intrinsic properties of CA3 pyramidal neurons
A, Representative spiking responses of CA3 pyramidal neurons from wildtype (top) and Mecp2-/y mice (bottom) evoked by a 100pA current injection (in APV, CNQX, picrotoxin). B, relationship between firing frequency and injected current (F-I curve). The fitted slopes (m) of the linear portion of the F-I curve were similar in wildtype and Mecp2-/y mice. C,D, the amplitudes of the fast afterhyperpolarization (fAHP, C), and the slow AHP (sAHP, D) were similar in both genotypes.
S2. Intrinsic membrane properties of 4 different types of interneurons in area CA3
A, fast-spiking basket cell. B, regular-spiking basket cell. C, spiny lucidum cell. D, mossy fiber-associated cell.
S3. CA3 regular-spiking basket cells
A. Representative subthreshold voltage responses in CA3 regular-spiking basket cells of wildtype (left) and Mecp2-/y mice (right). B. I-O relationship between current intensity and subthreshold voltage responses. Significant differences were found between wildtype (n=9 cells/6 mice) and Mecp2-/y interneurons (n=6 cells/5 mice) in −100, −80, −60 pA current injection groups (P<0.05, t test). C,D. The amplitudes of the fAHP (C) and sAHP (D) were similar between two genotypes. E. Representative firing responses of fast-spiking basket cells from wildtype (left) and Mecp2-/y mice (right) evoked by 80pA (top) and 200pA (bottom) current injections. F. I-O relationship between current intensity and the number of action potentials. Mecp2-/y mice have more number of action potential at 200 pA current injection.
S4. CA3 spiny lucidum cells
A. Representative subthreshold voltage responses in CA3 spiny lucidum cells of wildtype (left) and Mecp2-/y mice (right). B. I-O relationship between current intensity and subthreshold voltage responses. Significant differences were found between wildtype (n=11 cells/8 mice) and Mecp2-/y interneurons (n=7 cells/5 mice) in lower and higher current injection groups (P<0.05, t test). C,D. The amplitudes of the fAHP (C) and sAHP (D) were similar between two genotypes. E. Representative firing responses of spiny lucidum cells from wildtype (left) and Mecp2-/y mice (right) evoked by 80pA (top) and 200pA (bottom) current injections. F. I-O relationship between current intensity and the number of action potentials. Significant differences were found in 60 pA current injection.
S5. CA3 mossy fiber-associated cells
A. Representative subthreshold voltage responses in CA3 mossy fiber-associated cells of wildtype (left) and Mecp2-/y mice (right). B. I-O relationship between current intensity and subthreshold voltage responses. Significant differences were found between wildtype (n=9 cells/8 mice) and Mecp2-/y interneurons (n=6 cells/5 mice) in lower current injection groups (P<0.05, t test). C,D. The amplitudes of the fAHP (C) and sAHP (D) were similar between two genotypes. E. Representative firing responses of mossy fiber-associated cells from wildtype (left) and Mecp2-/y mice (right) evoked by 80pA (top) and 200pA (bottom) current injections. F. I-O relationship between current intensity and the number of action potentials. Significant differences were found at 60, 80, 100pA current injection groups.