Abstract
The cerebellum is essential in motor learning. At the cellular level, changes occur in both the simple spike and complex spike firing of Purkinje cells. Because simple spike discharge reflects the main output of the cerebellar cortex, changes in simple spike firing likely reflect the contribution of the cerebellum to the adapted behavior. Therefore, we investigated in Rhesus monkeys how the representation of arm kinematics in Purkinje cell simple spike discharge changed during adaptation to mechanical perturbations of reach movements. Monkeys rapidly adapted to a novel assistive or resistive perturbation along the direction of the reach. Adaptation consisted of matching the amplitude and timing of the perturbation to minimize its effect on the reach. In a majority of Purkinje cells, simple spike firing recorded before and during adaptation demonstrated significant changes in position, velocity, and acceleration sensitivity. The timing of the simple spike representations change within individual cells, including shifts in predictive versus feedback signals. At the population level, feedback-based encoding of position increases early in learning and velocity decreases. Both timing changes reverse later in learning. The complex spike discharge was only weakly modulated by the perturbations, demonstrating that the changes in simple spike firing can be independent of climbing fiber input. In summary, we observed extensive alterations in individual Purkinje cell encoding of reach kinematics, although the movements were nearly identical in the baseline and adapted states. Therefore, adaption to mechanical perturbation of a reaching movement is accompanied by widespread modifications in the simple spike encoding.
Keywords: cerebellar cortex, complex spike, kinematic signals, motor adaptation, Purkinje cells, simple spike
Introduction
The cerebellum is crucial for motor learning. In humans, cerebellum activation occurs and is retained during adaptation to novel visuomotor transformations and force fields (Shadmehr and Holcomb, 1997; Imamizu et al., 2000; Kawato et al., 2003; Krakauer et al., 2004). Cerebellar pathology disrupts learning during eye movements (Takagi et al., 2000; Golla et al., 2008; Xu-Wilson et al., 2009) and hinders adaptation to predictable perturbations of limb movements (Müller and Dichgans, 1994; Maschke et al., 2004; Nowak et al., 2004; Smith and Shadmehr, 2005; Morton and Bastian, 2006). Numerous animal studies document cerebellar-dependent learning for different motor behaviors and effectors (for review, see Ito, 2001; Prsa and Thier, 2011; Gao et al., 2012).
We have a limited understanding of how movement parameters encoded in the cerebellar cortex change with learning. The low-frequency complex spikes are poor candidates to encode changes in signaling. Individual spikelets of a complex spike propagate poorly down Purkinje cell axons and are converted into only one to two conventional spikes in the cerebellar nuclei (Khaliq and Raman, 2005; Monsivais et al., 2005). Instead, complex spikes are thought to be involved in signaling errors and the induction of synaptic plasticity (for review, see Ito, 2001; Jörntell and Hansel, 2006; Gao et al., 2012). Conversely, the high-frequency simple spikes are likely to encode the essential learned signals. Alterations in simple spike firing during learning are observed across many behaviors and cerebellar cortical regions (Gilbert and Thach, 1977; Meyer-Lohmann et al., 1977; Lisberger and Fuchs, 1978; Ojakangas and Ebner, 1992; Jirenhed et al., 2007; Catz et al., 2008; Medina and Lisberger, 2008), but studies quantifying changes in the encoding of movement parameters are limited. During smooth pursuit adaptation, simple spike encoding of eye velocity and acceleration demonstrates progressive changes in the floccular complex (Medina and Lisberger, 2009). In the occulomotor vermis, increases in smooth pursuit gain involve increases in velocity coding in the summed Purkinje cell simple spike activity (Prsa and Thier, 2011; Dash et al., 2013).
In addition to sensitivity, time-dependent movements likely require changes in the temporal encoding of movement parameters. For example, eyeblink conditioning alters simple spike timing that is hypothesized to underlie components of the conditioned response (Koekkoek et al., 2003; Jirenhed et al., 2007). In a task requiring precise changes in saccade duration, population models of the simple spike show that saccade duration (i.e., learning) is encoded by shifts toward bursts of activity from early-firing versus later-firing Purkinje cells (Catz et al., 2008; Prsa and Thier, 2011). Therefore, changes in encoding timing also likely contribute to adaptation.
Changes in Purkinje cell simple spike encoding of movement parameters during arm movements has not been evaluated. Therefore, we recorded Purkinje cells as Rhesus monkeys adapted to either assistive or resistive mechanical perturbations during reaching. Learning was characterized by precise adaptation of the movement kinematics that minimized the effects of perturbation. Although baseline and postadaptation reach kinematics were nearly identical, the sensitivity and timing of the simple spike kinematic representations changed extensively within and across cells. These alterations in simple spike firing occurred although the perturbations evoked limited complex spike modulation.
Materials and Methods
All animal experimentation was approved by the Institutional Animal Care and Use Committee of the University of Minnesota and conducted in accordance with the guidelines of the National Institutes of Health.
Behavioral paradigm.
Two monkeys (Monkey N, female, 6.5 kg; Monkey I, male, 7.6 kg) were trained to use a two-joint robotic manipulandum in the horizontal plane (InMotion2; Interactive Motion) to control a 0.5 × 0.5 cm black “+” style cursor on a vertical video screen mounted at eye level 50 cm in front of the animal. The gain was set to unity so that 1 cm of hand movement resulted in 1 cm of cursor movement.
All tasks required fast (≤750 ms) reaching movements between two 1.5-cm-diameter, circular targets spaced 10 cm apart (Fig. 1). We elected to use this design as opposed to a center-out reach task to increase the distance requirement, effectively allowing more options for positioning the perturbations. Also, requiring the monkey to move across the entire workspace maximized position variability and peak velocity, two variables that strongly modulate Purkinje cell simple spike firing (Roitman et al., 2005; Pasalar et al., 2006; Hewitt et al., 2011). As described below, perturbation parameters were changed each day. Each trial began with the appearance of a yellow start target that required cursor placement within the target for a randomized initial hold period (0.75–1 s). Trials ended with a 1.25 s final hold period in the end target. Monkeys were allowed 750 ms to intercept the end target and 200 ms time outside the targets to accommodate overshooting or straying beyond target borders during the hold periods. Animals received a juice reward on successful trials.
Figure 1.
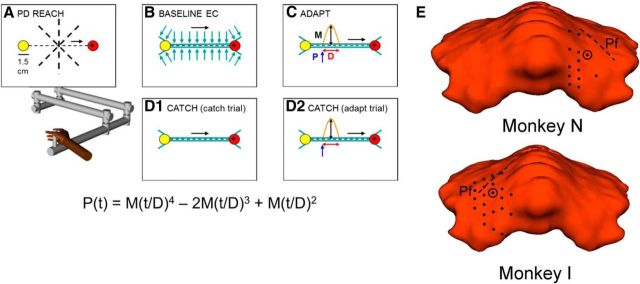
Perturbation task. Rhesus monkeys used a robotic manipulandum to control a “+” style cursor and make four types of very fast reaching movements between a yellow start and red end cue target displayed on a computer monitor. A, PD REACH epoch: Movements made across eight directions with no robot forces identified the PD of a Purkinje cell. All subsequent reaching movements during a recording session were along this direction. B, BASELINE EC epoch: Error clamp (EC) trials used robot-generated virtual walls (blue arrows) to restrict perpendicular movement to an hourglass-shaped area (blue). C, ADAPT epoch: The equation below describes a predictable, bell-shaped perturbation force [P(t), orange] that either assisted or resisted movements inside the EC. Colored arrows illustrate perturbation components that were randomized between recording sessions: black, magnitude (M); red, duration (D); blue, start position (P). D, CATCH epoch: The same adapt parameters were repeated (D2) with the addition of randomly occurring catch trials (D1). Catch trial parameters matched baseline EC. In all panels, black dashed lines illustrate actual channel width and black arrows movement direction. E, Locations of microelectrode entry into the cerebellar cortex based on modeling using MRI and CT imaging. Shown are locations at which Purkinje cells with significant learning-related modulation were recorded. Dashed line is the location of the primary fissure (Pf).
A complete recording session included four different reaching tasks completed in block manner (referred to as epochs). The first “PD reach” (in which PD is preferred direction) epoch of trials (Fig. 1A) evaluated the firing discharge of the cell across all eight possible reach directions (0–315°, spaced 45° apart) with no active robot forces. These trials were used to estimate the PD of the cell, and all subsequent trials were performed along this trajectory. The second “baseline error clamp” epoch (Fig. 1B) recorded baseline cell firing in an error clamp (Scheidt et al., 2000). The error clamp consisted of robot-generated virtual walls that required the animal to move along a highly defined channel toward the target, minimizing kinematic errors perpendicular to the channel that might mask learning effects and produce large error signals in the simple spike firing (Popa et al., 2012). The error-clamp channel also included a “funnel” at the start target to direct the hand into the 1.0-mm-diameter channel. A second inverted funnel at the end target position smoothly transitioned movements from the channel to the full 1.5 cm diameter of the end target. Error-clamp wall forces scaled for the monkeys included an elastic spring force (−1000 N/m) and viscous damping (Vx: −30 N × s/m; Vy: −5 N × s/m). Use of these wall forces were well tolerated by the monkeys and clamped mean maximum perpendicular hand deviation to ±0.33 cm from a straight line between the start target and the end target for all error-clamp trials.
The third “adapt” epoch introduced a force perturbation along the monkey's movement path to investigate how Purkinje cells adapt to external environmental changes. The perturbation occurred within the error clamp, parallel to the direction of movement (Fig. 1C). The bell-shaped perturbation (Wagner and Smith, 2008) was defined as follows:
Time (t) and the subsequent perturbation force P(t) began once hand position passed a predetermined start position, making the perturbation both position and time dependent. Perturbation parameters were randomized between recording sessions to induce “new” learning each day. Varying start position (20, 35, or 50% of 10 cm path), magnitude M (± 6, 7, 8, 9, or 10 N), and duration D (100, 150, or 200 ms) provided 90 unique perturbation combinations. Positive magnitudes resulted in assistive perturbations that pushed the hand toward, and often beyond, the end target. In contrast, negative resistive perturbations opposed movement toward the end target. The fourth “catch” epoch continued adaptation to the perturbation (Fig. 1D1) but also included catch trials (randomized at 10–15%; Fig. 1D2), during which the perturbation was unexpectedly absent. All attempted catch trials were rewarded, regardless of whether the monkey successfully reached the end target. For each recording session, a monkey typically executed 80 PD reach (∼10 each direction), 40 baseline error-clamp, 110 adapt, and 110 catch (of which 11–17 were randomized true catch trials) trials.
Surgical procedures.
Head-restraint hardware, including a circular stainless steel halo attached to the skull with four stainless steel posts and screws, was placed on each monkey using aseptic surgical techniques and full anesthesia with isoflurane. In Monkey N, a recording chamber was placed over the right parietal cortex, whereas Monkey I's chamber was placed over the left parietal cortex. Therefore, Monkey N used the right hand for all experiments, whereas Monkey I used the left hand. Recording chambers were stereotaxically positioned (−0.6 cm anterior/posterior, +1.00 cm medial/lateral) over a 2.0 cm craniotomy to target lobules IV–VI of the intermediate/lateral zones in which hand- and arm-related Purkinje cells have been described (Thach, 1968; Mano and Yamamoto, 1980; Fortier et al., 1989; Ojakangas and Ebner, 1992; Fu et al., 1997; Roitman et al., 2005; Pasalar et al., 2006; Yamamoto et al., 2007; Hewitt et al., 2011). Previous results using these same two monkeys combined full-head magnetic resonance imaging (MRI) and computed tomography (CT) images in the software program, Monkey Cicerone, to model recording chamber locations and electrode penetrations (Miocinovic et al., 2007). Models for both monkeys showed electrode recording positions mostly in lobule V of the intermediate zone, with some cells recorded in lobules IV and VI as shown in Figure 1E (Hewitt et al., 2011).
Electrophysiological recordings and data collection.
After full recovery from chamber implantation surgery, extracellular recordings were obtained using platinum–iridium electrodes with parylene C insulation (0.8–1.5 MΩ impedance; Alpha Omega Engineering) that were inserted just deep enough to penetrate the parietal dura using a 22 gauge guide tube. Electrodes were advanced to mean depths of 27.3 ± 4.4 mm using a hydraulic microdrive (Narishige). Purkinje cells were identified by the presence of complex spikes and discriminated online using the Multiple Spike Detector System (Alpha Omega Engineering) after conventional amplification and filtering (30 Hz to 3 kHz bandpass, 60 Hz notch). Resulting spike trains were digitized and stored at 1 kHz. The raw electrophysiological data were also digitized and stored at 32 kHz. Spike trains were then transformed to a continuous firing rate using fractional intervals, downsampled to 100 Hz, and low-pass filtered (fourth-order Butterworth with a 5 Hz cutoff).
Optical encoders at each robot joint acquired hand-position coordinates and were used to display cursor position in real time on the computer screen. Forces applied to the manipulandum were also determined using a six-degrees-of-freedom transducer (Gamma model; ATI Industrial Automation) mounted at the handle. Hand position (P), target position, and applied force were digitized and stored at 200 Hz. Movement direction, velocity (V), acceleration (A), and other kinematic variables were calculated from the stored position data (Roitman et al., 2005; Pasalar et al., 2006). All analyses were performed using MATLAB software (MathWorks).
Data from individual trials were aligned on both movement onset (defined as velocity ≥5 cm/s) and perturbation onset for analyses. All analyses used only the time interval −500 to 1500 ms (relative to movement onset unless specified otherwise), which excluded portions of the initial and final hold periods. To compare between the eight possible movement directions, kinematic results were transformed to parallel or perpendicular coordinates. Movements in the parallel direction were defined as the shortest path between the start and end targets, whereas perpendicular movements were normal to this path. A similar transformation of the forces measured by the manipulandum transducer determined the hand forces parallel and perpendicular to the direction of movement. In the analyses and figures, subscripts denote parallel (p) versus perpendicular (per) movements.
Quantifying kinematic adaptation.
Successful trials from the adaptation block were divided into three learning stages: (1) early (first 10 trials); (2) middle (median 10 trials); and (3) late (final 10 trials). For comparisons, trials were also sampled from the baseline error-clamp (final 10 trials) and catch (all true catch trials) blocks. Catch trials randomly occurring less than five trials after the previous catch trial were eliminated from analyses, because the monkeys often exhibited some adaptation on closely paired catch trials. Mean traces were computed for each kinematic parameter and group of trials (Figs. 2, 3). For each recording session, mean kinematic traces of the last 10 successful baseline trials were subtracted from mean early or mean catch traces. The early versus baseline trials comparison is used to capture the changes in kinematics evoked by the perturbation. In the catch versus baseline trials, comparison is used to reveal the contribution of adaptation to the kinematics. Correlation coefficients comparing the similarity of these difference traces were calculated using MATLAB.
Figure 2.
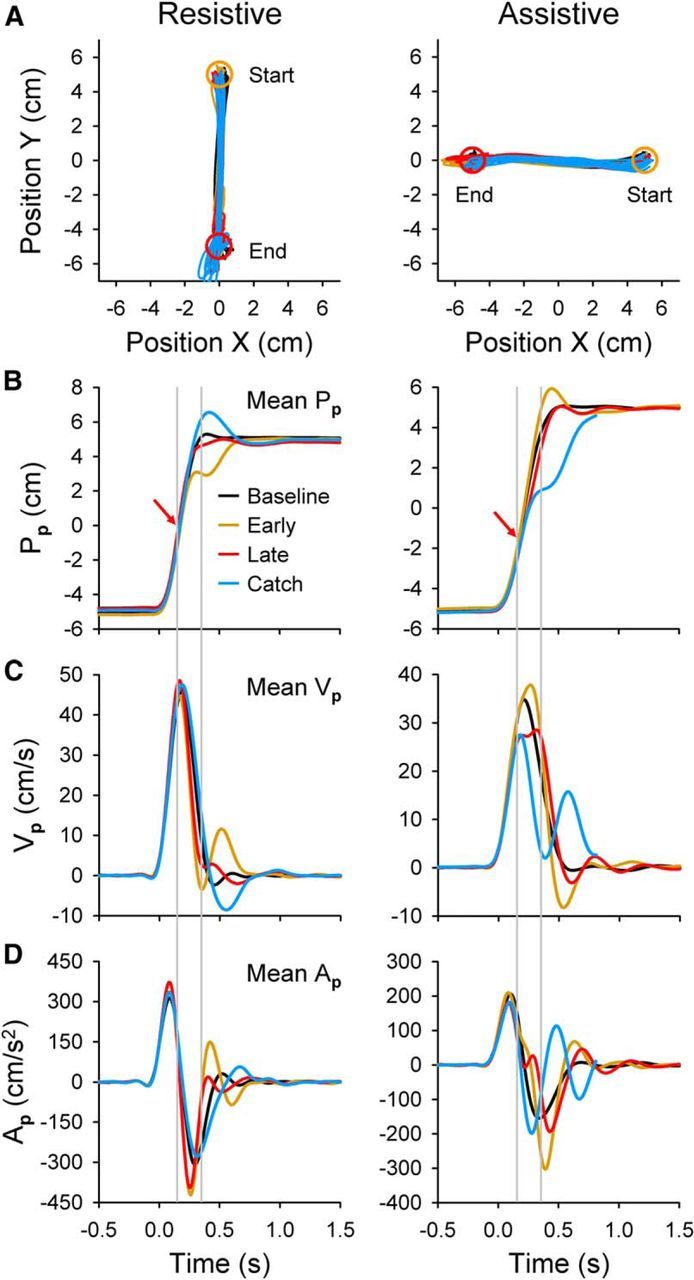
Hand movement kinematics, parallel. A, Actual hand-position coordinates (X, Y) from baseline error-clamp (black), early-adapt (gold), late-adapt (red), and catch (blue) trials for example resistive (Monkey I, left column) and assistive (Monkey N, right column) recording sessions. Note that 1.5 cm start (yellow circle) and end (red circle) targets centered at +5 and −5 cm produce a position workspace span of −5.75 to 5.75 cm. Position data cover the entire trial duration, including hold periods. B, Mean parallel hand position (Pp) trajectories were plotted versus time for the same trials. Red arrows depict the perturbation start position. Gray lines show approximate perturbation start and end times. C, D, Mean hand velocity (Vp) and acceleration (Ap) traces are shown. In all plots, data represent 10 trials from each condition except for catch trials (n = 7 resistive, n = 12 assistive). Perturbation parameters and PDs were as follows: resistive M = −9 N, D = 200 ms, p = 50% (i.e., center of the reach), 270°; assistive M = +7 N, D = 200 ms, p = 35%, 180°.
Figure 3.
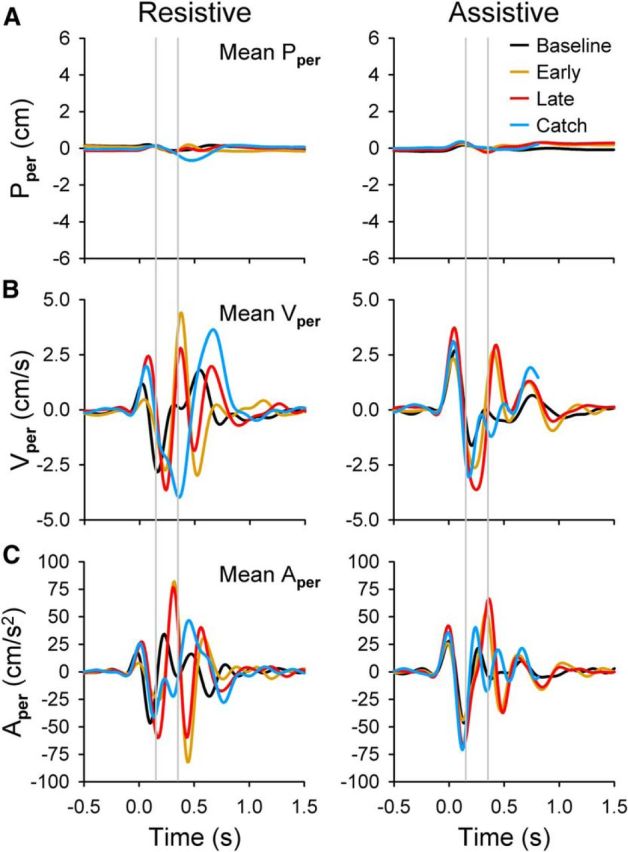
Hand-movement kinematics, perpendicular. Mean hand kinematics from baseline error-clamp (black), early-adapt (gold), late-adapt (red), and catch (blue) trials are plotted versus time for the perpendicular components of position (Pper; A), velocity (Vper; B), and acceleration (Aper; C). Gray lines show approximate perturbation start and end times. Data are from the same example trials as the resistive (left column) and assistive (right column) recording sessions shown in Figure 2.
Single-trial variability was quantified for each kinematic parameter by computing the root mean square deviation (RMSD) for the respective trace relative to the mean of the traces over the last 10 successful trials in either baseline or adapt epochs. The RMSD values were normalized to the range of their respective mean profile. Learning was quantified by fitting the normalized RMSD values of the adaptation trials to logarithmic decay functions. Learning rates were approximated by calculating the standard time constant (τ) of exponential decay for all significant (p ≤ 0.05) logarithmic fits. The lower bound, or asymptote, of each curve was defined as the trial at which the change in slope was ≤0.0001. Identifying this point often required extrapolating the curve beyond the actual 110 adapt trials. The time constant (τ) is the trial number at which the curve reached 1/e or ∼37% of its maximum range. The same analyses were performed on the simple spike firing rate profiles to determine variability and learning rates.
Analysis of simple spike firing.
A two-step analysis was used to determine the number of Purkinje cells with significant changes in simple spike firing and the time course of those changes. For the first step, firing changes before and during adaptation were quantified by calculating mean simple spike firing rates from four task-related time windows for individual trials. Time windows were defined as (1) before movement onset, (2) before perturbation start, (3) duration of the perturbation, and (4) post-perturbation end. All four window lengths matched the perturbation duration (e.g., 100, 150, or 200 ms) for each recording session. A two-way ANOVA (treatment factors were epoch and time window, 10 repetitions from each category, α = 0.05) was used to identify cells with significant firing changes between early and late adaptation in at least one of the four time windows. To identify significant predictive firing changes (i.e., before the perturbation), post hoc Bonferroni's-corrected Student's t tests evaluated mean firing in the first two time windows for cells with significant ANOVA results. For the second step, we applied the RMSD analysis outlined above for the kinematics to the simple spike firing. The RMSD of the simple spike firing profiles for individual trials were compared with the average profile from the last 10 adaptation trials and the RMSD values fitted to logarithmic functions to model learning and estimate the time course of the changes.
Simple spike firing data from single trials of a recording session were fit to linear regression models for movement kinematics. Previous eye and limb movement studies indicate that Purkinje cells in different regions of the cerebellar cortex are significantly tuned to kinematic parameters, such as position, velocity, and acceleration (Marple-Horvat and Stein, 1987; Shidara et al., 1993; Fu et al., 1997; Coltz et al., 1999; Roitman et al., 2005; Medina and Lisberger, 2009; Hewitt et al., 2011). As described above, movement kinematics were transformed into parallel or perpendicular coordinates to easily compare between the eight possible movement directions. This provided six kinematic model parameters: position (Pp, Pper), velocity (Vp, Vper), and acceleration (Ap, Aper). Because these movement parameters were often correlated, we examined each parameter in isolation by regressing against the firing residuals (FRs), which removed the firing variability associated with the other five parameters. The FRs for a given kinematic parameter were obtained by regressing the actual instantaneous (i.e., non-averaged) firing (f) from individual trials against a multilinear model containing the other five parameters. For example, Equation 2 below was used to acquire the FR needed to evaluate Pp independently of Pper, Vp, Vper, Ap, and Aper.
 |
The error term ε is the FR and represents the remaining variability in the simple spike discharge after everything but Pp is removed. We refer to this FR as FRPp, in which the subscript denotes the kinematic parameter of interest. The model parameter βo denotes baseline firing, and τ was incorporated to estimate the time lead or lag between simple spike firing and the kinematics. This approach was validated previously with control regressions to confirm that the FRs contained no information about the other parameters (Popa et al., 2012). Next, using the simple linear regression model in Equations 3–8, the appropriate FRs were regressed to the individual kinematic parameters:
For each set of regressions, the value of the timing variable τ shifted in 20 ms bins from −500 to 500 ms (Pasalar et al., 2006; Hewitt et al., 2011; Popa et al., 2012) to assess the time lead or lag between neural firing and movement kinematics. Negative values (i.e., τ < 0) indicate that firing leads, or predicts, movement kinematics in a feedforward (FF) manner, whereas positive values (i.e., τ ≥ 0) indicate the firing lags, or provides feedback (FB), about movement kinematics. Therefore, 51 individual regressions were performed, resulting in 51 different values of τ. Note that the same τ value associated with a simple linear regression result (Eqs. 3–8) was used to calculate the associated FRs.
Temporal profiles were generated comparing the coefficients of determination (R2 values) or regression coefficients (β values) to the 51 τ values. The τ value at which an R2 profile was maximal was selected as the optimal τ, and the corresponding β values were used for analyses. For some analyses, both an FF and FB τ value were selected as optimal if both results were significant. All regression analyses were based on single trials, not averaged data. Averaging firing across trials will inflate R2 values because the natural variation across trial repetitions (i.e., noise) is effectively aggregated within the estimate of the variability caused by the signal (Kenney, 1979). Therefore, the R2 values reported in this study may appear smaller than those in studies using average firing, but the R2 values must be understood in the context that the analyses were based on single-trial data. Significance was tested at each τ using the F statistic with the degrees of freedom determined by the number of observations. Type 1 error rate was α = 0.05. We imposed an additional threshold of R2 ≥ 0.02 for a significant fit (Popa et al., 2012).
Analysis of complex spike firing.
Complex spike waveforms were manually identified and discriminated from all trials of the raw, unfiltered electrophysiological data (recorded at 32 kHz) looking for characteristic waveform features that included a large spike amplitude followed by spikelets and a characteristic pause in simple spike firing. A custom MATLAB graphical user interface recorded the time stamp for each selected peak spike. Only Purkinje cells for which the complex spikes could be accurately discriminated throughout the entire baseline error-clamp and adapt epochs (Fig. 1B,C) were included in analyses. Although arbitrary, we elected to include in the complex spike analysis only Purkinje cells in which there was confidence in the discrimination. Although complex spikes were identified in every Purkinje cell recording, it was not always possible to accurately discriminate the complex spike throughout the entire set of baseline and adapt trials. The analysis goal was to determine whether complex spike firing was modulated relative to baseline spontaneous firing either in relation to movement onset or in response to the mechanical perturbation during adaptation. This analysis was conducted for all trials in the adapt epoch. We also performed the analysis for early adaptation (defined as the first 30 trials) and late adaption (defined as the last 30 trials of the adaptation epoch). Similar to simple spike firing analyses (see above), single trials were aligned on movement onset or perturbation onset and binned into task-related time windows. Because we varied the duration of the perturbation for each experimental session, the duration of the time windows equaled the perturbation time duration (100, 150, or 200 ms), of that session. Mean complex spike firing rates within baseline, movement-related, and perturbation-related time windows were calculated for each trial (see Fig. 15A). Baseline complex firing was determined across three consecutive time windows that ended before the first of two movement-related windows. The two movement-related windows were aligned on movement onset, one before and the other after movement onset. The three perturbation-related time windows included a window aligned on and after perturbation onset and followed by two consecutive windows. For each cell, the complex spike firing in the movement and perturbation windows were compared with the baseline firing. We identified cells with significant (α = 0.05) complex spike firing modulation using an ANOVA that treated the three baseline windows as repeated measures. For those cells with significant modulation, a post hoc Bonferroni's-corrected Student's t test (α = 0.01) was used to compare the complex spike firing in the baseline (firing in the three baseline time windows were combined) against the firing in the movement- and perturbation-related windows.
Figure 15.
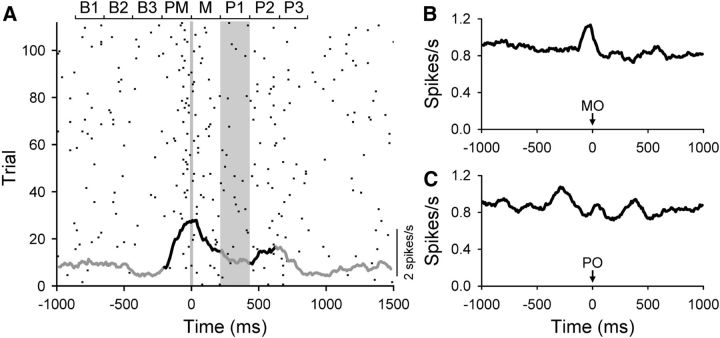
Complex spike firing. A, Raster and average firing plots of the complex spike discharge of a Purkinje cell throughout the adapt epoch. A significant change in complex spike firing compared with baseline is denoted by black and periods of no change by gray. Vertical line is movement onset and the time of the mechanical perturbation is denoted by the gray vertical bar. The bars at the top show the time windows used including the three baseline (B1–B3), premovement (PM), movement (M), and three perturbation windows (P1–P3). B, C, Population averages for the 49 Purkinje cells aligned on either movement onset (MO in B) or perturbation onset (PO in C).
Results
The behavioral and Purkinje cell firing data were collected during the baseline and adapt epochs, in which the error clamp was applied to minimize variability and errors in the perpendicular direction. The only trials not error clamped were those used to define the simple spike PD. Behavioral kinematics and simple spike firing were successfully collected during the PD and adapt epochs for 48 Purkinje cells in Monkey N and 93 cells in Monkey I. Of these 141 Purkinje cells, 121 were also recorded during the baseline error-clamp epoch.
Perturbations produce adaptive changes in behavior
Hand kinematics demonstrated adaptation to both the resistive and assistive perturbations. Hand-position traces (X vs Y; Fig. 2A) reveal the effectiveness of the error clamp in producing very repeatable movements that cross the entire parallel workspace but use only a small portion of the perpendicular workspace. As desired, most kinematic variability occurs parallel to the direction of movement rather than perpendicularly (compare Figs. 2, 3, noting differences in the y-axes). For a resistive recording session, the hand mostly overshoots the end target (red circle) during catch trials (blue). Conversely, for an assistive force, the monkey's hand barely reached the end target center when the assistive perturbation was removed unexpectedly.
Perturbation effects and learning are apparent in the plots of mean parallel position versus time (Pp; Fig. 2B). Baseline error-clamp trials (black) display smooth transitions from −5 to 5 cm for both examples. During early-adapt trials (gold), the perturbation disrupts the baseline pattern. The perturbation is a bell-shaped pulse, resulting in a delay between the perturbation start (red arrows) and the maximal magnitude (and thus behavioral changes). Resistive perturbations delay reaching the target (i.e., the hand “undershoots” the target), so that a quick catch-up movement is needed to intercept the target before time expires. The catch-up movement after the perturbation is evident in the early-adapt velocity trace (Vp; Fig. 2C). With learning, the mean late-adapt traces (red) again closely resemble baseline conditions and target interception is efficient. Catch trial (blue) changes also confirm that adaptation occurred. The monkey clearly overshoots the target in catch Pp profiles and must move backward into the target as illustrated by the negative portion of the catch Vp trace at ∼400 ms. Comparisons of the early-adapt and catch trial profiles at this point show that they are approximately equal in magnitude but oppositely signed. This demonstrates aftereffects, which indicate that the monkey learned the specific perturbation parameters. Acceleration changes (Ap; Fig. 2D) are also evident. In both early and late adapt, the resistive perturbation immediately produces a large negative acceleration. This requires the monkey to reverse toward positive accelerations more quickly than in the baseline trials. In contrast, catch trials remain at negative acceleration for a longer time interval than even the baseline trials.
In the assistive perturbation, adaptation is opposite that of the resistive perturbation but has the same general properties. Parallel position traces (Pp; Fig. 2B) show that, during early adapt, the perturbation causes the hand to overshoot the target. Adaptation leads to efficient target interception, and the late-adapt trace closely resembles baseline. Catch trials expose the learning, in that the hand undershoots the target and must make a quick catch-up movement that is evident in the velocity trace at ∼500 ms (Vp; Fig. 2C). Comparing the early-adapt and catch trials reveals opposite acceleration patterns (Ap; Fig. 2D) as the hand approaches the target. Therefore, aftereffects attributable to adaptation can be identified in all of the kinematic profiles.
Perpendicular movement kinematics occur on much smaller scales than their parallel counterparts (Fig. 3). Like parallel kinematics, the perturbation causes the early-adapt traces (gold) to deviate from baseline in all measures (Pper, Vper, and Aper) for both the resistive and assistive conditions. However, in contrast, learning does not result in the kinematics returning to their baseline profiles. Late-adapt traces instead often resemble mean early-adapt profiles. Catch trial responses are opposite that of late adapt in some cases (e.g., compare Vper from 250–500 ms), but the response is often not proportional in magnitude.
Differences within a single recording session between mean baseline and late-adaptation profiles (n = 10 trials) were quantified by calculating the RMSD for all six kinematic parameters. The mean percentage changes across the population were low for the parallel movements (Pp = 1.7%, Vp = 3.1%, Ap = 3.7%) compared with perpendicular movements (Pper = 22.3%, Vper = 8.1%, and Aper = 6.8%), again confirming that movement adaptation primarily occurred in the parallel direction. Importantly, this analysis shows that the final adapted movement kinematics closely resemble the original movement.
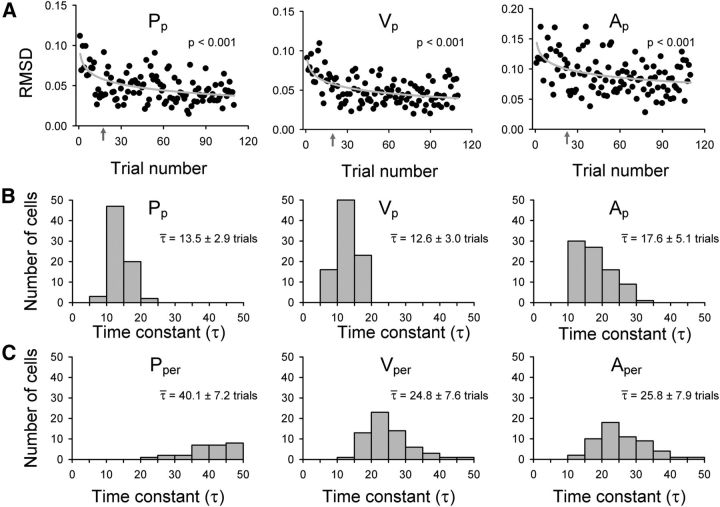
To specifically address learning during the adapt epoch, we assessed how single-trial kinematics progressed toward a final reaching pattern that efficiently intercepted the target despite the perturbation. This final pattern was represented by the mean position (Pp, Pper), velocity (Vp, Vper), and acceleration (Ap, Aper) traces of late-adapt trials (Figs. 2, 3, red traces). RMSD measures compared each successful adapt trial (i.e., only trials in which the target was intercepted) to the mean late-adapt traces. Results from the example resistive recording session were fit to logarithmic functions (Fig. 4A) and reveal that the monkey quickly adapted toward the final parallel kinematic patterns (p < 0.001 for parameters Pp, Vp, and Ap). Across all recording sessions, there were more instances of significant learning for the parallel parameters (n = 73 Pp, n = 90 Vp, and n = 84 Ap) than the perpendicular parameters (n = 42 Pper, n = 64 Vper, and n = 61 Aper). Significant adaptation (p ≤ 0.05) occurred in 87.0% (120 of 138) of the sessions in at least one parameter. This left only 13.0% (18 of 138) of the recording sessions without evidence of significant learning using this one measure. The majority of non-adapting sessions used an assistive perturbation (11 of 18). Also, continuous adaptation without a plateau or late changes in reaching patterns occasionally produced RMSD results that did not fit a logarithmic function and may explain why several sessions did not reach significance despite identifiable changes in the kinematics.
Figure 4.
Kinematic learning and adaptation rates. A, RMSD measures compared individual adapt trial kinematics to the corresponding mean late-adapt trace. RMSDs by trial number are plotted for the parallel kinematic parameters position (Pp), velocity (Vp), and acceleration (Ap) of the example assistive recording session (Fig. 2). Logarithmic fits (gray lines) and p values are provided. Gray arrows indicate the trial number in which the standard time constant of exponential decay (τ) was reached. Histograms show the distributions of τ values for the parallel (B) or perpendicular (C) components of position, velocity, and acceleration. Means ± SDs of the time constants are shown for each histogram.
We further quantified the rate of learning by calculating the standard time constants (τ) of exponential decay (see Materials and Methods) for each parameter in a recording session with significant adaptation (note that the units of τ are numbers of trials). The gray arrows in Figure 4A indicate the trial number at which the time constant τ is reached for the example data (Pp = 20, Vp = 19, and Ap = 23). Across all sessions, mean τ values were much lower with smaller SDs for the parallel parameters (τ = 13.5 ± 2.9 Pp, τ = 12.6 ± 3.0 Vp, and τ = 17.6 ± 5.1 Ap; Fig. 4B) compared with the perpendicular parameters (τ = 40.1 ± 7.2 Pper, τ = 24.8 ± 7.6 Vper, and τ = 25.8 ± 7.9 Aper; Fig. 4C). All τ values from position, velocity, and acceleration were grouped by parallel versus perpendicular movement direction for comparison. The τ distributions suggest that learning occurred more quickly in parallel movement directions (Student's t test, t(389) = −18.87, p < 0.001). Therefore, the majority of the adaptation took place along the parallel movement direction and occurred at a faster rate. This result is not unexpected because the perturbation acts in the parallel direction and adapting to the perturbation requires more extensive changes in the parallel than perpendicular direction. Additionally, the error clamp limited movements in the perpendicular direction and reduced the extent to which the animals had to control or attend to perpendicularly directed movements. Given that the changes are slower and less extensive along the perpendicular direction, we focused on adaptation parallel to the direction of movement.
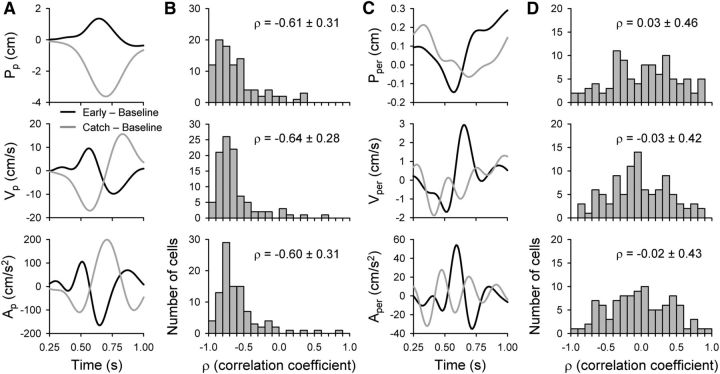
Finally, we evaluated adaptation aftereffects by contrasting early-adapt and catch trial kinematics. We reasoned that learning should effectively remove the effects of the early perturbation on the movement kinematics by counterbalancing the perturbation. In this reasoning, early-adaptation trials exhibit the perturbation effects before learning. The catch trials should reveal the contribution of adaptation to the kinematics. For each recording session, mean baseline kinematic traces (Figs. 2, 3) were subtracted from mean early or mean catch traces to construct mean difference traces. These difference traces emphasize how early-adapt (gold) or catch (blue) kinematics differ from baseline (black). The example data from a resistive session show that difference traces for the parallel kinematic parameters (Fig. 5A) are nearly equal and opposite in magnitude over time, whereas the perpendicular difference traces (Fig. 5C) are less correlated. Correlation coefficients (ρ) quantify these observations, with mean correlation coefficients less than −0.6 for the parallel parameters Pp, Vp, and Ap (Fig. 5B). In contrast, the correlation coefficients for Pper, Vper, and Aper are all approximately 0 (Fig. 5D). Correlation coefficients from all the parameters were grouped by movement direction. A Student's t test comparing the parallel versus perpendicular correlation coefficients confirmed that the means were significantly different (t(586) = −19.73, p < 0.001). Repeating the correlation coefficient analyses with time shifts between the two difference traces did not significantly alter the outcomes (data not shown). Again, these results imply that the majority of learning was in the parallel direction of movement and that adaptation involved precisely matching the effects of the perturbation on arm kinematics.
Figure 5.
Kinematics precisely adapt to perturbations. Mean baseline kinematic traces were subtracted from mean early (black) or catch (light gray) traces to emphasize kinematic changes attributable to the perturbations. A, Resultant difference traces for parallel kinematic parameters position (Pp), velocity (Vp), or acceleration (Ap) are plotted versus time for the example for an assistive perturbation. The shortened time interval (0–0.75 s) primarily covers the reaching period. B, Histograms show correlation coefficients resulting from comparison of the two difference traces. All sessions with successfully recorded baseline, adaptation, and catch trials were included (n = 98). C, D, Similar difference traces and correlation coefficient histograms (n = 98) are included for the perpendicular kinematic parameters position (Pper), velocity (Vper), and acceleration (Aper). For each histogram, the means ± SDs of the correlation coefficients are shown.
Perturbations produce adaptive changes in simple spike firing
Each of the 141 Purkinje cells recorded during this task exhibited distinct firing modulation. To illustrate this, simple spike firing responses from four different Purkinje cells (one assistive and one resistive perturbation from each monkey) are plotted for consecutive baseline and adaptation trials versus time (Fig. 6). Qualitative analyses of the firing discharge show that each Purkinje cell is tuned to movement, with increases or decreases in firing activity around movement onset (left vertical line). After the perturbation is introduced, progressive changes in Purkinje cell firing rates occur that remain through late adaptation. The four cells chosen illustrate the diversity of firing and adaptation observed across Purkinje cells.
Figure 6.
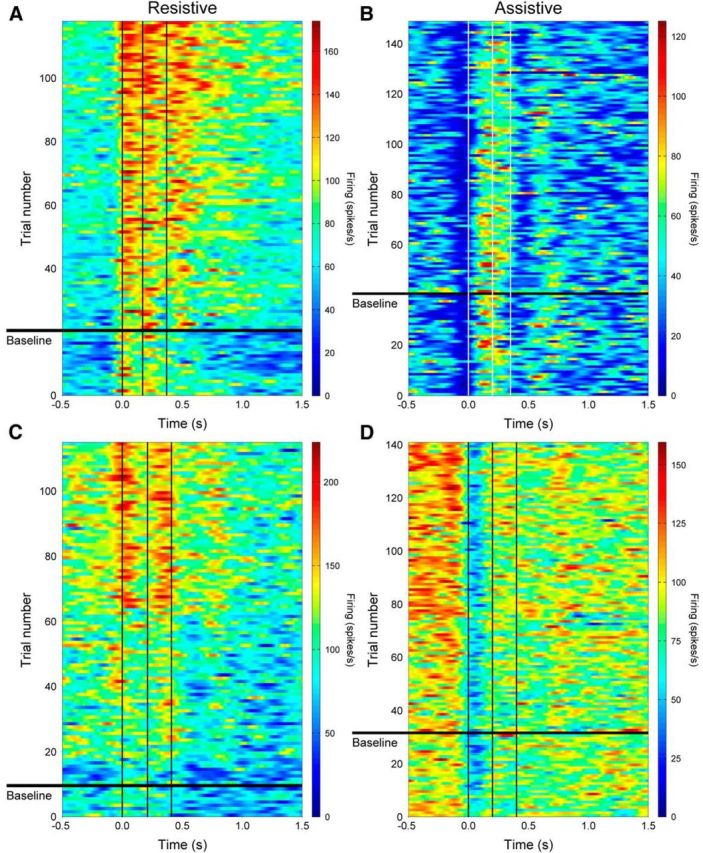
Simple spike firing responses. Recorded simple spikes were converted to instantaneous firing rates, aligned on movement onset (t = 0), and plotted versus time for four example Purkinje cells. Rows below the horizontal black line depict baseline data, whereas rows above chronologically show firing from all successful adaptation trials. Vertical lines depict movement onset (left), mean perturbation start (middle), and mean perturbation end (right). Perturbation parameters and PDs were as follows: Monkey I: (A) M = −9 N, D = 200 ms, p = 50%, 270°; (B) M = +9 N, D = 150 ms, p = 35%, 225°; Monkey N: (C) M = −9 N, D = 200 ms, p = 50%, 135°; (D) M = +7 N, D = 200 ms, p = 35%, 180°. M, Magnitude; D, duration; P, start position.
The first Purkinje cell (Fig. 6A) demonstrates distinct increased firing across all key movement time periods during adaptation to a resistive perturbation. Firing before movement onset (left vertical line, t = 0 s) increases quickly, from little to no firing (<10 Hz) in the baseline epoch to tonic firing (∼60 Hz) during the adapt epoch. In the baseline epoch, there are only two “bands” of increased firing occurring after movement onset and what will be the perturbation start time (middle vertical line). After exposure to the perturbation, overall firing rates in these two bands also increase. In the first trial of early adapt, a third band of peak firing appears after the perturbation ends (right vertical line) and continues to increase with adaptation.
In contrast, a second Purkinje cell (Fig. 6B) decreases its overall mean firing with adaptation to an assistive perturbation. With adaptation, the duration of the decrease in firing just before movement onset increases and another period of decreased firing after the perturbation ends (right vertical line) becomes more pronounced. Perturbation exposure also delays the peak firing of this cell by ∼150 ms, shifting the timing from just after movement onset in the baseline trials to during the perturbation in late-adapt trials.
A third Purkinje cell (Fig. 6C) shows only weak modulation during the baseline trials. Throughout adaptation, firing increases in three bands. The first band is centered on movement onset, the second corresponds with the start of the perturbation, and the third band occurs at ∼750 ms after perturbation when the target is intercepted. The changes begin in the early-adapt epoch, shortly after the perturbation is first experienced. Similar to the first cell (Fig. 6A), this cell also demonstrates increased background firing before movement onset.
Simple spike firing for a fourth Purkinje cell (Fig. 6D) exhibits large changes before movement onset. The background firing steadily increases after initial exposure to the perturbation and remains elevated in the late-adaptation trials. Closer inspection of early- versus late-adapt trials reveals that the period of decreased firing after movement onset shortens with adaptation, so that the blue band narrows slightly, again demonstrating time-sensitive changes in the simple spike firing.
RMSD calculations comparing baseline mean firing profiles with that of late adaptation across the entire movement period confirm sizable changes in the simple spike discharge, showing that the firing profile changed an average of 25.3 ± 11.8% for all 141 Purkinje cells. However, as mentioned above, movement kinematics in parallel position, velocity, or acceleration only changed by 1.7, 3.1, or 3.7%, respectively, suggesting that large simple spike firing changes across the population are required to adapt to a transient perturbation. Therefore, any changes in encoding sensitivity to the kinematic parameters truly reflect changes in the Purkinje cells and not simply an alteration in the movements.
Within individual cells, the firing analyses first tested for significant simple spike firing change with adaptation. We divided the simple spike firing into four task-related time windows: (1) before movement onset (left vertical line); (2) before perturbation start (middle vertical line); (3) duration of the perturbation; and (4) post-perturbation end (right vertical line). Time window duration matched the perturbation duration (e.g., 100, 150, or 200 ms) for the recording session of that cell. The first window provided a measure of the background firing, and the other three windows focused on the firing in relation to the perturbation. The mean simple spike firing from each time window was compared across 10 trials each of early versus late adaptation (two-factor ANOVA with repeated measures, α = 0.05). All four example Purkinje cells (Fig. 6) showed significant changes in the mean firing rates between early and late adaptation (Purkinje cells A, B, and D are all p < 0.0001, C is p = 0.016). Across the population, 56.0% (79 of 141) of Purkinje cells demonstrated significant firing changes between the early- and late-adapt epochs. For these Purkinje cells, post hoc Student's t tests (Bonferroni's corrected) found that the simple spike firing of 58.2% (46 of 79) cells specifically changed before the perturbation (i.e., changes occurred before the perturbation in window 1, window 2, or both windows 1 and 2). This corresponded to 36.7% (29 of 79) neurons with significant changes before movement onset (window 1) and 40.5% (32 of 79) before the perturbation start (window 2). All subsequent simple spike firing analyses were restricted to these 79 significant Purkinje cells.
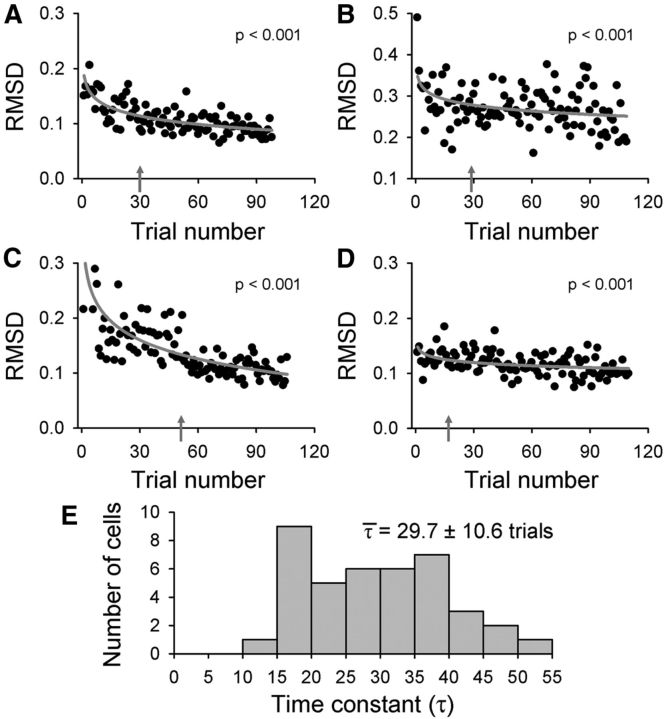
To compare rates of firing adaptation with those of kinematic adaptation, we similarly calculated the RMSD between each trial of adaptation and a final firing pattern that was modeled as the mean of the final 10 late-adapt trials. Results for the four example Purkinje cells were modeled by logarithmic functions (p < 0.001 for all four neurons) and demonstrate that the firing activity also exhibits progressive changes with learning in the same manner as the kinematics (Fig. 7). This type of adaptation was found to be significant (p < 0.05) in 53.2% (42 of 79) of Purkinje cells with significant firing changes. Again, continuous adaptation without a plateau or late changes in the firing patterns produced RMSD results that were not fit by a logarithmic function and explain why the firing adaptation in many neurons did not reach significance.
Figure 7.
Simple spike firing learning and adaptation rates. RMSD measures compared individual adapt trial firing to the corresponding mean late-adapt trace. A–D, RMSD by trial number are plotted for the four example Purkinje cells from Figure 6. Logarithmic fits (gray lines) and p values are provided. Gray arrows indicate the trial number at which the standard time constant of exponential decay (τ) was reached. E, The distribution of firing time constants (τ) is shown for Purkinje cells with significant logarithmic fits (n = 42), along with the mean ± SD.
We further quantified the rate of firing adaptation by calculating the standard time constant (τ) of exponential decay (see Materials and Methods) for all recording sessions with significant firing adaptation as measured by the RMSD. The gray arrows in Figure 7A–D indicate the trial number at which the time constant τ is reached for the example data (A = 30, B = 29, C = 51, and D = 17). The distribution of τ values for all Purkinje cells with significant RMSD logarithmic fits is provided (Fig. 7E). The mean τ value of 29.7 ± 10.6 is much greater than mean τ values for the kinematics (Fig. 4), showing that firing adaptation occurs more slowly and follows kinematic adaptation.
Changes in simple spike firing with movement kinematics
Previous studies show that Purkinje cell simple spike activity is correlated with effector kinematics at various leads and lags (Hewitt et al., 2011). Therefore, we hypothesized that one mechanism of firing adaptation would be to change the sensitivity and/or timing to a kinematic parameter. We evaluated firing modulation using linear regression models that fit the simple spike firing from individual trials to the six kinematic parameters (Pp, Pper, Vp, Vper, Ap, and Aper) in isolation by regressing against the FR after removing the firing variability associated with the five other parameters (see Materials and Methods). The models (Eqs. 3–8) included a timing variable τ that estimated the time lead (τ < 0) or lag (τ ≥ 0) between neural firing and kinematics.
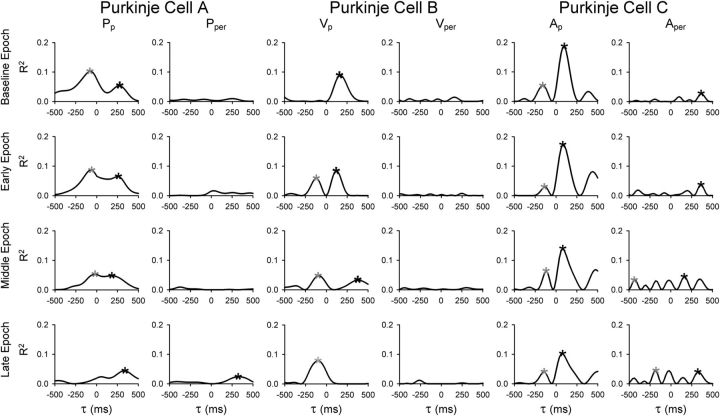
Plots of the R2 profiles for three example Purkinje cells during adaptation show that both simple spike sensitivity and timing are altered with adaptation (Fig. 8). During baseline, cell A shows dual encoding for Pp, with R2 profile peaks at both FF (gray asterisks) and FB (black asterisks) times. Over the course of adaptation, the profile changes to only FB coding with a decrease in the Pp R2. Example cell B also demonstrates a timing shift with learning from significant simple spike modulation at FB times to purely FF modulation. In contrast, Purkinje cell C exhibits a much more stable R2 profile from baseline to late adapt. In all three examples, the parallel component of the kinematic parameter accounts for most of the variability in the simple spike firing. Together, these examples illustrate that the sensitivity and timing of the simple spike firing kinematic parameter encoding changes with adaptation.
Figure 8.
Example temporal profiles. Temporal profiles compared the coefficients of determination (R2 values) to the time constant values (τ) used in the regression analyses. Profiles demonstrating time shifts from FF to FB (A), FB to FF (B), or no change (C) were generated for three different Purkinje cells significantly tuned to Pp, Vp, and Ap, respectively. Rows depict the task epochs baseline, early, middle, and late adaptation. Asterisks indicate significant FF (gray) or FB (black) τ peaks.
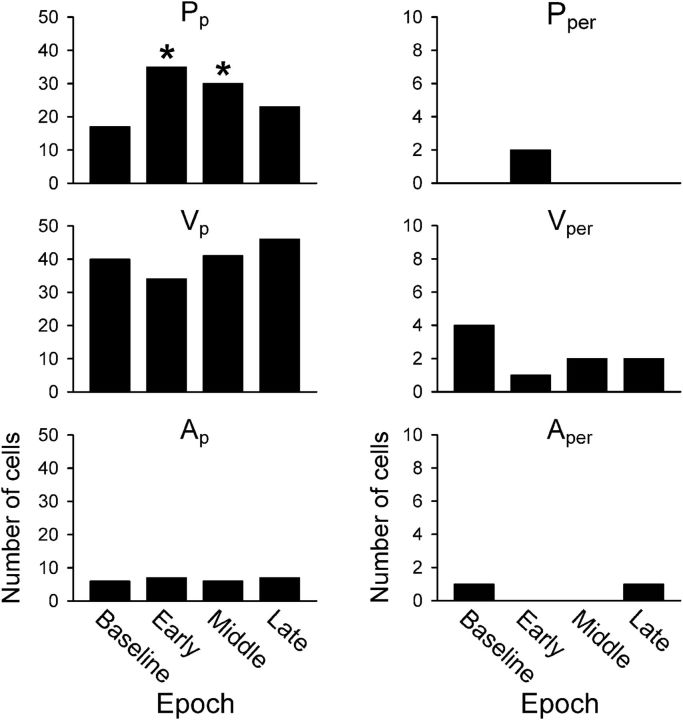
Therefore, we evaluated which of the kinematic parameters described the most firing variability (i.e., parameter with largest R2 value for each Purkinje cell) for each phase of adaptation (Fig. 9). Across all epochs, the dominant parameters were Pp and Vp. Interestingly, Figure 9 shows that early learning involves an increase in the position encoding that gradually decreases by late learning [X2(2, N = 88) = 17.63, p < 0.001]. Post hoc analyses verified that the counts in early learning [X2(1, N = 35) = 11.78, p < 0.001] and mid-learning [X2(1, N = 30) = 5.32, p = 0.021] increase from baseline. Conversely, velocity encoding trends toward a decrease in early learning and then regains prominence in late learning, but this did not attain significance. These shifts in position and velocity sensitivity are discussed further below (see Changes in simple spike timing). Furthermore, it is obvious that only a few Purkinje cells exhibit a perpendicular kinematic dominant parameter regardless of epoch [X2(3, N = 305) = 127.79, p < 0.001]. Example R2 profiles from Figure 8 also suggest that the simple spike firing is poorly modulated with the perpendicular kinematic parameters. An additional analysis of all significant R2 values (whether the dominant parameter or not) revealed that simple spike discharge was much more strongly correlated with the parallel than the perpendicular kinematics (data not shown). Therefore, we focus the remaining analyses of changes in simple spike sensitivity and timing on evaluation of the parallel kinematics.
Figure 9.
Dominant parameter, all τ peaks. The kinematic parameter describing the most firing variability (i.e., greatest R2 value) was identified for each Purkinje cell across all six kinematic parameters, Pp, Pper, Vp, Vper, Ap, and Aper, during adaptation to the perturbation. Results were binned across the task epochs of baseline, early, middle, and late adaptation.
Variability during baseline movements versus adaptation
We also analyzed the motor behavior and simple spike firing variability during baseline versus adaptation movements, testing the hypothesis that the variability should be significantly less during baseline trials than during adaptation trials. It needs to be stressed that the animals demonstrate nearly constant learning, modifying their performance from trial to trial as needed. For example, when the paradigm switches from the non-error-clamp trials used to determine the simple spike firing PD to the baseline error-clamp trials (Fig. 1), there are initially large movement changes as the animal adapts to the error clamp (data not shown). Therefore, testing the hypothesis required comparing the variability during a period of stable baseline movements with movements during a period of adaptation. To do this, we determined the RMSD of the kinematic parameters and the simple spike firing profile for the last 20 trials of the baseline error clamp and the first 20 trials of the adapt epoch relative to the mean of the last 10 successful baseline trials. The baseline variability was significantly less than during the early-adapt trials for the simple spike firing (firing, 0.19 ± 0.07 vs 0.23 ± 0.10, t(1362) = −16.75, p < 0.0001) and each kinematic parameter (Pp, 0.04 ± 0.02 vs 0.06 ± 0.02, t(1362) = −25.34, p < 0.0001; Vp, 0.03 ± 0.01 vs 0.06 ± 0.02, t(1362) = −47.77, p < 0.0001; and Ap, 0.06 ± 0.021 vs 0.14 ± 0.06, t(1362) = −53.85, p < 0.0001). Therefore, as predicted, variability in both kinematics and simple spike firing increases during periods of adaptation.
Changes in parameter sensitivity
For many individual Purkinje cells, the β coefficients changed progressively with learning. To identify changes, we compared regression results from individual Purkinje cells. To be considered “tuned” to a parameter, a Purkinje cell needed a significant peak at all four epochs of the adaptation period: (1) baseline; (2) early adapt; (3) middle adapt; and (4) late adapt. From the population of 79 cells with significant firing changes, 87.3% (69 of 79) met this requirement for at least one parameter, testifying to the robust parameter representation. If β confidence intervals from the baseline and late-adapt epochs overlapped, we determined there was no change in β values with adaptation. Otherwise, β values for that Purkinje cell and parameter were grouped as increasing or decreasing.
Figure 10A–C shows the changes in β values across the four epochs for nine example cells that were grouped as increasing (inc; column 1), no change (nc; column 2), or decreasing (dec; column 3). The number of cells with these three profiles for each of the parallel kinematic parameters is in Figure 10D. A majority of Purkinje cells were tuned to the parameters Pp and/or Vp, with 37 Purkinje cells having a change in sensitivity (increase or decrease) to Pp with learning and 44 Purkinje cells having a change in sensitivity to Vp. As the Pp examples illustrate, an increase or decrease in the β values could result in a sign change (e.g., Pp increases from negative to positive) or simply a magnitude change (e.g., Pp dec). Sign changes were found in 20% (4 of 20) Pp inc, 11.8% (2 of 17) Pp dec, 36.8% (7 of 19) Vp inc, 28.0% (7 of 25) Vp dec, 100% (8 of 8) Ap inc, and 53% (7 of 13) of the Ap dec grouped Purkinje cells. The change in the sign of the β for a parameter shows that the nature of the encoding can switch with adaptation. Overall, the changes in simple spike sensitivity for specific parameters demonstrate that a substantial reassignment of kinematic encoding occurs in a large fraction of individual Purkinje cells.
Figure 10.
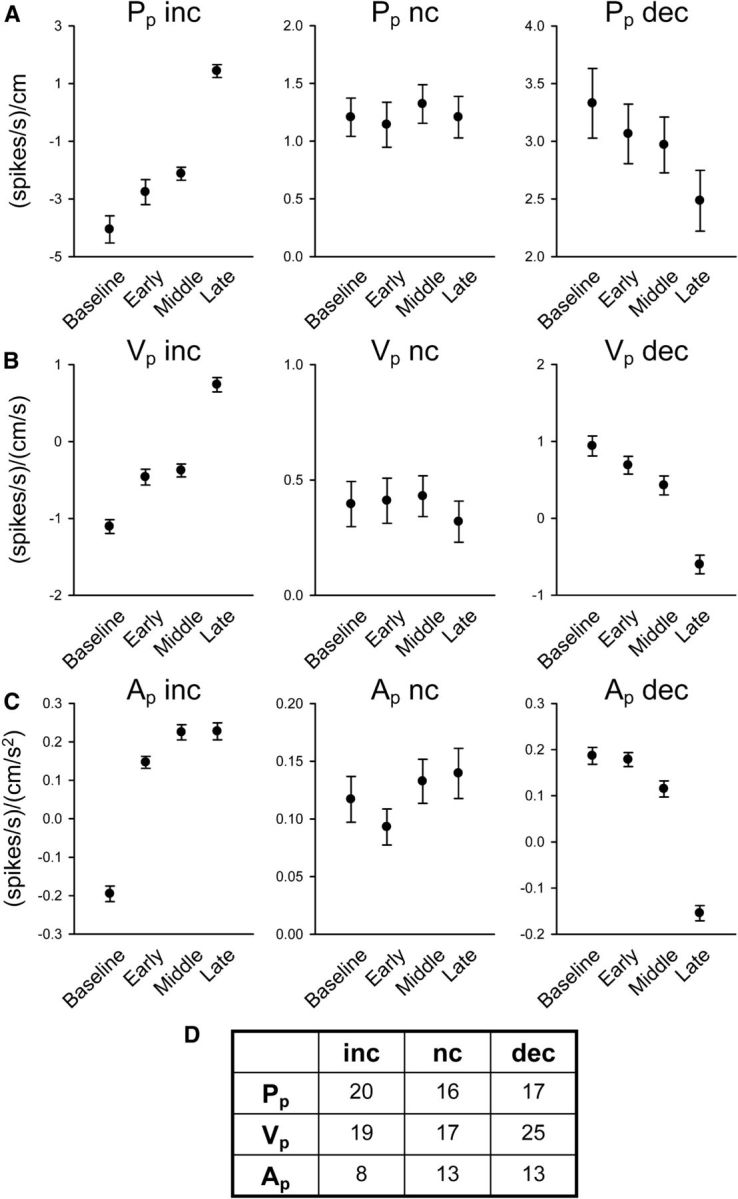
Parameter sensitivity. Regression analyses β values from all Purkinje cells with significant firing changes (n = 79) were grouped as increasing (inc), no change (nc), or decreasing (dec) using the β confidence intervals from baseline and late-adaptation trials. Example β coefficients from different Purkinje cells illustrate adaptive changes in parameter sensitivity for parallel position Pp (A), parallel velocity Vp (B), and parallel acceleration Ap (C). D, The table indicates the number of Purkinje cells allocated to each group.
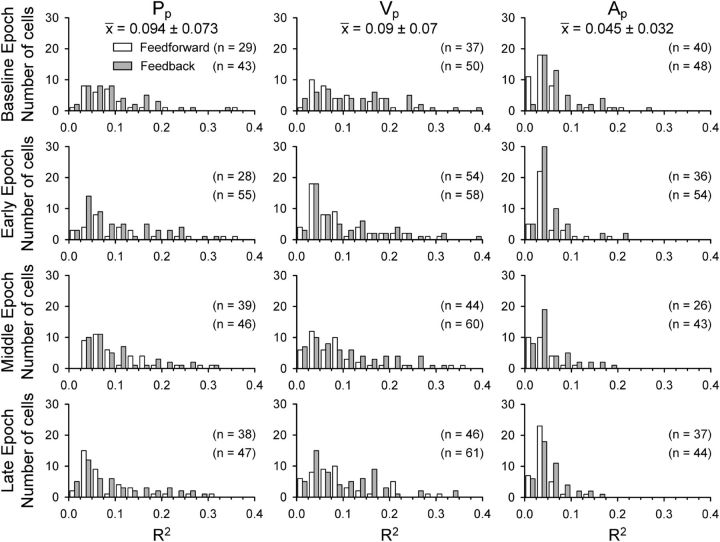
The next step assessed the changes in simple spike sensitivity with learning across the population of Purkinje cells. In addition to determining the simple spike encoding with kinematics during the baseline and adapt epochs, we also asked whether there is a net shift in the number of Purkinje cells or kinematic signals with learning. Therefore, we plotted the distributions of the peak R2 values from all significant regression results across baseline and early-, middle-, and late-adaptation epochs for each parameter (Fig. 11). The mean R2 values (top of each column) indicate that Purkinje cells are most sensitive to Pp and Vp (Pp = 0.09 ± 0.07, Vp = 0.09 ± 0.07) and that Ap explains much less of the firing variability (Ap = 0.05 ± 0.03). The shapes of the distributions are approximately equivalent for both FF (white bars) and FB (gray bars) regression results. We also examined adaptive changes in parameter sensitivity in the population of Purkinje cells. For Pp, Vp, and Ap, the β values appear normally distributed, with the exception of almost no β values near 0 (Fig. 12). This occurs because the plots only include significant regression results and β values around 0 are typically not significant (see Materials and Methods). There are no significant changes in the β values among epochs, including baseline versus late learning (F(1,508) = 0, NS), indicating that learning did not cause a net shift in the simple spike sensitivity to kinematics.
Figure 11.
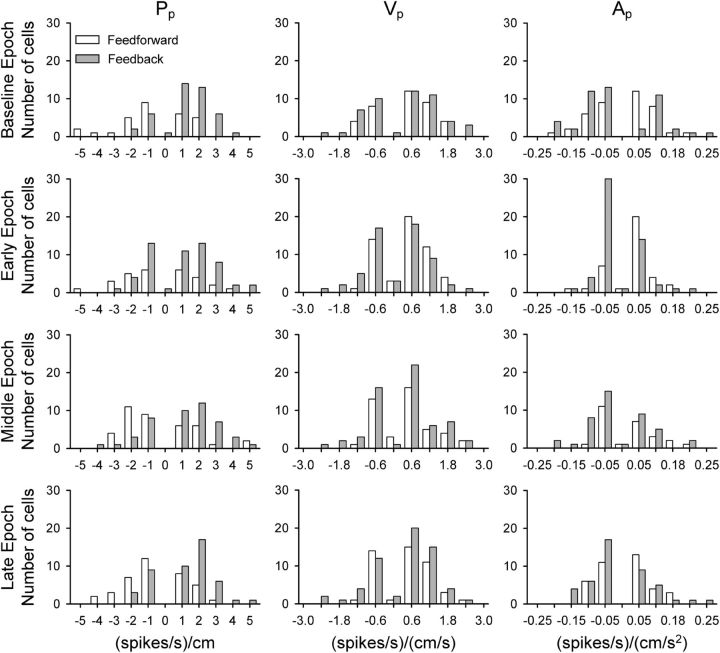
Distribution of R2 values, parallel. Regression analyses R2 values associated with FF (white) or FB (gray) peak τ values were binned for the parallel kinematic model parameters Pp, Vp, and Ap (columns) across task epochs of baseline, early, middle, and late adaptation (rows). Values in parentheses indicate numbers of Purkinje cells with significant FF (top) or FB (bottom) peaks.
Figure 12.
Distribution of β values. Histograms show the distribution of β values resulting from regression analyses. Values are grouped by FF (white) or FB (gray) peak τ values and the model parameters Pp, Vp, and Ap (columns). Results are shown for the task epochs of baseline and late adaptation (rows).
The number of Purkinje cells with significant fits (numbers in parentheses) is greater for the FB than the FF timing across all parameters and epochs [X2(3, N = 1063) = 11.55, p = 0.009]. Also, there is a significant difference in β values for FF versus FB timing (F(1,508) = 31.16, p < 0.001). In both the early and late Pp distributions, FF β values (white) have more negative values than FB β values (gray), whereas the values for parameters Vp and Ap tend to be equal, based on Tukey–Kramer post hoc comparisons (p < 0.05 for Pp). Therefore, across the population of Purkinje cells, position and velocity encoding dominates and adaptation does not result in large net changes in kinematic encoding except for a shift in modulation with Pp in early and late adaptation.
Simple spike modulation with force
Given the extensive evidence that Purkinje cell simple spike firing encodes kinematics across a wide range of behaviors, our analyses focused on kinematics (Stone and Lisberger, 1990; Gomi et al., 1998; Roitman et al., 2005; Pasalar et al., 2006; Hewitt et al., 2011; Dash et al., 2013). In the present results, the prevalence of significant position and velocity modulation in the simple spike firing is consistent with those previous findings. The firing of a smaller number of Purkinje cells is modulated with acceleration that could reflect kinematic or force encoding. Distinguishing between these two possibilities proved difficult because the average correlation between acceleration and force parallel to the direction of movement is extremely high for both baseline error-clamp (0.95 ± 0.03) and adapt (0.72 ± 0.19) trials. Therefore, the simple spike acceleration signals observed in some Purkinje cells could represent force modulation. However, the amount of simple spike activity that could be attributed to force is limited by the overall weak encoding of acceleration (Fig. 11). Overall, the results show that the dominant changes in simple spike modulation occur in the kinematic representations.
Comparison of simple spike adaptation for resistive versus assistive perturbations
In the oculomotor vermis, simple spike adaptation occurs for an increase but not a decrease in smooth pursuit gain (Dash et al., 2013). These findings raise the question whether resistive and assistive perturbations have a differential effect on simple spike adaptation. Additional analyses compared the simple spike firing changes occurring during resistive versus assistive perturbations. For the 79 Purkinje cells, the number of neurons with significant simple spike adaptation did not differ for assistive (n = 41) and resistive (n = 38) perturbations [X2(1, N = 141) = 0.29, p = NS]. Contingency analyses also evaluated whether resistive versus assistive perturbations changed the frequency of increases, decreases, or no change in firing sensitivity (i.e., β) for Pp, Vp, and Ap (Fig. 10). There were no significant differences for Pp [X2(2, N = 53) = 1.46, p = NS] and Ap [X2(2, N = 34) = 0.22, p = NS]. However, there was an increase in the number of cells with a decrease in sensitivity or no change that bordered on significance for Vp [X2(2, N = 61) = 6.0, p = 0.05]. Therefore, simple spike firing adaptation occurred equally with both resistive and assistive perturbations and with only minor differences in the kinematic signaling for the two types of perturbations.
Changes in simple spike timing
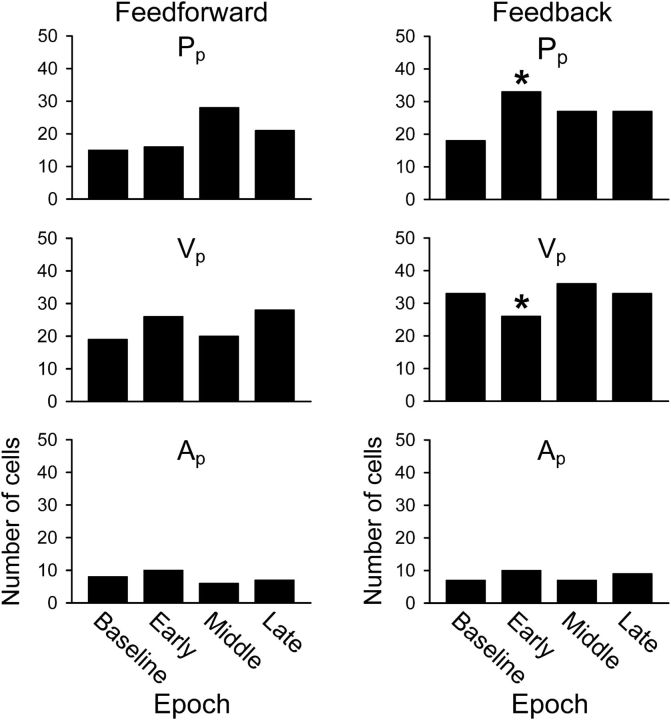
As illustrated in Figures 8 and 9, the timing of the kinematic encoding shifted with learning. To further examine for timing changes in the population, we determined the kinematic parameter that described the most firing variability (dominant parameter), including significant peaks at either FF or FB timing (Fig. 13). At FB timing (right column), perturbation exposure in early adapt brings about a significant increase in cells in which Pp is the dominant parameter [X2(2, N = 87) = 8.52, p = 0.014] and a decrease in the number of cells in which Vp is dominant [X2(2, N = 95) = 6.35, p = 0.042]. Post hoc analyses revealed that the significant differences arose in early adaptation for both Pp [X2(1, N = 33) = 6.32, p = 0.012] and Vp [X2(1, N = 26) = 4.44, p = 0.035]. At FF timing (left column), there is a nonsignificant trend toward an increase in the number of cells in which Pp is dominant during middle adapt [X2(2, N = 65) = 5.65, p = 0.059]. There were fewer cells in which Ap was the dominant parameter, with no significant changes during adaptation. The shifts in the timing of position and velocity encoding may be neural correlates of the psychophysical observation that, in adapting to novel force fields, the motor system uses a combination of position and velocity primitives that shifts over the course of learning (Sing et al., 2009).
Figure 13.
Dominant parameter, FF versus FB τ peaks. The kinematic parameter describing the most firing variability (i.e., greatest R2 value) was identified for each Purkinje cell at significant FF and FB time constants (τ) for kinematic parameters Pp, Vp, and Ap. Results were binned across the task epochs of baseline, early, middle, and late adaptation. *p < 0.05.
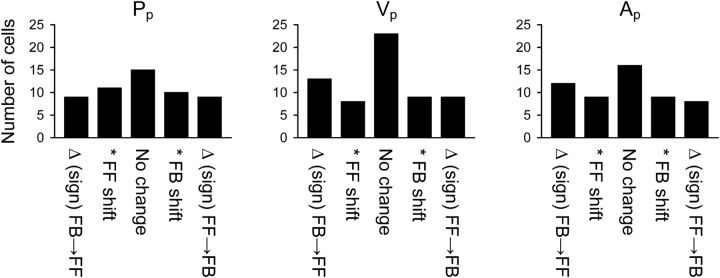
To further quantify changes in the timing sensitivity from individual cells, we computed for each parameter the differences between baseline and late-adapt optimal τ values (i.e., τ producing the maximal R2 peak). A “substantial” shift in the τ value was arbitrarily defined as 100 ms. The differences were then tallied by kinematic parameter into five groups: (1) change in τ from FB to FF; (2) FF shift in τ; (3) no significant change; (4) FB shift in τ; or (5) change in τ from FF to FB (Fig. 14). Across the three kinematic parameters, at least one-third of the Purkinje cell τ values demonstrate a substantial shift that changes sign from baseline to late adapt [Pp = 33.0% (18 of 54); Vp = 35.5% (22 of 62); Ap = 37.0% (20 of 54)]. Changes toward FF and FB τ values are similar for Pp [FF = 37.0% (20 of 54), FB = 35.2% (19 of 54)], but more Purkinje cells shift or change sign toward predictive FF τ values for Vp and Ap [Vp: FF = 33.9% (21 of 62), FB = 29.0% (18 of 62); Ap: FF = 38.9% (21 of 54), FB = 31.5% (17 of 54)]. Therefore, shifts in the timing of the parameter encoding are common for individual cells. However, at the population level, there is no net change in the FF and FB τ values between baseline and late adapt (FF: F(1,328) = 1.03, NS; FB: F(1,462) = 0, NS, Bonferroni's corrected).
Figure 14.
Population timing sensitivity. The time change (in milliseconds) between baseline and late-adapt optimal τ values (i.e., producing the largest R2 value) was calculated for all significant Purkinje cells (n = 79). Results were binned by five groups according to the time shift (left to right): (1) change sign from FB to FF; (2) significant FF shift; (3) no significant change; (4) significant FB shift; and (5) change sign from FF to FB. A significant shift indicated a change of at least 100 ms.
Additionally, across all parameters and epochs, FF and FB signals provide approximately equivalent R2 values. However, there are more Purkinje cells with significant tuning at the FB τ values. This differs from random tracking in which the population was skewed toward FF τ values (Hewitt et al., 2011). Although the emphasis on FB encoding was unexpected, each experiment involved a new perturbation that may have decreased the predictability and placed the animals in a learning mode with a focus on FB signaling.
Complex spike modulation
A major tenet of the role of the cerebellum in motor learning is based on the Marr–Albus–Ito hypothesis in which complex spike activation in conjunction with parallel fiber input leads to long-term depression at parallel fiber–Purkinje cell synapses (Marr, 1969; Albus, 1971; Ito et al., 1982). Therefore, we evaluated complex spike modulation during the adapt epoch, with a particular interest in whether the mechanical perturbation evoked complex spikes. A total of 49 Purkinje cells were analyzed in which the complex spikes could be identified and discriminated throughout the baseline and adapt periods (see Materials and Methods). During the adapt epoch, the complex spike discharge significantly increased (ANOVA followed by Bonferroni's-corrected Student's t tests) in 11 Purkinje cells either before movement and/or after movement onset. Similar movement onset-related complex spike discharge has been observed during reach movements (Bauswein et al., 1983; Mano et al., 1986; Ojakangas and Ebner, 1994). The complex spike discharge of a Purkinje cell that increased firing before and after movement onset is shown in Figure 15A and the population response in Figure 15B. To evaluate complex spike responses to the perturbation, data from individual trials were realigned on perturbation onset. The complex spike firing of 13 Purkinje cells exhibit significant change in response to the perturbation in one or more of the three perturbation windows. If the analysis is restricted to the first 30 trials of the adapt epoch, a significant increase in complex spike discharge occurred in five Purkinje cells in one of the three time windows after perturbation onset. In the last 30 trials of the adapt period, three Purkinje cells exhibited an increase in complex spike firing in one of the three perturbation time windows. Therefore, during the early trials in which the behavioral learning occurs (Fig. 4), only 10% (5 of 49) of Purkinje cells had a significant change in complex spike discharge. The overall weak effect of the perturbation on the complex spike firing can also be appreciated from the population averages (Fig. 15C).
Discussion
Adaptation to a mechanical perturbation
The monkeys adapted smoothly to a brief mechanical perturbation during reaching. Late-adaptation kinematic profiles are smooth and continuous, without any overt evidence of the mechanical perturbation regardless of perturbation magnitude, sign (assistive or resistive), duration, and start position. Catch trials demonstrate measurable aftereffects, with the movement kinematics approximately opposite in sign (like a mirror image) to those produced during early learning (Fig. 2). Aftereffects confirm that the learned behavior is not simply an improvement in reaction time or reflex response. Instead, the motor system is generating FF commands that effectively counteract the kinematic disturbances produced by the perturbation as found in adaptation studies of grasp (Dugas and Smith, 1992; Flanagan and Wing, 1997; Nowak et al., 2007) and reach (Shadmehr and Mussa-Ivaldi, 1994; Krakauer et al., 2000; Scheidt et al., 2000; Richter et al., 2004).
Learning occurs in the direction of movement (i.e., parallel direction) rather than perpendicular to the movement. Constraining learning to the direction of movement and limiting kinematic errors with the error clamp were essential, as the simple spike discharge is highly tuned to kinematic errors (Popa et al., 2012). Importantly, kinematics before and after learning are highly similar, particularly along the parallel direction. In many learning paradigms, the adapted movements differ from the original baseline movements, including during saccadic adaptation (Catz et al., 2008; Kojima et al., 2010), smooth pursuit learning (Medina and Lisberger, 2008; Medina and Lisberger, 2009), and vestibulo-ocular reflex adaptation (Lisberger and Fuchs, 1978; Miles et al., 1980; Raymond and Lisberger, 1997). Similarly, classical conditioning involves the development of a “new” conditioned response (Koekkoek et al., 2003; Jirenhed et al., 2007), and adaptation to a new visuomotor gain alters reach amplitude (Ojakangas and Ebner, 1992). The high degree of similarity before and after adaptation allowed a direct evaluation of changes in simple spike kinematic encoding not confounded by differing movement kinematics.
Simple spike changes to parameter sensitivity
Regression models based on individual trials without averaging confirm that Purkinje cells in lobules IV–VI of the intermediate and neighboring lateral zones are highly sensitive to movement kinematics. Across the population and for individual cells, Pp and Vp had the most explanatory power (Figs. 9, 11), consistent with other limb movement studies (Marple-Horvat and Stein, 1987; Fortier et al., 1989; Fu et al., 1997; Coltz et al., 1999; Roitman et al., 2005; Hewitt et al., 2011). Individual β regression coefficients change progressively with learning (Fig. 10), including many cells in which the sign reversed. Also, the representation of Pp and Vp changed, either the number of cells or degree of FF or FB signaling. At the population level, there were no clear differences in simple spike adaptation for resistive versus assistive perturbations. Therefore, adapting to the mechanical perturbation involved large encoding changes within individual Purkinje cells and in the population.
Acceleration has the least explanatory power of the kinematic parameters. Across all cells and task epochs, the mean R2 for Ap is >50% smaller than for Pp and Vp, fewer cells are significantly tuned to acceleration across all four epochs (Figs. 9, 11), and fewer cells demonstrate changes in Ap encoding with adaptation (Fig. 10). As detailed in Results, dissociation of whether the acceleration modulation reflects kinematics or dynamics was not possible. However, the weak acceleration modulation matches previously documented weak simple spike encoding of forces or limb EMG (Coltz et al., 1999; Roitman et al., 2005; Pasalar et al., 2006). The limited changes in acceleration matches findings in human force-field learning in which acceleration accounts for only a small component of the change in motor output (Sing et al., 2009).
The changes in simple spike sensitivity to kinematic parameters are consistent with a previous smooth pursuit adaptation study (Medina and Lisberger, 2009). However, in that study, changes in simple spike firing were based on the learned components (i.e., firing and kinematic differences between baseline and late learning). Our analysis tested whether the overall simple spike encoding changed and found that the encoding is dynamic with extensive changes in kinematic encoding with adaptation. Because the movement kinematics in the baseline condition are very similar to those in late learning, changes in the sensitivities truly reflect changes in Purkinje cell encoding of kinematics and not simply an alteration in the movements.
Simple spike changes to parameter timing
The observation that the simple spike firing in 58% of cells changed significantly before the perturbation highlights that discharge timing changes extensively with adaptation. Both FF and FB timing of individual parameters are altered. Furthermore, individual cells exhibit dual temporal representation of parameters as observed during random tracking (Popa et al., 2012). Across the three kinematic parameters, at least one-third of the Purkinje cell τ values demonstrate a substantial shift that changes sign over the course of the adaptation trials (Fig. 14). Changes toward FF and FB τ values are similar for the parameter Pp, but more Purkinje cells shift or change sign toward predictive FF τ values for Vp and Ap. Based on the dominant kinematic parameter for each cell (i.e., parameter with the largest R2 value), we found significant changes in the representations of Pp and Vp.
These dynamic changes imply that the contribution of the cerebellar cortex to adaptation is more complex than the population timing model put forth for saccade adaptation of Purkinje cell firing in the oculomotor vermis (Catz et al., 2005; Dash et al., 2013). In that model, adding late-responding simple spike modulation increases the saccade amplitude, whereas early-responding simple spike modulation decreases it. However, the present results demonstrate widespread simple spike changes in both sensitivity and timing of the kinematic signals. Simple spike timing changes alone may be sufficient for adaptation of saccade amplitude, but the present results demonstrate that more complex alterations occur during limb movements.
During adaptation to the mechanical perturbation, position and velocity encoding underwent the greatest changes in both sensitivity and timing. The results further suggest an evolution over learning in the relative contributions of position and velocity encoding. In humans, a similar evolution in position and velocity representation occurs with exposure to force fields that were interpreted as representing motor primitives responsible for motor adaptation (Sing et al., 2009). Therefore, the cerebellum may be involved in providing this combination of position and velocity signals.
Simple spike adaptation is relatively independent of complex spike modulation
The mechanical perturbation resulted in modulation of the complex spike discharge in a small subset of Purkinje cells and suggests that climbing fiber input is not necessary for simple spike adaptation. Several studies have documented motor learning independent of complex spike activation (Catz et al., 2005; Ke et al., 2009; Dash et al., 2010; Kimpo et al., 2014). Others have documented strong coupling between changes in simple spike activity and movement coupled to climbing fiber activation (Gilbert and Thach, 1977; Medina and Lisberger, 2008; Yang and Lisberger, 2014). Typically, in these studies, simple spike firing decreases, consistent with the Marr–Albus–Ito hypothesis and long-term depression at the parallel fiber–Purkinje cell synapse (Ito, 2001). However, there are numerous forms of synaptic plasticity within the cerebellar cortex, including long-term potentiation at the parallel fiber–Purkinje cell synapse that is independent of complex spike activity (for review, see (D'Angelo and De Zeeuw, 2009; Gao et al., 2012). In the present study, learning-related changes in simple spike firing include increases and decreases, as well as timing alterations. Therefore, multiple plasticity mechanisms are likely involved in the observed changes in simple spike firing.
Compatibility with a forward internal model
Two observations in this study support the concept that Purkinje cells are the output of a forward internal model. First, the simple spike discharge carries both predictive and FB signals about individual kinematic parameters. Having both classes of signals represented may facilitate the required comparisons between predictions and FB that are needed to update and fine tune the predictions of the model (Shadmehr et al., 2010; Izawa and Shadmehr, 2011). Furthermore, learning requires adaptation of both the sensitivity and timing of the kinematic signals, as we observed.
Second, adaptation along the direction of the movement is quite fast, with time constants of decay (τ) ∼13 trials for Pp and Vp and 17 trials for Ap (Fig. 4B). Firing adaptation is much slower than kinematic adaptation (∼30 trials). We interpret these observations to imply that Purkinje cell firing is not the output of an inverse dynamics internal model—that is, it does not encode the motor command. Other studies confirm that Purkinje cells do not encode loads and/or muscle activity (Roitman et al., 2005; Pasalar et al., 2006; Brooks and Cullen, 2013; Dash et al., 2013). Instead, we propose that, in early adaptation, kinematic predictions from the forward internal model are compromised until the inverse dynamics model, located elsewhere in the CNS, first solves the problem of adapting to the mechanical perturbation. The later changes in simple spike activity reflect updating of the forward internal model after the inverse dynamics model output has stabilized (Wolpert and Kawato, 1998; Wolpert et al., 1998; Krakauer et al., 1999). Therefore, the results imply that Purkinje cells in this region of the cerebellar cortex act as a forward internal model (Pasalar et al., 2006; Popa et al., 2012).
Footnotes
This work was supported in part by National Institutes of Health Grants R01 NS18338, F31 NS071686, and T32 GM008244. We thank Michael McPhee for generating graphics and Kris Bettin for preparation of this manuscript. We also thank Dr. Claudia Hendrix for providing statistical advice and Brian Doherty for assisting with data processing.
The authors declare no competing financial interests.
References
- Albus JS. A theory of cerebellar function. Math Biosci. 1971;10:25–61. doi: 10.1016/0025-5564(71)90051-4. [DOI] [Google Scholar]
- Bauswein E, Kolb FP, Leimbeck B, Rubia FJ. Simple and complex spike activity of cerebellar Purkinje cells during active and passive movements in the awake monkey. J Physiol. 1983;339:379–394. doi: 10.1113/jphysiol.1983.sp014722. [DOI] [PMC free article] [PubMed] [Google Scholar]
- Brooks JX, Cullen KE. The primate cerebellum selectively encodes unexpected self-motion. Curr Biol. 2013;23:947–955. doi: 10.1016/j.cub.2013.04.029. [DOI] [PMC free article] [PubMed] [Google Scholar]
- Catz N, Dicke PW, Thier P. Cerebellar complex spike firing is suitable to induce as well as to stabilize motor learning. Curr Biol. 2005;15:2179–2189. doi: 10.1016/j.cub.2005.11.037. [DOI] [PubMed] [Google Scholar]
- Catz N, Dicke PW, Thier P. Cerebellar-dependent motor learning is based on pruning a Purkinje cell population response. Proc Natl Acad Sci U S A. 2008;105:7309–7314. doi: 10.1073/pnas.0706032105. [DOI] [PMC free article] [PubMed] [Google Scholar]
- Coltz JD, Johnson MT, Ebner TJ. Cerebellar Purkinje cell simple spike discharge encodes movement velocity in primates during visuomotor arm tracking. J Neurosci. 1999;19:1782–1803. doi: 10.1523/JNEUROSCI.19-05-01782.1999. [DOI] [PMC free article] [PubMed] [Google Scholar]
- D'Angelo E, De Zeeuw CI. Timing and plasticity in the cerebellum: focus on the granular layer. Trends Neurosci. 2009;32:30–40. doi: 10.1016/j.tins.2008.09.007. [DOI] [PubMed] [Google Scholar]
- Dash S, Catz N, Dicke PW, Thier P. Specific vermal complex spike responses build up during the course of smooth-pursuit adaptation, paralleling the decrease of performance error. Exp Brain Res. 2010;205:41–55. doi: 10.1007/s00221-010-2331-2. [DOI] [PubMed] [Google Scholar]
- Dash S, Dicke PW, Thier P. A vermal Purkinje cell simple spike population response encodes the changes in eye movement kinematics due to smooth pursuit adaptation. Front Syst Neurosci. 2013;7:3. doi: 10.3389/fnsys.2013.00003. [DOI] [PMC free article] [PubMed] [Google Scholar]
- Dugas C, Smith AM. Responses of cerebellar Purkinje cells to slip of a hand-held object. J Neurophysiol. 1992;67:483–495. doi: 10.1152/jn.1992.67.3.483. [DOI] [PubMed] [Google Scholar]
- Flanagan JR, Wing AM. The role of internal models in motion planning and control: evidence from grip force adjustments during movements of hand-held loads. J Neurosci. 1997;17:1519–1528. doi: 10.1523/JNEUROSCI.17-04-01519.1997. [DOI] [PMC free article] [PubMed] [Google Scholar]
- Fortier PA, Kalaska JF, Smith AM. Cerebellar neuronal activity related to whole-arm reaching movements in the monkey. J Neurophysiol. 1989;62:198–211. doi: 10.1152/jn.1989.62.1.198. [DOI] [PubMed] [Google Scholar]
- Fu QG, Flament D, Coltz JD, Ebner TJ. Relationship of cerebellar Purkinje cell simple spike discharge to movement kinematics in the monkey. J Neurophysiol. 1997;78:478–491. doi: 10.1152/jn.1997.78.1.478. [DOI] [PubMed] [Google Scholar]
- Gao Z, van Beugen BJ, De Zeeuw CI. Distributed synergistic plasticity and cerebellar learning. Nat Rev Neurosci. 2012;13:619–635. doi: 10.1038/nrn3312. [DOI] [PubMed] [Google Scholar]
- Gilbert PF, Thach WT. Purkinje cell activity during motor learning. Brain Res. 1977;128:309–328. doi: 10.1016/0006-8993(77)90997-0. [DOI] [PubMed] [Google Scholar]
- Golla H, Tziridis K, Haarmeier T, Catz N, Barash S, Thier P. Reduced saccadic resilience and impaired saccadic adaptation due to cerebellar disease. Eur J Neurosci. 2008;27:132–144. doi: 10.1111/j.1460-9568.2007.05996.x. [DOI] [PubMed] [Google Scholar]
- Gomi H, Shidara M, Takemura A, Inoue Y, Kawano K, Kawato M. Temporal firing patterns of Purkinje cells in the cerebellar ventral paraflocculus during ocular following responses in monkeys I. Simple spikes. J Neurophysiol. 1998;80:818–831. doi: 10.1152/jn.1998.80.2.818. [DOI] [PubMed] [Google Scholar]
- Hewitt AL, Popa LS, Pasalar S, Hendrix CM, Ebner TJ. Representation of limb kinematics in Purkinje cell simple spike discharge is conserved across multiple tasks. J Neurophysiol. 2011;106:2232–2247. doi: 10.1152/jn.00886.2010. [DOI] [PMC free article] [PubMed] [Google Scholar]
- Imamizu H, Miyauchi S, Tamada T, Sasaki Y, Takino R, Pütz B, Yoshioka T, Kawato M. Human cerebellar activity reflecting an acquired internal model of a new tool. Nature. 2000;403:192–195. doi: 10.1038/35003194. [DOI] [PubMed] [Google Scholar]
- Ito M. Cerebellar long-term depression: characterization, signal transduction, and functional roles. Physiol Rev. 2001;81:1143–1195. doi: 10.1152/physrev.2001.81.3.1143. [DOI] [PubMed] [Google Scholar]
- Ito M, Sakurai M, Tongroach P. Climbing fibre induced depression of both mossy fibre responsiveness and glutamate sensitivity of cerebellar Purkinje cells. J Physiol. 1982;324:113–134. doi: 10.1113/jphysiol.1982.sp014103. [DOI] [PMC free article] [PubMed] [Google Scholar]
- Izawa J, Shadmehr R. Learning from sensory and reward prediction errors during motor adaptation. PLoS Comput Biol. 2011;7:e1002012. doi: 10.1371/journal.pcbi.1002012. [DOI] [PMC free article] [PubMed] [Google Scholar]
- Jirenhed DA, Bengtsson F, Hesslow G. Acquisition, extinction, and reacquisition of a cerebellar cortical memory trace. J Neurosci. 2007;27:2493–2502. doi: 10.1523/JNEUROSCI.4202-06.2007. [DOI] [PMC free article] [PubMed] [Google Scholar]
- Jörntell H, Hansel C. Synaptic memories upside down: bidirectional plasticity at cerebellar parallel fiber-Purkinje cell synapses. Neuron. 2006;52:227–238. doi: 10.1016/j.neuron.2006.09.032. [DOI] [PubMed] [Google Scholar]
- Kawato M, Kuroda T, Imamizu H, Nakano E, Miyauchi S, Yoshioka T. Internal forward models in the cerebellum: fMRI study on grip force and load force coupling. Prog Brain Res. 2003;142:171–188. doi: 10.1016/S0079-6123(03)42013-X. [DOI] [PubMed] [Google Scholar]
- Ke MC, Guo CC, Raymond JL. Elimination of climbing fiber instructive signals during motor learning. Nat Neurosci. 2009;12:1171–1179. doi: 10.1038/nn.2366. [DOI] [PMC free article] [PubMed] [Google Scholar]
- Kenney DA. Correlation and causality. New York: Wiley; 1979. [Google Scholar]
- Khaliq ZM, Raman IM. Axonal propagation of simple and complex spikes in cerebellar Purkinje neurons. J Neurosci. 2005;25:454–463. doi: 10.1523/JNEUROSCI.3045-04.2005. [DOI] [PMC free article] [PubMed] [Google Scholar]
- Kimpo RR, Rinaldi JM, Kim CK, Payne HL, Raymond JL. Gating of neural error signals during motor learning. Elife. 2014;3:e02076. doi: 10.7554/eLife.02076. [DOI] [PMC free article] [PubMed] [Google Scholar]
- Koekkoek SK, Hulscher HC, Dortland BR, Hensbroek RA, Elgersma Y, Ruigrok TJ, De Zeeuw CI. Cerebellar LTD and learning-dependent timing of conditioned eyelid responses. Science. 2003;301:1736–1739. doi: 10.1126/science.1088383. [DOI] [PubMed] [Google Scholar]
- Kojima Y, Soetedjo R, Fuchs AF. Changes in simple spike activity of some Purkinje cells in the oculomotor vermis during saccade adaptation are appropriate to participate in motor learning. J Neurosci. 2010;30:3715–3727. doi: 10.1523/JNEUROSCI.4953-09.2010. [DOI] [PMC free article] [PubMed] [Google Scholar]
- Krakauer JW, Ghilardi MF, Ghez C. Independent learning of internal models for kinematic and dynamic control of reaching. Nat Neurosci. 1999;2:1026–1031. doi: 10.1038/14826. [DOI] [PubMed] [Google Scholar]
- Krakauer JW, Pine ZM, Ghilardi MF, Ghez C. Learning of visuomotor transformations for vectorial planning of reaching trajectories. J Neurosci. 2000;20:8916–8924. doi: 10.1523/JNEUROSCI.20-23-08916.2000. [DOI] [PMC free article] [PubMed] [Google Scholar]
- Krakauer JW, Ghilardi MF, Mentis M, Barnes A, Veytsman M, Eidelberg D, Ghez C. Differential cortical and subcortical activations in learning rotations and gains for reaching: a PET study. J Neurophysiol. 2004;91:924–933. doi: 10.1152/jn.00675.2003. [DOI] [PubMed] [Google Scholar]
- Lisberger SG, Fuchs AF. Role of primate flocculus during rapid behavioral modification of vestibuloocular reflex. I. Purkinje cell activity during visually guided horizontal smooth-pursuit eye movements and passive head rotation. J Neurophysiol. 1978;41:733–763. doi: 10.1152/jn.1978.41.3.733. [DOI] [PubMed] [Google Scholar]
- Mano N, Yamamoto K. Simple-spike activity of cerebellar Purkinje cells related to visually guided wrist tracking movement in the monkey. J Neurophysiol. 1980;43:713–728. doi: 10.1152/jn.1980.43.3.713. [DOI] [PubMed] [Google Scholar]
- Mano N, Kanazawa I, Yamamoto K. Complex-spike activity of cerebellar Purkinje cells related to wrist tracking movement in monkey. J Neurophysiol. 1986;56:137–158. doi: 10.1152/jn.1986.56.1.137. [DOI] [PubMed] [Google Scholar]
- Marple-Horvat DE, Stein JF. Cerebellar neuronal activity related to arm movements in trained rhesus monkeys. J Physiol. 1987;394:351–366. doi: 10.1113/jphysiol.1987.sp016874. [DOI] [PMC free article] [PubMed] [Google Scholar]
- Marr D. A theory of cerebellar cortex. J Physiol. 1969;202:437–470. doi: 10.1113/jphysiol.1969.sp008820. [DOI] [PMC free article] [PubMed] [Google Scholar]
- Maschke M, Gomez CM, Ebner TJ, Konczak J. Hereditary cerebellar ataxia progressively impairs force adaptation during goal-directed arm movements. J Neurophysiol. 2004;91:230–238. doi: 10.1152/jn.00557.2003. [DOI] [PubMed] [Google Scholar]
- Medina JF, Lisberger SG. Links from complex spikes to local plasticity and motor learning in the cerebellum of awake-behaving monkeys. Nat Neurosci. 2008;11:1185–1192. doi: 10.1038/nn.2197. [DOI] [PMC free article] [PubMed] [Google Scholar]
- Medina JF, Lisberger SG. Encoding and decoding of learned smooth pursuit eye movements in the floccular complex of the monkey cerebellum. J Neurophysiol. 2009;102:2039–2054. doi: 10.1152/jn.00075.2009. [DOI] [PMC free article] [PubMed] [Google Scholar]
- Meyer-Lohmann J, Hore J, Brooks VB. Cerebellar participation in generation of prompt arm movements. J Neurophysiol. 1977;40:1038–1050. doi: 10.1152/jn.1977.40.5.1038. [DOI] [PubMed] [Google Scholar]
- Miles FA, Braitman DJ, Dow BM. Long-term adaptive changes in primate vestibuloocular reflex. IV. Electrophysiological observations in flocculus of adapted monkeys. J Neurophysiol. 1980;43:1477–1493. doi: 10.1152/jn.1980.43.5.1477. [DOI] [PubMed] [Google Scholar]
- Miocinovic S, Zhang J, Xu W, Russo GS, Vitek JL, McIntyre CC. Stereotactic neurosurgical planning, recording, and visualization for deep brain stimulation in non-human primates. J Neurosci Methods. 2007;162:32–41. doi: 10.1016/j.jneumeth.2006.12.007. [DOI] [PMC free article] [PubMed] [Google Scholar]
- Monsivais P, Clark BA, Roth A, Häusser M. Determinants of action potential propagation in cerebellar Purkinje cell axons. J Neurosci. 2005;25:464–472. doi: 10.1523/JNEUROSCI.3871-04.2005. [DOI] [PMC free article] [PubMed] [Google Scholar]
- Morton SM, Bastian AJ. Cerebellar contributions to locomotor adaptations during splitbelt treadmill walking. J Neurosci. 2006;26:9107–9116. doi: 10.1523/JNEUROSCI.2622-06.2006. [DOI] [PMC free article] [PubMed] [Google Scholar]
- Müller F, Dichgans J. Impairments of precision grip in two patients with acute unilateral cerebellar lesions: a simple parametric test for clinical use. Neuropsychologia. 1994;32:265–269. doi: 10.1016/0028-3932(94)90012-4. [DOI] [PubMed] [Google Scholar]
- Nowak DA, Hermsdörfer J, Rost K, Timmann D, Topka H. Predictive and reactive finger force control during catching in cerebellar degeneration. Cerebellum. 2004;3:227–235. doi: 10.1080/14734220410019057. [DOI] [PubMed] [Google Scholar]
- Nowak DA, Topka H, Timmann D, Boecker H, Hermsdörfer J. The role of the cerebellum for predictive control of grasping. Cerebellum. 2007;6:7–17. doi: 10.1080/14734220600776379. [DOI] [PubMed] [Google Scholar]
- Ojakangas CL, Ebner TJ. Purkinje cell complex and simple spike changes during a voluntary arm movement learning task in the monkey. J Neurophysiol. 1992;68:2222–2236. doi: 10.1152/jn.1992.68.6.2222. [DOI] [PubMed] [Google Scholar]
- Ojakangas CL, Ebner TJ. Purkinje cell complex spike activity during voluntary motor learning: relationship to kinematics. J Neurophysiol. 1994;72:2617–2630. doi: 10.1152/jn.1994.72.6.2617. [DOI] [PubMed] [Google Scholar]
- Pasalar S, Roitman AV, Durfee WK, Ebner TJ. Force field effects on cerebellar Purkinje cell discharge with implications for internal models. Nat Neurosci. 2006;9:1404–1411. doi: 10.1038/nn1783. [DOI] [PubMed] [Google Scholar]
- Popa LS, Hewitt AL, Ebner TJ. Predictive and feedback performance errors are signaled in the simple spike discharge of individual Purkinje cells. J Neurosci. 2012;32:15345–15358. doi: 10.1523/JNEUROSCI.2151-12.2012. [DOI] [PMC free article] [PubMed] [Google Scholar]
- Prsa M, Thier P. The role of the cerebellum in saccadic adaptation as a window into neural mechanisms of motor learning. Eur J Neurosci. 2011;33:2114–2128. doi: 10.1111/j.1460-9568.2011.07693.x. [DOI] [PubMed] [Google Scholar]
- Raymond JL, Lisberger SG. Multiple subclasses of Purkinje cells in the primate floccular complex provide similar signals to guide learning in the vestibulo-ocular reflex. Learn Mem. 1997;3:503–518. doi: 10.1101/lm.3.6.503. [DOI] [PubMed] [Google Scholar]
- Richter S, Maschke M, Timmann D, Konczak J, Kalenscher T, Illenberger AR, Kalveram K. Adaptive motor behavior of cerebellar patients during exposure to unfamiliar external forces. J Mot Behav. 2004;36:28–38. doi: 10.3200/JMBR.36.1.28-38. [DOI] [PubMed] [Google Scholar]
- Roitman AV, Pasalar S, Johnson MT, Ebner TJ. Position, direction of movement, and speed tuning of cerebellar Purkinje cells during circular manual tracking in monkey. J Neurosci. 2005;25:9244–9257. doi: 10.1523/JNEUROSCI.1886-05.2005. [DOI] [PMC free article] [PubMed] [Google Scholar]
- Scheidt RA, Reinkensmeyer DJ, Conditt MA, Rymer WZ, Mussa-Ivaldi FA. Persistence of motor adaptation during constrained, multi-joint, arm movements. J Neurophysiol. 2000;84:853–862. doi: 10.1152/jn.2000.84.2.853. [DOI] [PubMed] [Google Scholar]
- Shadmehr R, Holcomb HH. Neural correlates of motor memory consolidation. Science. 1997;277:821–825. doi: 10.1126/science.277.5327.821. [DOI] [PubMed] [Google Scholar]
- Shadmehr R, Mussa-Ivaldi FA. Adaptive representation of dynamics during learning of a motor task. J Neurosci. 1994;14:3208–3224. doi: 10.1523/JNEUROSCI.14-05-03208.1994. [DOI] [PMC free article] [PubMed] [Google Scholar]
- Shadmehr R, Smith MA, Krakauer JW. Error correction, sensory prediction, and adaptation in motor control. Annu Rev Neurosci. 2010;33:89–108. doi: 10.1146/annurev-neuro-060909-153135. [DOI] [PubMed] [Google Scholar]
- Shidara M, Kawano K, Gomi H, Kawato M. Inverse-dynamics model eye movement control by Purkinje cells in the cerebellum. Nature. 1993;365:50–52. doi: 10.1038/365050a0. [DOI] [PubMed] [Google Scholar]
- Sing GC, Joiner WM, Nanayakkara T, Brayanov JB, Smith MA. Primitives for motor adaptation reflect correlated neural tuning to position and velocity. Neuron. 2009;64:575–589. doi: 10.1016/j.neuron.2009.10.001. [DOI] [PubMed] [Google Scholar]
- Smith MA, Shadmehr R. Intact ability to learn internal models of arm dynamics in Huntington's disease but not cerebellar degeneration. J Neurophysiol. 2005;93:2809–2821. doi: 10.1152/jn.00943.2004. [DOI] [PubMed] [Google Scholar]
- Stone LS, Lisberger SG. Visual responses of Purkinje cells in the cerebellar flocculus during smooth-pursuit eye movements in monkeys. I. Simple spikes. J Neurophysiol. 1990;63:1241–1261. doi: 10.1152/jn.1990.63.5.1241. [DOI] [PubMed] [Google Scholar]
- Takagi M, Zee DS, Tamargo RJ. Effects of lesions of the oculomotor cerebellar vermis on eye movements in primate: smooth pursuit. J Neurophysiol. 2000;83:2047–2062. doi: 10.1152/jn.2000.83.4.2047. [DOI] [PubMed] [Google Scholar]
- Thach WT. Discharge of Purkinje and cerebellar nuclear neurons during rapidly alternating arm movements in the monkey. J Neurophysiol. 1968;31:785–797. doi: 10.1152/jn.1968.31.5.785. [DOI] [PubMed] [Google Scholar]
- Wagner MJ, Smith MA. Shared internal models for feedforward and feedback control. J Neurosci. 2008;28:10663–10673. doi: 10.1523/JNEUROSCI.5479-07.2008. [DOI] [PMC free article] [PubMed] [Google Scholar]
- Wolpert DM, Kawato M. Multiple paired forward and inverse models for motor control. Neural Netw. 1998;11:1317–1329. doi: 10.1016/S0893-6080(98)00066-5. [DOI] [PubMed] [Google Scholar]
- Wolpert DM, Miall RC, Kawato M. Internal models in the cerebellum. Trends Cogn Sci. 1998;2:338–347. doi: 10.1016/S1364-6613(98)01221-2. [DOI] [PubMed] [Google Scholar]
- Xu-Wilson M, Chen-Harris H, Zee DS, Shadmehr R. Cerebellar contributions to adaptive control of saccades in humans. J Neurosci. 2009;29:12930–12939. doi: 10.1523/JNEUROSCI.3115-09.2009. [DOI] [PMC free article] [PubMed] [Google Scholar]
- Yamamoto K, Kawato M, Kotosaka S, Kitazawa S. Encoding of movement dynamics by Purkinje cell simple spike activity during fast arm movements under resistive and assistive force fields. J Neurophysiol. 2007;97:1588–1599. doi: 10.1152/jn.00206.2006. [DOI] [PubMed] [Google Scholar]
- Yang Y, Lisberger SG. Purkinje-cell plasticity and cerebellar motor learning are graded by complex-spike duration. Nature. 2014;510:529–532. doi: 10.1038/nature13282. [DOI] [PMC free article] [PubMed] [Google Scholar]


