Abstract
The presented work has two goals. First, to demonstrate the feasibility of accurately characterizing a proton radiation field at treatment head exit for Monte Carlo dose calculation of active scanning patient treatments. Second, to show that this characterization can be done based on measured depth dose curves and spot size alone, without consideration of the exact treatment head delivery system. This is demonstrated through calibration of a Monte Carlo code to the specific beam lines of two institutions, Massachusetts General Hospital (MGH) and Paul Scherrer Institute (PSI).
Comparison of simulations modeling the full treatment head at MGH to ones employing a parameterized phase space of protons at treatment head exit reveals the adequacy of the method for patient simulations. The secondary particle production in the treatment head is typically below 0.2% of primary fluence, except for low–energy electrons (<0.6MeV for 230MeV protons), whose contribution to skin dose is negligible. However, there is significant difference between the two methods in the low-dose penumbra, making full treatment head simulations necessary to study out-of field effects such as secondary cancer induction.
To calibrate the Monte Carlo code to measurements in a water phantom, we use an analytical Bragg peak model to extract the range-dependent energy spread at the two institutions, as this quantity is usually not available through measurements. Comparison of the measured with the simulated depth dose curves demonstrates agreement within 0.5mm over the entire energy range. Subsequently, we simulate three patient treatments with varying anatomical complexity (liver, head and neck and lung) to give an example how this approach can be employed to investigate site-specific discrepancies between treatment planning system and Monte Carlo simulations.
Keywords: Active Scanning Proton Therapy, Monte Carlo Simulation, Patient Dose Calculation
1. Introduction
Intensity Modulated Proton Therapy (IMPT) is becoming widely available as more proton facilities become equipped with active scanning technology. In IMPT steep dose-gradients can occur within the target, which makes the treatment more sensitive to uncertainties in the exact position of the individual Bragg peaks. Lomax studied how changes in CT values affect IMPT plans, concluding that especially plans with steep intra-field gradients are highly sensitive to such errors (Lomax 2008). Albertini et al. examined in detail the usefulness of margins in accounting for setup and range uncertainties in IMPT (Albertini et al 2011). They concluded that while safety margins are adequate to increase the robustness of plans with uniform fields and those with low in-field gradients, highly modulated IMPT plans also show degradations of dose conformity in the middle of the target volume.
Monte Carlo methods generally outperform analytical algorithms commonly used in treatment planning systems in the modeling of multiple Coulomb scattering (MCS) in complex geometries. Especially for treatment sites such as the head and neck region and the lung, in which bone-soft tissue or even bone-air interfaces are in the beam path, MCS could lead to a distortion of the field and inadequate target coverage (Schuemann et al 2014). The increased accuracy of Monte Carlo dose calculation compared to a clinical treatment planning system (TPS) has recently been demonstrated in a lung phantom (Grassberger et al 2014), and its impact on range margins has been shown (Paganetti 2012).
While a full Monte Carlo simulation of the entire treatment head geometry might serve as a gold standard, a characterization of the beam at treatment head exit has two major advantages. On one hand it significantly reduces computing time, as the time-intensive simulation through the magnetic fields of the scanning magnets and the various beam monitoring devices (ionization chambers, strip chambers and others) becomes redundant. On the other it does not require exact blueprints and material compositions of all treatment head elements.
A radiation field can be parameterized using a phase space containing basic characteristics of individual particles crossing a plane. A parameterization of the beam size, angular divergence and energy spread across the range of deliverable energies can be used to create a phase space as input for Monte Carlo simulations, i.e. a file containing the position and momentum of each individual proton.
The aim of this work is to
perform simulations of the MGH scanning treatment head to assess secondary particle production and the feasibility and accuracy of phase space based simulations
outline a generic method to determine the energy spread σE of measured beam data using MGH and PSI as an example
translate treatment plans to proton phase spaces at treatment head exit and demonstrate its use for absolute dose Monte Carlo simulations in patients
2. Materials and Methods
2.1 Measurements & Monte Carlo simulations
Experimental data from the gantry at Massachusetts General Hospital (MGH) and Paul Scherrer Institute (PSI) were obtained using wide parallel-plate ionization chamber with diameters of 81.6mm and 80mm respectively. Monte Carlo simulations were performed with TOPAS (Perl et al 2012), a toolkit for particle simulations tailored to proton therapy applications, which is layered on top of Geant4 (Agostinelli et al 2003). The selected physics models were the standard model for electromagnetic interactions, the HElastic and binary cascade nuclear interaction models. The threshold for secondary particle production was set to 50 μm.
For the water phantom simulations, a zero emittance beam was generated in front of a block of water. The detector in the simulations was a cylindrical volume with a diameter equal to that of the measurement device (81.6/80.0 mm in the case of MGH/PSI) and subdivided into slabs of 0.2 mm in beam direction.
2.2 Treatment planning
We used the in-house developed software ASTROID (Kooy et al 2010) for active scanning treatment planning. ASTROID employs a pencil-beam algorithm based on the work by Hong et al (Hong et al 1996), which takes into account multiple Coulomb scattering from beam modifying devices in the beam and also contributions from within the patient, using a generalized form of Highland's formula (Gottschalk et al 1993). The patient is herein modeled as an infinitely thick degrader, where scattering processes increase the radial emittance and with it the standard deviation of the radial distributions of the pencil beam profile.
The information generated by the planning system to deliver each field consists of a list of spots that are defined by energy, x and y position at the isocenter plane and the weight of each spot given by the number of protons to be delivered in Gigaprotons (Gp = 10e9 protons).
2.3 Analytical Bragg peak model
To model the impact of the initial energy spread on the shape of the Bragg peak, we employ a model developed by Bortfeld (Bortfeld 1997). The model is based on a power-law relationship describing the dependency between range and energy
| (1) |
with range R0 and energy E. For range straggling within the medium, a Gaussian distribution of ranges of individual protons within a Bragg peak is assumed.
Assuming a small initial energy spread σE,0<<E0, the power-law governing the range-energy relation can be linearized around E0, allowing to consider it as a range spectrum using (1), added to that of the mono-energetic beam
| (2) |
Including a linear model for the fluence reduction based on Janni's tables (Janni 1982), the depth dose curve can be written using the gamma function Γ(x) and the parabolic cylinder functions Dy as
| (3) |
with
| (4) |
where Φ0 is the primary fluence, β is the slope parameter of the fluence reduction relation and γ the fraction of locally absorbed energy from nuclear interactions. The parameters α and p stem from the range-energy relationship in (1). For a more detailed derivation of (4) see (Bortfeld 1997).
3. Results
3.1. Secondary Particle Production in Treatment Head & Phase Space approximation
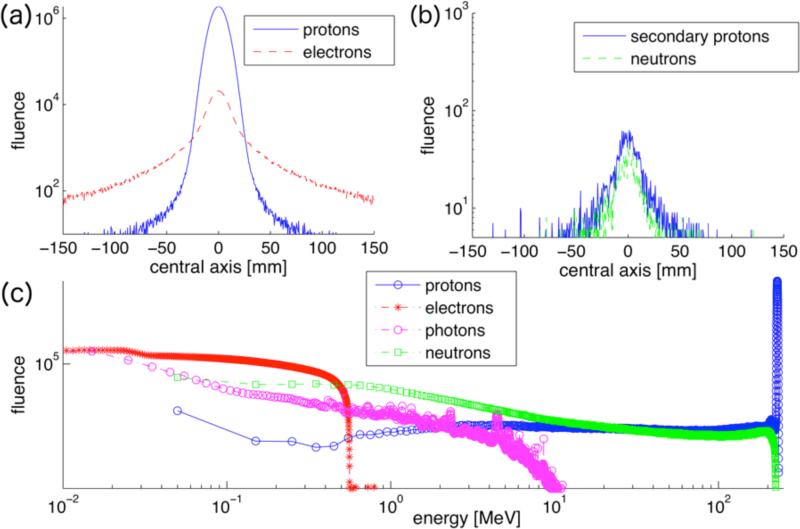
Table 1 shows the particle fluence at treatment head exit as percentage of protons simulated at treatment head entrance for the maximum and minimum energies deliverable by the MGH delivery system (91 and 230 MeV). As expected, secondary proton, neutron and photon production varies only slightly with beam energy, as the nuclear interaction cross sections are almost constant in this energy range (Janni 1982). The electrons stem mainly from electromagnetic interactions, and the slightly higher yield of the 91 MeV beam reflects the higher electronic stopping power at lower energies. Due to the low water-equivalent thickness of the treatment head (3mm total for all monitoring equipment within the beam path), the primary proton fluence loss is small, 0.58/0.3% for the 91/230 MeV beam respectively, and increases with decreasing energy. This is because lower energy protons have a higher probability to undergo wide-angle scattering, so they will not be scored at treatment head exit because of absorption in the device walls or because they miss the 2×2m scoring plane. This also explains the higher number of secondary protons for the 230 MeV beam. The probability of forward emission is increasing with higher energy.
Table 1.
Number of secondary particles at the treatment head exit as percentage of protons simulated at treatment head entrance. The simulation considers 109 protons and a scoring plane of 2×2m at isocenter.
| 91 MeV | 230 MeV | |
|---|---|---|
| protons | 99.42 % | 99.70 % |
| secondary protons | 0.12 % | 0.17 % |
| neutrons | 0.15 % | 0.18 % |
| electrons | 6.29 % | 4.97 % |
| photons | 0.19 % | 0.17 % |
Figure 1 shows the fluence profiles along the central axis and the energy spectrum of a 230MeV proton beam as well as the secondary particles scored at treatment head exit. The fluence profiles illustrate the wider distributions of secondary particles compared to the proton beam. The lateral profile of the proton beam at treatment head exit (figure 1a) exhibits tails, leading to a deviation from a Gaussian profile. The maximum electron energy is around 500keV (figure 1c). To investigate the impact of secondary electrons on skin dose we assume that their total energy is deposited in skin (thickness 70 micrometers) within 1 sigma of the beam. Even in such a case, the dose deposited by secondary electrons is on the order of 10−10Gy for a typical patient treatment, i.e. a 400cc target in 15cm depth treated to 2Gy. The neutron and photon energy spectra are dominated by low-energy particles with a maximum energy of about 200MeV for neutrons and 10MeV for photons. The secondary proton fluence in figure 1c shows the low-energy tail of the proton energy spectrum and changes little with energy.
Figure 1.
Simulated fluence profiles of a 230 MeV pencil beam scored at treatment head exit. (a) primary protons and electrons, (b) secondary protons and neutrons. 109 protons inserted at treatment head entrance, scored in a 300×300mm plane divided in 0.5×0.5mm bins at treatment head exit. (c): kinetic energy spectrum of protons and secondary particles at treatment head exit.
The fluence and energy spectra for the 91MeV beam (not shown here) look similar to figure 1, exhibiting slightly broader secondary proton fluence spectra and energy spectra with the maximum energy capped at around 90 MeV for neutrons and 200keV for electrons, and a similar spectrum of photons. So even though there are slightly more secondary electrons created by the 91MeV beam as indicated in Table 1, they contribute less dose due to their on average lower energies.
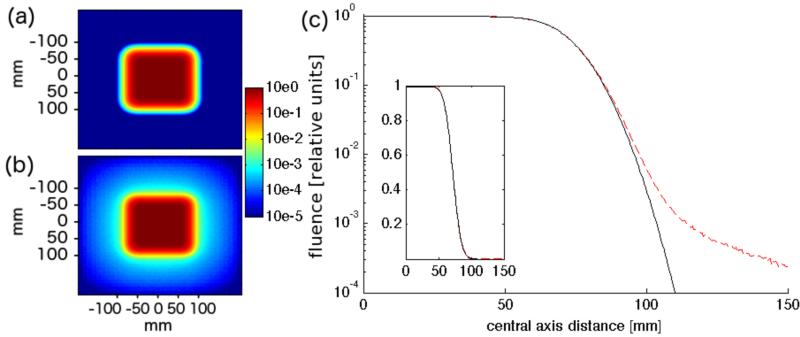
Figure 2 analyzes to what extent the deviation of the fluence from a Gaussian profile affects a square field at treatment head exit. The field consists of 100 regularly spaced pencil beams arranged in a 10x10cm square. To show the largest effect, the data shown is for the lowest energy (91 MeV), since the scattering power is inversely proportional to (pv)2, where p and v are momentum and velocity of the particle. As the fluence profile shows, the deviation becomes significant in the low fluence region of the lateral penumbra, below 1% of the in-field fluence.
Figure 2.
Logarithmic fluence map of 10x10cm field consisting of one energy layer (91 MeV) using the phase space approximation (a) and full treatment head simulation (b). (c) shows a comparison of the two fluence distributions along the central axis (black: phase space approximation, dotted red: full treatment head simulation), inset shows data on linear scale.
In our phase space approach, where the beam has been parameterized at treatment head exit, the entire particle fluence is concentrated in the primary Gaussian, which is valid in a broad field like depicted in figure 2. For the extreme case of a single spot and the lowest energy (91MeV), the phase space approximation leads to an overestimation of the fluence in the center of spot by ~2.0%. Thus, for very small fields with only a few spots and low beam energy, the fluence reduction in the treatment head might have to be considered with an additional correction term, e.g. in the form of second Gaussian with a wider standard deviation.
3.2 Calibration of Depth Dose Curves in Water
The phase space based approach necessitates a parameterization of the following parameters over the range of deliverable penetration depths: energy E0, energy spread σE, beam width σx,y and angular divergence. Additionally, the exact position of the x/y scanning magnets is needed to calculate the exact momentum direction of spots delivered off-center.
To obtain the energy E0, the energy-range relationship as predicted by the Monte Carlo code can be used. The beam width σx,y is available from commissioning measurements and is a necessary input for the treatment planning system. The angular divergence can be neglected if the beam is not heavily convergent or divergent, as the simulations start right in front of the patient surface, from which point on scattering dominates the angular distribution and diminishes the impact of any slight initial angular convergence/divergence. The last focusing magnet is located in our case 3m upstream from isocenter, justifying a parallel beam in all simulation.
The only remaining parameter is the energy spread σE of the beam. This property is beam line dependent and not available from commissioning measurements, as it is typically not needed as input for the treatment planning system. Furthermore, a direct measurement of σE with sufficient accuracy is difficult.
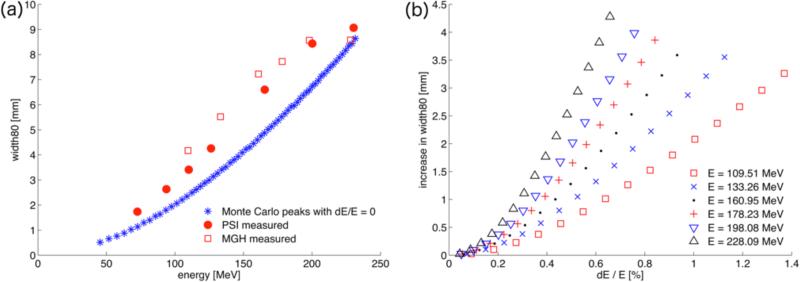
To derive the energy-spread we use the width80, the distance of the two points on the depth dose curve that equal 80% of the maximum dose of the measured depth dose curves. The width80 is sensitive to the initial energy spread of the beam and is readily available through standard commissioning or quality assurance measurements. Figure 3a shows the width80 as a function of energy for mono-energetic Monte Carlo Bragg curves together with the measured width80 from MGH and PSI. To derive the energy spread for the simulations, we can employ Bortfeld's analytical model (described in section 2.3) to calibrate the width80 of the mono-energetic beams to match those obtained experimentally.
Figure 3.
(a) The beam width80 in mm for pristine Monte Carlo Bragg curves with dE/E=0 compared with measurements at MGH and PSI. (b) The predictions of the analytical model for the increase in width80 as a function of energy spread (in percent of the initial energy) for different energies.
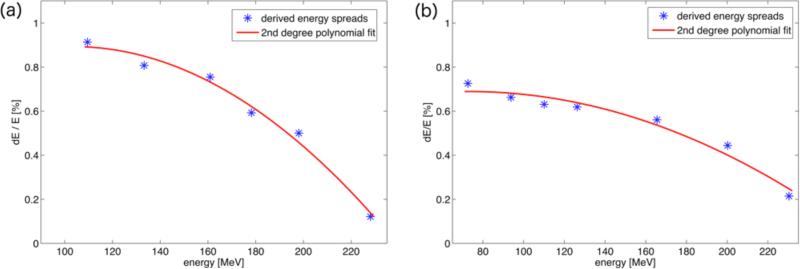
Figure 3(b) shows the result of the analytical model for different energies: the increase in width80 is plotted as a function of initial energy spread in %. The higher energetic peaks are more sensitive to relatively small variations. Above a non-linear region for very low energy spreads (<0.2%) the relationship appears almost linear. Solving for the desired increase in width80 results in the energy spread values displayed in figure 4, which shows the initial energy spread as a function of initial proton energy for the MGH and PSI beam delivery systems.
Figure 4.
Derived energy spreads according to the fit of the analytical model to the measured width80 for MGH (a) and PSI (b). The energy spreads are given in percent of the initial energy. The line represents a cubic polynomial fit.
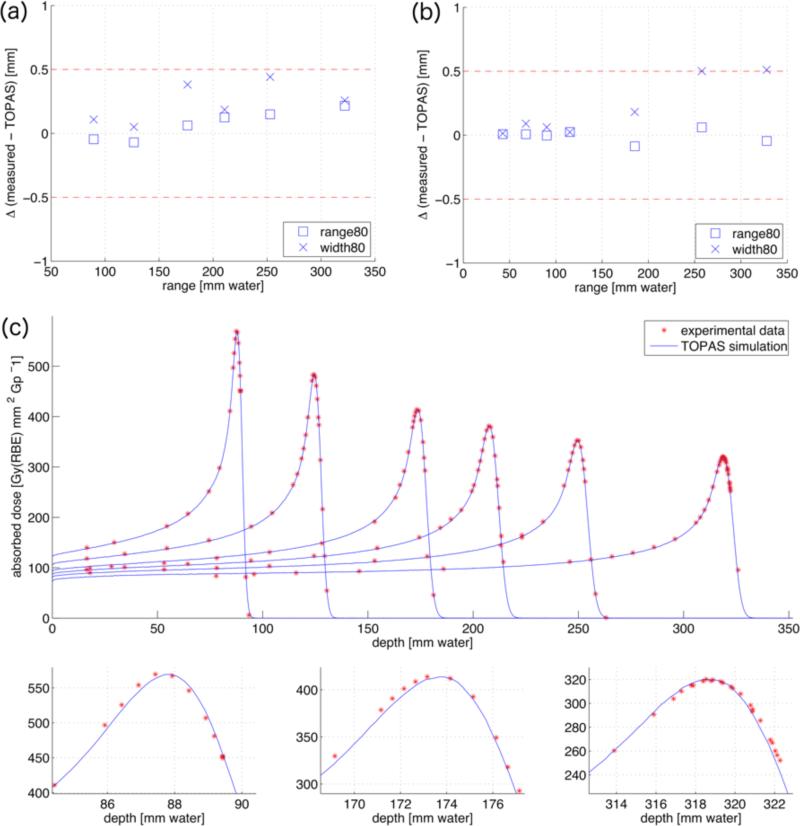
To validate the parameterization shown in figure 4, we simulate the measured peaks with the deduced energy spread σE. The top row of figure 5 shows the difference between measured and simulated range and width80 as a function of range for MGH and PSI, respectively. The deviations are within 0.5 mm. Figure 5c displays the comparison of depth dose curves obtained from the Monte Carlo simulations and obtained experimentally at the MGH delivery system. The upper part shows six peaks with varying range, highlighting the good agreement with respect to the peak-to-plateau ratios for all ranges. The magnifications of three of the peaks in the lower part further illustrate the match of the exact peak shapes and ranges.
Figure 5.
Differences in range80 (squares) and width80 (crosses) in mm between the Monte Carlo simulations and the measured depth dose distributions for different ranges for MGH (a) and PSI (b), respectively. (c): Monte Carlo simulations (blue lines) compared with measurements (red stars) for the calibration dataset from MGH. The simulations are plotted in units of Gy(RBE) mm2 Gp−1, the measurements are normalized to the maximum dose. The lower part shows magnifications of the first, third and sixth peak.
3.3 Interface Treatment Planning – Monte Carlo
The TPS exports a list of spots, given by energy, position at isocenter and spotweight wi in Gigaprotons. The spot position, the position of the scanning magnets and the exact location of the treatment head relative to isocenter can be transformed to position and momentum direction at treatment head exit. At the patient surface we assume no angular divergence of the protons within a given spot. Together with the tabulated energy-dependent spot size all necessary information to create a phase space distribution of protons at treatment head exit is thus in place.
To determine the number of protons per spot, a spotfactor S is introduced, which determines the number of protons to be simulated per Gp prescribed by the TPS. The Bragg peak database within the treatment planning system has been corrected with a small range dependent correction factor CD(range80), which is necessary to fit the absolute dose in the center of a broad field to measurements (for details see (Clasie et al 2012)). Including this correction,
| (5) |
protons per spot are simulated. Generally a spotfactor of 105 is applied, i.e. 1 in 104 protons actually delivered to the patient are simulated. During the simulation the dose is scored in Gray and scaled by 109/S after the simulation to yield the absolute dose in the patient. Furthermore, the physical dose is scaled by 1.1 to account for the increased relative biological effectiveness (RBE) of protons, yielding the dose in Gy(RBE).
3.3 Patient simulations
To demonstrate the implementation of the phase space parameterization, fields for three different patients with varying degrees of geometrical complexity (liver, head and neck, and lung) are analyzed. The patients have been treated with passively scattered proton therapy. The same beam directions were applied to create active scanning plans. The spotfactor S used for the Monte Carlo simulations was variable, so as to simulate approximately the same number of protons (~107) for each field.
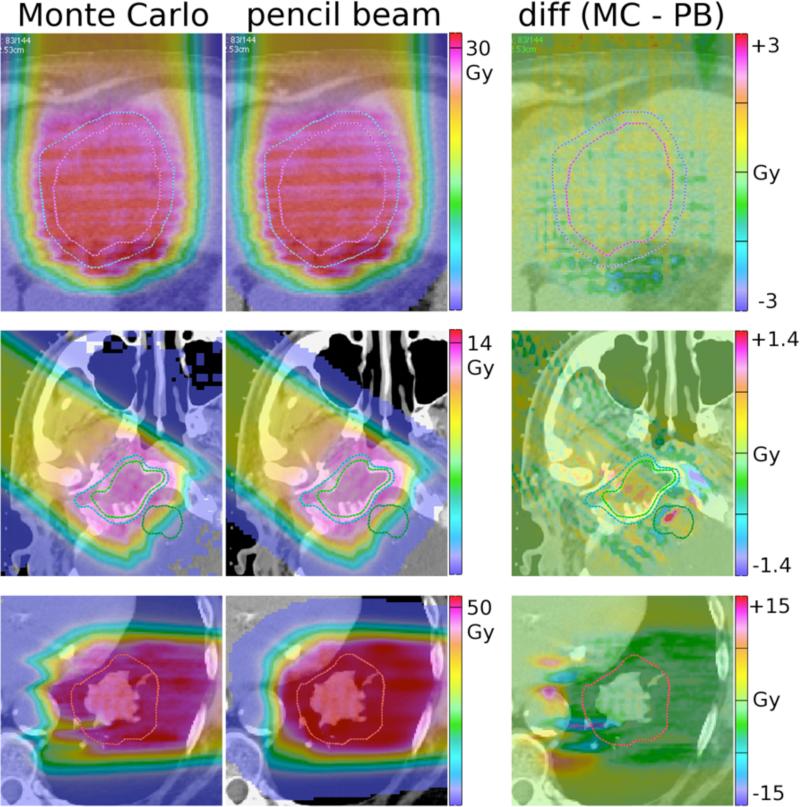
Figure 6 shows the results of the simulations: the first two images in each row display the results for Monte Carlo (MC) and pencil-beam (PB) simulations respectively, while the difference picture on the right shows the difference in absolute dose, i.e. [Dose(MC) - Dose(PB)].
Figure 6.
Top row: Anterior-posterior field delivered to a liver patient. The structures on display are the clinical target volume (CTV, pink) and the planning target volume (PTV, blue). Middle row: Field delivered to a head and neck patient. The visible structures are the gross tumor volume (GTV, green) and the CTV (blue). Lower row: Field delivered to a lung patient. The red line indicates the CTV. All values given are Gy(RBE). The scale of the difference image on the right is 10% of prescribed dose for row 1 and 2, while 30% for row 3.
The first row shows the results for a field of a patient treated for hepatocellular carcinoma, the second for a petroclival meningioma case, and the bottom row for a non-small cell lung cancer patient. As the complexity in geometry increases, the discrepancy between the Monte Carlo simulations and the treatment planning system increases as well. The geometrically simple liver case does not show significant variations (agreement within +/−2% of prescribed dose), while for the second case the difference is up 5% in the CTV and 10% in the brainstem. For the lung case the differences between the pencil beam algorithm and the Monte Carlo amount up to 30% of the prescribed dose.
Figure 7 shows the dose difference histograms of the of the CTV for the three example patients, which are dose-volume histograms of the difference [Dose(MC) - Dose(PB)], i.e. the third column in figure 6. This demonstrates that most voxels in the CTV are within +/−2% for the liver patient, while the distribution is already broader for the head and neck patient, stretching out to +/−5% of prescribed dose. For the lung patient, the distribution shows a large tail towards underdoses up to 20% of prescribed dose, which is the impact of the cold spot in the CTV of the lung patient visible in figure 6.
Figure 7.
Dose Volume Histogram of the difference between Monte Carlo simulation and pencil beam calculation in the CTV for the three example cases. The dose difference (x-axis) is given in percent of the prescribed dose and kept constant to ease comparison.
The increasing discrepancy between Monte Carlo and pencil beam calculations in the three example patients is also confirmed by a gamma analysis: for the liver patient 98.8% of the voxels in the CTV pass a 2%/2mm gamma criterion, 97.5% for the head and neck patient and only 92.9% for the lung patient.
4. Discussion and Conclusion
We have compared fluence profiles of proton scanning simulations modeling a complete treatment head with a Gaussian spot parameterization of the beam at treatment head exit. For the treatment head considered, secondary particles can be neglected, though scattered primary protons lead to differences between a phase space based approach and the full treatment head simulation for the low-dose out-of-field region. Even though the phase space based approach includes the halo due to nuclear interactions within the phantom (Clasie et al 2012), it fails to capture the beam line specific halo due to coulomb scatter in the ionization chambers (Sawakuchi et al 2010). For modeling out-of-field doses in distant organs, e.g. for secondary cancer risk estimation, and for very small fields this approach is therefore inadequate and a full simulation of the scanning gantry is advisable (Dowdell et al 2012). It should be noted that for passive scattering this approach would not be feasible, due to the multitude of interactions taking place with the components in the beam's path, such as range modulator wheels and scatterers. Range shifters have to be explicitly accounted for, as their introduction leads to significant scatter and cannot be reconciled with the assumption of a parallel beam without divergence. In this case we start the Monte Carlo simulation just before the range shifter and then subsequently simulate the propagation of the protons in the patient.
The reduction of the Monte Carlo simulation to the patient indeed saves considerable computing time. For the treatment head simulation (i.e. from the entrance of the gantry through the scanning magnets and ionization chambers up to the patient surface) the computation time was on average 260 minutes/106 protons on one processor. On the same hardware, the patient simulation for the head and neck patient took 371 minutes/106 protons. Naturally the simulation time in the patient depends on the case, e.g. higher energetic beams in prostate patients can take up to a factor ~2 longer, while superficial breast patients can be computed slightly faster (Schuemann et al 2012). Therefore the saved computation time is between 20-50%, dependent on the efficiency of the patient simulation.
Subsequently we derive the initial beam energy spread for the beam delivery systems at MGH and PSI using a published analytical model (Bortfeld 1997). Kimstrand et al (Kimstrand et al 2007) and Clasie et al (Clasie et al 2012) have determined the energy spread in a different fashion. They obtained a set of mono-energetic peaks then weighted them with a Gaussian distribution. By fitting this weighted sum to the measured data, they were able to determine the mean energy E0 and standard deviation sE of the peak. This method does not necessarily produce a unique solution, but has shown to yield results with sufficient accuracy. Theoretically, one could also model the accelerator and the beam transport system up to the gantry to determine the initial energy spread (Cascio et al 2004).
The characterization of all beam parameters at treatment head exit, together with the exact number of protons to be delivered from the TPS, enables Monte Carlo simulations of absolute dose in patients. This approach is more direct than in Monte Carlo simulations of passively scattered fields, where a normalization run in a water phantom and knowledge of the prescribed dose per field is necessary to normalize the energy deposited in the patient (Paganetti et al 2008).
Although a comparison of the TPS dose calculation method with MC is beyond the scope of this work, the phase space method was applied for 3 different patient cases. The agreement is excellent for the liver case (figure 6, row 1). For the more complex base of skull case however, interfaces of the temporal and zygomatic bones with soft tissue led to numerous lateral inhomogeneities in the beam path, leading to differences of up to 10% in the distal fall-off. The reason for this discrepancy is the inaccurate modeling of multiple Coulomb scattering in the TPS, which accounts only for the material along each pencil's central axis (Petti 1992). The lung case showed the largest deviations of the MC result from the treatment plan. Monte Carlo predicts differences in the heart, the descending aorta and the spine, and even significant underdosage stretching right into the CTV. While the range differences seem large, it must be kept in mind that even though for example the aorta is located around 20mm behind the target, this corresponds to just 5mm in water-equivalent pathlength, due to the low-density lung tissue.
The advantage of the phase space approach to model active scanning is its simplicity: all that is needed is a thoroughly tested Monte Carlo code capable of patient simulations based on CT data, TOPAS in this case, and the same beam data that is necessary as input for the TPS, i.e. the depth dose curves and energy dependent spot size at treatment head exit. The exact treatment head geometry does not have to be modeled, which saves computing time (tracking of protons through magnetic fields is especially time-intensive) and effort, since no blue prints and material composition have to be obtained. Using the phase space based approach to active scanning Monte Carlo simulations presented here, we hope to reduce uncertainties in patient dose calculation, leading to more conformal treatment plans and better utilization of the steep dose gradients inherent in proton therapy.
Acknowledgements
The authors would like to acknowledge Dr. Ben Clasie for sharing his knowledge about active scanning proton delivery systems, Dr. Thomas Bortfeld for fruitful discussions concerning his analytical Bragg peak model and Dr. Jon Jackson and Partners Research Computing for maintenance of the computing cluster. This work was supported by National Cancer Institute Grant R01CA111590.
References
- Agostinelli S, Allison J, Amako K E, Apostolakis J, Araujo H, Arce P, Asai M, Axen D, Banerjee S, Barrand G. GEANT4—a simulation toolkit. Nuclear instruments and methods in physics research section A: Accelerators, Spectrometers, Detectors and Associated Equipment. 2003;506:250–303. [Google Scholar]
- Albertini F, Hug EB, Lomax AJ. Is it necessary to plan with safety margins for actively scanned proton therapy? Phys Med Biol. 2011;56:4399–413. doi: 10.1088/0031-9155/56/14/011. [DOI] [PubMed] [Google Scholar]
- Bortfeld T. An analytical approximation of the Bragg curve for therapeutic proton beams. Med. Phys. 1997;24:2024–33. doi: 10.1118/1.598116. [DOI] [PubMed] [Google Scholar]
- Cascio EW, Sisterson JA, Gottschalk B, Sarkar S. Measurements of the energy spectrum of degraded proton beams at NPTC Radiation Effects Data Workshop. IEEE. 20042004:151–5. [Google Scholar]
- Clasie B, Depauw N, Fransen M, Gomà C, Panahandeh HR, Seco J, Flanz JB, Kooy HM. Golden beam data for proton pencil-beam scanning. Phys Med Biol. 2012;57:1147–58. doi: 10.1088/0031-9155/57/5/1147. [DOI] [PMC free article] [PubMed] [Google Scholar]
- Dowdell SJ, Clasie B, Depauw N, Metcalfe P, Rosenfeld AB, Kooy HM, Flanz JB, Paganetti H. Monte Carlo study of the potential reduction in out-of-field dose using a patient-specific aperture in pencil beam scanning proton therapy. Phys Med Biol. 2012;57:2829–42. doi: 10.1088/0031-9155/57/10/2829. [DOI] [PMC free article] [PubMed] [Google Scholar]
- Gottschalk B, Koehler AM, Schneider RJ, Sisterson JM, Wagner MS. Multiple Coulomb scattering of 160 MeV protons. Nuclear Instruments and Methods in Physics Research Section B. 1993;74:467–90. [Google Scholar]
- Grassberger C, Daartz J, Dowdell S, Ruggieri T, Sharp G, Paganetti H. Quantification of proton dose calculation accuracy in the lung. Int J Radiat Oncol Biol Phys. 2014;89:424–30. doi: 10.1016/j.ijrobp.2014.02.023. [DOI] [PMC free article] [PubMed] [Google Scholar]
- Hong L, Goitein M, Bucciolini M, Comiskey R, Gottschalk B, Rosenthal S, Serago C, Urie M. A pencil beam algorithm for proton dose calculations. Phys Med Biol. 1996;41:1305–30. doi: 10.1088/0031-9155/41/8/005. [DOI] [PubMed] [Google Scholar]
- Janni JF. Proton Range-Energy Tables, 1 keV-10 GeV, Energy Loss, Range, Path Length, Time-of-Flight, Straggling, Multiple Scattering, and Nuclear Interaction Probability. Part I. For 63 Compounds. Atomic Data and Nuclear Data Tables. 1982;27:147. [Google Scholar]
- Kimstrand P, Traneus E, Ahnesjö A, Grusell E, Glimelius B, Tilly N. A beam source model for scanned proton beams. Phys Med Biol. 2007;52:3151–68. doi: 10.1088/0031-9155/52/11/015. [DOI] [PubMed] [Google Scholar]
- Kooy HM, Clasie BM, Lu H-M, Madden TM, Bentefour H, Depauw N, Adams JA, Trofimov AV, Demaret D, Delaney TF, Flanz JB. A case study in proton pencil-beam scanning delivery. Int J Radiat Oncol Biol Phys. 2010;76:624–30. doi: 10.1016/j.ijrobp.2009.06.065. [DOI] [PubMed] [Google Scholar]
- Lomax A. Intensity modulated proton therapy and its sensitivity to treatment uncertainties 1: the potential effects of calculational uncertainties. Phys Med Biol. 2008;53:1027. doi: 10.1088/0031-9155/53/4/014. [DOI] [PubMed] [Google Scholar]
- Paganetti H. Range uncertainties in proton therapy and the role of Monte Carlo simulations. Phys Med Biol. 2012;57:R99–R117. doi: 10.1088/0031-9155/57/11/R99. [DOI] [PMC free article] [PubMed] [Google Scholar]
- Paganetti H, Jiang H, Parodi K, Slopsema R, Engelsman M. Clinical implementation of full Monte Carlo dose calculation in proton beam therapy. Phys Med Biol. 2008;53:4825–53. doi: 10.1088/0031-9155/53/17/023. [DOI] [PubMed] [Google Scholar]
- Perl J, Shin J, Schümann J, Faddegon B, Paganetti H. TOPAS: An innovative proton Monte Carlo platform for research and clinical applications. Med. Phys. 2012;39:6818. doi: 10.1118/1.4758060. [DOI] [PMC free article] [PubMed] [Google Scholar]
- Petti PL. Differential-pencil-beam dose calculations for charged particles. Med. Phys. 1992;19(1):137–149. doi: 10.1118/1.596887. [DOI] [PubMed] [Google Scholar]
- Sawakuchi GO, Zhu XR, Poenisch F, Suzuki K, Ciangaru G, Titt U, Anand A, Mohan R, Gillin MT, Sahoo N. Experimental characterization of the low-dose envelope of spot scanning proton beams. Phys Med Biol. 2010;55:3467–78. doi: 10.1088/0031-9155/55/12/013. [DOI] [PubMed] [Google Scholar]
- Schuemann J, Dowdell S, Grassberger C, Min CH, Paganetti H. Site-specific range uncertainties caused by dose calculation algorithms for proton therapy. Phys Med Biol. 2014;59:4007–31. doi: 10.1088/0031-9155/59/15/4007. [DOI] [PMC free article] [PubMed] [Google Scholar]
- Schuemann J, Paganetti H, Shin J, Faddegon B, Perl J. Efficient voxel navigation for proton therapy dose calculation in TOPAS and Geant4. Phys Med Biol. 2012;57:3281–93. doi: 10.1088/0031-9155/57/11/3281. [DOI] [PMC free article] [PubMed] [Google Scholar]


