Abstract
Optical-resolution photoacoustic microscopy (OR-PAM) is a novel label-free microscopic imaging tool to provide in vivo optical absorbing contrasts. Specially, it is crucial to equip a real-time imaging capability without sacrificing high signal-to-noise ratios (SNRs) for identifying and tracking specific diseases in OR-PAM. Herein we demonstrate a 2-axis water-proofing MEMS scanner made of flexible PDMS. This flexible scanner results in a wide scanning range (9 × 4 mm2 in a transverse plane) and a fast imaging speed (5 B-scan images per second). Further, the MEMS scanner is fabricated in a compact footprint with a size of 15 × 15 × 15 mm3. More importantly, the scanning ability in water makes the MEMS scanner possible to confocally and simultaneously reflect both ultrasound and laser, and consequently we can maintain high SNRs. The lateral and axial resolutions of the OR-PAM system are 3.6 and 27.7 μm, respectively. We have successfully monitored the flow of carbon particles in vitro with a volumetric display frame rate of 0.14 Hz. Finally, we have successfully obtained in vivo PA images of microvasculatures in a mouse ear. It is expected that our compact and fast OR-PAM system can be significantly useful in both preclinical and clinical applications.
Photoacoustic tomography (PAT) is an innovative imaging modality which combines the advantages of high ultrasonic resolution and strong optical contrast1. Especially, optical-resolution photoacoustic microscopy (OR-PAM) can noninvasively provide agent-free microscopic images of oxy-hemoglobins, deoxy-hemoglobins2, melanins3, and DNA/RNA in cell nuclei4. Based on these intrinsic contrasts, more importantly, OR-PAM can also supply label-free physiological parameters such as total hemoglobin concentration, hemoglobin oxygen saturation, blood flow, and metabolic rate5. Thanks to the key advantages, OR-PAM has been widely used to study oncology3, neuroscience6, label-free histology7, dermatology8, ophthalmology9, cardiology10, etc. The first generation of OR-PAM used an opto-ultrasound combiner to form a confocal geometry of ultrasound and light to maximize signal-to-noise ratios (SNRs)2. However, owing to mechanical scanning, the imaging speed is relatively slow (typically 1 Hz11) and highly relies on the laser repetition rate. In addition, the use of conventional optics and linear scanning stages make the entire system relatively bulky. Xie, et. al. applied an optical scanning scheme with a combination of an unfocused ultrasound transducer12. Despite the significant enhancement on the imaging speed, laser scanning OR-PAM with the unfocused ultrasound transducer suffers from relatively low SNRs because the confocal opto-ultrasound geometry was not applied. Song, et. al. used an 1D-array ultrasound transducer to increase the imaging speed in OR-PAM13,14. Several hybrid scanning methods has been explored to maintain the SNRs and enhance the imaging speed such as 1-axis optical scanning with a cylindrically focused ultrasound transducer15, 1-axis fast voice-coil scanning with a spherically focused ultrasound transducer16, and 1-axis water-immersible Microelectromechanical systems (MEMS) scanning with a spherically focused ultrasound transducer17. All these modalities adapt the secondary linear scanning stage to provide the volumetric OR-PAM images, and thus the systems are still bulky and costly. 2-axis MEMS mirrors have been introduced as alternatives to relatively bulky galvo scanners in OR-PAM, but these mirrors could not provide confocal geometries to improve SNRs18,19. Therefore, there is a pressing need to develop a compact, fast, and cost-effective OR-PAM system while maintaining high SNRs for wide spread in preclinical and clinical applications.
Here, we present a novel OR-PAM system which is based on a fully integrated 2-axis water-proofing MEMS scanner (2A-WP-MEMS-OR-PAM). The key features of our 2A-WP-MEMS-OR-PAM system include: (1) fast imaging speed (5 B-scan (i.e., depth-resolvable 2D cross-sectional images) frames per second for 1,000 A-lines (i.e., depth-resolvable 1D profiles)), (2) wide scanning range (9 × 4 mm2 in the X and Y axes, respectively), (3) cost-effectiveness due to the use of cheap polydimethylsiloxane (PDMS) and micro-magnets, (4) small footprint due to a small size of the MEMS scanner (15 × 15 × 15 mm3 along the X, Y, and Z axes, respectively), and (5) high SNRs due to the confocal opto-ultrasound geometry. The quantified axial and lateral spatial resolutions are 27.7 and 3.6 μm, respectively. Finally, we have successfully imaged the flow of carbon particles in a silicone tube in vitro and microvascular networks of a mouse ear in vivo.
Results
2A-WP-MEMS-OR-PAM
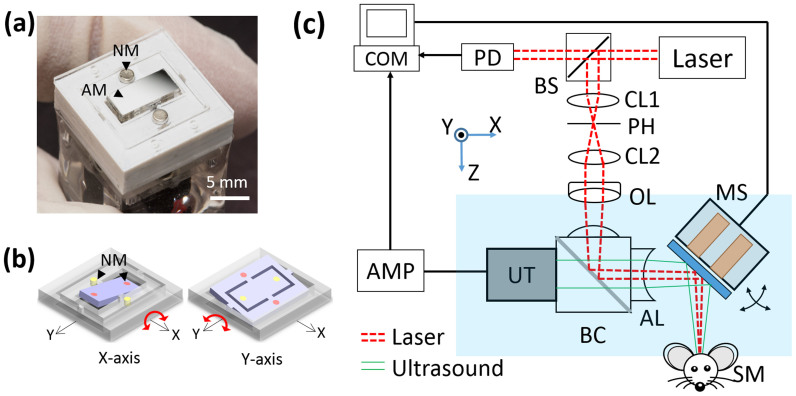
Fig. 1(a) shows the photograph of the 2-axis water-proofing MEMS scanner. A 2-axis MEMS scanner consists of a movable layer of PDMS and fixed housing of electromagnets. An aluminum coated mirror, which significantly reflects both light and ultrasound, is torsionally actuated by controlled electromagnetic forces. This electromagnetic force is induced by four pairs of Neodymium permanent magnets and homemade electromagnets. The resonance frequencies of the fabricated 2-axis MEMS scanner in water were measured 50 and 30 Hz along the X and Y axes, respectively. The scanning property of the MEMS scanner is mainly characterized by a frequency and amplitude of a driving voltage. Due to the low stiffness of PDMS, the required driving voltage can be reduced. The strong resistance and hydrophobicity of PDMS itself provides a water-proofing property to prevent electrical short by water leaking20. In addition, the gimbaled structure of the only one PDMS layer could avoid mechanical coupling between two axes as shown in Fig. 1(b), and thus help to improve the scanning accuracy and linearity. The size of the fabricated 2-axis MEMS scanner is 15 × 15 × 15 mm3 along the X, Y and Z axes, respectively. Fig. 1(c) shows a schematic diagram of the 2A-WP-MEMS-OR-PAM system. The collimated laser beam is confocally aligned with the ultrasound focus through the opto-ultrasound beam combiner in front of an ultrasonic transducer to maximize the SNRs. When two AC driving signals are applied to the 2-axis MEMS scanner, coaxially-aligned light beam and photoacoustic (PA) waves scan the sample surface along the X-Y plane. The generated PA signals are amplified with a 50 dB gain and finally converted into PA images via Hilbert transformation.
Figure 1.
(a) Fabricated 2-axis water-proofing MEMS scanner. (b) Scheme of torsional motions along the X and Y axes, respectively. Red color indicates the electromagnetically stimulated NMs while the resting NMs are indicated by yellow color. (c) Schematic of the 2A-WP-MEMS-OR-PAM system. NM, neodymium magnet; AM, aluminum mirror; COM, computer; PD, photodiode; BS, beam splitter; AMP, amplifier; UT, ultrasound transducer; CL, condenser lens; PH, pin hole; OL, objective lens; BC, beam combiner; AL, acoustic lens; MS, MEMS scanner; and SM, sample. Author J.Y.K created the figure.
Performance of 2A-WP-MEMS-OR-PAM
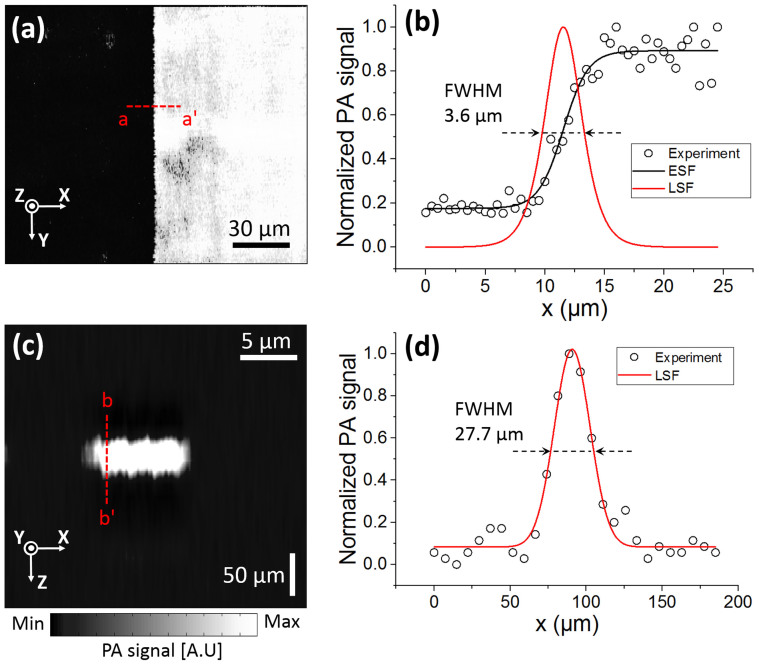
To test the performance of the developed 2A-WP-MEMS-OR-PAM system, the lateral and axial resolutions were measured by imaging the edge of a sharp blade and a carbon fiber with a step size of 0.5 μm as shown in Fig. 2. The edge spread function (ESF) was fitted using the maximum amplitude projection (MAP) data across the a-a′ line (Fig. 2(a)). The first derivative of the ESF creates a line spread function (LSF), and the full width at half maximum (FWHM) of the LSF was considered as the lateral resolution. The measured lateral resolution was 3.6 μm as shown in Fig. 2(b). The theoretical laser spot size is calculated as follows:  , where 2W0 is the spot size, f is the focal length, λ is 532 nm, and d is the collimated beam diameter (e.g., 12 mm). Additionally, a carbon fiber with a diameter of ~6 μm was photoacoustically imaged to quantify the axial resolution as shown in Fig. 2(c). The LSF of the carbon fiber was fitted by a Gaussian function, and then the FWHM was utilized as the axial resolution. The quantified axial resolution was 27.7 μm, and the theoretical value based on the ultrasound transducer's bandwidth was 26 μm. These spatial resolutions indicate that the developed 2A-WP-MEMS-OR-PAM system is sufficient to resolve capillaries.
Figure 2. Lateral and axial spatial resolutions of the 2A-WP-MEMS-OR-PAM system.
(a) PA MAP image of the edge of a sharp blade. (b) ESF fitting from the experimental data across the a-a′ line in (a) and fitted LSF by the first derivative of the ESF. (c) Cross-sectional PA B-scan image of a carbon fiber. (d) LSF fitting from experimental data across the b-b′ line in (c). FWHM, full width at half maximum; MAP, maximum amplitude projection; ESF, edge spread function; and LSF, line spread function.
In vitro and in vivo PA imaging
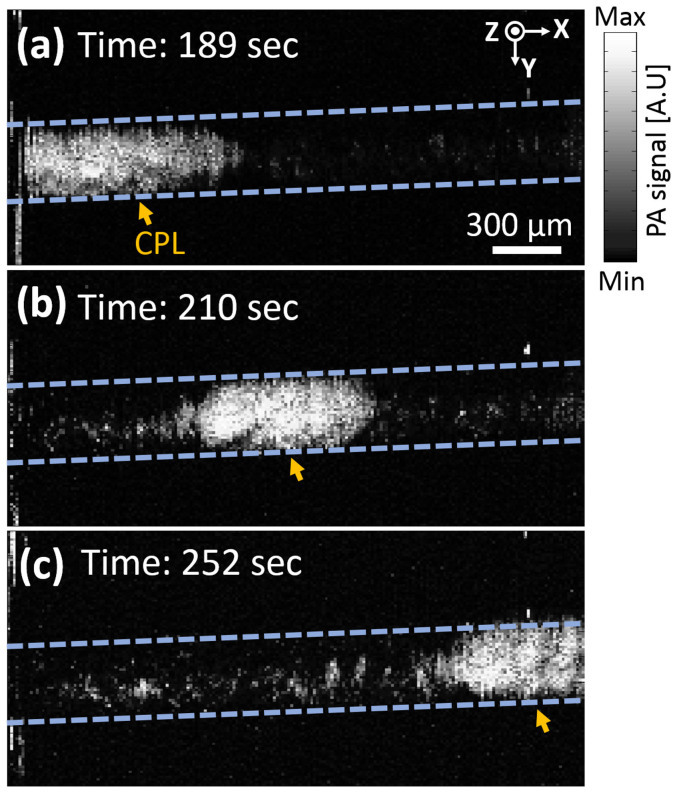
The scanning speed of the MEMS scanner is from DC to 200 Hz. In this range, the imaging speed of the 2A-WP-MEMS-OR-PAM system is determined by the laser repetition rate and the total number of imaging pixels in one volumetric image. The current PA A-line imaging speed is 5,000 A-lines per second with a laser repetition rate of 10 kHz because we only acquire the PA signals during the one-way travel of the MEMS scanner. To test the imaging speed, we monitored the flow of an aqueous solution of carbon particles in a silicone tube. We obtained 100 × 200 pixels along the Y and X axes, respectively. Thus, the B-scan image acquisition rate along the Y direction was 50 Hz, which is at least 50 times faster than that of the OR-PAM system using mechanical stages. The volumetric 3D PA image acquisition was 0.25 Hz, but the actual display rate including image processing was 0.14 Hz. As shown in Fig. 3, we have successfully monitored the flow of aggregated carbon particles using the 2A-WP-MEMS-OR-PAM system. The measured flow speed was 0.04 mm/s, much lower than the preset value of 1.7 mm/s because of a large density of carbon particles.
Figure 3. In vitro PA monitoring of the flow of carbon particles in a silicone tube.
The measured flow speed of the carbon particles' solution was 0.04 mm/s. 189 (a), 210 (b), and 252 (c) seconds after injecting carbon particles. CPL, carbon particles lump. (Supplementary Video S1).
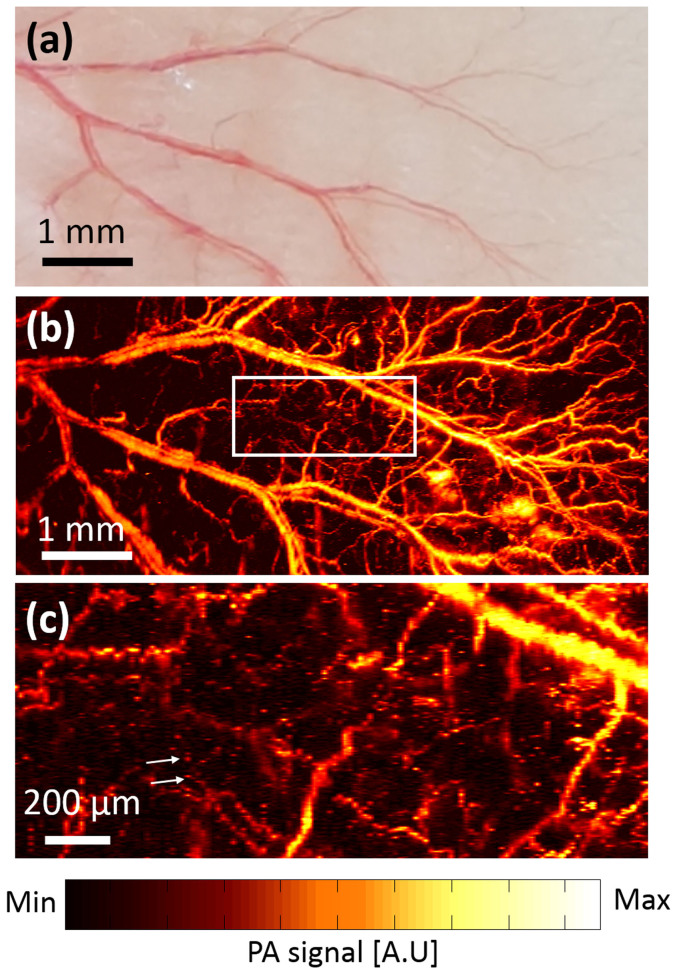
Finally, we conducted in vivo noninvasive PA imaging of microvasculatures in a mouse ear. The laser pulse energy on the mouse skin was less than 9 mJ/cm2, which is below the American National Standard Institute (ANSI) safety limit, 20 mJ/cm2 at 532 nm. It took 100 seconds to acquire one volumetric PA image with 1,000 × 500 pixels along the X and Y axes, respectively. A step size was determined using scanning ranges divided by number of pixels. We used an acoustic lens with a focal length of 27 mm to provide a large field of view (FOV, 9 × 4 mm2 along the X and Y axes, respectively). Fig. 4(a) is the photograph of the mouse ear, and Fig. 4(b) is the corresponding in vivo PA MAP image. By comparing both Figs. 4(a) and (b), not only large blood vessels but also small capillaries were clearly shown in the PA image. Additionally, Fig. 4(c) is an enlarged region of the white line box in Fig. 4(b). Individual red blood cells (RBCs) along the capillaries were clearly visualized.
Figure 4.
(a) Photograph of the mouse ear showing blood vessels. (b) In vivo noninvasive PA MAP image of the mouse ear. (c) The enlarged region of the white line box in (b). White arrows indicate individual red blood cells.
Discussion
The feasibility of the 2A-WP-MEMS-OR-PAM system was evaluated through in vitro and in vivo experiments for biomedical applications. Especially, the 2-axis water-proofing MEMS scanner and co-axial opto-ultrasound geometry provides significant opportunities of the wide scanning range, fast imaging capability, high SNR, high resolution, and compact system size. The FOV depends on both the scanning angle of the scanner and focal length of the acoustic lens which is attached on the front of the beam combiner. Except OR-PAM systems with mechanical scanning methods, our system provides the longest scanning range (e.g., 9 mm) compared to the previously reported scanning ranges (e.g., <6 mm) that were provided by OR-PAM systems with fast scanning methods11. It is expected that the use of the acoustic lens with a longer focal length will increase the FOV. Although the B-scan PA imaging speed of our system is in the same order of the OR-PAM system with 1-axis fast voice-coil scanning, the voice-coil based OR-PAM system requires to use one additional scanning stage for volumetric PA imaging. However, our 2-axis MEMS scanner provides X-Y scanning without using additional mechanical stage, and thus the ultimate system size should be much more compact compared to that of the voice-coil based OR-PAM system. Nevertheless, there is a considerable scope to enhance the performance of the OR-PAM system to apply in various biomedical fields. (1) To minimize motion artifacts and truly perform real-time imaging, the higher repetition rate of a pulsed laser source is required. For instance, when a laser repetition rate of 500 kHz is applied to our system with 500 × 500 pixels along X and Y axes, respectively, one PA B-scan and volumetric imaging acquisition speeds can be 1,000 and 2 Hz, respectively. (2) Despite the small size of the MEMS scanner, the MEMS scanner is required to be even smaller for endoscopic systems. Considering small-sized magnetic elements with a diameter of ~1 mm, the size of the MEMS scanner can be reduced to 5 mm thanks to easy micro-fabrication of PDMS21. (3) For further convenient system configuration to enhance clinical translation, optical fibers should be used for light delivery instead of bulky optics3.
In conclusion, we have developed the 2A-WP-MEMS-OR-PAM system, successfully monitored the flow of carbon particles in vitro, and imaged microvascular networks of the mouse ear in vivo. The fabricated MEMS scanner perfectly works in water and co-axially reflects both ultrasound and laser beam to scan a 2D plane. Thus, high SNRs were achieved without sacrificing the imaging speed. The small size and simple operation of the MEMS scanner can greatly reduce the complexity of the OR-PAM system. By using this 2-axis MEMS scanner, we expect to build a further smaller footprint of OR-PAM for endoscopy or laparoscopy.
Methods
Fabrication of 2-axis MEMS scanner
The 2-axis water-proofing MEMS scanner was fabricated through soft lithography of PDMS, a common method to engineer micro and nano-structures22,23. An acrylic mold for the top movable PDMS layer was made by a micro-milling. An acrylic frame with thickness of 0.5 mm was also prepared by micro-milling process. The mirror plate was made by deposition of 200-nm-thick aluminum on the glass plate through an e-beam evaporation process. Finally, an acrylic frame and a mirror plate were bonded to the soft PDMS body to support the gimbal structure.
2A-WP-MEMS-OR-PAM system
A Q-switched-diode-pumped-solid-state-laser (SPOT-10-200-532, Elforlight) delivers 532-nm laser beam. The laser beam is initially divided into two paths by a beam splitter (BS, CM1-BP108, Thorlabs). One directs to a photodiode (PD, SM05PD5A, Thorlabs) for system triggering, and the other travels to samples. After passing through two condenser lenses (CL, LA1805 and LA1131, Thorlabs), the laser beam is expanded and collimated. A pinhole (PH, P50C, Thorlabs) is located between two condenser lenses for spatial filtering. The collimated laser beam with a diameter of 12 mm is focused and excited the sample through an objective lens (OL, AC254-060-A, numerical aperture (NA): 0.2, f: 60 mm, Thorlabs) to generate PA waves. This laser beam is confocally aligned with the ultrasound focus through the opto-ultrasound beam combiner (BC) in front of an unfocused ultrasound transducer (UT, VB214-BB-RM, center frequency: 50 MHz, −6 dB bandwidth: 100%, Olympus NDT) to maximize the SNRs. We use a concave optical lens as the acoustic lens (AL, NT45-384, Edmund) with NA of 0.16 to have a longer focal length related to FOV. Both beam combiner and acoustic lens are made of N-BK7 glass. When two AC driving signals (e.g., triangular and sawtooth waveforms along the X and Y axes, respectively) from the data acquisition (DAQ) board (NI PCIe-6321, National instruments) are applied to the 2-axis MEMS scanner (MS), coaxially-aligned light beam and PA waves scan the sample surface along the X-Y plane. The generated PA signals are detected by an ultrasonic transducer and amplified by two serially connected amplifiers (ZFL-500LN, Mini-Circuits) with a 50 dB gain. These signals are finally acquired by a high speed digitizer (NI PCI-5124, National Instruments) and converted into PA images via Hilbert transformation.
In vitro experiments
To test the imaging speed, we monitored the flow of an aqueous solution of carbon particles (carbon – glassy, spherical powder, Sigma-Aldrich) in a silicone tube. The flow velocity of the carbon particle solution in the tube was controlled by a syringe pump (Pump 11 Elite, Harvard) and set to be 1.7 mm/s in water.
Animal preparation for in vivo imaging experiments
All animal experimental protocols were approved by the POSTECH Animal Care and Use Committee. And all animal experiments were carried out in accordance with the National Institutes of Health Guide for the Care and Use of Experimental Animals. A normal Balb/c mouse weighing ~20 g was used for in vivo experiments. The mouse was initially anesthetized with 3% isoflurane vaporized by the inhalation gas (flow rate is 1.0–1.5 L/min), and the mouse was kept under anesthesia with 1% isoflurane during the in vivo imaging experiments. After clearing the downy hair on the ear, the mouse was placed on an experimental stage. To maintain the body temperature, an electrical heating pad was used.
Author Contributions
J.Y.K. designed and fabricated the MEMS scanner and C.L. designed and developed the OR-PAM system. They also designed and performed in vitro and in vivo experiments, collected samples, analyzed and interpreted data, prepared the figures for the manuscript, and wrote the manuscript. K.P. contributed to perform the animal experiment. G.L. and C.K. conceived and supervised the project, designed experiments, interpreted data, and wrote the manuscript. All authors contributed to critical reading of the manuscript.
Supplementary Material
Supplementary Information
Supplementary Video. S1
Acknowledgments
This work was supported by the research funds from a NIPA IT Consilience Creative Program (NIPA-2013-H0203-13-1001), an NRF Engineering Research Center grant (NRF-2011-0030075), and an NRF Mid-career Researcher Program (NRF-2012R1A2A2A06047424) of the Ministry of Science, ICT and Future Planning, Republic of Korea.
References
- Kim C., Favazza C. & Wang L. V. In vivo photoacoustic tomography of chemicals: high-resolution functional and molecular optical imaging at new depths. Chem. Rev. 110, 2756–2782 (2010). [DOI] [PMC free article] [PubMed] [Google Scholar]
- Hu S., Maslov K. & Wang L. V. Second-generation optical-resolution photoacoustic microscopy with improved sensitivity and speed. Opt. Lett. 36, 1134–1136 (2011). [DOI] [PMC free article] [PubMed] [Google Scholar]
- Wang Y. et al. Fiber-laser-based photoacoustic microscopy and melanoma cell detection. J. Biomed. Opt. 16, 011014 (2011). [DOI] [PMC free article] [PubMed] [Google Scholar]
- Yao D.-K., Maslov K., Shung K. K., Zhou Q. & Wang L. V. In vivo label-free photoacoustic microscopy of cell nuclei by excitation of DNA and RNA. Opt. Lett. 35, 4139–4141 (2010). [DOI] [PMC free article] [PubMed] [Google Scholar]
- Yao J., Maslov K. I., Zhang Y., Xia Y. & Wang L. V. Label-free oxygen-metabolic photoacoustic microscopy in vivo. J. Biomed. Opt. 16, 076003-076003-076011 (2011). [DOI] [PMC free article] [PubMed] [Google Scholar]
- Hu S. & Wang L. V. Neurovascular photoacoustic tomography. Front. Neuroenergetics. 2, 10 (2010). [DOI] [PMC free article] [PubMed] [Google Scholar]
- Zhang C., Maslov K. & Wang L. V. Subwavelength-resolution label-free photoacoustic microscopy of optical absorption in vivo. Opt. Lett. 35, 3195–3197 (2010). [DOI] [PMC free article] [PubMed] [Google Scholar]
- Zhou Y., Xing W., Maslov K. I., Cornelius L. A. & Wang L. V. Handheld photoacoustic microscopy to detect melanoma depth in vivo. Opt. Lett. 39, 4731–4734 (2014). [DOI] [PMC free article] [PubMed] [Google Scholar]
- Jiao S. et al. Photoacoustic ophthalmoscopy for in vivo retinal imaging. Opt. Express 18, 3967–3972 (2010). [DOI] [PMC free article] [PubMed] [Google Scholar]
- Zhang C., Cheng Y.-J., Chen J., Wickline S. & Wang L. V. Label-free photoacoustic microscopy of myocardial sheet architecture. J. Biomed. Opt. 17, 0605061–0605063 (2012). [DOI] [PMC free article] [PubMed] [Google Scholar]
- Yao J. & Wang L. V. Photoacoustic microscopy. Laser & Photonics Reviews 7, 758–778 (2013). [DOI] [PMC free article] [PubMed] [Google Scholar]
- Xie Z., Jiao S., Zhang H. F. & Puliafito C. A. Laser-scanning optical-resolution photoacoustic microscopy. Opt. Lett. 34, 1771–1773 (2009). [DOI] [PubMed] [Google Scholar]
- Song L., Maslov K. & Wang L. V. Section-illumination photoacoustic microscopy for dynamic 3D imaging of microcirculation in vivo. Opt. Lett. 35, 1482–1484 (2010). [DOI] [PMC free article] [PubMed] [Google Scholar]
- Song L., Maslov K. & Wang L. V. Multifocal optical-resolution photoacoustic microscopy in vivo. Opt. Lett. 36, 1236–1238 (2011). [DOI] [PMC free article] [PubMed] [Google Scholar]
- Rao B., Li L., Maslov K. & Wang L. V. Hybrid-scanning optical-resolution photoacoustic microscopy for in vivo vasculature imaging. Opt. Lett. 35, 1521–1523 (2010). [DOI] [PMC free article] [PubMed] [Google Scholar]
- Wang L., Maslov K., Yao J., Rao B. & Wang L. V. Fast voice-coil scanning optical-resolution photoacoustic microscopy. Opt. Lett. 36, 139–141 (2011). [DOI] [PMC free article] [PubMed] [Google Scholar]
- Yao J. et al. Wide-field fast-scanning photoacoustic microscopy based on a water-immersible MEMS scanning mirror. J. Biomed. Opt. 17, 0805051–0805053 (2012). [DOI] [PMC free article] [PubMed] [Google Scholar]
- Xi L. et al. Photoacoustic imaging based on MEMS mirror scanning. Biomed. Opt. Express 1, 1278–1283 (2010). [DOI] [PMC free article] [PubMed] [Google Scholar]
- Chen S.-L. et al. Miniaturized all-optical photoacoustic microscopy based on microelectromechanical systems mirror scanning. Opt. Lett. 37, 4263–4265 (2012). [DOI] [PMC free article] [PubMed] [Google Scholar]
- Jin M. et al. Super-Hydrophobic PDMS Surface with Ultra-Low Adhesive Force. Macromol. Rapid Commun. 26, 1805–1809 (2005). [Google Scholar]
- Jo B. H., Van Lerberghe L. M., Motsegood K. M. & Beebe D. J. Three-dimensional micro-channel fabrication in polydimethylsiloxane (PDMS) elastomer. J. Microelectromech. Syst. 9, 76–81 (2000). [Google Scholar]
- Xia Y. & Whitesides G. M. Soft Lithography. Angew. Chem. Int. Ed. 37, 550–575 (1998). [DOI] [PubMed] [Google Scholar]
- Pokroy B., Epstein A. K., Persson-Gulda M. C. M. & Aizenberg J. Fabrication of Bioinspired Actuated Nanostructures with Arbitrary Geometry and Stiffness. Adv. Mater. 21, 463–469 (2009). [Google Scholar]
Associated Data
This section collects any data citations, data availability statements, or supplementary materials included in this article.
Supplementary Materials
Supplementary Information
Supplementary Video. S1


