

Abstract
Small aquarium fishes are increasingly used as animal models, and one of these, Japanese Medaka (Oryzias latipes), is frequently utilized for toxicity testing. While these vertebrates have many similarities with their terrestrial counterparts, there are differences that must be considered if these organisms are to be used to their highest potential. Testing commonly may employ either the developing embryo or adults; both are easy to use and to work with. We present here three main protocols to illustrate the utility and breadth of toxicity testing possible using medaka fish. The first protocol assesses neurotoxicity in developing embryos. The second protocol describes the sexual genotyping of medaka to evaluate toxicant effects on sexual phenotype after treatment with endocrine disrupting chemicals. The third protocol assesses hepatotoxicity in adult fish after treatment with a model hepatotoxicant. The methods run the gamut from immunohistology through PCR to basic histological techniques.
Keywords: medaka, neurotoxicity, hepatotoxicity, endocrine disruption
Section I. Introduction and General Information
(authors: S. Padilla, R. Johnson, and D. Hinton)
1. INTRODUCTION
Use of alternative species for toxicity testing provides many distinct advantages compared to the commonly-used, rodent laboratory species. First and foremost, an alternative species such as fish, is usually smaller than laboratory rodents, allowing the researcher to process many more animals in a given period of time using smaller amounts of toxicant per animal--which allows for more animals per dosage group and/or the use of a larger number of dosage groups. Alternatively, the researcher may use “laboratory” fish, like the medaka, as a surrogate species because it is closer phylogenetically to the investigator’s target species than are the traditional laboratory rodent species, as is the case in ecotoxicity studies; or the investigator may be interested in using fish to study the mechanisms of toxicity. Alternatively, an investigator could be interested in studying developmental toxicology in an easily accessible system, without the confounders of the maternal metabolism, health, and the inability to observe the embryo develop until after birth; the oviparous development of fish permits treatment of the embryos in vitro and their microscopic examination over time.
Japanese medaka (Oryzias latipes), a small (2–4 cm) freshwater fish (Fig. 1), have been used for over 50 years for toxicity testing. They are very hardy, harbor few diseases, tolerate wide latitudes in salinity and temperature, and are easily reared in a laboratory environment.
Figure 1.

Adult female (upper) and male (lower) medaka. Note the egg clutch attached to the female’s abdomen.
In all types of toxicity tests, small fish are a convenient vertebrate model that can be used as an ecological sentinel, a rapid screen to predict mammalian toxicity, or a detailed mechanistic investigation tool (Law, 2001; Shima and Mitani,2004; Hinton et al.,2005). Testing may include multigenerational exposures as well as acute or chronic exposure of either the adults or developing embryos to mixtures or individual compounds. Moreover, sophisticated experimental tools are available such as stable transgenic lines (Fu et al.,2000; Wayne et al.,2005), as well as mopholino knock down techniques (Carl et al.,2002; Paul-Prasanth et al.,2006).
2. MAINTAINING AND HANDLING ADULT MEDAKA
Medaka are very hardy, making them ideal for laboratory studies. They can tolerate wide ranges of salinity and temperature as long as the transition is gradual. There are two very informative and comprehensive sources for answers to animal husbandry questions regarding medaka care and feeding: the medaka website (http://biol1.bio.nagoya-u.ac.jp:8000/) and a pamphlet published by Carolina Biological supply (Kirchen and West,1976). Both of these resources provide step-by-step directions for establishing a medaka colony. Below are a few general suggestions:
A good ratio of animals to space is about a 24–30 fish in a 5 gallon aquarium or 50–100 pairs in a 10 gallon tank (Davis et al.,2002). Do not cohabitate medaka with other fish, including zebrafish.
Although medaka can withstand wide ranges (7–30°) in temperature, the optimum is 25–27°C, and at these temperatures the pH of the aquarium water should be between 5.5 to 7.0. But exact pH is not as critical as water cleanliness (see comment “d” below).
Medaka should be fed sparingly, 2–3 times per day (consider the use of automatic feeders). If food accumulates on the bottom of the tank, that is an indication that the fish are being fed too much food. Medaka can be fed commercially available tropical fish food or other diets such as Otohime B (Ashby Aquatics, West Chester, PA) or a purified casein-based diet (DeKoven et al.,1992)
Medaka kept in a flow-through system are usually less stressed because there is less likelihood of ammonia build-up. If the animals are kept in a static system (i.e., with no flow-through), replace a proportion (e.g., ½) of the water on a periodic basic (e.g., once a week).
Adult males and females are easily distinguished from one another (Fig. 1). The dorsal fin of the male is usually notched and larger than the female’s dorsal fin. Also, the anal fin of the male is usually larger than the female’s. A breeding female usually has a much larger abdomen than the male.
Normal life span is 2–3 years. Normal breeding is from 6 months to 1 year.
Medaka prefer bright light and a light:dark schedule of either 14:10 or 16:8.
Toxicity testing can be performed using either using flow-through or static conditions, but if done under static conditions, the solutions should be changed every 24 hours to limit the stress (due to ammonia build-up) on the fish. This 24 hour schedule for solution changes also allows frequent renewal of the chemical that is being tested and helps ensure consistent concentration of the test chemical.
Troubleshooting and Comments
Medaka are normally very disease free. If they become sick, likely it is because they are stressed. The common stressors are rapid changes in pH or temperature, inconsistent light/dark cycle, increased levels of ammonia, overcrowding, under- or over-feeding.
3. BREEDING MEDAKA
The medaka website (http://biol1.bio.nagoya-u.ac.jp:8000/) and Carolina Biological Supply pamphlet (Kirchen and West,1976) are informative sources for instructions and tips on breeding of medaka. Normally each female generates 30–50 eggs per day with spawning occurring within 1 hour after the beginning of the light cycle each day. Eggs usually hatch within 8–11 days depending on temperature, and the fry (i.e., newly hatched larvae) are adults at 6–8 weeks. Breeding fish require more food than non-breeding fish, especially more protein. One of the most popular feeding supplements for breeder fish is artemia (brine shrimp), feeding at least once a day. Often, if medaka are not breeding well or are not producing an optimal number of eggs, the frequency of artemia feeding should be increased. General guidelines for collecting, preparing and incubating medaka eggs are below.
-
a
The female medaka will present with fertilized eggs attached in a clutch to her lower abdomen approximately 1 hour after the beginning of the light cycle.
-
b
Using a dip-net, catch a female which has a cluster of eggs attached and transfer it to a small, shallow dish with aquarium water.
-
c
Quickly remove the eggs using either a wide-mouthed pipette or a pair of forceps.
-
d
Gently return the female to the aquarium.
-
e
Continue this procedure with other presenting females until all the needed eggs are collected.
-
f
The eggs are attached to one another by filaments. To separate the eggs, gently roll them on a moist paper towel, until the filamentous connections are broken.
-
g
Then put the eggs either in embryo rearing medium (ERM).
10× ERM (mix in 1000 ml ddH20)- 10.0 g NaCl
- 0.3 g KCl
- 0.4 g CaCl2·2 H2O
- 1.63 MgSO4·7 H2O
Then add 1 ml of NaHCO3 (0.25 g/20 ml H2O)
Dilute 1:10 (e.g. 100 ml of the 10× ERM + 900 ml ddH20) for rearing the embryos
-
h
Alternately the embryos may be treated with marine water (Instant Ocean, Aquarium Systems, Mentor, Ohio, ½ cup to 1 gallon water) containing methylene blue solution (1%) to limit bacterial or fungal growth. Methylene blue should not be used in conjunction with toxicant exposure.
-
i
The eggs may then be placed in Petri dishes or glass vials (2 ml of solution in a 20 ml vial) with aerated embryo rearing media. This media should be changed each day.
-
j
For toxicant exposures during development, the eggs may be incubated in glass vials or microtiter plates (Oxendine et al.,2006)
Critical Parameters and Troubleshooting
The same variables that are important in maintaining a healthy medaka colony (see above) are also very important in successful egg production: light, food, temperature and pH. Moreover, those same parameters tend to be important in that order, such that light intensity and light duration are two factors that should be investigated immediately if egg production is not optimal or sporadic.
5. EMBRYONIC DEVELOPMENT OF MEDAKA
Medaka progress from fertilized egg to swimming fish in 8 to 11 days. An excellent source for pictures of the developing medaka is http://biog-101-104.bio.cornell.edu/BioG101_104/tutorials/Medaka/stage_36.html An abbreviated depiction of the medaka egg development is shown in Figure 2 (adapted by permission from Ishikawa et al.,2004), showing the following stages.
Stage 0. Unfertilized egg is characterized by small oil droplets (od) randomly distributed throughout the embryo.
Stage 1. Fertilized egg is characterized by fewer oil droplets and the ability to exclude methylene blue.
Stage 2b. At 1 hour after fertilization, the oil droplets are combining and moving toward the vegetal pole and the blastodisc (bd) is apparent.
Stage 4. By 2 hours, the egg is usually in the 4-cell stage, and the oil droplets are larger and more concentrated at the vegetal pole.
Stage 8. By 4 hours, the embryo is in the early morula stage with 64–128 blastomeres in 3 layers.
Stage 11. By 8 hours, the embryo is in the late blastula stage.
Stage 13. At 13 hours, the embryo is in the early gastrula stage with the blastoderm beginning to expand over the yolk (25% epibody), and the embryonic shield begins to appear.
Stage 15. By 18 hours, the embryo has achieved 50% epibody at the mid-gastrula stage
Stage 16. By 21 hours, the embryo has reached the late gastrula stage and 75% epibody, and the embryonic body (em) is clearly visible.
Stage 17. By the end of the first day, the embryo has reached the early neurula stage, and the yolk is completely covered. The rudimentary head (head) and Kupffer’s vesicle (kv) are visible.
Stage 20. By one day plus 8 hours, the embryo has reached the 4 somite stage. Brain and spinal cord are developing and the optic (eye) and otic (ev) buds appear.
Stage 22. About mid way through the second day, the embryo has reached the 9 somite stage. The three main regions of the brain are apparent (fb, mb, hb), as well as the ear (ea) and the body cavity. The optic cups and lenses have formed and the heart appears.
Stage 25. By 2 days, the embryo has reached the 18–19 somite stage. The heart has started beating and circulation is beginning. The otoliths are visible and the liver begins to appear.
Stage 29. By 3 days, the embryo has reached the 34 somite stage. Pigmentation is developing in both the retina of the eye as well as numerous melanphores. The pineal gland and air bladder are apparent.
Stage 31. By the fourth day, the embryo has reached the gill blood vessel formation stage. The pectoral fin (pf), the rudimentary kidney (pn), inner ear and gall bladder (gb) are all apparent.
Stage 35. By the fifth day, the embryo has reached the pectoral fin blood circulation stage. The embryo is long enough such that the tip of the caudal fin reaches the eye, and the pectoral fins have begun to move.
Stage 36. By the sixth day, the embryo has reached the heart development stage such that the atrium and the ventricle now lie side by side.
Stage 39. By the ninth day, the embryo has reached the hatching stage. The embryo will secret hatching enzyme that softens and dissolves the chorion. The action of this hatching enzyme accompanied by movement of the embyo will cause the chorion to break open, releasing the embryo tail first.
Stage 40. The newly hatched fry is approximately 4.5 mm long and is considered a first stage fry until fin rays appear on the caudal and pectoral fins.
In the ensuing 3 months the fry will reach adulthood.
Figure 2.


Embryonic Development of the Medaka (adapted by permission from (Iwamatsu,2004). Abbreviations: ab=air (swim) bladder, at=attaching filament, bc=body cavity, bd=blastodisc, bl=beak-like mass of cells, bv=blood vessel, ca=cortical alveolus, cd=Cuvierian duct, ch=chorion, dl=dorsal lip of the blastopore, ea=ear (otic) vesicle, em=embryonic body, ev=ear (otic) vesicle rudiment, ey=eye, fb=forebrain, gb=gall bladder, gp=guanophores, gt=gut tube, h=heart rudiment, hb=hindbrain, kv=Kupffer’s vesicle, l=lens, lj=lower jaw, lv=liver, mb=midbrain, mf=fin fold, ml=membrane labyrinth, mp=micropyle, no=notocord, od=oil droplet, op=olfactory pit, ot=otolith, pf=pectoral fin, pi=pituitary, pr=pronephros, sc=spinal cord, sp=spleen, uj=upper jaw.
5. TOXICANT EXPOSURE
Developmental exposure of the medaka embryo to a chemical allows the investigator the distinct advantage of observing the embryonic development through the transparent chorion (covering of the egg) such that changes may be observed and noted. The chorion, however, may act as a barrier to some chemicals being tested, and this factor should be taken into consideration. In general, chemicals with a positive LogP values are likely to cross the chorion (Helmstetter and Alden III,1995). An alternative is to dechorionate (see below) the embryo and then proceed with chemical exposure, although this dechorionation may cause higher than usually mortality in the embryos. Because medaka development is regular and predictable, it is especially suited to answer experimental questions regarding the effects of a toxicant during a particular window of development. If, for example, an investigator was interested in the effects of a certain chemical on heart development, using a medaka model would allow exposure the embryo solely during the period of heart development.
Toxicant exposure of adult fish can be accomplished either in a static system or in a flow through system. Volatile chemicals may pose special problems, but suggestions on how to accomplish this type of exposure are in the literature (Walker et al.,1985). When exposing adult fish for more than 24 hours in a static system, a proportion of the aquaria water should be renewed each day to limit the stress on the fish (see section 2h above). It is possible that solubility of the toxicant in fish water is an issue, and this may be solved by first solubilizing the toxicant in dimethylsulfoxide followed by addition of a measured small volume of that solution to the fish water. In our experience, no more than a final concentration of 1% dimethylsulfoxide (volume to volume) should be used for developmental exposures (Oxendine, et al.,2006).
Secton II. Experimental Neurotoxicology Techniques for Medaka
(Author: John Cowden)
INTRODUCTION
Several features of) medaka it an excellent species for neurotoxicity studies. Histological references exist for both the adult medaka brain (Anken and Bourrat, 1998) and development of the embryonic nervous system (Kage et al., 2004). Unlike mammalian model systems, external development and optically clear embryos allow continual monitoring of the early development of the nervous system during chemical exposure. The protocols outlined below were selected because they are broadly applicable for neurotoxicologal studies.
Basic Protocol 1 describes chemical dechorionation of the medaka embryo and use pronase in 6-well plates. This protocol is designed to dechorionate large numbers of embryos rapidly Basic Protocol 2 describes nervous system staining of medaka fry using whole mount antibody staining..
BASIC PROTOCOL 1: PRONASE DECHORIONATION OF MEDAKA EMBRYOS
The chorion of the medaka may act as a barrier to chemicals and reagents, making its removal desirable in some experimental situations. It is also possible to dechorionate the medaka embryo using mechanical means,, but the present protocol outlines chemical dechorionation, because that method is more convenient for large numbers of embryos. This protocol for pronase-mediated dechorionation is a modified version of a previous protocol (Villalobos et al., 2000). The earliest stage for successful dechorionation is stage 20, although there have been reports of younger stages being successfully dechorionated (personal communication from Dr. Ron Hardman)
Materials
Marine Water (see recipe below)
Embryo Rearing Medium (ERM; see recipe below)
1% Pronase (see recipe below)
Phosphate Buffered Saline (PBS; see recipe below)
Basic Protocol 1 - Pronase Dechorionation of Medaka Embryos (stage 20 and older)
Sort embryos by stage into 1× ERM. If using a 6-well plate, use 5 ml of solution per well.
Prepare 1% pronase solution (weight/volume) in 1× ERM.
Place sorted embryos into 1% pronase solution.
Incubate at 34°C in a waterbath with continuous gentle agitation (i.e. shaking all the time).
After approximately 1 hour, check the embryos for changes in chorion (holes or cracks, embryo protoplasm protruding, “crinkly” appearance of chorion, see Figure 3B).
Place embryos with alteration in the chorion into fresh 1× ERM solution without pronase, the residual pronase on the chorion will be sufficient to continue and complete the dechorionation; leave embryos with unchanged chorions in the 1% pronase solution.
Return all the remaining non-dechorionated embryos to the 34°C waterbath with continual agitation; check periodically (i.e. every 15–30 minutes) for changes in the chorion, placing those embryos in 1× ERM without pronase when the chorion shows changes. Because embryos can dechorionate at any time in the pronase-free 1× ERM, monitor them while checking the embyos undergoing 1% pronase digestion.
Once embryos have been dechorionated, either spontaneously or by gentle pushing out of the chorion using forceps, (see Figure 3E), rinse off residual pronase with at least two rinses of fresh 1× ERM.
At this stage, the dechorionated embryos may be used for chemical exposures without the chorion acting as a barrier. Alternatively, the dechorionated embryos may be fixed for staining. To fix embryos, rinse in 1× ERM, then 50% ERM/50%PBS, followed lastly by a 1× PBS rinse; following the final PBS rinse, place embryos in 4% paraformaldehyde and incubate EITHER 2 hours at room temperature OR overnight at 4°C with rocking (i.e. on an LabLine 4631 MaxiRotator) to enable better fixative penetration. If opting for a different fixative in a different buffer, adjust the post-ERM rinses accordingly. A “rinse” simply means transferring embryos to the new solution, swirling briefly (about 5 seconds), then transferring to the new solution.
Figure 3.

Pronase Dechorionation of Medaka Embryos (A-E) Timecourse of embryo dechorionation using 1 % pronase solution. (F) Consequences of pronase overdigestion. A) After separating from clutch, the embryo still has hair fibers and the surface of the chorion has a smooth appearance. B) Following incubation in 1% pronase at 34°, the appearance of the chorion has changed: the hair fibers have been digested and the chorion has a wrinkled appearance (black arrowhead). Small holes have formed in the chorion through which the embryo is protruding (white arrowhead). C) Continued incubation in residual pronase causes large holes in the chorion (white arrowheads). D) Once the chorion has digested sufficiently, the chorion can be easily removed from the embryo. E) An embryo following the pronase dechorionation ready for subsequent experimentation. F) An embryo which has been completely digested by pronase. Scale is identical in panels A–F and is indicated by the scale bar in F. Pictures were taken on an Olympus SZH10 dissection scope (Olympus America Inc, Center Valley, PA) using a Leica DFC480 (Leica Microsystems Inc, Bannockburn, IL) digital color camera.
Recipes
| MARINE WATER | 500 ml |
|---|---|
| Instant Ocean [Aquarium Systems, SS3-50] | 8g |
| Deionized water | to 500ml |
-
-
stir overnight until well mixed; final pH ~8
| 10× ERM | 1000 ml |
|---|---|
| NaCl | 10g |
| KCl | 0.3g |
| CaCl2·2H20 | 0.4g |
| MgSO4·7H2O | 1.63g |
| Deionized water | to 1000ml |
-
-
stir for about 15 minutes at room temperature until complete dissolution
-
-
adjust pH of 10× ERM using sodium bicarbonate solution (0.25g sodium bicarbonate in 20 ml of deionized water); final pH ~7
-
-
for dechorionation, use 1× ERM (dilute 10× ERM with distilled water)
| 1% PRONASE | 10 ml |
|---|---|
| Pronase [Protease from Streptomyces griseus; Sigma-Aldrich, P8811] | 0.1g |
| 1× ERM | to 10ml |
-
-
will have to vortex; brownish-tan color is normal
| 10× PBS (Phosphate Buffered Saline) | 50ml |
|---|---|
| NaCl | 4g |
| KCl | 0.1g |
| Na2HPO4 | 0.72g |
| KH2PO4 | 0.12g |
| ddH20 | to 50ml |
-
-
dilute to 1× PBS in distilled water for dechorionations
BASIC PROTOCOL 2: WHOLE MOUNT ANTIBODY STAINING OF HATCHED MEDAKA FRY
This protocol describes whole mount antibody staining using anti-acetylated α-tubulin [Sigma Aldrich, T6793] for hatched medaka fry (stage 39). It has been modified from a protocol for whole mount staining of cranial nerves (Ishikawa and Hyodo-Taguchi, 1994) to accommodate Alexa Fluor fluorescent secondary antibodies. This protocol is carried out in 2 ml tubes and volumes of all reagents are 1 ml unless otherwise indicated.
Materials
1% Trypsin in PBS (see recipe below)
Zamboni’s Fixative (see recipe below)
4% Paraformaldehyde (see recipe below)
“High Triton” PBS (see recipe below)
“Low Triton” PBS (see recipe below)
Basic Protocol 2 - Whole Mount Antibody Staining of Hatched Medaka Fry
Fix hatched fry in Zamboni’s fixative for 2 – 3hr at 4°C.
Wash in 1× PBS for 3 – 10 days at 4°C with continuous gentle rocking (i.e. on a LabLine 4631 MaxiRotator).
Incubate in freshly prepared 1% trypsin in PBS for 3 hours at 4°C with continuous gentle rocking.
Rinse thoroughly in PBS to remove residual trypsin. To rinse, transfer embryos to a tube containing the fresh solution briefly, then transfer to the new tube containing fresh solution.
Wash in “high Triton” PBS for 2 – 3 days at 4°C with continuous gentle rocking.
Wash in “low Triton” PBS for 30 minutes at 4°C with gentle continuous rocking.
Incubate in mouse anti-acetylated α-tubulin diluted 1:1000 (v/v) in “low Triton” PBS for 2 – 3 days at 4°C with continuous gentle rocking.
Remove primary antibody solution and store at 4°C for reuse. Primary antibody solutions can be used multiple times; the 1:1000 mouse anti-acetylated α-tubulin has been successfully used in our laboratory up to three times.
Wash in “low Triton” PBS for 6 hours at 4°C with continuous gentle rocking.
Select appropriate fluorescent secondary antibody for the desired emission spectra. Incubate in selected fluorescent-conjugated anti-mouse secondary antibody diluted to a final concentration of 5 µg/ml in “low Triton” PBS for 2 – 3 days at 34°C in the dark with continuous gentle rocking.
-
Recover secondary antibody dilution and store at 4°C in the dark.
Secondary antibody solutions can be used multiple times. Both Alexa Fluor 555 donkey anti-mouse IgG [Molecular Probes (Invitrogen), 31570] and Alexa Fluor 488 chicken anti-mouse [Molecular Probes (Invitrogen), 21200] secondary antibody dilutions have been used successfully in our laboratory up to three times.
Rinse thoroughly in “low Triton” PBS to remove excess secondary antibody dilution.
Place embryos on a glass depression slide in “low Triton” PBS. Remove as much “low Triton” PBS surrounding the embryos as possible. Add glycerol or other suitable fluorescence mounting media such as Vectashield (Vector Labs, H-1000) to the embryos. Add a coverslip and examine embryos on a fluorescent microscope.
Recipes
| 1% TRYPSIN | 10ml |
|---|---|
| Trypsin [Sigma Aldrich, T9201] | 0.1g |
| PBS | to 10ml |
| ZAMBONI’S FIXATIVE | 550ml |
|---|---|
| 0.2M Na2HPO4 | 390ml |
| 0.2M NaH2PO4 | 110ml |
| 16% paraformaldehyde | 25ml |
| Saturated Picric Acid [EK Industries Inc, 8539] | 15ml |
| Distilled Water | 10ml |
-
-
pH to 7.3–7.4
| 16% Paraformaldehyde | 50ml |
|---|---|
| Paraformaldehyde [Sigma-Aldrich, 158127] | 8g |
| ddH20 | to 50ml |
-
-
add 10N NaOH to help with dissolving (~1 drop of 10N NaOH/10ml of water)
-
-
stir and heat (not higher than 60°C) in the hood until dissolved
| 0.2M Na2HPO4 | 50ml |
|---|---|
| Na2HPO4 | 1.42g |
| ddH20 | to 50ml |
-
-
Na2HPO4 = sodium phosphate dibasic
| 0.2M NaH2PO4 | 50ml |
|---|---|
| NaH2PO4 | 1.38g |
| ddH20 | to 50ml |
-
-
NaH2PO4 = sodium phosphate monobasic
| “HIGH TRITON” PBS | 50ml |
|---|---|
| Triton X-100 [Sigma Aldrich, T8787] | 500ul |
| Bovine Serum Albmuin [Fraction V, Fisher Scientific, BP1605] | 0.25g |
| 2% NaN3 | 2.5ml |
| PBS | to 50ml |
-
-
2% NaN3 solution is prepared by dissolving 2g of NaN3 in ddH20 to a final volume of 100 ml
| “LOW TRITON” PBS | 50ml |
|---|---|
| Triton X-100 [Sigma Aldrich, T8787] | 150ul |
| Bovine Serum Albmuin [Fraction V, Fisher Scientific, BP1605] | 0.25g |
| 2% NaN3 | 2.5ml |
| PBS | to 50ml |
-
-
2% NaN3 solution is prepared by dissolving 2g of NaN3 in ddH20 to a final volume of 100 ml
COMMENTARY
Background Information
High fecundity, external fertilization, and development in an optically clear chorion make medaka ideal for studying nervous system ontology and pathology. Medaka have long been used in toxicology, and an array of well-developed molecular and genetic tools make medaka suited for mechanism/mode of action studies as well. Several mutant medaka strains have been identified with disruptions in nervous system development (Ishikawa, 2000; Kitagawa et al., 2004; Yoda et al., 2004). Molecular methods of potential use for neurotoxicology studies include transgenesis (Winn, 2001), in situ hybridization (Kage, et al., 2004), cell death assays (Iijima and Yokoyama, 2007), proliferation assays (Candal et al., 2005), and behavioral endpoints (Eisenberg and Dudai, 2004; Park et al., 2005). The completion of a draft medaka genome (Kasahara et al., 2007) will provide additional tools for identifying components of neurotoxicant pathways.
Basic Protocol 1 and Basic Protocol 2 were selected because they are broadly applicable to neurotoxicity studies. In Basic Protocol 1, medaka embryos were bathed in pronase for chemical dechorionation. Another method of dechorionation uses medaka hatching gland enzyme. Although an endogenous protein, the hatching gland enzyme is not specific to the chorion and will digest embryonic tissue. Additionally, different preparations of hatching gland enzyme yield different activity levels, requiring empirical determination of appropriate concentrations. In contrast, chemical dechorionation allows for strict concentration control across experiments. There have also been several reports of mechanical dechorionation of medaka embryos. The primary advantage of chemical dechorionation is the ability to dechorionate a large number of embryos rapidly and simultaneously. Moreover, the chorion of younger medaka embryos (<48 hours) is extremely resilient and mechanical dechorionation often leads to accidental embryo damage. The pronase digestion eliminates inadvertent damage of the medaka embryos by manipulation. Furthermore, young embryos have an internal pressure that forces the embryos out of small holes in the chorion. Bathing the entire chorion in pronase reduces the likelihood of the embryo “oozing” out through a single small hole which is usually the case in mechanical dechorionation.
In Basic Protocol 2, the nervous system structure of hatched medaka fry may be examined using whole mount antibody staining. Measuring changes in protein expression following chemical exposure is one method to characterize neurotoxicant effects and determine mechanism of action. In addition to expression levels, whole mount antibody staining allows the visualization of proteins within the context of the entire animal, providing valuable structural information. While Basic Protocol 2 is designed for examining expression patterns in hatched medaka fry, it could be adapted for younger embryos.
Critical Parameters and Troubleshooting
Basic Protocol 1
Pronase will digest both the chorion and the embryo. Therefore, the critical element of this protocol is to remove the embryo from the 1% pronase solution before the pronase can digest the embryo (see Figure 3F). Monitoring the embryo periodically is essential for preventing destruction of the embryo, as even small holes in the chorion will quickly result in embryo digestion.
Lowering the incubation temperature will slow the reaction.
Basic Protocol 2
This protocol is designed for hatched fry and will have to be adapted for younger embryos, likely by dechorionating the embryos, shortening the trypsin digestion to accommodate smaller amounts of embryonic tissue, and shortening the number of washes.
Trypsin digestion is the most important step of this protocol and should not be shortened (Personal communication from Dr. Yuji Ishikawa, National Institute of Radiological Sciences, Japan),. While the trypsin digest is essential for proper probe penetration, it may have detrimental effects on morphology (see Figure 4A and 4B).
Longer fixation times help maintain morphological integrity, but can prevent probe penetration in thicker tissue regions (see Figure 4E, compare with 4A and 4B).
Another parameter to consider when doing fluorescent antibody staining is background fluorescence. Background fluorescence is fluorescence that is non-specific (i.e., not related to the binding of the antibody to target protein). Sometimes this background fluorescence comes from binding of the primary and/or secondary antibody to non-specific protein targets (see Figure 4F). Blocking in phosphate buffer plus Triton helps eliminate non-specific binding of the primary antibody.
Primary antibodies generated against proteins from other species may not recognize the homologous medaka protein. Select antibodies directed against the most conserved protein regions between the medaka and the antibody producing species and/or antibodies which have shown cross reactivity in immunohistochemical assays across many species.
Antibody binding affinity and protein levels will also affect the sensitivity of this assay and should be considered during the antibody incubations. In general, a weakly expressed protein or a low affinity binding antibody will require longer incubation and/or more concentrated antibody dilutions. Too much primary or secondary antibody also leads to background fluorescence, so optimal dilutions of both primary and secondary antibodies should be determined empirically.
Non-specific fluorescence may also come from the embryo itself (autofluorescence) or as a result of fixation (fixative-induced fluorescence). Medaka fry have autofluorescent pigmented cells along the surface of their body. Fixation induces extensive background fluorescence, even with fixation times as short as 1 hour. This protocol eliminates both autofluorescence and fixative induced fluorescence, likely as a result of extensive washing.
Controls will help distinguish fixative induced fluorescence and background fluorescence from successful antibody staining. The following controls should be included: no antibody control, primary antibody only control, and secondary antibody only control. For the no antibody control, follow Basic Protocol 2, but do not add primary antibody or secondary antibody. Fluorescence in the ‘no antibody’ control is attributable to fixative-induced fluorescence or autofluorescence. For the primary antibody only control, follow Basic Protocol 2, but do not add secondary antibody. Similarly, for the secondary antibody only control, follow Basic Protocol 2, but do not add primary antibody. When compared with the no antibody control embryos, fluorescence seen in either the primary antibody only control or secondary antibody only control embryos indicates non-specific background fluorescence. These three control conditions are important for determining optimal antibody concentrations.
In this protocol, the secondary antibody determines the fluorescence emission color and will only emit fluorescence when exposed to the appropriate excitation wavelengths. Examining embryos under several excitation wavelength is a simple way to distinguish background fluorescence from specific antibody staining. Fluorescence from successful antibody staining should be specific to a particular excitation condition, while background fluorescence will typically appear in several excitation conditions. This simple method does not replace the controls outlined above, but will give a rapid assessment of staining success.
Figure 4.

Anti-acetylated α-tubulin fluorescent staining of hatched medaka fry (A–C) Successful antibody staining of the medaka fry nervous system. (D–F) Technical difficulties encountered while performing anti-acetylated α-tubulin fluorescent antibody staining protocol. A) Dorsal view of a hatched medaka fry developed with Alexa Fluor 488 chicken anti-mouse secondary antibody resulting in green-stained nervous system. B) Dorsal view of a hatched medaka fry developed with Alexa Fluor 555 donkey anti-mouse secondary antibody resulting in red-stained nervous system. C) A higher magnification ventral view of the head of a hatched medaka fry. The optic chiasm (white arrowhead) is clearly visible as are the regions of the brain. D) Lateral view of an artifactually-stained embryo immunostained for anti-acetylated α-tubulin without trypsin digestion E) Ventral view of an embryo fixed overnight at 4EC followed by immunostaining staining. As shown in 2A and 2B (arrows), short fixation time combined with long washes can produce poor morphology. Longer fixation times result in better morphology, though probe penetration is comprised (compare 2E with 2C - optic chiasms indicated by arrowhead). F) Dorsal view of an embryo demonstrating nonspecific background fluorescence. The background fluorescence seen in this embryo is likely due to non-specific binding of the primary antibody. Sonic hedgehog should be expressed in the ventral neural tube and brain. Scale is indicated for each panel. Photographs were taken using a Nikon Eclipse TE200 (Nikon, Melville, NY) upright compound fluorescence scope using a Spot RT Slider Model 2.3.1 digital camera (Diagnostic Instruments, Sterling Heights, MI). Abbreviations: tub = mouse antiacetylated α-tubulin, AF488 = Alexa Fluor 488 chicken anti-mouse secondary antibody, AF555 = Alexa Fluor 555 donkey anti-mouse secondary antibody, O/N = overnight, shh = mouse anti-sonic hedgehog.
Anticipated Results
Basic Protocol 1
Chorions of some embryos digest more quickly than others, even in staged embryos. Hence it is not unusual for the embryos to dechorionate asynchronously. Careful monitoring should yield a high percentage of successfully dechorionated embryos, though some embryo loss is typical.
Basic Protocol 2
At the end of the protocol, the three control conditions (no antibody control, primary antibody only control, and secondary antibody only control) should have little to no fluorescence. In the experimental embryos, the nervous system should fluoresce under appropriate excitation conditions. Antibody staining patterns should accurately reflect endogenous protein expression. Several factors may affect antibody staining including poor probe penetration, morphology, and background fluorescence. Poor probe penetration may result in exclusive surface staining (see Figure 4D). Sensitivity of the assay is determined by the affinity of the primary antibody and the abundance of endogenous target protein.
Time Considerations
Basic Protocol 1
The length of time to dechorionation will vary based upon embryo age, incubation temperature, and pronase concentration. In general, most chorions will show effects of 1% pronase digestion at 34°C in 2 hours or less. The chorions of later stage medaka embryos are easier to digest than earlier stage medaka embryos, and could take less time to dechorionate.
Basic Protocol 2
The amount of washing and antibody incubation length determine protocol duration. In general, extended washing reduces background staining, but can cause morphology problems. Antibody incubation lengths are determined empirically, and depending upon the particular antibodies, protocol length can vary from 9 days to 19 days.
Section III. Determining Sexual Genotype in Medaka after Endocrine Disruption
(authors: Rodney Johnson and Kevin Flynn)
Introduction
In the United States, the Food Quality Protection Act as well as other legislation requires that chemicals be evaluated for their potential to disrupt the endocrine systems of humans and other animals. In addition, the member countries of the Organization for Economic Cooperation and Development (OECD) are also interested in developing test methods for similar evaluations of chemicals for possible effects on both humans and wildlife.
In wildlife, the concern is primarily for population-level effects due to adverse impacts on adult reproduction and/or on reproductive development. In general two types of short-term testing protocols have been developed for assessing chemicals for these types of effects in fish; (1) those that assess reproductive potential directly by exposing adult animals and measuring fecundity and fertility (Ankley et al.,2001; Seki et al.,2006), and (2) early life-stage tests, where developing embryos are exposed and effects on the development of the normal reproductive phenotype are measured (Orn et al.,2003; Seki et al.,2003; Orn et al.,2006). The tests that expose embryos seem to be more sensitive than adult reproduction tests, however most of the endpoints used involve measuring various gender-specific phenotypic effects such as the induction or suppression of egg protein vitellogenin (VTG) production by the liver, development of secondary sex characteristics (i.e. ovipositor in male mosquitofish, anal fin papillae in medaka, fat pad and nuptial tubercles in fathead minnows), and/or histological determination of sex reversal or intersex conditions in the gonads (i.e., gonads with both male and female structures).
For the endpoints mentioned, two methods can be used to analyze for chemical effects. The first and most common method is to determine differences in the phenotype ratio in treated fish compared to the ratio observed in controls. For example, based on gonadal histology, the sex ratio in 17alpha-ethynylestradiol (EE2) treated zebrafish embryos is skewed toward females compared to controls (Orn et al.,2003). Detection of these types of effects, when weakly expressed, requires relatively large sample sizes. In the other method, the sexual genotype and phenotype are compared within each individual. This can be accomplished in at least two ways, by inferring the genotype using sex-linked characters such as pigment variations (Papoulias et al.,1999; Balch et al.,2004), or when possible, by identifying the presence of the sex determining gene directly in each individual. Assessing the effects of chemicals on reproductive development based on concordance of the sexual genotype and phenotype in individual fish requires far fewer animals than methods based on changes in population-level phenotypic sex ratios.
There are several limitations in the sex-linked methods for identifying the sexual genotype such as errors caused by crossover between the actual sex determining gene and the sex-linked trait (i.e., in medaka the error, using the presence of leucophore pigment cells in the skin to identify genetic females is about is about 2% (Wada et al.,1998). Also, strains of fish that have sex-linked phenotypes are sometimes less robust than the wild-type strains. This not only makes them more difficult to use in routine chemical assessments, but also the results obtained may be less representative across the species. Thus, it is preferable when possible, to identify the sex-determining gene directly.
Matsuda et al. (Matsuda et al.,2002) identified the sex determining gene in medaka, DMY. Since the DMY gene is present on the Y chromosome of every somatic cell in males, DNA isolated from any tissue is appropriate for determining genotypic sex including often unutilized tissue such as tail fin, pectoral fin, gills, etc. In this section we outline two quick and efficient PCR protocols for identifying the DMY gene in individual medaka using a small tissue sample, non-invasively obtained from the medaka caudal fin. The choice of protocols depends largely on the availability of equipment. The first protocol relies on fairly commonplace laboratory equipment: a standard thermocycler for PCR, a gel box to separate PCR products, and an ultraviolet (UV) transilluminator to visualize the PCR products. The second protocol uses real-time PCR which requires a specialized thermocycler designed specifically for real-time PCR. For both protocols, any method can be used to isolate the DNA as long as the resulting DNA is of sufficient quality for PCR. Examples of appropriate commercial products include Tri Reagent (Sigma), TRIzol (Invitrogen), and DNeasy Kits (Qiagen).
Basic Protocol 1: PCR/Gel Protocol
Once DNA has been extracted, the presence of DMY (i.e. male), or absence (i.e. female) can be determined using routine PCR amplification methods followed by gel electrophoresis (Shinomiya et al.,2004). Various primer sets with different amplicons (the amplified product of PCR) have been used (Matsuda, et al.,2002; Ohmuro-Matsuyama et al.,2003; Suzuki et al.,2005; Otake et al.,2006), often two primers are chosen to produce two amplicons of different sizes in males and one amplicon in females: one amplicon is from the DMY gene (NCBI accession # AB071534) while the other amplicon is from a closely related somatic gene (for example DMRT1, NCBI accession # AY442916).
Materials
10× PCR Buffer (Sigma # P2317)
MgCl2 (25 mM)
dNTP mix (10 mM of each nucleotide)
JumpStart Taq DNA polymerase (Sigma # D4184)
DEPC treated water
1× TBE [per liter water: 54 g Tris base, 27.5 g boric acid, 20 ml 0.5 M EDTA (pH 8.0)]
NuSieve 3:1 (Cambrex #50091)
Ethidium bromide (10 mg/ml)
Thermocycler (i.e. MJ Research PTC-200)
UV transilluminator
- Prepare PCR Master Mix on ice.
Reagent Volume per Sample Final Concentration 10× PCR buffer (Sigma # P2317) without MgCl2 5 Φl 1× MgCl2 (25 mM) 3 Φl 1.5 mM dNTP mix (10 mM each nucleotide) 1 Φl 0.2 mM each NTP PG17.19 (5’ GAA CCA CAG CTT GAA GAC CCC GCT GA 3’)* 4 Φl 80 nM PG17.20 (5’GCA TCT GCT GGT ACT GCT GGT AGT TG 3’)* 4 Φl 80 nM JumpStart Taq DNA polymerase (Sigma # D4184) 2.5 unites/ul 1Φll 2.5 units DEPC treated water 30 Φl X *from (Inui et al.,2003). Add 48 Φl of Master Mix then 2 Φl of sample to each PCR tube.
- Run thermocycler protocol, generating a single 1900 base pair amplicon in males and no product in females.
Step # Temperature Time 1 94 C 3 min 2 94 C 30 sec 3 60 C 30 sec 4 72 C 2.5 min 5 Go to step 2 35 times 6 72 C 5 min Prepare a 1% NuSieve 3:1 agarose gel (Cambrex #50091) in 1× TBE with 10 Φg ethidium bromide per 25 ml agarose in order to visualize amplicons.
Samples can be electrophoresed at up to 10 V/cm to shorten electrophoresis time since high resolution and band quality are not required. Again, with these primers males will produce a single band at about 1900 base pairs while females will not produce any amplicon.
Alternate Protocol 1: High Through-Put PCR Protocol
Alternatively, a higher throughput method based on real-time PCR taking advantage of a 96-well plate format to increase analysis efficiency has been developed and used successfully in our laboratory (Haasch et al.,in preparation). For this type of DMY analysis, the DNA isolation/purification is identical to that of the PCR-agarose gel based analysis. Once the DNA is extracted from the tissue sample, the presence of DMY (identifying the individual as a male) is determined on a real-time thermocyler, eliminating the need to run an agarose gel for amplicon identification. This method greatly increases the throughput of the analysis by taking advantage of 96-well plate formats and automated data analysis, allowing the simultaneous analysis of at least 90 unique DNA samples.
The protocol utilizes a Taqman® assay, a variant of real-time PCR to detect amplification of the DMY gene in each well of the 96-well plate. Starting at the designed primers, DNA polymerase moves downstream synthesizing a new strand from the template strand and via its 5’ exo-nuclease activity, the polymerase removes any bases that would impede its progress down the template strand. A Taqman® assay (5’ nuclease assay) uses this 5’ exo-nuclease activity in real time detection of PCR product. A Taqman® probe, present in the PCR mix, anneals to the template between the two primers in the path of the DNA polymerase as it progresses on the template strand. The Taqman® probe is a short sequence of DNA (~20 bp) with a reporter fluorophore on one end and a quencher on the other end. The close proximity of these two moieties allows interaction, prohibiting the fluorescence of the reporter and thus its detection upon excitation within the real time instrument. When the DNA polymerase cleaves the probe, however, both reporter and quencher are released into solution, and the distance between the two increases allowing the reporter to fluoresce upon excitation. The quantity of fluorescence from the reporter during the exponential phase of PCR is directly proportional to the amount of target sequence in the sample. During PCR, amplicon production goes through three phases: 1) the exponential phase where doubling of amplicon is occurring every cycle and the reaction is very specific and precise; 2) the linear phase where reagents are becoming rate limiting, the reaction slows and amplicons may start to degrade; and 3) plateau phase where the reaction has stopped with no additional product formed (Figure 1). Again, during real-time PCR, fluorescent measurements are taken during the exponential phase while with traditional PCR, the reaction is often terminated in the plateau phase and amplicons are detected with a gel.
Because the DMY gene is only present in genotypic males, true quantification is not necessary, only verification of this sequence within the DNA sample. Therefore, the samples normally used to generate a standard curve for quantification are omitted from the 96 well plate. In addition to the PCR reagents for identifying DMY, reagents to amplify the 18s ribosomal subunit (an endogenous positive control) are included in the PCR master mix to verify that 1) no inhibitors of PCR are present in the sample and 2) that the DNA was of sufficient quantity and quality for PCR methods. Briefly, the endogenous positive control (EPC) is another Taqman® assay duplexed with the DMY assay that amplifies a segment of 18s DNA (or cDNA) with reaction limiting primers and a spectrally distinct reporter fluorophore. Samples positive for the target (DMY, males) have increased fluorescence from both the Taqman® probes for DMY and the EPC. Samples negative for the target (no DMY, females) have increased fluorescence only with the EPC probe, and samples with PCR inhibiting contamination or no DNA, have only baseline fluorescence with both probes.
Materials
Taqman® Universal PCR Master Mix (Applied Biosystems #4304437)
18S rRNA Taqman® Assay Reagent (Applied Biosystems #4319413E)
RNase free water
Real-time thermocycler (e.g., Applied Biosystems 7500)
Primers and a Taqman® probe were designed in Primer Express (Applied Biosystems) using the default parameters to detect an appropriate sized amplicon (~150 bp) unique to the DMY gene.
- Prepare PCR Master Mix on ice.
Reagents Volume per
SampleFinal
ConcentrationTaqMan® Universal PCR Master Mix 12.5 1× 18S rRNA reagent 0.25 0.21× DMY HTP Forward (5’ TTC TGC TGG AAA GAC 3’) 1.75 0.7 nM DMY HTP Reverse (5’ TCT CTG GCG GAC CAT GAT 3’) 1.75 0.7 nM DMY HTP Probe (5’ FAM-CCA GTG CTT CAA ATG CGA GCA-BHQ 3’) 4.0 200 nM RNase free water 2.25 -- Using a pre-chilled 96 well optical plate, load each well with 22.5 Φl of Master Mix and add 2.5 Φl of the DNA sample
Seal, vortex, and centrifuge plate at 500 × g for 5 minutes to mix the samples with the Master Mix and remove any bubbles. Air bubbles in the well will alter the fluorescent measurement.
- Run the thermocycler protocol, producing increasing fluorescence in the DMY channel in males and not in females. Simultaneously, the fluorescent signal in the EPC channel should increase in every well.
Step # Temperature Time 1 50 C 2 min 2 95 C 5 min 3 95 C 15 sec 4 60 C 1 min 5 Go to step 3 30 times Determine the genotypic sex of each individual based upon the fluorescence in the DMY channel.
As mentioned previously, quantification of DMY is not necessary, the specific the number of DMY copies in the sample being irrelevant. The important information is the presence of DMY based on sufficient fluorescence to exceed a critical threshold (Ct). Individuals that exceed the Ct are genotypic males (DMY positive), and those that do not exceed the Ct are genotypic females (DMY negative). For quality assurance purposes three types of controls are included on each plate: 1) no template controls (NTC), 2) DMY positive controls (DNA sample from a known male), and 3) DMY negative controls (DNA sample from a known female).
COMMENTARY
Background Information
Genotypic sex information can be used in various research applications in developmental and reproductive biology. It is currently being used in several stages of long-term test protocols being developed for assessing the reproductive and developmental effects of chemicals on fish. In some of these protocols fecundity and fertility are measured in replicates of breeding pairs that are selected according to secondary sex characteristics. In fish exposed to endocrine disrupting chemicals (EDC), these characters are often ambiguous. This limitation can be easily overcome by segregating the fish into pairs, sampling the dorsal or ventral tip of each caudal fin, and identify the genotypic sex of each fish with RTPCR. From this information unambiguous breeding groups can be assembled.
Genotypic sex data is also helpful when analyzing for treatment effects that change gender-specific phenotypes. This is especially important for those endpoints where, without knowing the genotypic sex of the individual, it would be impossible to determine the “true” sex of the fish. For example, as shown in Figure 6, panel C, the gonadal tissue of fish exposed to EDCs during development can express histological structure of both sexes (i.e. intersex gonads). Under some conditions the expressed gonadal phenotype is completely opposite (i.e. sex reversed) of the genetic sex of the individual (Fig. 6, panel D). Without genotypic sex data, complete sex-reversal can only be determined by changes in the population sex-ratio, which requires much larger sample sizes to detect. Table 1 shows data comparing the gonadal phenotype with the genotypic sex of medaka exposed to 17-Ǝestradiol during development.
Figure 6.
Representative histological sections from medaka, stained with hematoxylin and eosin. (A) a normal ovary from an unexposed XX fish, (B) a normal testis from an unexposed XY fish, (C) a gonad from a XY fish exposed to 17-β estradiol showing substantial amounts of both testicular and ovarian tissues (intersex), and (D) a gonad from a XY fish exposed to 17-β estradiol with almost exclusively ovarian tissues.
Table 2.
Possible outcomes and interpretations in liver sections from treated vs. control medaka.
| Cell proliferation index |
Apoptotic index |
Pan- cytokeratin |
Interpretations |
|---|---|---|---|
| − | − | − | Toxicant has no adverse effect on liver |
| + | + | − | Cells of liver independent of biliary passageways were targeted |
| − + |
+ + |
+ + |
Toxicant targeted biliary epithelial cells as in acute toxicity. |
| + | − | + | Depending on duration (chronic) suggests remodeling of intrahepatic biliary passageways |
| − | − | + | Chronic toxicity has been repaired, biliary passageway architecture remains altered |
Symbols:
no difference detected between treatment and control
significant difference detected between treatment and control
There are various outcomes not mentioned above. For example: whether the structure of the biliary cells shows alteration (swelling or shrinkage) after treatement; whether the nature of the tissue change constitutes hypertrophy or hyperplasia; and/or whether the space lined by the biliary cells shows alteration. Our intent here was to show how the method can be used to identify definitively biliary epithelia and to determine quantitative changes within the intrahepatic biliary cellular compartment with respect to cell proliferation and/or programmed cell death (apoptosis).
Comparisons of the genotypic sex of individuals to other endpoints based on gender-specific phenotypes can also be useful. For instance as noted above, the presence of papillae on the anal fin of medaka is an easily evaluated male phenotype, which like the gonad, is also EDC-responsive. Hopefully, using genotypic sex information in new test protocols will result in methods for evaluating chemicals that are more sensitive, cost effective, and use fewer animals.
As mentioned above, being able to identify the genotypic sex of individuals can be used in various ways during test protocols. Perhaps it is most useful for evaluating chemical treatment effects on the development of gonads and secondary sex characteristics. Several test methods that use medaka to evaluate chemicals for endocrine disrupting activity are being developed that incorporate genetic sex determination as part of the data analysis. In most of these protocols, the fish are exposed to the test agent or chemical, at a non-toxic level, by dissolving the chemical in the water (usually without carrier solvents), which is constantly delivered to the fish in the exposure aquaria. Usually several dose (concentration) levels are tested simultaneously to allow evaluation of the lowest-observed-effect-levels (LOEL) and no-observed-effect-levels (NOEL) for each test chemical.
Critical Parameters and Troubleshooting
If using the “traditional” PCR method followed by gel electrophoresis (i.e., Basic Protocol), the most important parameter to monitor is the amplicon size as verified on the gel. The size of the bands on the gel for each fish need to be used to verify both that PCR was not inhibited and if applicable, that the correct product was amplified. If using the high-throughput method (i.e., Alternate Protocol), the 18s rRNA reagents verify that PCR was not inhibited and without these reagents, it would be impossible to determine whether an individual is a female or if there were inhibitors of PCR present.
Anticipated Results
Irrespective of the protocol, the data output is the same: whether an individual medaka is a genotypic male (XY) or a genotypic female (XX). The biological error rate (i.e, thespontaneous prevalence in wild populations of disconcordance between phenotypic and genotypic sex) appears to be 1% or less (Shinomiya, et al.,2004). However, in our facility to date, we have not seen a genotype to phenotype mismatch in the several hundred unexposed (control) fish that have been analyzed. Regardless, the protocols detailed provide efficient and accurate determination of the genotypic sex of medaka (Shinomiya, et al.,2004).
Time Considerations
The time to extract DNA from samples depends on the technique used. In our laboratory, we routinely use DNeasy kits (Qiagen) that extract PCR-ready DNA in about 2 hours. A digestion step in these kits can be completed in as little as 30 minutes or can be extended to an overnight incubation, allowing flexibility within the protocol. Once DNA is extracted, a 96 well plate can be manually loaded with PCR master mix and appropriate samples in about 30 minutes, followed by approximately 1.5 hours of thermocycler time and a realtime instrument. Alternatively, samples and master mix can be loaded into PCR appropriate tubes and run on a “traditional” thermocycler in about the same time. The amplicons, however, then need to be verified via gel electrophoresis which takes a couple more hours with far less throughput than realtime PCR.
Section IV: Methods to Detect Toxic Alterations in the Intrahepatic Biliary Passageways of Medaka (Oryzias latipes).
Authors: Bonny B. H. Yuen, Ronald C. Hardman, David E. Hinton, Sheran Law, Seth W. Kullman and Doris W. T. Au.
INTRODUCTION
Due to their use in studies of acute and chronic toxicity, small aquarium fish, such as medaka and zebrafish, are becoming widely-used laboratory fish models (Shima and Mitani,2004; Alestrom et al.,2006). The liver and its biliary system is a target for various toxicants, and we present a related group of methods to determine toxic responses of the intrahepatic biliary system. Previous studies from this laboratory have shown that the intrahepatic biliary system of channel catfish (Ictalurus punctatus), trout (Oncorhynchus mykiss), or medaka (Oryzias latipes) have numerous transitional passageways (bile preductules) between canaliculi of hepatocytes and the biliary ductules (Hampton et al.,1988; Okihiro and Hinton,2000; Hardman et al.,2007). We have shown that these transitional passageways: (1) occur commonly in the parenchymal compartment, (2) are lined by epithelial cells that share junctional complexes with hepatocytes and (3) form numerous passageways (Hampton et al.,1989). Together, these structures comprise the intrahepatic biliary passageway that was only recently well defined in 3-D reconstructions of living, “see-through” medaka (STII strain) (Hardman, et al., 2007). Due to their location, swelling of these cells may serve to distort lumens of intrahepatic biliary passageway, causing transient or longer alteration in bile flow, resulting in toxic states.
The intrahepatic biliary system of the medaka, like that of rodent models, responds to toxic injury as exhibited by chronic toxicity associated with hepatic tumorigenesis (Okihiro and Hinton,1999,2000) or independent of carcinogenesis, viz. degeneration (Wolf and Wolfe,2005). In addition, gall bladder lesions and cystic alteration in the bile duct were reported in medaka treated chronically with bromodichloromethane, a water disinfection residual (Toussaint et al.,2001). The purpose of this small fish method description is to provide detail on: (1) the definitive recognition of biliary epithelial cells in fish liver, (2) their differentiation from other liver cells types, and (3) their proliferation and apoptosis--making a spectrum of alterations accompanying intrahepatic biliary toxicity.
Our studies in the see-through (ST II) medaka concentrated on α-naphthyl isothiocyanate (ANIT), a reference biliary toxicant. ANIT toxicity is well described in rodent models where responses include: cytotoxicity (e.g. impaired mitchondrial function, small biliary epithelial cell necrosis) in biliary epithelium of bile ductules and ducts; cholestasis (Woolley et al.,1979; Hill and Roth,1998; Orsler et al.,1999; Waters et al.,2002); and biliary tree arborization, viz., biliary epithelial cell hyperplasia resulting from decreased bile secretion/transport and bile duct(ule) obstruction (Connolly et al.,1988; Alpini et al.,1992; Masyuk et al.,2003). Our approach in medaka was to differentiate biliary epithelial cells and passageways from other liver components, determine whether exposure resulted in apoptosis of these cells and finally, whether surviving cells underwent proliferation to repopulate the system.
OVERVIEW OF METHODS
Due to small body size of medaka, whole fish, rather than liver alone, are processed and embedded in paraffin for morphological analysis. In practice, decalcification of the fixed organism is common. This allows sectioning of entire carcass for survey histopathology without sectioning artifacts caused by presence of bones; however, due to possible interaction between decalcification fluid and antigenic properties, we used the approach described below.
morphological examination of the entire individual enables simultaneous analysis of multiple organs;
toxicant(s) may affect more than one organ (e.g., apoptosis and/or proliferation of cells may occur in liver and other sites such as kidney or gut);
simultaneous localization of protein(s) of interest (e.g., pan-cytokeratins) or other specific cellular reactions in various organs, serves as an in situ biological control.
ANESTHESIA, SACRIFICE, FIXATION AND PARAFFIN EMBEDMENT
Sacrifice fish through anesthetic overdose by immersion in chilled water containing 1% (w/v) MS-222 (ethyl 3-aminobenzoate methanesulfonate, product #A5040, Sigma-Aldrich Co).
With plastic Pasteur pipette, immediately flush fixative (GPHS – prepared as below) over gills and into mouth and pharynx.
- Either decapitate fish or remove the following bones from the head region to prevent sectioning artifacts (Fig. 7):
- skull roof
- otoliths
- operculum
Release gas from swim bladder to facilitate immersion of fish in GPHS fixative (Fig. 7). With sharp scalpel, cut body wall along dorso-ventral path from midway between anal vent and anal fin at ventral midline to area of head kidney (rostral trunk). Press lateral body wall gently releasing gas bubbles.
Open abdominal cavity by making a cut through the ventral body wall along midline from anal vent to the pectoral girdle facilitating entry of fixative to internal organs. Flush inside with additional fixative by use of plastic pipette.
Cut away and discard pectoral, pelvic, dorsal, anal and caudal fins.
Immerse single fish in 20 volumes of GPHS fixative within glass vial. Cap and store overnight at 4C.
Figure 7.

Specific steps in the removal of skull roof and otoliths of STII medaka. (a) fish mounted on a wax plate and secured in position by pinning the mouth. Gently scrap away scale and skin of the skull roof with curved forceps by moving forceps backward from the mouth. (b) skull roof removed from the parietal with fine forceps, as indicated with arrow. (c) exposed brain after removal of skull roof. (d) otoliths located in the granial grooves between the midbrain and hindbrain indicated by arrows. Pull otoliths out by inserting fine forceps along the side of cranium. Note: Extra care needs to be taken when removing otoliths, as brain is very soft tissue. Insert: a pair of otoliths. (e) release of gas from swim bladder by cutting body wall along dorso-ventral path from midway between anal vent and anal fin at ventral midline to area of head kidney by pressing curved forceps gently.
Preparation of GPHS Fixative
0.05% glutaraldehyde-2% paraformaldehyde-80% HistoChoice containing 1% sucrose
-
▪25% glutaraldehyde (EMS)
- Place stocks, aliquots, into small vials and store at −20°C. Thaw and return to room temperature before use.
-
▪16% paraformaldehyde (Sigma) (Freshly prepared or stored overnight at 4°C)
- Dissolve 16 g paraformaldehyde powder in 100 ml ddH2O by heating to ca. 60°C under a fume hood. Add 1 N KOH, drop by drop, stirring until the solution clears.
-
▪
Amresco® HistoChoice™ MB fixative (Amresco)
-
▪
Sucrose (Sigma-Aldrich Co)
Pour 80 ml HistoChoice™ MB fixative slowly into a measuring cylinder to avoid foaming, then, add 0.2 ml 25% glutaraldehyde and 12.5 ml 16% paraformaldehyde. Make up to 100 ml with ddH2O. Add 1 g sucrose and mix well. Make fresh or store at 4° C overnight.
Tissue Processing
For processing, follow steps as listed below.
Tissue processing steps
| Chemicals | Time (min) | Temperature (°C) |
|---|---|---|
| Fixation – GPHS fixative | Over night | 4°C + rotation |
| Dehydration | ||
| 70% ethanol | 40, 10 | RT + rotation |
| 85% ethanol | 40, 10 | RT + rotation |
| 95% ethanol | 40, 10 | RT + rotation |
| 100% ethanol | 40, 40, 10 | RT + rotation |
| Clearing | ||
| xylene | 30, 30, 30 | RT + rotation |
| Infiltration | ||
| Paraplast Plus | 60 | 58 – 60 |
| Paraplast Plus | 60 | 58 – 60 |
| Paraplast Plus | 60 | 58 – 60 |
| Paraplast Plus (embedding mold) | 60 | 58 – 60 |
Note: RT = room temperature
Orientation and Embeding
Cover bottom of specimen mold with melted paraffin (Paraplast plus, EMS).
Place mold (EMS) on bench top at room temperature and as paraffin cools, quickly orientate specimen with left lateral surface down, pour melted paraffin over specimen. Place embedding ring (EMS) onto mold and complete filling of paraffin.
After block has solidified, remove block with embedding ring intact and store in refrigerator at (4°C) until ready to section.
Using a rotary microtome (MICROM International GmbH), section each block at 5 µm and mount on poly-L-lysine coated glass slide (EMS).
At this point, glass slides are ready for immunohistochemical labeling as described below.
IMMUNOHISTOCHEMISTRY
Cell proliferation (PCNA)
Cell proliferation is measured by detecting the proliferating cell nuclear antigen (PCNA), a protein synthesized in early G1 and S phases of the cell cycle.
- deparaffinize tissue section
• xylene (5 min × 3) • 100% ethanol (3 min × 3) • 95% ethanol (5 min) • 70% ethanol (5 min) • ddH2O (5 min × 2) - tissue pretreatment
• immerse sections in 10 mM citrate buffer, pH 6.0 • boil for 3 cycles of 3 min each in a microwave oven, with 3 min gaps in between each boiling • let the solution sit on bench for 30 min • rinse in ddH2O (2 min × 2) - quenching endogenous peroxidase
• 3% hydrogen peroxide in 1× PBS (5 min) • Rinse in 1× PBS (2 min × 2) - protein blocking
• 10% normal goat serum (20 min) - primary antibody incubation
• mouse anti-PCNA antibody (Dako, M0879), 500 fold dilution in antibody diluent (Dako S0809) • incubate in a humidified chamber at 37° (1 hour) • rinse in 1× PBS (5 min × 3) - secondary antibody incubation
• goat anti-mouse-HRP conjugated immunoglobulins (DakoCytomation Envision+ System-HRP) (Dako, K4006) • incubate in a humidified chamber at room temp. (30 min) • rinse in 1× PBS (5 min × 3) - color-substrate development
• apply substrate-chromogen (DAB) (Dako, K4006) (3 – 6 min) • rinse 1 min in running tap water - counterstain specimen
• Harris’ hematoxylin (1 min) • rinse 1 min in running tap water - dehydration
• 70% ethanol (1 min) • 95% ethanol (1 min) • 100% ethanol (1 min × 3) • Xylene (1 min × 3) - mounting specimen
- mount under a glass coverslip in Permount (Fisher Scientific, UN1294)
The degree of cell proliferation is represented by cell proliferation index, which is calculated as follows:
Apoptosis (ApopTag®)
DNA fragmentation associated with apoptosis in the liver is detected quantitatively using a commercial ApopTag® Plus Peroxidase In Situ Apoptosis Detection Kit (Chemicon International) according to the terminal deoxyribonucleotidyl transferase-mediated nick end labeling (TUNEL) method.
- deparaffinize tissue section
• xylene (5 min × 3) • 100% ethanol (3 min × 3) • 95% ethanol (5 min) • 70% ethanol (5 min) • ddH2O (5 min × 2) - tissue pretreatment
• immerse sections in 10 mM citrate buffer, pH 6.0 • boil for 3 cycles of 3 min each in a microwave oven, with 3 min gaps in between each boiling • let the solution sit on bench for 30 min • rinse in ddH2O (2 min × 2) - quenching endogenous peroxidase
• 3% hydrogen peroxide in 1× PBS (5 min) • Rinse in 1× PBS (2 min × 2) - applying equilibration buffer
• apply 75 µL/5 cm2 of equilibration buffer (at least 10 s) - applying working strength TdT (terminal deoxyribonucleotidyl transferase) enzyme
• tap off excess equilibration buffer • apply 55 μL/5 cm2 working strength TdT enzyme • incubate in a humidified chamber at 37° (1 hour) - applying stop/wash buffer
• agitate sections in stop/wash buffer (15 s) • incubate (10 min) • rinse in 1× PBS (2 min × 3) - applying anti-digoxigenin conjugate
• apply 65 μL/5 cm2 • incubate in a humidified chamber at room temp. (30 min) • rinse in 1× PBS (2 min × 4) - color-substrate development
• apply 75 μL/5 cm2 peroxidase substrate (DAB) (3 – 6 min) • rinse 1 min in running tap water - counterstain specimen
• Harris’ hematoxylin (1 min) • rinse 1 min in running tap water - dehydration
• 70% ethanol (1 min) • 95% ethanol (1 min) • 100% ethanol (1 min × 3) • Xylene (1 min × 3) - mounting specimen
- mount under a glass coverslip in Permount (Fisher Scientific, UN1294)
The degree of apoptosis in the liver is represented by the apoptotic index, which is calculated as follows:
Pan-cytokeratins (AE1/AE3)
Biliary epithelial cells and/or bile preductular epithelial cells are localized and detected by the application of Zymed’s monoclonal Mouse anti- Cytokeratin (Pan) (clone: AE1/AE3) antibody, which is intended to stain cytokeratin filaments of epithelial cells.
- deparaffinize tissue section (5 Φm)
• xylene (5 min × 3) • 100% ethanol (3 min × 3) • 95% ethanol (5 min) • 70% ethanol (5 min) • ddH2O (5 min × 2) - tissue pretreatment
• immerse sections in 10 mM citrate buffer, pH 6.0 • boil for 3 cycles of 3 min each in a microwave oven, with 3 min gaps in between each boiling • let the solution sit on bench for 30 min • rinse in ddH2O (2 min × 2) - quenching endogenous peroxidase
• 3% hydrogen peroxide in 1× PBS (5 min) • Rinse in 1× PBS (2 min × 2) - protein blocking
• 10% normal goat serum (20 min) - primary antibody incubation
• mouse anti-AE1/AE3 antibody (Zymed, 08-0132)), 200 fold dilution in antibody diluent (Dako S0809) • incubate in a humidified chamber at 37°C (1 hour) • rinse in 1× PBS (5 min × 3) - secondary antibody incubation
• goat anti-mouse-HRP conjugated immunoglobulins (DakoCytomation Envision+ System-HRP) (Dako, K4006) • incubate in a humidified chamber at room temp. (30 min) • rinse in 1× PBS (5 min × 3) - color-substrate development
• apply substrate-chromogen (DAB) (Dako, K4006) (3 – 6 min) • rinse 1 min in running tap water - counterstain specimen
• Harris’ hematoxylin (1 min) • rinse 1 min in running tap water - dehydration
• 70% ethanol (1 min) • 95% ethanol (1 min) • 100% ethanol (1 min × 3) • Xylene (1 min × 3) - mounting specimen
- mount under a glass coverslip in Permount (Fisher Scientific, UN1294)
COMMENTARY
BACKGROUND INFORMATION
Bile synthesis and transport, performed by the hepatobiliary system, are essential life functions and fundamental to the elimination and removal of metabolic byproducts. Impairment of bile synthesis and transport (i.e., cholestasis) often results in morbidity and mortality due to the accumulation of endogenous and exogenous substances and their metabolites within the liver (Alpini et al.,2002; Wolkoff and Cohen,2003).
Previous studies have shown that the hepatobiliary system of channel catfish (Ictaulurus punctatus), rainbow trout (Oncrhynchus mykiss) and medaka (Oryzias laptipes) contains numerous biliary passageways, termed bile preductules, between hepatocelluar canalicui and biliary epithelia cell (BEC), delimited bile ductules (Hampton, et al.,1988; Okihiro and Hinton,2000; Hardman, et al.,2007). These transitional biliary passageways are anatomically analogous to peri-portal canals of Hering and oval cells (i.e., putative progenitor cells) in the mammalian liver (Fausto and Campbell,2003).
Recent in vivo studies in medaka livers elucidated that they are replete with bile preductular epithelial cells closely associated with the transitional biliary passageways (i.e., bile preductules) (Hardman, et al.,2007). From previous investigations, injury to preductular epithelial cells may serve to distort bile preductular lumina and altering intrahepatic bile flow, viz cholestasis. It is, therefore, essential to recognize these cells in normalcy and disease, and to understand the spectrum of responses of the hepatobiliary system to xenobiotics that target this special cell type (i.e., preductular epithelial cells).
Previous study has used light and transmission electron microscopy to examine and distinguish preductular epithelial cells in rainbow trout liver (Hampton et al.,1985). Due to the small size (< 2µm in diameter), however, these cells are difficult to identify under conventional light microscopic analysis, and therefore, biliary toxicity is not uniformly recognized by various workers. More importantly, it is often time consuming and requires expertise to examine preductular epithelial cells under transmission electron microscope; thus, data on these initial biliary epithelial cells is limited. Enzyme histochemical localization of magnesium-dependent ATPase has been employed by researchers to identify the biliary system in rainbow trout (Hampton, et al.,1985; Hampton, et al.,1988), in which deposits of lead sulfide mark sites of enzyme activity along the plasma membrane of biliary passageways (i.e., canaliculi, bile preductules, ductules and bile ducts). This method is, however, not routinely used due to its requirement of frozen tissue and the increased level of safety precautions required due to the use of lead as a substrate.
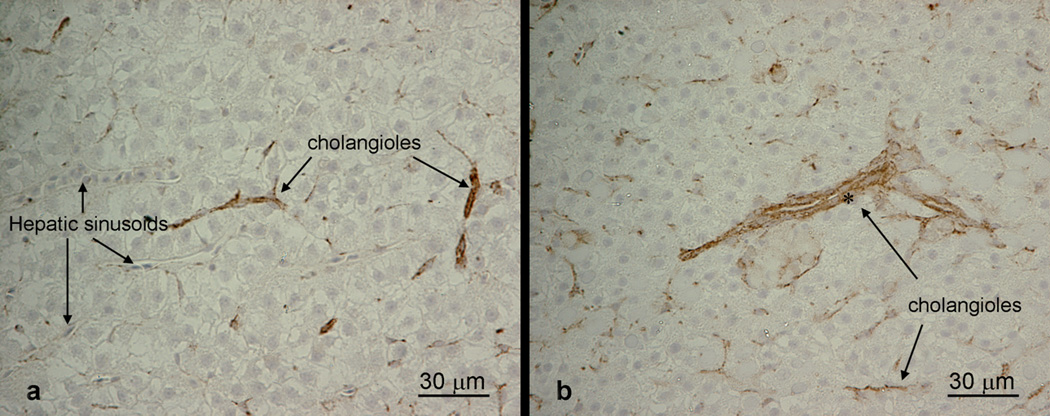
Immunohistochemical localization of preductular epithelial cells via anti-pan-cytokeratin antibodies (Zymed, 18-0132) provides a much safer and convenient alternative. Anti-pan-cytokeratin antibodies recognize cytokeratin filaments of biliary epithelial cells including bile preductular epithelial cells and cuboidal epithelial cells in medaka liver, as demonstrated herein, as well as in rainbow trout (Okihiro and Hinton,2000) and striped bass (Bunton,1993). This method has an added advantage over routine microscopic and enzyme histochemical analyses as co-localization of proteins of interest can be performed simultaneously on the same tissue section via a combination of primary antibodies (i.e., anti-pan-cytokeratins and anti-PCNA, and/or anti-pan-cytokeratins and ApopTag), which gives us valuable information on understanding the toxic mechanism on some drugs (i.e., target cell types, cytotoxic and/or stimulative).
For the purposes of demonstration of the procedures and their relationship to induction of intrahepatic biliary toxicity in medaka, we followed procedures recently published (Hardman et al., 2007). Larval medaka were exposed to a range of aqueous concentrations of ANIT for 24–72 hours duration, and a concentration of 5 micromolar was selected for use. We also employ, in adult medaka, a single intraperitoneal injection of 40 mg/kg of ANIT in DMSO carrier vehicle and sample anesthetized fish at 48–72 hours post exposure.
Critical Parameters and Troubleshooting
Excessive Background Staining
Sometimes, because of the variability of specimens and preparation techniques, certain tissues may give excessive backgrounds or false-positive staining. Where this is encountered, we recommend the following methods.
The suggested color-substrate development time range is approximate since the rate of color development is influenced by differences in specimen composition and room temperature. Shortening the color-substrate development time should reduce background staining.
Another probable cause of excessive background staining could be due to high endogenous peroxidase activity of the specimen. Increased incubation time of peroxidase block should reduce this background staining.
Also, incomplete removal of paraffin and/or incomplete rinsing of slides could attribute to excessive background staining. Use fresh xylene or toluene baths, and fresh solutions in buffer baths, to reduce background staining.
Commonly, sections that become desiccated during staining procedures also show increased background staining. Use a humidified chamber and wipe only three to four slides at a time before applying reagent to diminish likelihood of desiccation.
Non-specific binding of reagents to tissue sections could also contribute to high background staining. This may be addressed by application of a blocking solution containing an irrelevant protein thereby reducing the background.
Last, but not least, is concentration of primary antibody (i.e., anti-PCNA or anti-pan-cytokeratin). To prevent overstaining, reduce primary antibody concentration. We recommend final dilutions ranging from 1:200 – 1:2000 for the pan-cytokeratins; and, 1:500 – 1:2000 for anti-PCNA.
When using ApopTag® Peroxidase Kit, start with control liver sections and deploy a range of working strength TdT. This commonly results in a single labeled nucleus in 100 total nuclei. Then, employ the identical conditions and procedures to establish rate of apoptosis in exposed individuals. In practice, we find that use of dilutions in the range of 1:5 to 1:16, instead of the recommended 1:3 results in a decrease in the non-specific staining.
Weak Staining
Weak staining occurs when sections retain excessive solution after washing with PBS and/or when slides are not incubated long enough. This could be solved by gentle tapping of wet slides to remove excess solution or by careful wiping around section to remove excess. In addition, increasing incubation time and/or increasing concentration of primary antibodies (i.e. anti-PCNA and anti-pan-cytokeratins) may yield satisfactory results.
In the case of the detection of apoptosis using ApopTag® Peroxidase Kit, we occasionally encounter apoptotic nuclei with a pale tan color. In our experience these nuclei, although positive, will not be discernible after counterstaining to reveal tissue architecture. In this case, we recommend a lighter background of the DAB substrate and achieve this using a 1:20 rather than a 1:50 (manufacturer recommended) dilution. Such an adjustment enables detection of apoptotic nuclei in stained sections of tissue.
Anticipated Results
Time Considerations
The fixation, embedment, and sectioning of the paraffin sections is the most time consuming portion of the protocols (4 days). The paraffin blocks, however, may be archived and used for more rapid assessment between studies. The performance of the other tests: proliferating cell nuclear antigen (PCNA), immunohistochemistry of anti-pancytokeratin, and apoptosis require a day per each, but can be run simultaneously on paraffin sectioned material. Finally, the semiquantitative determination of proliferating cells and of apoptosis requires approximately 1 hour per liver from one animal.
Figure 5.
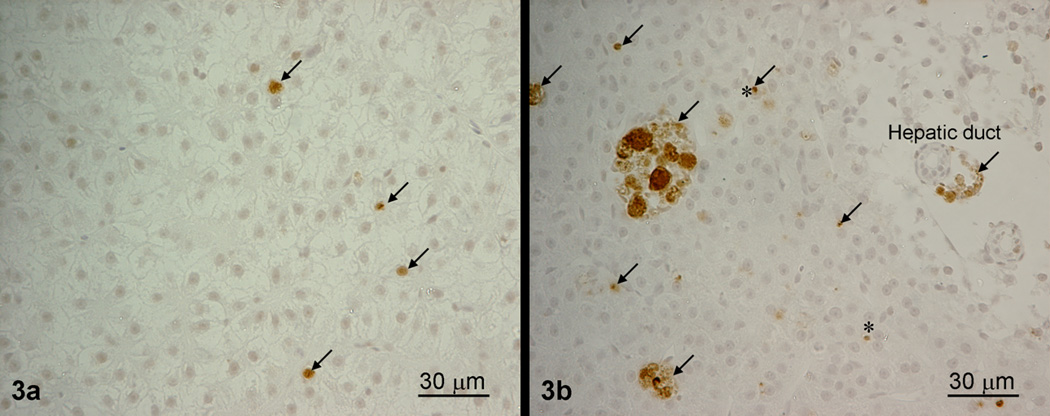
The three phases of PCR: (1) the exponential phase where doubling of product in each cycle occurs and accurate and precise quantification is possible; (2) the linear phase where reagents are becoming rate limiting, the reaction slows and products may start to degrade; and (3) plateau phase where the reaction has stopped with no additional product formed.
Figure 8.

Immunohistochemical labeling of STII medaka livers with anti-PCNA antibodies. Proliferating cells indicated with arrows are labeled brown. (a) control liver. (b) ANIT-treated liver. Text box on panel a and on panel b indicate semiquantative changes (proliferation index) before and after exposure.
Figure 9.

TUNEL assay of STII medaka livers. Apoptotic cells indicated by arrows are labeled brown, asterisks (*) indicates biliary preductular epithelial cell. (a) control liver. (b) ANIT-treated liver Text box indicates the apoptotic index for control (a) and treated (b) fish.
Figure 10.

Immunohistochemical labeling of STII medaka liver with anti-pan-cytokeratin antibodies. Positive cells are labeled brown. (a) control liver showing hepatic parenchyma with hepatic sinusoids and bile cholangioles indicated by arrows. (b) ANIT-treated liver showing biliary epithelial cells of hepatocellular tubules and cholangioles. Significant swelling of biliary epithelial cells is seen following ANIT exposure.
Acknowledgments
This research was supported by: 1 RO1 RRo18583-04 from the National Center for research Resources (NCRR) to DEH; R21CA106084-01A1 to SWK; and, 5 P42 ES10356 to R.T. Di Giulio.
The authors thank Drs. Ram Ramabhadran and Kevin Crofton for their careful review of the manuscript. This manuscript has been reviewed by the National Health and Environmental Effects Research Laboratory of the U.S. Environmental Protection Agency, and approved for publication. Approval does not signify that the contents reflect the views of the Agency, nor does mention of trade names or commercial products constitute endorsement or recommendation for use.
Contributor Information
Stephanie Padilla, Email: Padilla.stephanie@epa.gov, Neurotoxicology Division, U.S. Environmental Protection Agency, Research Triangle Park, North Carolina 27711.
John Cowden, Neurotoxicology Division, U.S. Environmental Protection Agency, Research Triangle Park, North Carolina 27711.
David E. Hinton, Environmental Sciences and Policy Division, Nicholas School of the Environment and Earth Sciences, Duke University, Box 90328, Durham, NC 27708-0328
Rodney Johnson, U.S. Environmental Protection Agency, Duluth, Minnesota.
Kevin Flynn, U.S. Environmental Protection Agency, Duluth, Minnesota.
Ronald C. Hardman, Environmental Sciences and Policy Division, Nicholas School of the Environment and Earth Sciences, Duke University, Box 90328, Durham, NC 27708-0328
Bonny Yuen, Environmental Sciences and Policy Division, Nicholas School of the Environment and Earth Sciences, Duke University, Box 90328, Durham, NC 27708-0328.
Sheran Law, Environmental Sciences and Policy Division, Nicholas School of the Environment and Earth Sciences, Duke University, Box 90328, Durham, NC 27708-0328.
Seth W. Kullman, Environmental Sciences and Policy Division, Nicholas School of the Environment and Earth Sciences, Duke University, Box 90328, Durham, NC 27708-0328
Doris W.T. Au, Department of Biology and Chemistry, City University of Hong Kong, Hong Kong
References
- Alestrom P, Holter JL, Nourizadeh-Lillabadi R. Zebrafish in functional genomics and aquatic biomedicine. Trends Biotechnol. 2006;24:15–21. doi: 10.1016/j.tibtech.2005.11.004. [DOI] [PubMed] [Google Scholar]
- Alpini G, Aragona E, Dabeva M, Salvi R, Shafritz DA, Tavoloni N. Distribution of albumin and alpha-fetoprotein mRNAs in normal, hyperplastic, and preneoplastic rat liver. Am J Pathol. 1992;141:623–632. [PMC free article] [PubMed] [Google Scholar]
- Alpini G, Baiocchi L, Glaser S, Ueno Y, Marzioni M, Francis H, Phinizy JL, Angelico M, Lesage G. Ursodeoxycholate and tauroursodeoxycholate inhibit cholangiocyte growth and secretion of BDL rats through activation of PKC alpha. Hepatology. 2002;35:1041–1052. doi: 10.1053/jhep.2002.32712. [DOI] [PubMed] [Google Scholar]
- Anken R, Bourrat F. Brain Atlas of the Medakafish Oryzias latipes. INRA Editions. Paris: 1998. [Google Scholar]
- Ankley GT, Jensen KM, Kahl MD, Korte JJ, Makynen EA. Description and evaluation of a short-term reproduction test with the fathead minnow (Pimephales promelas) Environmental toxicology and chemistry / SETAC. 2001;20:1276–1290. [PubMed] [Google Scholar]
- Balch GC, Shami K, Wilson PJ, Wakamatsu Y, Metcalfe CD. Feminization of female leukophore-free strain of Japanese medaka (Oryzias latipes) exposed to 17beta-estradiol. Environmental toxicology and chemistry / SETAC. 2004;23:2763–2768. doi: 10.1897/03-633. [DOI] [PubMed] [Google Scholar]
- Bunton TE. The immunocytochemistry of cytokeratin in fish tissues. Vet Pathol. 1993;30:418–425. doi: 10.1177/030098589303000503. [DOI] [PubMed] [Google Scholar]
- Candal E, Anadon R, Bourrat F, Rodriguez-Moldes I. Cell proliferation in the developing and adult hindbrain and midbrain of trout and medaka (teleosts): a segmental approach. Brain Res Dev Brain Res. 2005;160:157–175. doi: 10.1016/j.devbrainres.2005.08.009. [DOI] [PubMed] [Google Scholar]
- Carl M, Loosli F, Wittbrodt J. Six3 inactivation reveals its essential role for the formation and patterning of the vertebrate eye. Development. 2002;129:4057–4063. doi: 10.1242/dev.129.17.4057. [DOI] [PubMed] [Google Scholar]
- Connolly AK, Price SC, Connelly JC, Hinton RH. Early changes in bile duct lining cells and hepatocytes in rats treated with alpha-naphthylisothiocyanate. Toxicol Appl Pharmacol. 1988;93:208–219. doi: 10.1016/0041-008x(88)90121-4. [DOI] [PubMed] [Google Scholar]
- Davis CR, Okihiro MS, Hinton DE. Effects of husbandry practices, gender, and normal physiological variation on growth and reproduction of Japanese medaka, Oryzias latipes. Aquat Toxicol. 2002;60:185–201. doi: 10.1016/s0166-445x(02)00004-8. [DOI] [PubMed] [Google Scholar]
- DeKoven DL, Nunez JM, Lester SM, Conklin DE, Marty GD, Parker LM, Hinton DE. A purified diet for medaka (Oryzias latipes): Refining a fish model for toxicological research. Lab Animal Sci. 1992;42:180–189. [PubMed] [Google Scholar]
- Eisenberg M, Dudai Y. Reconcolidation of fresh, remote and extinguished fear memory in Medaka: Old fears don't die. Eur. J. Neurosci. 2004;20:3397–3403. doi: 10.1111/j.1460-9568.2004.03818.x. [DOI] [PubMed] [Google Scholar]
- Fausto N, Campbell JS. The role of hepatocytes and oval cells in liver regeneration and repopulation. Mech Dev. 2003;120:117–130. doi: 10.1016/s0925-4773(02)00338-6. [DOI] [PubMed] [Google Scholar]
- Fu L, Mambrini M, Perrot E, Chourrout D. Stable and full rescue of the pigmentation in a medaka albino mutant by transfer of a 17 kb genomic clone containing the medaka tyrosinase gene. Gene. 2000;241:205–211. doi: 10.1016/s0378-1119(99)00473-4. [DOI] [PubMed] [Google Scholar]
- Haasch ML, Lothenbach DB, Flynn KM, Hammermeister DE, Whiteman FW, Nagel J, Backe WJ, Shadwick D, Schmieder PK, Johnson RD. Estrogenicity of 4-pentylaniline in the Japanese medaka (Oryzias latipes) short-term (21 day) test. (in preparation). Ed. Eds.). [Google Scholar]
- Hampton JA, McCuskey PA, McCuskey RS, Hinton DE. Functional units in rainbow trout (Salmo gairdneri) liver: I. Arrangement and histochemical properties of hepatocytes. Anat Rec. 1985;213:166–175. doi: 10.1002/ar.1092130208. [DOI] [PubMed] [Google Scholar]
- Hampton JA, Lantz RC, Goldblatt PJ, Lauren DJ, Hinton DE. Functional units in rainbow trout (Salmo gairdneri, Richardson) liver: II. The biliary system. Anat Rec. 1988;221:619–634. doi: 10.1002/ar.1092210208. [DOI] [PubMed] [Google Scholar]
- Hampton JA, Lantz RC, Hinton DE. Functional units in rainbow trout (Salmo gairdneri, Richardson) liver: III. Morphometric analysis of parenchyma, stroma, and component cell types. Am J Anat. 1989;185:58–73. doi: 10.1002/aja.1001850107. [DOI] [PubMed] [Google Scholar]
- Hardman RC, Volz DC, Kullman SW, Hinton DE. An in vivo look at vertebrate liver architecture: three-dimensional reconstructions from medaka (Oryzias latipes) Anat Rec (Hoboken) 2007;290:770–782. doi: 10.1002/ar.20524. [DOI] [PubMed] [Google Scholar]
- Helmstetter MF, Alden RW., III Passive trans-chorionic transport of toxicants in topically treated Japanese medaka (Oryzias latipes) eggs. Aquatic Toxicology. 1995;32:1–13. [Google Scholar]
- Hill DA, Roth RA. Alpha-naphthylisothiocyanate causes neutrophils to release factors that are cytotoxic to hepatocytes. Toxicol Appl Pharmacol. 1998;148:169–175. doi: 10.1006/taap.1997.8314. [DOI] [PubMed] [Google Scholar]
- Hinton DE, Kullman SW, Hardman RC, Volz DC, Chen PJ, Carney M, Bencic DC. Resolving mechanisms of toxicity while pursuing ecotoxicological relevance? Mar Pollut Bull. 2005;51:635–648. doi: 10.1016/j.marpolbul.2005.07.020. [DOI] [PubMed] [Google Scholar]
- Iijima N, Yokoyama T. Apoptosis in the medaka embryo in the early developmental stage. Acta Histochem Cytochem. 2007;40:1–7. doi: 10.1267/ahc.06013. [DOI] [PMC free article] [PubMed] [Google Scholar]
- Inui M, Adachi T, Takenaka S, Inui H, Nakazawa M, Ueda M, Watanabe H, Mori C, Iguchi T, Miyatake K. Effect of UV screens and preservatives on vitellogenin and choriogenin production in male medaka (Oryzias latipes) Toxicology. 2003;194:43–50. doi: 10.1016/s0300-483x(03)00340-8. [DOI] [PubMed] [Google Scholar]
- Ishikawa Y, Hyodo-Taguchi Y. Cranial nerves and brain fiber systems of the medaka fry as observed by a whole-mount staining method. Neuroscience Research. 1994;19:379–386. doi: 10.1016/0168-0102(94)90079-5. [DOI] [PubMed] [Google Scholar]
- Ishikawa Y. Medakafish as a model system for vertebrate developmental genetics. Bioessays. 2000;22:487–495. doi: 10.1002/(SICI)1521-1878(200005)22:5<487::AID-BIES11>3.0.CO;2-8. [DOI] [PubMed] [Google Scholar]
- Ishikawa Y, Kage T, Yamamoto N, Yoshimoto M, Yasuda T, Matsumoto A, Maruyama K, Ito H. Axonogenesis in the medaka embryonic brain. Journal of Comparative Neurology. 2004;476:240–253. doi: 10.1002/cne.20220. [DOI] [PubMed] [Google Scholar]
- Kage T, Takeda H, Yasuda T, Maruyama K, Yamamoto N, Yoshimoto M, Araki K, Inohaya K, Okamoto H, Yasumasu S, Watanabe K, Ito H, Ishikawa Y. Morphogenesis and regionalization of the medaka embryonic brain. J Comp Neurol. 2004;476:219–239. doi: 10.1002/cne.20219. [DOI] [PubMed] [Google Scholar]
- Kasahara M, Naruse K, Sasaki S, Nakatani Y, Qu W, Ahsan B, Yamada T, Nagayasu Y, Doi K, Kasai Y, Jindo T, Kobayashi D, Shimada A, Toyoda A, Kuroki Y, Fujiyama A, Sasaki T, Shimizu A, Asakawa S, Shimizu N, Hashimoto S, Yang J, Lee Y, Matsushima K, Sugano S, Sakaizumi M, Narita T, Ohishi K, Haga S, Ohta F, Nomoto H, Nogata K, Morishita T, Endo T, Shin IT, Takeda H, Morishita S, Kohara Y. The medaka draft genome and insights into vertebrate genome evolution. Nature. 2007;447:714–719. doi: 10.1038/nature05846. [DOI] [PubMed] [Google Scholar]
- Kirchen RV, West WR. Carolina Biological Supply. Burlington, NC: 1976. The Japanese Medaka: Care and Development. [Google Scholar]
- Kitagawa D, Watanabe T, Saito K, Asaka S, Sasado T, Morinaga C, Suwa H, Niwa K, Yasuoka A, Deguchi T, Yoda H, Hirose Y, Henrich T, Iwanami N, Kunimatsu S, Osakada M, Winkler C, Elmasri H, Wittbrodt J, Loosli F, Quiring R, Carl M, Grabher C, Winkler S, Del Bene F, Momoi A, Katada T, Nishina H, Kondoh H, Furutani-Seiki M. Genetic dissection of the formation of the forebrain in Medaka, Oryzias latipes. Mech Dev. 2004;121:673–685. doi: 10.1016/j.mod.2004.03.010. [DOI] [PubMed] [Google Scholar]
- Law JM. Mechanistic considerations in small fish carcinogenicity testing. Ilar J. 2001;42:274–284. doi: 10.1093/ilar.42.4.274. [DOI] [PubMed] [Google Scholar]
- Masyuk TV, Ritman EL, LaRusso NF. Hepatic artery and portal vein remodeling in rat liver: vascular response to selective cholangiocyte proliferation. Am J Pathol. 2003;162:1175–1182. doi: 10.1016/S0002-9440(10)63913-2. [DOI] [PMC free article] [PubMed] [Google Scholar]
- Matsuda M, Nagahama Y, Shinomiya A, Sato T, Matsuda C, Kobayashi T, Morrey C, Shibata N, Asakawa S, Shimizu N, Hori H, Hamaguchi S, Sakaizumi M. DMY is a y-specific dm-domain gene required for male development in the medaka fish. Nature. 2002;417:559–563. doi: 10.1038/nature751. [DOI] [PubMed] [Google Scholar]
- Ohmuro-Matsuyama Y, Matsuda M, Kobayashi T, Ikeuchi T, Nagahama Y. Expression of DMY and DMRT1 in the various tissues of the medaka, Oryzias latipes. Fish Physiology and Biochemistry. 2003;28:171-?. doi: 10.2108/zsj.20.1395. [DOI] [PubMed] [Google Scholar]
- Okihiro MS, Hinton DE. Progression of hepatic neoplasia in medaka (Oryzias latipes) exposed to diethylnitrosamine. Carcinogenesis. 1999;20:933–940. doi: 10.1093/carcin/20.6.933. [DOI] [PubMed] [Google Scholar]
- Okihiro MS, Hinton DE. Partial hepatectomy and bile duct ligation in rainbow trout (Oncorhynchus mykiss): histologic, immunohistochemical and enzyme histochemical characterization of hepatic regeneration and biliary hyperplasia. Toxicol Pathol. 2000;28:342–356. doi: 10.1177/019262330002800215. [DOI] [PubMed] [Google Scholar]
- Orn S, Holbech H, Madsen TH, Norrgren L, Petersen GI. Gonad development and vitellogenin production in zebrafish (Danio rerio) exposed to ethinylestradiol and methyltestosterone. Aquatic Toxicol. 2003;65:397–411. doi: 10.1016/s0166-445x(03)00177-2. [DOI] [PubMed] [Google Scholar]
- Orn S, Yamani S, Norrgren L. Comparison of vitellogenin induction, sex ration, and gonad morphology between zebrafish and japanese medaka after exposure to 17 alpha ethinylestradiol and 17 beta trenbolone. Archives 0f Environmental Contamination and Toxicology. 2006;51:237–243. doi: 10.1007/s00244-005-0103-y. [DOI] [PubMed] [Google Scholar]
- Orsler DJ, Ahmed-Choudhury J, Chipman JK, Hammond T, Coleman R. ANIT-induced disruption of biliary function in rat hepatocyte couplets. Toxicol Sci. 1999;47:203–210. doi: 10.1093/toxsci/47.2.203. [DOI] [PubMed] [Google Scholar]
- Otake H, Shinomiya A, Matsuda M, Hamaguchi S, Sakaizumi M. Wild-derived XY sex-reversal mutants in the Medaka, Oryzias latipes. Genetics. 2006;173:2083–2090. doi: 10.1534/genetics.106.058941. [DOI] [PMC free article] [PubMed] [Google Scholar]
- Oxendine SL, Cowden J, Hinton DE, Padilla S. Adapting the medaka embryo assay to a high-throughput approach for developmental toxicity testing. Neurotoxicology. 2006;27:840–845. doi: 10.1016/j.neuro.2006.02.009. [DOI] [PubMed] [Google Scholar]
- Papoulias DM, Noltie DB, Tillitt DE. An in vivo model fish system to test chemical effects on sexual differentiation and development: exposure to ethinyl estradiol. Aquat Toxicol. 1999;48:37–50. [Google Scholar]
- Park YS, Chung NI, Choi KH, Cha EY, Lee SK, Chon TS. Computational characterization of behavioral response of medaka (Oryzias latipes) treated with diazinon. Aquat Toxicol. 2005;71:215–228. doi: 10.1016/j.aquatox.2004.11.002. [DOI] [PubMed] [Google Scholar]
- Paul-Prasanth B, Matsuda M, Lau EL, Suzuki A, Sakai F, Kobayashi T, Nagahama Y. Knock-down of DMY initiates female pathway in the genetic male medaka, Oryzias latipes. Biochem Biophys Res Commun. 2006;351:815–819. doi: 10.1016/j.bbrc.2006.10.095. [DOI] [PubMed] [Google Scholar]
- Seki M, Yokota H, Matsubara H, Maeda M, Tadokoro H, Kobayashi K. Fish full life-cycle testing for the weak estrogen 4-tert-pentylphenol on medaka (Oryzias latipes) Environmental toxicology and chemistry / SETAC. 2003;22:1487–1496. [PubMed] [Google Scholar]
- Seki M, Fujishima S, Nozaka T, Maeda M, Kobayashi K. Comparison of response to 17 beta-estradiol and 17 beta-trenbolone among three small fish species. Environmental toxicology and chemistry / SETAC. 2006;25:2742–2752. doi: 10.1897/05-647r.1. [DOI] [PubMed] [Google Scholar]
- Shima A, Mitani H. Medaka as a research organism: past, present and future. Mech Dev. 2004;121:599–604. doi: 10.1016/j.mod.2004.03.011. [DOI] [PubMed] [Google Scholar]
- Shinomiya A, Otake H, Togashi K, Hamaguchi S, Sakaizumi M. Field survey of sex-reversals in the medaka, Oryzias latipes: genotypic sexing of wild populations. Zoological science. 2004;21:613–619. doi: 10.2108/zsj.21.613. [DOI] [PubMed] [Google Scholar]
- Suzuki A, Nakamoto M, Kato Y, Shibata N. Effects of estradiol-17beta on germ cell proliferation and DMY expression during early sexual differentiation of the medaka Oryzias latipes. Zoological science. 2005;22:791–796. doi: 10.2108/zsj.22.791. [DOI] [PubMed] [Google Scholar]
- Toussaint MW, Rosencrance AB, Brennan LM, Dennis WE, Beaman JR, Wolfe MJ, Hoffmann FJ, Gardner HS., Jr Chronic toxicity of bromodichloromethane to the Japanese medaka (Oryzias latipes) Toxicol Pathol. 2001;29:662–669. doi: 10.1080/019262301753385997. [DOI] [PubMed] [Google Scholar]
- Villalobos SA, Hamm JT, Teh SJ, Hinton DE. Thiobencarb-induced embryotoxicity in medaka (Oryzias latipes): Stage-specific toxicity and the protective role of the chorion. Aquatic Toxicology. 2000;48:309–326. doi: 10.1016/s0166-445x(99)00032-6. [DOI] [PubMed] [Google Scholar]
- Wada H, Shimada A, Fukamachi S, Naruse K, Shima A. Sex-linked inheritance of the 1f locus in the medaka fish (Oryzias latipes) Zoological science. 1998;15:123–136. doi: 10.2108/zsj.15.123. [DOI] [PubMed] [Google Scholar]
- Walker WW, Manning CS, Overstreet RM, Hawkins WE. Development of aquarium fish models for environmental carcinogenesis: an intermittent-flow exposure system for volatile, hydrophobic chemicals. Journal of Applied Toxicology. 1985;5:255–260. doi: 10.1002/jat.2550050407. [DOI] [PubMed] [Google Scholar]
- Waters NJ, Holmes E, Waterfield CJ, Farrant RD, Nicholson JK. NMR and pattern recognition studies on liver extracts and intact livers from rats treated with alpha-naphthylisothiocyanate. Biochem Pharmacol. 2002;64:67–77. doi: 10.1016/s0006-2952(02)01016-x. [DOI] [PubMed] [Google Scholar]
- Wayne NL, Kuwahara K, Aida K, Nagahama Y, Okubo K. Whole-cell electrophysiology of gonadotropin-releasing hormone neurons that express green fluorescent protein in the terminal nerve of transgenic medaka (Oryzias latipes) Biology of reproduction. 2005;73:1228–1234. doi: 10.1095/biolreprod.105.042721. [DOI] [PubMed] [Google Scholar]
- Winn RN. Transgenic fish as models in environmental toxicology. ILAR J. 2001;42:322–329. doi: 10.1093/ilar.42.4.322. [DOI] [PubMed] [Google Scholar]
- Wolf JC, Wolfe MJ. A brief overview of nonneoplastic hepatic toxicity in fish. Toxicol Pathol. 2005;33:75–85. doi: 10.1080/01926230590890187. [DOI] [PubMed] [Google Scholar]
- Wolkoff AW, Cohen DE. Bile acid regulation of hepatic physiology: I. Hepatocyte transport of bile acids. Am J Physiol Gastrointest Liver Physiol. 2003;284:G175–G179. doi: 10.1152/ajpgi.00409.2002. [DOI] [PubMed] [Google Scholar]
- Woolley J, Mullock BM, Hinton RH. Reflux of billiary components into blood in experimental intrahepatic cholestasis induced in rats by treatment with alpha-naphthylisothiocyanate. Clin Chim Acta. 1979;92:381–386. doi: 10.1016/0009-8981(79)90217-1. [DOI] [PubMed] [Google Scholar]
- Yoda H, Hirose Y, Yasuoka A, Sasado T, Morinaga C, Deguchi T, Henrich T, Iwanami N, Watanabe T, Osakada M, Kunimatsu S, Wittbrodt J, Suwa H, Niwa K, Okamoto Y, Yamanaka T, Kondoh H, Furutani-Seiki M. Mutations affecting retinotectal axonal pathfinding in Medaka, Oryzias latipes. Mech Dev. 2004;121:715–728. doi: 10.1016/j.mod.2004.03.021. [DOI] [PubMed] [Google Scholar]