

Abstract
Purpose
This study compared subjective and objective accommodative amplitudes to characterize changes from preschool to presbyopia.
Methods
Monocular accommodative amplitude was measured with three techniques in random order (subjective push-up, objective minus lens stimulated, and objective proximal stimulated) on 236 subjects 3–64 years using a 1.5mm letter. Subjective push-up amplitudes were the dioptric distance at which the target first blurred along a near-point rod. Objective minus lens stimulated amplitudes were the greatest accommodative response obtained by Grand Seiko autorefraction as subjects viewed the stimulus at 33cm through increasing minus lens powers. Objective proximal stimulated amplitudes were the greatest accommodative response obtained by Grand Seiko autorefraction as subjects viewed the stimulus at increasing proximity from 40cm up to 3.33cm.
Results
In comparison with subjective push-up amplitudes, objective amplitudes were lower at all ages, with the most dramatic difference occurring in the 3–5 year group (subjective push-up = 16.00 ± 4.98D versus objective proximal stimulated = 7.94 ± 2.37D and objective lens stimulated = 6.20 ± 1.99D). Objective proximal and lens stimulated amplitudes were largest in the 6–10 year group (8.81 ± 1.24D and 8.05 ± 1.82D, respectively) and gradually decreased until the fourth decade of life when a rapid decline to presbyopia occurred. There was a significant linear relationship between objective techniques (y = 0.74 + 0.96x, R2 = 0.85, p<0.001) with greater amplitudes measured for the proximal stimulated technique (mean difference = 0.55D).
Conclusions
Objective measurements of accommodation demonstrate that accommodative amplitude is substantially less than that measured by the subjective push-up technique, particularly in young children. These findings have important clinical implications for the management of uncorrected hyperopia.
Keywords: accommodative amplitude, age, children, objective accommodative amplitude, presbyopia, push-up test, subjective accommodative amplitude
Accommodation is a dioptric change in the power of the eye that results from a change in crystalline lens shape. The greatest increase in refractive change an eye can undergo is termed the maximum accommodative amplitude. Accommodative amplitude is well known to change as a function of age, with younger individuals having the greatest amplitudes and older, presbyopic individuals having essentially zero amplitude.1 Classical knowledge about the changes in accommodative amplitude with age comes from subjective measurements of push-up to blur2–5 which were later best approximated with linear regression fits to predict amplitude as a function of age.6 Based on these classical studies, many clinicians have adopted the belief that individuals have their greatest amount of accommodative amplitude at birth, after which it immediately and consistently decreases over the first five to six decades of life until none remains. This belief may be problematic given that the linear fit described by Hofstetter was only presented as a ‘convenient approximation’ of the change in accommodative amplitude from childhood to adulthood, no subjects under the age of 8 years were included in the studies, and the measurement technique did not directly measure the refractive power of the eye.6 Although some more recent dynamic retinoscopy studies of objective amplitude support the large values obtained during subjective push-up testing in children, these studies also did not measure the actual refractive power of the eye, but rather quantified the viewing distance at which the dynamic retinoscopy reflex notably changed from a brisk and bright with motion to a slow and dull with motion (indicating increased accommodative lag).7, 8 The distance at which this change in reflex occurred was expressed as the accommodative amplitude in diopters, thus giving the subjects ‘credit’ for accommodating fully to that distance even though an accommodative lag was observed that would indicate a lesser amplitude.7, 8
More recent studies of accommodative amplitude have utilized objective techniques to quantify the magnitude of refractive change of the eye to more accurately and precisely depict accommodative ability.1, 9–12 These studies demonstrate that the subjective push-up technique over-estimates the true accommodative amplitude of the eye. In addition, objective measurements including children under the age of 8 years have shown that accommodative amplitude may be relatively stable during childhood, changing sigmoidally with age rather than linearly.12 A comparison of the sigmoidal function from objectively determined amplitudes to the linear function from subjective amplitudes reveals a large disparity in magnitude between the two techniques at young ages, suggesting that young children may have only half the overall accommodative amplitudes (when measured objectively) that clinicians credit to them based on subjective testing. This finding could have significant implications regarding both the habitual visual experience of children and the management of uncorrected hyperopia in children.
Although the recent evidence for measured accommodative amplitudes being substantially lower in children than classical subjective push-up norms is strong, the previous study did not measure subjective push-up amplitudes on the study subjects, but instead compared objective measurements to previously published age norms of subjective amplitude.12 Another design limitation is that accommodation was stimulated with minus lenses of increasing power rather than a stimulus of increasing proximity.12 The use of minus lenses creates an abnormal viewing environment in which the target distance remains constant, but the stimulus becomes increasingly minifed: two cues that oppose the typical cues to stimulate an accommodative response. It is well demonstrated that conflicting visual cues can impact accommodative responses13, 14 and thus this abnormal viewing environment may explain findings that a subset of younger children did not increase accommodation in response to minus lens blur in the previous study.12 This limitation was tolerated in the previous study due to instrument constraints preventing the near stimulus from being placed close enough to young subjects to elicit a maximum accommodative response. The authors have since overcome these constraints with a new stimulus presentation technique that allows the measurement of accommodative responses to stimuli as close as 3 cm from the observer.
The purpose of this study is to compare changes in maximum monocular accommodative amplitude as a function of age for three measurement techniques: 1) the clinically utilized subjective push-up technique, 2) objective measurement for minus lens stimulated demands, and 3) objective measurement for proximal stimulated demands. This study expands upon previous work by including a novel strategy to stimulate accommodation during objective measurement, as well as comparing objective and subjective measurements of monocular accommodative amplitude in the same subjects. Given the ease of performing the subjective push-up test clinically, but the anticipated over-estimation of accommodative ability obtained with this technique, a secondary objective of this study is to determine whether a useful conversion equation can be derived to convert the clinically utilized subjective push-up measurement to accurately approximate accommodative amplitude values determined objectively.
METHODS
This study followed the tenets of the Declaration of Helsinki and was approved by the University Committee for the Protection of Human Subjects. Informed consent was obtained from all adult participants and parental permission and child assent obtained for all participants less than 18 years of age.
Individuals aged 3 to 64 years were recruited from the University of Houston Eye Institute’s staff, student, and patient populations for participation in the study. Subjects were excluded from participation if they had a history of significant eye or head injuries, a history of intraocular surgery, a history of amblyopia or strabismus, or were currently using any medications which are suspect for interfering with accommodation.
Subjects’ refractive error classification (myopic, hyperopic, emmetropic, astigmatic) was determined from spectacle lensometry, subject self-report of contact lens power, or unaided distance autorefraction. Subjects with habitual refractive corrections (spectacles or contact lenses) wore their correction for all further study measurements. Distance visual acuities were measured on all subjects using routine clinical testing methods with an age appropriate acuity task, either the Snellen acuity chart for older subjects, or the Lea symbols acuity matching test15 for younger subjects, both presented on an M&S SmartSystem® (M&S Technologies, Inc. Niles, IL). Subjects were excluded from further participation if they had monocular visual acuities worse than 20/25 in either eye. Distance acuity was then re-tested monocularly through added +1.50 DS lenses as a screening test to determine the likelihood that subjects were included with latent hyperopia, and whether those subjects were concentrated at one age range. All subjects experienced some level of decrease in acuity through the added lenses, with the median and mode acuity dropping to 20/70. Of all subjects, only four were identified who had minimal acuity drops of 1 to 3 lines and may have had latent hyperopia. These subjects were aged 5, 26, 34, and 45 and thus do not bias the data toward an underestimation of accommodative amplitude at any one age range. In addition, any magnitude of latent hyperopia present would be expected to impact accommodative amplitude measures similarly for all three techniques for these subjects.
Additional testing was then performed to rule out individuals with strabismus or ocular pathology. These tests included cover test at distance and near, near Randot stereo-testing, and slit lamp examination. Based on these preliminary tests, one potential subject was excluded from participation for strabismus and one was excluded for active uveitis secondary to juvenile rheumatoid arthritis. Three subjects aged 3 to 4 years were also excluded due to poor cooperation for the accommodation measurements described below. In total, 236 individuals were included in analysis (158 females, 79 males).
Following the initial screening measurements, over-refraction of the eye was measured using the Grand Seiko WAM-5500® open-field autorefractor set to measure at the corneal plane (RyuSyo Industrial Co., Ltd. Hiroshima, Japan). All measurements were taken on the subject’s right eye with the left eye occluded while the subject wore their habitual refractive correction, if they had one. Subjects were instructed to view a high-contrast letter chart positioned at 11 meters and five repeated distance measurements were taken. The mean of the spherical equivalent of these distance measurements represented each subject’s distance corrected over-refraction. These measurements were used to confirm that subjects were well-corrected, as well as to establish the baseline refraction for calculation of the objective maximum accommodative amplitudes.
Monocular accommodative amplitude was then measured using three different techniques: subjective push-up, objective proximal stimulated, and objective lens stimulated. For all three of these techniques, the subjects viewed an isolated, 1.5mm tall, black letter E printed on a white background with their habitual correction. This letter size was selected since it was above the threshold acuity size of all subjects (approximately 20/40 equivalent for a 40cm viewing distance) and remained discernable through the minification created by increasingly powered minus lenses for the minus-lens stimulated technique. The three techniques are described individually below and the order of testing was randomized for each subject.
Subjective Push-up
Subjects wore an eye-patch over the left eye and viewed a 1.5mm tall E suspended from a near-point rod supported against the subject’s forehead with a custom-built forehead rest. Subjects were instructed to keep the letter clear as the examiner slid the target starting from 57cm along the near-point rod toward the subject. Subjects were asked to indicate as soon as the letter became slightly blurry. For young subjects, the term ‘fuzzy’ was used in addition to blurry to aid in educating the subject regarding the task. Subjects were repeatedly asked if the target was still clear as it was moved along the near-point rod and reminded to report as soon as it became a little bit blurry or fuzzy. The target position at which the subject reported first blur was expressed in diopters and recorded as the subjective maximum amplitude. This measurement was repeated three times and the average determined for each subject. Three young subjects were not able to respond reliably for this task and were excluded from analysis, as described in the results below. For some older subjects, the letter remained blurry regardless of viewing distance, as would be expected, and thus subjective amplitude was recorded as zero.
Objective Proximal Stimulated
Subjects wore an eye patch over their left eye and placed their chin on the chinrest and their forehead against the forehead rest of the Grand Seiko autorefractor while viewing a 1.5mm tall letter E. Custom modifications were made to the autorefractor to enable the presentation of the letter for a range of accommodative demands from 2.5 to 30D. The target was initially positioned at 40cm (2.5D demand) suspended from the near-point rod in a custom mount on the examiner side of the autorefractor beamsplitter. Stimulus demand was then increased by placing the target along the near-point rod at 8 discrete positions of increasing proximity up to 9.5cm (10.5D demand). The custom mount allowed the stimulus to be positioned all the way up to the beamsplitter on the investigator side of the autorefractor (Figure 1A). Next, a custom mount was attached to the forehead rest and the letter suspended from clear thread in a square aperture to allow presentation of the near target on the patient side of the beamsplitter without obstructing the measurement light of the autorefractor (Figure 1B&C). The stimulus was placed along the line of sight of the viewing eye and along the measuring axis of the autorefractor; this was visually confirmed by ensuring that the measuring reticule was symmetrically centered around the autorefractor’s keratometry ring, which is a reflection off of the cornea within the subject’s pupil. Any large deviations from the measuring axis of the autorefractor (e.g. 10 degrees or more) become easily apparent because the keratometry ring is no longer centered within the pupil. Previous work has demonstrated that refractive error begins to change approximately 0.25D at ±20 degrees eccentric of the visual axis16, making any minor alignment errors inconsequential for the present study. Five additional discrete target positions ranging from 8 to 3.33cm (12.5 to 30D) were tested in sequential order of increasing proximity using this custom mount on the patient side of the beamsplitter. A book light was attached to the forehead rest adjacent to the patched eye and positioned to provide direct illumination of the target to ensure high contrast was maintained when the target was shaded by the housing of the beamsplitter. It is not believed that the increase in ambient illumination would have had a large effect on pupil miosis as compared to the level of accommodative miosis occurring for these large accommodative demands. For each target position (from 40 to 3.33 cm) subjects were encouraged to keep the target clear and a minimum of five repeated measurements of refraction were taken. For both this methodology and the objective lens stimulated technique (described next), accommodative stimulus-response functions were plotted for each subject and the individual’s maximum accommodative response determined from the plot as described in further detail below.
Figure 1.

Custom target mounts for objective proximal stimulated accommodative amplitude testing. 1A shows the stimulus positioned on the examiner side of the beamsplitter for demands from 2.5 to 10.5 D. 1B shows the stimulus positioned on the subject side of the beamsplitter for demands from 12 to 30 D. 1C shows the patient view of the printed letter stimulus for demands from 12 to 30 D.
Objective Lens Stimulated
Subjects viewed a 1.5mm tall letter E suspended from the near point rod of the Grand Seiko autorefractor at 33.33cm (3D accommodative demand) while wearing a custom-built, light weight trial frame with an occluder obstructing the left eye. For any subjects who habitually wore spectacles, their sphere and cylinder spectacle lens power was placed in the trial frame for all conditions. Subjects were instructed to look at the target and keep it clear while a minimum of five repeated measurements were taken over a series of seconds as the subject viewed the 3 D demand target through the empty trial frame. The mean spherical equivalent of these measurements represented the accommodative response to the 3 D target demand. Accommodative demand was then increased sequentially in 1 D steps by an examiner placing minus lenses in the trial frame (spectacle plane of approximately 13 mm) of the viewing eye of the subject. For subjects with a spectacle prescription, the sphere power lens in the trial frame was replaced accordingly to create the appropriate increase in minus power for each demand. For each minus lens condition, a minimum of five repeated measurements of refraction were taken which was then converted to accommodative response using the formula presented below. Subjects viewed through increasing minus lens power until accommodative responses failed to increase for subsequent increases in minus power (maximum lens used = −13D).
Calculation of Objective Amplitudes (both Proximal and Lens Stimulated)
The autorefractor was set to output both the spherical and cylindrical components of the refraction. For all subjects, any refraction measurement with greater than 2D of cylinder power was excluded and considered to be the result of poor subject fixation since the subjects in this study did not have significant uncorrected astigmatism, and since previous studies have reported the expected changes in astigmatism with increased accommodation to be much smaller.17–19 This criterion resulted in the exclusion of a minimal amount of refraction measurements. For data analysis, the first five remaining measurements for each stimulus demand were used and converted to the spherical equivalent (1/2 the cylinder power added to the spherical power). In addition, both the demand and the response measurements needed to be adjusted for the addition of the minus lenses for all subjects, as well as the presence of spectacles lenses for those subjects wearing them. All demand and response values were referenced to the corneal plane using the effectivity formula presented by Mutti et al. (2000) for reconciling the effect of spectacle lenses on autorefractor readings.20
Stimulus demands were determined by:
Autorefractor responses were determined by:
In the above formulas, 0.013 is the vertex distance in meters of lenses placed in front of the eye, DTE is the distance in meters of the target to the eye, Lens Power is the total power of any lenses placed in front of the eye (added minus lenses to stimulate accommodation and spherical equivalent of spectacle lenses if present), REcornea is refractive error at the corneal plane, and Raw AR is the spherical equivalent of the autorefractor output set for the corneal plane.
For each subject, accommodative responses were plotted as a function of stimulus demand for both the proximal stimulated and lens stimulated techniques and evaluated separately to determine the maximum accommodative response for each subject for each technique. The typical plots for each subject showed increasing accommodation with increasing demand until the subject could no longer exert any more accommodation. At this point the response would either peak and drop off, or plateau for subsequent increases in demand. The maximum mean response elicited across the demands tested was identified and adjusted by the distance corrected over-refraction (as measured with the autorefractor) for each individual subject and termed the maximum accommodative amplitude for the subject. An example of one subject’s data obtained with each of the three measurement techniques is shown in Figure 2 with maximum responses identified. For the subjective push-up technique, this response represents the maximum amplitude (13.97D for the subject in Figure 2). For the objective proximal stimulated and objective lens stimulated, the maximum response would be adjusted by the subject’s spherical equivalent distance corrected autorefraction (+0.70D for the subject in Figure 2) yielding maximum amplitudes of 10.38D (proximal stimulated) and 9.53D (lens stimulated).
Figure 2.

Plot of monocular accommodative data from a 9 year old subject using each of the three measurement techniques (subjective push-up, objective proximal stimulated, and objective lens stimulated). The subjective push-up response represents the subjective maximum amplitude. Maximum amplitudes for both objective techniques were calculated from the maximum response combined with the distance corrected over-refraction as measured by the autorefractor.
Data Analysis
Data were analyzed with SAS 9.3.21 The age-related changes in accommodative amplitude for each technique were first evaluated with locally-weighted polynomial regression (LOESS smoothing functions) and then binned by age to compare the trend in mean amplitudes with increasing age. Amplitudes for the two objective testing techniques were then compared with linear regression and difference versus mean analysis22 to evaluate whether increased amplitudes were observed when a more natural viewing environment was used. Finally, multivariate regression analysis was used to identify significant predictors of objective proximal stimulated amplitude and derive a conversion equation of subjective push-up amplitude to predicted objective amplitudes. The residuals from this analysis were plotted (measured amplitude – predicted amplitude) to evaluate the precision of the derived equation.
RESULTS
Refractive Error Classification
The distribution of subject refractive error classification was evaluated based upon data for the right eye from spectacle lensometry, unaided distance autorefraction, or subject report of contact lens power. There were 108 study participants who had myopia (mean spherical power = −3.33 ± 2.22DS, range = −0.75 to −11.00DS), eighteen of whom had astigmatism of 1.00D or more. Eighteen subjects had hyperopia (mean spherical power = +1.27 ± 0.37DS, range = +1.00 to +1.62DS), two of whom had astigmatism of 1.00D or greater. Twelve subjects had astigmatism with minimal spherical refractive error (spherical power no greater than ±0.50 D with at least −1.00D cylinder), and 98 subjects were categorized with emmetropia (spherical power between −0.75 to +1.00DS and not meeting astigmatic criteria). Five adult subjects had undergone LASIK refractive surgery and were classified as having myopia according to their self-reported pre-surgical refractive status. Spherical equivalent distance over-refraction measurements indicated subjects were well-corrected with their habitual corrections (mean ± SD of signed over-refraction = 0.17 ± 0.44D, mean ± SD of absolute value over-refraction = 0.38 ± 0.26D) and suggests subjects did not have large uncorrected refractive errors (range = −0.95 to +1.25D).
Overview of Amplitude Measures
Subjective push-up amplitudes were obtained on 233 of 236 subjects. Three young children did not report a blur endpoint during testing and thus no value was recorded given the uncertainty of whether they did not understand the task, or whether they did not perceive a blur. The youngest subjects included (aged 3 to 5 years) showed good repeatability of the subjective amplitude testing with a total inter-subject response range of 0 to 3 centimeters across the three measures. This suggests that the criterion these young subjects used to determine an endpoint was applied consistently. All subjects were able to complete both the lens stimulated and proximal stimulated objective amplitude measurements; however, 9 subjects did not reach a definitive peak in accommodative response by the greatest demand tested for the lens stimulated technique (−13D lens) and 6 subjects did not reach a definitive peak in accommodative response by the greatest demand during proximal stimulated technique (30D position), two of whom were included in the 9 who did not reach a peak with the proximal stimulated technique. These subjects were excluded from some analyses (disclosed below), but for those analyses in which they are reported, the maximum amplitude was based upon the accommodative response to the highest demand tested, and thus maximum amplitude may have been underestimated for this small subset of individuals. This subset of subjects included individuals from ages 6 to 27 years, and thus does not bias the data toward a potential underestimation of maximum amplitude in any one particular non-presbyopic age range. In addition, although these subjects may not have reached their absolute maximum amplitude, the increase in response that was observed at the largest demand tested was only 0.25D greater than the response to the preceding lower demand for all but two of the subjects (subject’s largest increase = 0.75D for a 5D change in demand), indicating subjects were approaching their maximum response and that it is unlikely maximum amplitude was substantially underestimated for these subjects.
Measurements of monocular accommodative amplitude using all three techniques are shown in Figure 3 with open symbols representing subjects whose accommodative responses did not reach a peak for either the objective proximal or lens stimulated techniques. Visual inspection of this figure illustrates the large disparity in subjective and objective accommodative amplitudes, with subjective amplitude measures over-estimating amplitude across the non-presbyopic years, particularly at the youngest ages. To evaluate the age-related changes in accommodative amplitude for each measurement, a locally-weighted polynomial regression (LOESS smoothing function) was performed for each technique using subjects whose responses had reached a peak (Figure 4). The smoothing functions illustrate that the subjective push-up amplitudes visually approximate a linear fit, as previously described by Hofstetter,6 with a plateau at zero for the presbyopic ages; whereas the two objective measurement techniques demonstrate an initial increase in amplitude over the first decade of life, a relatively slow decrease in amplitude over the second and third decades, a dramatic drop off in amplitude beginning at the end of the fourth decade of life (35–39 years), and finally a plateau near zero during the sixth decade of life. Rather than promote a single mathematical fit to the data, a summary table binning accommodative amplitudes by age for subjects whose responses reached a peak is provided to numerically summarize the observed decreases in amplitude with increases in age for all three techniques (Table 1).
Figure 3.

Maximum monocular accommodative amplitudes by age for all subjects using three different techniques.
Figure 4.
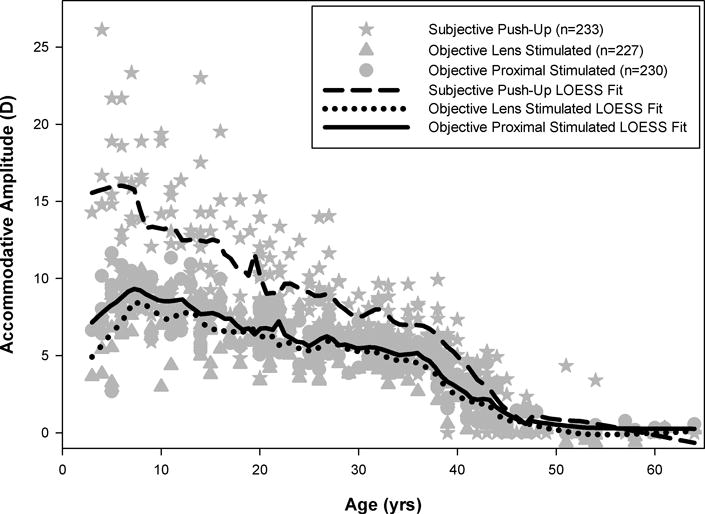
Locally weighted polynomial regressions (LOESS smoothing functions) of accommodative amplitude by age for each technique including subjects whose accommodative responses had reached a peak.
Table 1.
Comparison of Mean Monocular Accommodative Amplitude Measures Binned by Subject Age for Subjects with Measurements by All Three Techniques.
| Age (yrs) | n | Average Objective Proximal Stimulated Amplitude (D) (mean ± std) | Average Objective Lens Stimulated Amplitude (D) (mean ± std) | Average Subjective Push-Up Amplitude (D) (mean ± std) |
|---|---|---|---|---|
| 3 to 5 | 11 | 7.94 ± 2.37 | 6.20 ± 1.99 | 16.00 ± 4.98 |
| 6 to 10 | 18 | 8.81 ± 1.24 | 8.05 ± 1.82 | 14.54 ± 4.85 |
| 11 to 15 | 22 | 7.97 ± 1.63 | 7.34 ± 1.49 | 13.16 ± 3.45 |
| 16 to 20 | 26 | 6.97 ± 1.27 | 6.41 ± 1.26 | 10.57 ± 3.51 |
| 21 to 25 | 23 | 6.25 ± 1.13 | 5.98 ± 1.36 | 9.41 + 2.01 |
| 26 to 30 | 25 | 6.05 ± 1.10 | 5.70 ± 1.10 | 8.45 ± 2.24 |
| 31 to 35 | 25 | 5.27 ± 0.75 | 4.94 ± 0.92 | 7.57 + 1.27 |
| 36 to 40 | 24 | 3.93 ± 1.26 | 3.45 ± 1.29 | 6.09 + 1.94 |
| 41 to 45 | 25 | 1.92 ± 1.13 | 1.55 ± 1.05 | 2.92 + 1.98 |
| 46 to 50 | 5 | 0.97 ± 0.68 | 0.82 ± 0.68 | 0.47 ± 1.05 |
| 51 to 64 | 16 | 0.30 ± 0.21 | −0.13 ± 0.31 | 0.48 ± 1.33 |
Comparison between Lens Stimulated and Proximal Stimulated Amplitudes
We next compared accommodative amplitudes obtained with the two objective techniques to determine whether stimulating accommodation under a more natural viewing environment (proximal stimulated) resulted in greater overall amplitudes than the lens stimulated technique. Subjects whose accommodative responses did not peak for one or both of the objective techniques were not included in this analysis (n=13). Regression analysis was performed by plotting lens stimulated amplitudes on the x-axis and proximal stimulated amplitudes on the y-axis, and revealed a significant linear relationship between the two objective techniques with larger amplitudes measured with the proximal stimulated technique, as evidenced by the intercept of the fit (y = 0.74 + 0.96x, R2 = 0.85, p<0.001) and shown in Figure 5A. Difference versus mean analysis indicated larger accommodative amplitudes measured with the proximal stimulated technique (mean = 0.55D, 95% confidence interval = −1.59 to +2.69D) with no significant relationship between mean amplitudes and the magnitude of the difference between the two techniques (linear regression, p = 0.12) (Figure 5B). Inspection of Figure 5B identifies five subjects with substantial increases in measured amplitude for the proximal stimulated technique versus the minus lens technique. These five individuals ranged in age from 5 to 21 years and included subjects of both genders and three of the four refractive error classifications. The mean lens stimulated accommodative amplitude of these five subjects was 3.53 ± 0.66 D, which is a response magnitude similar to the stimulus demand of the physical target position (33.33cm = 3D), suggesting these subjects did not respond well to minus lens blur. This behavior has previously been observed for small numbers of subjects.12
Figure 5.
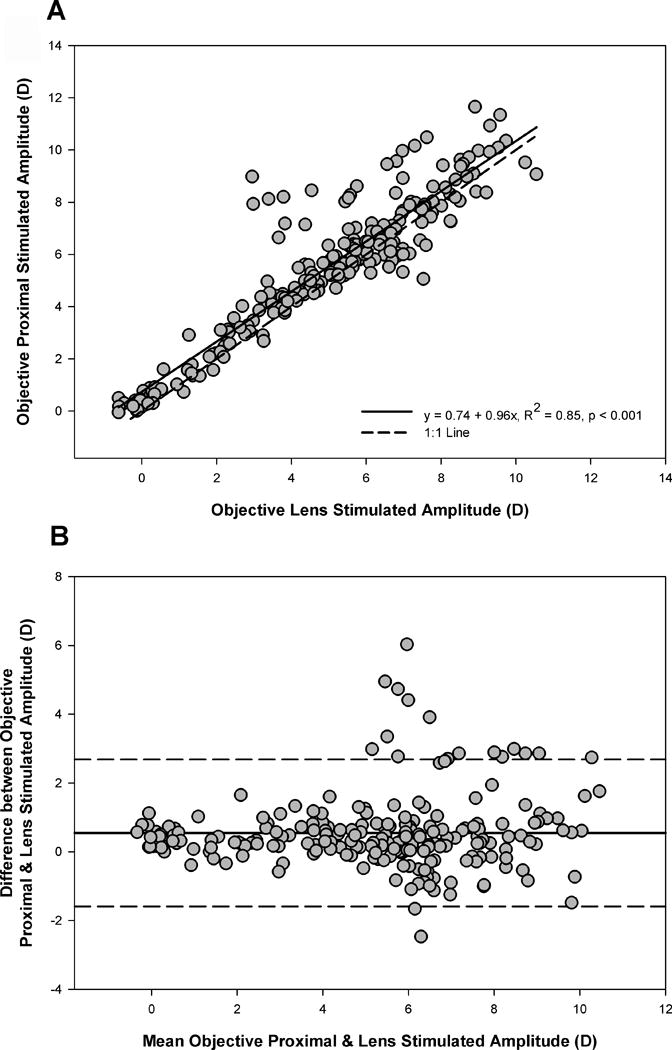
Comparison of objective proximal and lens stimulated amplitudes. Measures were significantly correlated (5A) with larger amplitudes measured using the proximal stimulated technique (5B). Mean difference = 0.55D, 95% confidence limit = −1.59 to +2.69D.
Prediction of Objective Proximal Stimulated Amplitudes from Subjective Push-Up Amplitude
Lastly, we sought to evaluate the ability of the subjective push-up amplitude to predict the corresponding objective proximal stimulated amplitude within subjects. The motivation for this analysis was to improve the interpretation of the clinically utilized push-up amplitude technique to more accurately reflect a young patient’s true accommodative ability. Multivariate regression was performed to evaluate subject age (centered at 3 years since this was the youngest age tested), subjective push-up amplitude, refractive error classification, and gender as predictors of objective proximal stimulated amplitude for the 233 subjects with both objective proximal stimulated amplitudes and subjective push-up amplitudes. Refractive error classification was evaluated in the model as a potential predictor due to previous studies demonstrating relationships between subjective accommodative amplitude and refractive error classification.23–25 Gender was evaluated as a potential predictor due to previous reports that subjective amplitude measures are greater in females than males.9, 26 However, despite these previously reported associations, refractive error classification and gender were not significant predictors of objective amplitude (p = 0.09 & 0.36, respectively). As would be expected, both subject age (p < 0.001) and subjective push-up amplitude (p < 0.001) were significant predictors, and together account for 80% of the variance in objective proximal stimulated amplitude. From this analysis, we derived the following equation to predict objective amplitude:
We then calculated the predicted objective amplitude for each subject for comparison to the actual measured objective amplitude and plotted the residuals (measured-predicted) against the subjective push-up amplitude (Figure 6). There was no significant linear trend in the magnitude of the residuals (p = 0.53) indicating that the precision of the predictive equation did not vary with the magnitude of the measured push-up amplitude. Looking at the residuals as a whole, the equation predicted amplitudes within ±1.50 D of the actual measured amplitude for 80% of subjects, and within ±2.00 D for 92% of subjects. While ±2.00 D may be reasonable accuracy if objective amplitudes were quite large, for the mean magnitude of objective amplitudes observed in this study (all less than 9.00 D), the predictive equation has an error margin of 22% at best.
Figure 6.

Residuals from the predictive equation for objective amplitude (measured objective proximal stimulated − predicted amplitude) as a function of measured subjective push-up amplitude. Linear regression indicates no significant change in the precision of the prediction as a function of subjective push-up amplitude magnitude. The dashed lines depict that 92% of subjects had predicted amplitudes within ±2 D of their actual measured amplitude.
DISCUSSION
The data from this study provide further evidence that the subjective push-up test substantially over-estimates accommodative amplitude, particularly in young children. Although objective measurements of accommodative amplitude were greater with the proximal stimulated technique, the differences between proximal and minus lens stimulated techniques were small (approximately 0.50 D) and do not account for the large discrepancy between subjective and objective measurements. As shown in Table 1, mean objective proximal stimulated amplitudes for the youngest age group were approximately half of that measured with the subjective push-up test in the same subjects. If we consider clinical expectations based upon Hofstetter’s formulas, the mean objective amplitudes measured in the present study were less than 9D across all age bins reported, which is approximately 56% of the predicted amplitude from Hofstetter’s norms for the youngest age group included in his predicted fits (8 years).6
One limitation to this study is that cycloplegic refractive error was not obtained, and thus some latent hyperopes may have been included. If latent hyperopes were included in the study, accommodative amplitudes may have been underestimated for these individuals. However, steps were taken to identify the likely quantity of these subjects included in the study by testing acuity through plus lenses for comparison with habitual distance acuity, as described in the methods section. This technique only identified four subjects who were suspect to have latent hyperopia, ranging in age from 5 to 45, and thus the inclusion of these subjects would not have had a measurable impact on the age-related trends in accommodative amplitude reported in this study. In addition, the great majority of children included in this study came from the clinic population, or were family members of faculty and staff at the College of Optometry who had received complete eye examinations in the past that would have identified any significant latent hyperopia.
Another possible source of amplitude under-estimation in this study is that accommodative amplitudes were obtained monocularly, and thus subjects would not benefit from convergence stimulated accommodation in their measured responses. Amplitudes were measured monocularly in order to maintain alignment with the measuring light of the autorefractor and to avoid the complication of subjects seeing diplopic when the stimulus was presented closer than their convergence near point. Previous studies have demonstrated reduced accommodative gains in infants and young children when viewing stimuli under monocular versus binocular conditions.27 However, the increase in accommodative response from monocular to binocular viewing becomes quite small (approximately 0.25D) by school age28, 29 into adulthood.30 Given this evidence, it is possible that the lower accommodative amplitudes observed in the preschool aged subjects may be partially attributed to the monocular testing conditions. However, even if the accommodative gain were reduced for the overall testing paradigm in these subjects, this study reports the maximum total effort obtained over all stimulus demands, not the response at one fixed stimulus position. Therefore, it is likely that the large demands presented during the objective proximal stimulated testing were great enough to elicit the maximum accommodative response in spite of reduced accommodative gain, especially given that a peak in the accommodative response curve was observed. To further explore the potential limitation of monocular testing, two ten year old subjects and one five year old subject were tested both monocularly and binocularly, in random order, with the proximal stimulated objective technique, aligning the target with the right eye. As predicted, all subjects experienced diplopia for the most proximal stimulus positions. Amplitude increased by 0.66 D when viewing binocularly for one ten year old subject, but decreased by 0.93 D and 0.60 D when viewing binocularly for the other subjects. This exploratory testing supports the argument that the large differences between subjective and objective amplitude measurements reported in this study cannot be accounted for by the monocular testing methodology.
Another consideration with the methodology of this study is that a fixed stimulus size was used (1.5 mm) for all testing. Previous reports indicate that performing the subjective push-up test with a fixed letter size will result in over-estimations of amplitude due to increases in subjective depth of focus as compared to systematically decreasing letter size to maintain a constant angular subtense.31 Therefore, the present study design may have led to greater disparity between subjective and objective amplitudes. However, one of this study’s secondary objectives was to evaluate the ability to convert the common clinical push-up measurements to approximate objective amplitudes, and thus the authors chose to use a fixed letter size to match common clinical practice. Although this methodology may have impacted subjective amplitudes, it is not believed to have had an impact on the objective measurements of accommodative amplitude, given the previous evidence that a large range of spatial frequencies stimulate accommodation equally.32 To further support this, objective proximal stimulated amplitudes were measured in two adults and one five year old subject using the 1.5 mm letter from the present study design versus a 0.7 mm letter for comparison. No appreciable differences in measured amplitude were found when comparing letter sizes (differences ranged from a 0.36 D decrease in amplitude with the smaller letter to a 0.14D increase in amplitude with the smaller letter across subjects).
The amplitudes reported in this study represent behavioral amplitudes in the sense that subjects were asked to voluntarily maintain clarity of the accommodative stimulus. It is possible that greater amplitudes could be obtained if pharmacologic stimulation were employed, although the results with pharmacologic techniques are variable and may depend heavily upon iris pigmentation.10, 11 Despite the voluntary nature of the task in the present study, the amplitudes reported here are likely to represent the typical ability of the subjects under their habitual viewing environment, and thus are most applicable to their behavior with regards to overcoming real-world near demands or hyperopic refractive error. In other words, even if a subject has a greater potential for accommodative amplitude, it may not be relevant clinically if it cannot be voluntarily manifest by the individual. Subjects who clearly did not cooperate for the task were eliminated from this study and the remaining subjects were all believed to give good attention and effort for study measures. The similar variability in amplitude across non-presbyopic age groups (Table 1) supports that subject effort and attention to the task was consistent across age groups, particularly from age 5 years.
An initial glance at the findings in Table 1 may lead one to infer that young children have a large insensitivity to blur, given the dramatic difference in mean objective and subjective amplitudes in the 3–5 year age bin that decreases with increasing age. However, it is important to consider that although these findings demonstrate a large difference dioptrically, the dioptric scale is nonlinear and compresses with increasing proximity. When the difference between objective and subjective mean amplitudes is represented in physical space, the differences are quite small and comparable between young children and adults. For example, the physical distance between the objective and subjective mean amplitudes for 3–5 year old children is 6.34cm (1/7.94D − 1/16D), which is similar to the physical distance of 5.77cm between the objective and subjective mean amplitudes for 31–35 year old adults (1/5.27D − 1/7.57D). When interpreting the data with respect to physical differences between objective and subjective amplitudes, it appears that the blur sensitivity does not dramatically change with age, at least with respect to maximum amplitude comparisons.
The finding that children had, on average, less than 9D of monocular accommodative amplitude has potential implications for the management of hyperopic refractive error. It is well documented that uncorrected, isometropic hyperopia elevates the risk for bilateral amblyopia in children.33–37 Previous hypotheses for this relationship include that individuals may under-accommodate to avoid diplopia from increased convergence when overcoming hyperopic defocus, or that the individuals who become amblyopic had poor accommodative ability which prevented them from overcoming their refractive error.36–38 One common thread throughout these studies is the dramatic increase in risk for bilateral amblyopia at a threshold of +4 to +5D of hyperopic refractive error.33–35 This same level of uncorrected hyperopia (+4D) has been shown to be associated with increased accommodative lags and more variable accommodative responses in infants and preschool children.39, 40 Thirdly, a large-scale study of emmetropization in infants found that the probability of emmetropization drops to 50% with hyperopic refractive error of +5D at 3 months of age.41 This evidence is all in agreement that +4 to +5D of hyperopic refractive error is potentially problematic for the developing visual system. While there is no doubt that binocular function in the presence of such levels of uncorrected hyperopia would be impacted and contribute substantially to the visual experience, it is worth considering the role of accommodative amplitude on visual experience in light of the present study’s findings. In the present study, the largest mean maximum amplitude obtained for any age group did not exceed 9D. This evidence might give additional insight into the observation that moderate hyperopic refractive error is repeatedly identified as a threshold for visual complications. If we consider that preschool children often have shorter near working distances than adults, a three year old child with +4D of uncorrected refractive error would reach the limit of their accommodative ability, as reported by this study, when adopting a 25cm working distance. However, caution should still be exercised in this interpretation given that the monocular findings of the present study may not fully represent accommodative ability under natural, binocular viewing conditions.
The overall trend of accommodative amplitude with age as measured by objective techniques was complex, portraying an initial increase in amplitude from pre-school to school age, a slow decline through the school years into adulthood, and ultimately a rapid decline in the latter half of the fourth decade of life. It remains unknown whether the observed increase in amplitude from 3 to 5 years versus 6 to 10 years is representative of an actual increase in accommodative ability with age, or an increased ability to perform the task. Consistent with a previous study of minus lens stimulated amplitudes, several young children in this study did not respond well to the minus blur,12 which may have accounted for the observed ‘improvement’ in accommodative amplitude by 6 to 10 years of age with the minus lens stimulated technique. In the original minus lens stimulated amplitude study, these young, poor responders were excluded from the modeling, resulting in an increase in mean amplitude for the youngest age group which contributed to the sigmoidal function that was observed.12 In the present study, it was expected that these poor responders to minus lens stimulated demands would improve under proximal stimulated testing conditions. As predicted, some young subjects performed decidedly better with the proximal stimulated technique over the minus stimulated technique (Figure 5); however, the proximal stimulated technique still portrayed a small improvement in accommodative ability by 6 to 10 years of age. Thus it is possible that young children also improve behaviorally in their ability to respond to the proximal-stimulated technique, as is seen with the minus lens stimulated technique. Although a behavioral improvement is the likely source of the observed increases in amplitude, the findings of this study cannot rule-out the possibility of a physiological improvement occurring during the preschool years, and thus these subjects were not eliminated from the mean amplitudes reported in Figures 3 & 4, or Table 1.
Given the simplicity and ease of the subjective push-up test in a clinical setting, it is unlikely that objective measurement techniques will be substituted for subjective testing in the clinical setting in the near future. Therefore, this study explored the derivation of a conversion equation to predict objective accommodative amplitude from a subject’s subjective push-up measurement and age. While this equation accurately predicted amplitude for the majority of subjects within +/− 1.50 D of the actual objective measurement; this accuracy is similar to the variance of age-binned objective amplitudes presented in Table 1. Thus, a clinician may not gain meaningful precision from performing a conversion of a push-up measurement and may do just as well to estimate objective amplitude from Table 1 based upon patient age. One variable that may have improved the ability to predict objective amplitude from subjective measures is pupil size, given the inverse relationship between pupil size and depth of focus, which would in turn relate to the accommodative amplitude. However, pupil size was not measured in this study and is thus unable to be explored as a predictive variable. The fact remains that subjective push-up amplitudes are not a true measurement of accommodative response, and thus their clinical value lies in evaluating the patient’s functional near working range rather than making estimations of actual accommodative ability. It may be prudent to consider the adoption of new nomenclature for this clinical test, such as ‘Near Point of Clear Vision’ (as suggested by an anonymous reviewer).
CONCLUSIONS
These data are in agreement with previous reports that the subjective push-up amplitude test grossly over-estimates accommodative amplitude in children, as evidenced by objective techniques using either a proximal stimulus, or a minus lens stimulus technique. It is important to shift the clinical mindset away from the belief that children have the vast accommodative ability suggested by the subjective push-up technique and to consider the implications this has for leaving moderate and high levels of hyperopic refractive error uncorrected.
Acknowledgments
This research was supported by a Fight for Sight Grant-In-Aid awarded to Heather Anderson and an NIH/NEI Core Grant (P30 EY007551) to the University of Houston College of Optometry. Custom accessories for the Grand Seiko autorefractor for stimulus presentation were designed and manufactured by Chris Kuether through the support of NIH/NEI P30 EY007551.
References
- 1.Hamasaki D, Ong J, Marg E. The amplitude of accommodation in presbyopia. Am J Optom Arch Am Acad Optom. 1956;33:3–14. doi: 10.1097/00006324-195601000-00002. [DOI] [PubMed] [Google Scholar]
- 2.Donders FC. On the Anomalies of Accommodation and Refraction of the Eye. London: The New Sydenham Society; 1864. English translation by Moore WD. [Google Scholar]
- 3.Duane A. The accommodation and Donder’s curve and the need of revising our ideas regarding them. JAMA. 1909;52:1992–6. [Google Scholar]
- 4.Duane A. Normal values of the accommodation at all ages. JAMA. 1912;59:1010–3. [Google Scholar]
- 5.Duane A. Studies in monocular and binocular accommodation, with their clinical application. Trans Am Ophthalmol Soc. 1922;20:132–57. [PMC free article] [PubMed] [Google Scholar]
- 6.Hofstetter HW. A comparison of Duane’s and Donder’s tables of the amplitude of accommodation. Am J Optom Arch Am Acad Optom. 1944;21:345–63. [Google Scholar]
- 7.Jimenez R, Gonzalez MD, Perez MA, Garcia JA. Evolution of accommodative function and development of ocular movements in children. Ophthalmic Physiol Opt. 2003;23:97–107. doi: 10.1046/j.1475-1313.2003.00093.x. [DOI] [PubMed] [Google Scholar]
- 8.Rutstein RP, Fuhr PD, Swiatocha J. Comparing the amplitude of accommodation determined objectively and subjectively. Optom Vis Sci. 1993;70:496–500. doi: 10.1097/00006324-199306000-00008. [DOI] [PubMed] [Google Scholar]
- 9.Koretz JF, Kaufman PL, Neider MW, Goeckner PA. Accommodation and presbyopia in the human eye–aging of the anterior segment. Vision Res. 1989;29:1685–92. doi: 10.1016/0042-6989(89)90150-8. [DOI] [PubMed] [Google Scholar]
- 10.Wold JE, Hu A, Chen S, Glasser A. Subjective and objective measurement of human accommodative amplitude. J Cataract Refract Surg. 2003;29:1878–88. doi: 10.1016/s0886-3350(03)00667-9. [DOI] [PubMed] [Google Scholar]
- 11.Ostrin LA, Glasser A. Accommodation measurements in a prepresbyopic and presbyopic population. J Cataract Refract Surg. 2004;30:1435–44. doi: 10.1016/j.jcrs.2003.12.045. [DOI] [PubMed] [Google Scholar]
- 12.Anderson HA, Hentz G, Glasser A, Stuebing KK, Manny RE. Minus-lens-stimulated accommodative amplitude decreases sigmoidally with age: a study of objectively measured accommodative amplitudes from age 3. Invest Ophthalmol Vis Sci. 2008;49:2919–26. doi: 10.1167/iovs.07-1492. [DOI] [PMC free article] [PubMed] [Google Scholar]
- 13.Ramsdale C, Charman WN. Accommodation and convergence: effects of lenses and prisms in ‘closed-loop’ conditions. Ophthalmic Physiol Opt. 1988;8:43–52. [PubMed] [Google Scholar]
- 14.Bharadwaj SR, Candy TR. Accommodative and vergence responses to conflicting blur and disparity stimuli during development. J Vis. 2009;9(4):1–18. doi: 10.1167/9.11.4. [DOI] [PMC free article] [PubMed] [Google Scholar]
- 15.Hyvarinen L, Nasanen R, Laurinen P. New visual acuity test for pre-school children. Acta Ophthalmol (Copenh) 1980;58:507–11. doi: 10.1111/j.1755-3768.1980.tb08291.x. [DOI] [PubMed] [Google Scholar]
- 16.Whatham A, Zimmermann F, Martinez A, Delgado S, de la Jara PL, Sankaridurg P, Ho A. Influence of accommodation on off-axis refractive errors in myopic eyes. J Vis. 2009;9(14):1–3. doi: 10.1167/9.3.14. [DOI] [PubMed] [Google Scholar]
- 17.Radhakrishnan H, Charman WN. Changes in astigmatism with accommodation. Ophthalmic Physiol Opt. 2007;27:275–80. doi: 10.1111/j.1475-1313.2007.00474.x. [DOI] [PubMed] [Google Scholar]
- 18.Cheng H, Barnett JK, Vilupuru AS, Marsack JD, Kasthurirangan S, Applegate RA, Roorda A. A population study on changes in wave aberrations with accommodation. J Vis. 2004;4:272–80. doi: 10.1167/4.4.3. [DOI] [PubMed] [Google Scholar]
- 19.Read SA, Buehren T, Collins MJ. Influence of accommodation on the anterior and posterior cornea. J Cataract Refract Surg. 2007;33:1877–85. doi: 10.1016/j.jcrs.2007.06.048. [DOI] [PubMed] [Google Scholar]
- 20.Mutti DO, Jones LA, Moeschberger ML, Zadnik K. AC/A ratio, age, and refractive error in children. Invest Ophthalmol Vis Sci. 2000;41:2469–78. [PubMed] [Google Scholar]
- 21.SAS Institute Inc. Base SAS® 9.3 Procedures Guide. 2. Cary, NC: SAS Institute Inc.; 2012. [Google Scholar]
- 22.Bland JM, Altman DG. Statistical methods for assessing agreement between two methods of clinical measurement. Lancet. 1986;1:307–10. [PubMed] [Google Scholar]
- 23.Fong DS. Is myopia related to amplitude of accommodation? Am J Ophthalmol. 1997;123:416–8. doi: 10.1016/s0002-9394(14)70148-5. [DOI] [PubMed] [Google Scholar]
- 24.Allen PM, O’Leary DJ. Accommodation functions: co-dependency and relationship to refractive error. Vision Res. 2006;46:491–505. doi: 10.1016/j.visres.2005.05.007. [DOI] [PubMed] [Google Scholar]
- 25.McBrien NA, Millodot M. Amplitude of accommodation and refractive error. Invest Ophthalmol Vis Sci. 1986;27:1187–90. [PubMed] [Google Scholar]
- 26.Cobb SR. An investigation into accommodation by Ayrshire Study Circle. Br J Physiol Opt. 1964;21:31–5. [PubMed] [Google Scholar]
- 27.Bharadwaj SR, Candy TR. Cues for the control of ocular accommodation and vergence during postnatal human development. J Vis. 2008;8(14):1–6. doi: 10.1167/8.16.14. [DOI] [PMC free article] [PubMed] [Google Scholar]
- 28.Sreenivasan V, Irving EL, Bobier WR. Binocular adaptation to near addition lenses in emmetropic adults. Vision Res. 2008;48:1262–9. doi: 10.1016/j.visres.2008.02.015. [DOI] [PubMed] [Google Scholar]
- 29.Sreenivasan V, Irving EL, Bobier WR. Binocular adaptation to +2 D lenses in myopic and emmetropic children. Optom Vis Sci. 2009;86:731–40. doi: 10.1097/OPX.0b013e3181a59d78. [DOI] [PubMed] [Google Scholar]
- 30.Seidemann A, Schaeffel F. An evaluation of the lag of accommodation using photorefraction. Vision Res. 2003;43:419–30. doi: 10.1016/s0042-6989(02)00571-0. [DOI] [PubMed] [Google Scholar]
- 31.Atchison DA, Capper EJ, McCabe KL. Critical subjective measurement of amplitude of accommodation. Optom Vis Sci. 1994;71:699–706. doi: 10.1097/00006324-199411000-00005. [DOI] [PubMed] [Google Scholar]
- 32.Taylor J, Charman WN, O’Donnell C, Radhakrishnan H. Effect of target spatial frequency on accommodative response in myopes and emmetropes. J Vis. 2009;9(16):1–4. doi: 10.1167/9.1.16. [DOI] [PubMed] [Google Scholar]
- 33.Fern KD. Visual acuity outcome in isometropic hyperopia. Optom Vis Sci. 1989;66:649–58. doi: 10.1097/00006324-198910000-00001. [DOI] [PubMed] [Google Scholar]
- 34.Klimek DL, Cruz OA, Scott WE, Davitt BV. Isoametropic amblyopia due to high hyperopia in children. J AAPOS. 2004;8:310–3. doi: 10.1016/j.jaapos.2004.05.007. [DOI] [PubMed] [Google Scholar]
- 35.Pascual M, Huang J, Maguire MG, Kulp MT, Quinn GE, Ciner E, Cyert LA, Orel-Bixler D, Moore B, Ying GS. Risk factors for amblyopia in the Vision in Preschoolers Study. Ophthalmology. 2014;121:622–9e1. doi: 10.1016/j.ophtha.2013.08.040. [DOI] [PMC free article] [PubMed] [Google Scholar]
- 36.Schoenleber DB, Crouch ER., Jr Bilateral hypermetropic amblyopia. J Pediatr Ophthalmol Strabismus. 1987;24:75–7. doi: 10.3928/0191-3913-19870301-06. [DOI] [PubMed] [Google Scholar]
- 37.Ziylan S, Yabas O, Zorlutuna N, Serin D. Isoametropic amblyopia in highly hyperopic children. Acta Ophthalmol Scand. 2007;85:111–3. doi: 10.1111/j.1600-0420.2006.00682.x. [DOI] [PubMed] [Google Scholar]
- 38.Werner DB, Scott WE. Amblyopia case reports–bilateral hypermetropic ametropic amblyopia. J Pediatr Ophthalmol Strabismus. 1985;22:203–5. doi: 10.3928/0191-3913-19850901-09. [DOI] [PubMed] [Google Scholar]
- 39.Candy TR, Gray KH, Hohenbary CC, Lyon DW. The accommodative lag of the young hyperopic patient. Invest Ophthalmol Vis Sci. 2012;53:143–9. doi: 10.1167/iovs.11-8174. [DOI] [PMC free article] [PubMed] [Google Scholar]
- 40.Tarczy-Hornoch K. Accommodative lag and refractive error in infants and toddlers. J AAPOS. 2012;16:112–7. doi: 10.1016/j.jaapos.2011.10.015. [DOI] [PMC free article] [PubMed] [Google Scholar]
- 41.Mutti DO, Mitchell GL, Jones LA, Friedman NE, Frane SL, Lin WK, Moeschberger ML, Zadnik K. Accommodation, acuity, and their relationship to emmetropization in infants. Optom Vis Sci. 2009;86:666–76. doi: 10.1097/OPX.0b013e3181a6174f. [DOI] [PMC free article] [PubMed] [Google Scholar]