

Abstract
Aims: To investigate the clinical significance of Tbx3 in colorectal cancer (CRC) and the possible association between Tbx3 expression and Epithelial- Transition Mesenchymal (EMT) phenotype. Methods: Quantitative real-time reverse transcription polymerase chain reaction (qRT-PCR) and western blotting were employed to evaluate the expression of Tbx3 in 30 fresh CRC and matched normal tissues. Using immunochemistry, protein level of Tbx3 and EMT markers (E-cadherin and N-cadherin) were identified in 150 pairs of paraffin-embedded specimen. Results: The results of qRT-PCR and western blotting showed that Tbx3 expression was higher in CRC tissues than in corresponding normal tissues. The statistical analysis based on immunohistochemical evaluation suggested that Tbx3 aberrant expression was significantly associated with tumor size (P=0.049), differentiation (P=0.032), invasion (P=0.019), lymph node metastasis (P=0.049) and TNM stage (P=0.018). Patients who displayed high expression of Tbx3 may achieve a poorer overall survival (OS) and disease-free survival (DFS), compared to those with low expression of Tbx3. This tendency was also observed in patients with intermediate levels of disease (II and III stage). The multivariate analysis indicated Tbx3 expression could independently predict the outcome of CRC patients. Interestingly, correlation analysis suggested Tbx3 expression was negatively correlated with E-cadherin expression, but positively correlated with N-cadherin expression. Conclusion: Tbx3 may promote CRC progression by involving EMT program and has the potential to be an effective prognostic predictor for CRC patients.
Keywords: Tbx3, Epithelial-Mesenchymal Transition, colorectal cancer, prognosis, biomarker
Introduction
Despite encouraging progress in early detection and therapeutic technique, colorectal cancer (CRC) remains to be the third leading cause of cancer death across both genders in the United States [1]. Although surgical resection has been regarded as an effective treatment for CRC, a large proportion of patients with advanced CRC are still reported to suffer poor prognosis [2]. Traditional prognostic prediction is mainly dependent on American Joint Committee on Cancer (AJCC) stage system, which is determined by the tumor invasion, lymph node metastasis and distal metastasis. It provides the most effective information for patients with early stage disease and those with advanced disease. However, it has been reported to be less able to predict the prognosis of patients with intermediate stage [3]. For example, patients in stage II may have a poorer prognosis than patients in stage III [4]. Therefore, novel prognostic biomarkers should be identified and applied in combination with current staging system to improve the prognostic evaluation and clinical management of patients with CRC.
Tbx3 is a member of Tbx2 subgroup belonging to T-box family, whose members occupy an important role in developmental process by binding its T-box motif to the T-half-site in the promoters of the target genes [5-7]. Initially, Tbx3 was found to be widely expressed in multiple organs and involved in the embryonic development including mammary lungs and pancreas [8]. Recently, increasing studies have suggested that Tbx3 may also participate in the initiation and progression of human malignances. For example, Tbx3 may drive malignant progression of hepatocellular carcinoma by regulating Wnt/β-catenin signaling [11]. PTEN is a well acknowledged tumor suppressor inhibiting PI3K signal and researchers found Tbx3 may enhance the ability of anti-apoptotic and metastasis in head and neck squamous cancer cells by repressing PTEN [12]. Moreover, researchers found that the carcinogenic role of Tbx3 may be associated with its regulation in Epithelial-Mesenchymal-Transition (EMT) [13-15].
EMT is a developmental process whereby epithelial cells lose apical-basal polarity with the disturbance of cell-to-cell tight contacts and cytoskeleton to acquire a mesenchymal phenotype that facilitates transformed epithelial cells to resist apoptosis, invade and migrate. EMT is characterized by a cadherin switch containing loss of E-cadherin and gain of N-cadherin [16]. E-cadherin, a well-established epithelial marker that contributes to the cell-to-cell tight junction, has been widely regarded as a key suppressor of motility and invasiveness of neoplastic epithelial cells in various types of tumors [17]. However, N-cadherin, a transmembrane protein shares many structural and functional features with E-cadherin, reversely has been proved to participate in invasion and distal metastasis [18].
Recently, a genome wide meta-analysis [19] has suggested Tbx3 may be involved in the development of CRC. However, to our knowledge, the clinical significance of Tbx3 and its association with EMT in CRC remain to be inconclusive. In this study, we aimed to investigate clinical significance of Tbx3 and explore its possible association with EMT phenotype in CRC.
Materials and methods
Patients and specimens
In our study, 30 pairs of fresh CRC tissue and corresponding normal tissues were employed for qRT-PCR and western blot. Additionally, 150 pairs of paraffin-embedded CRC tissue and corresponding normal tissues were employed for immunohistochemistry. All the tissues samples were obtained from patients who were diagnosed of CRC clinicopathologically and underwent surgery treatment in Department of General surgery, Shanghai Sixth People’s Hospital Affiliated to Shanghai Jiaotong University between 2006 and 2013.
All the patients have complete follow-up records. The corresponding normal colorectal tissues were obtained from colorectal mucosa far from the resected tumor (>5 cm). The basic clinical characteristics of patients were shown in Table 1. Tumor staging were performed based on the principle of the World Health Organization classification. Preoperative chemotherapy and/or radiotherapy were never applied in the patients. The study was approved by the ethics committee of The Sixth People’s Hospital affiliated to Shanghai Jiao Tong University. The written informed consents were obtained from patients for using their tissue specimens in our study.
Table 1.
Correlation between Tbx3 expression and clinicopathological Characteristics
| Characteristics | N | Tbx3 | P value | |
|---|---|---|---|---|
|
| ||||
| High expression | Low expression | |||
| Gender | ||||
| male | 76 | 45 | 31 | 0.251 |
| female | 74 | 36 | 38 | |
| Age | ||||
| ≤60 | 69 | 36 | 33 | 0.743 |
| >60 | 81 | 45 | 36 | |
| Tumor location | ||||
| colon | 89 | 50 | 39 | 0.617 |
| rectal | 61 | 31 | 30 | |
| Tumor differentiation | ||||
| well | 38 | 14 | 24 | 0.032 |
| moderate | 39 | 21 | 18 | |
| poor | 73 | 46 | 27 | |
| Tumor size | ||||
| ≤5 cm | 69 | 31 | 38 | 0.049 |
| >5 cm | 81 | 50 | 31 | |
| Tumor invasion | ||||
| T1 | 23 | 7 | 16 | 0.019 |
| T2 | 50 | 24 | 26 | |
| T3 | 60 | 40 | 20 | |
| T4 | 17 | 10 | 7 | |
| Lymph node metastasis | ||||
| Absent | 73 | 33 | 40 | 0.049 |
| Present | 77 | 48 | 29 | |
| Distant metastasis | ||||
| Present | 18 | 11 | 07 | |
| Absent | 132 | 70 | 62 | 0.519 |
| TNM stage | ||||
| I | 30 | 10 | 20 | |
| II | 42 | 20 | 22 | |
| III | 60 | 40 | 20 | 0.018 |
| IV | 18 | 11 | 07 | |
Quantitative real-time reverse transcriptase polymerase chain reaction
Quantitative real-time reverse transcriptase polymerase chain reaction (qRT-PCR) was performed to examine the mRNA expression of Tbx3 in 30 pairs of fresh CRC tissues and corresponding normal tissues. Total RNA was extracted from tissues using Trizol (Invitrogen, USA) according to the manufacturer’s instruction. Then, the cDNA fragments were synthesized from total RNA by Superscript III Reverse Transcriptase (Promega, USA). The reaction was run on the StepOne Plus Real-time PCR System (Applied Biosystems, USA). The denaturation of Tbx3 was initiated at 95°C for 10 minutes. Then 40 cycles were followed at 95°C for 15 s. Finally, the annealing was performed at 55°C for 15 s. The PCR products consisted with the fluorescence intensity of the SYBR Green (TaKaRa, Japan). β-actin was used as internal control. 2-ΔΔCt cycle threshold (Ct) method was used to evaluate the relative expression of Tbx3. All experiments were repeated for three times. The sequences of PCR primers were used as follows: Tbx3: forward 5’-CCCGAAGAAGACGTAGAAGATGAC-3’ and reverse 5’-CCCGAAGAAGAGGTGGAGGACGAC-3’; β-actin: forward 5’-CCTCCATCGTCCA CCGCAAATG-3’ and reverse 5’-TGCTGTCACCTTCACCGTTCCA-3’.
Western-blot
Western-blot was used to detect the protein expression of Tbx3 in 30 pairs of fresh CRC tissues and corresponding normal tissues. Total protein of tissues was obtained with lysis buffer. Then, 20 μg protein were separated with electrophoresis on a 10% SDS–PAGE and transferred onto a PVDF membrane. Later, the anti-Tbx3 antibody (1:1000, Abcam) was added into the membrane with incubation at 40°C overnight. The β-actin anti-body (1:2000, Abcam) was used as internal control. After three times washing, the membrane was incubated with HRP-labeled Goat Anti-Rabbit IgG (1:2000) for 2 h at room temperature. Chemiluminescence reagent (Abcam) was used to determine the expression of protein according to the manufacturer’s instructions. Quantitative analysis of Western-blot was performed by Image J 1.43 software.
Immunohistochemistry analysis
The 4 μm-thick sections cut from formalin-fixed, paraffin-embedded tissue specimens were deparaffinized with xylene and rehydrated with graded ethanol. Then, the antigen of tissue sections was retrieved by microwave heating for 25 minutes in 15 mM citrate buffer (pH 6.0). After that, 0.3% hydrogen peroxide was added into 4 μm- thick sections for 15 minutes to block endogenous peroxidase activity. Subsequently, the tissue sliders were incubated with anti-body overnight at 4°C at the following dilutions: rabbit monoclonal anti-human Tbx3 (1:300), rabbit monoclonal anti-human E-cadherin (1:100), and rabbit monoclonal anti-human N-cadherin (1:1000) (all from Abcam, Cambridge, UK), followed by incubation of second antibody for 30 minutes. Finally all sections counterstained with hematoxylin were dehydrated and mounted. The sections incubated with PBS instead of primary anti-body were used as negative control.
Two independent researchers, who were blind to the clinicopathological parameters of patients, were employed to evaluate immunohistochemical staining. The immunoreactive score (IS) was calculated by multiplying the staining Intensity (SI) and percentage of Positive cells (PP). The SI was determined as follows: negative (score 0), weak (score 1), moderate (score 2), strong (score 3). The PP was determined as follows: <5% (score 0), 6-25% (score 1), 26-50% (score 2), 51-70% (score 3), 71-100% (score 4). The consistency of the immunoreactive score between the observers was evaluated by Kappa value, which was 0.85 (Tbx3), 0.79 (E-cadherin), 0.83 (N-cadherin), respectively. The evaluation outcomes of the two researchers were compared and came to an agreement by many repetitions. The cut-off score of Tbx3, E-cadherin and N-cadherin expression was determined by receiver operating characteristic (ROC) curve analysis. The results showed Tbx3 expression was high if IS was 4 or more. E-cadherin expression was considered downregulation if IS was 6 or less. Tumors with N-cadherin staining score of 6 or more was defined as upregulation.
Statistical analysis
The software SPSS version 21.0 (Chicago, IL) was used for statistical analysis. All the results were presented as mean ± SD. Paired t test was used to evaluate the difference of Tbx3 expression between tumors and non-tumor tissues. χ2 test was performed to determine the correlation between the expression of Tbx3 and clinicopathologic parameters. Nonparametric Spearman rank correlation coefficient was used to evaluate the association between Tbx3 expression and E-cadherin/N-cadherin expression. Survival curve was plotted by the Kaplan-Meier model and intergroup difference was calculated by the log-rank test. The univariate analysis was used to evaluate the association of clinicopathologic parameters with prognosis of CRC patients. The multivariate Cox proportional hazard model and hazard ratio (HR) was conducted to determine whether the variable could be an independent prognostic factor. A P-value<0.05 was regarded to be statistically significant.
Results
Expression of Tbx3 in CRC tissues and corresponding no-tumor tissues
The expression of Tbx3 mRNA in 30 fresh CRC tissues and matched normal CRC tissues were compared by RT-PCR. Tbx3 mRNA expression in CRC tissues was significantly higher in CRC patients than in adjacent normal tissues (5.58±1.13 versus 0.09±0.02, P=0.034) (Figure 1A). This result was then confirmed by Western blot (1.10±0.13 versus 0.33±0.21, P<0.001) (Figure 1B and 1C). Moreover, we utilized immunochemistry to examine the expression of Tbx3 in 150 paraffin-embedded CRC tissues and adjacent non-tumor colorectal tissues. The result demonstrated Tbx3 expression was mainly located in the cytoplasm and 81 of 150 (54%) CRC tissues showed Tbx3 high expression, compared to normal tissues showing no or low Tbx3 expression. The mean IS of CRC tissues was also statistically higher than that of normal tissues (mean IS: 7.79±2.43 versus 1.59±0.40, P<0.001). Representative immunohistochemical results for Tbx3 in CRC and matched non-tumor tissues (×400) were shown in Figure 2.
Figure 1.
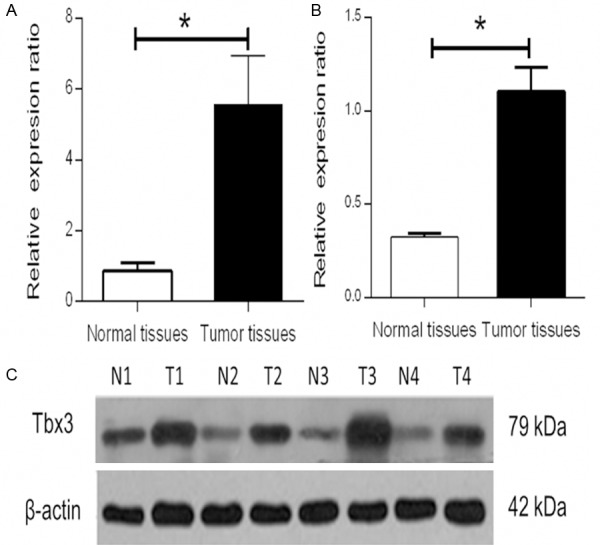
Expression of Tbx3 in CRC tissues and non-tumor tissues. qRT-PCR was employed to evaluate the Tbx3 mRNA expression in CRC tissues and adjacent normal colorectal mucosal tissues. A. The expression of Tbx3 was apparently higher in CRC tissues than that in non-tumor tissues (5.59±1.13 versus 0.09±0.02, *P=0.034). B and C. The result was confirmed by Western blot (1.10±0.13 versus 0.33±0.21, *P<0.001).
Figure 2.
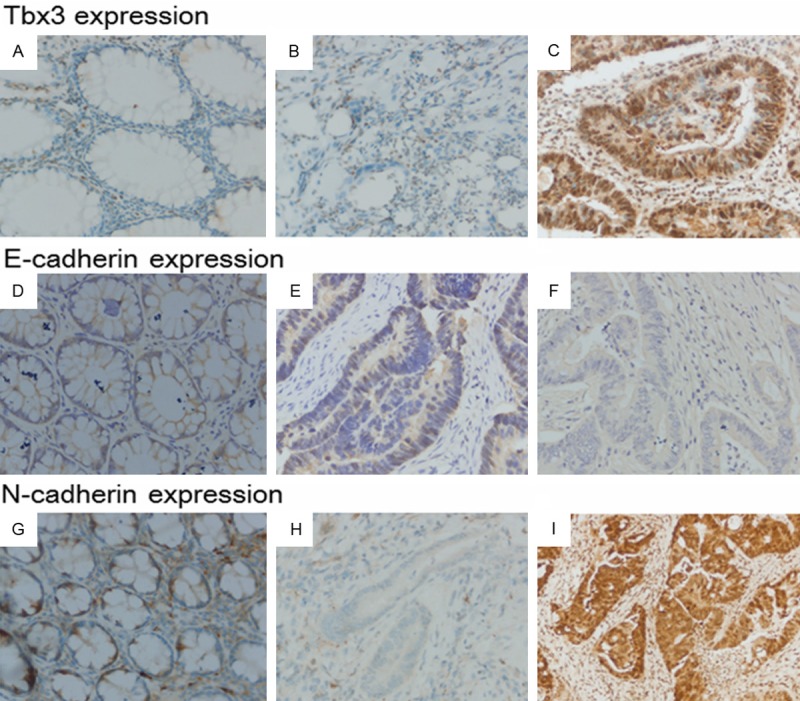
Representative immunohistochemical staining for Tbx3, E-cadherin and N-cadherin in non-tumor CRC tissues and CRC tissues (×400). A. Tbx3 expression in normal CRC tissues. B. Tbx3 negative staining in CRC tissues. C. Tbx3 positive staining in CRC tissues. D. E-cadherin expression in normal CRC tissues. E. E-cadherin negative staining in CRC tissues. F. E-cadherin positive staining in CRC tissues. G. N-cadherin expression in normal CRC tissues. H. N-cadherin negative expression in CRC tissues. I. N-cadherin positive expression in CRC tissues.
Associations between Tbx3 expression and clinicopathological parameters
As shown in Table 1, Tbx3 expression was remarkably associated with tumor size (P=0.049), differentiation (P=0.032), invasion (P=0.019), lymph node metastasis (P=0.049), and TNM stage (P=0.018). However, no significant correlations were found in other clinicopathological parameters, including age (P=0.743), gender (P=0.251), tumor location (P=0.617), and distant metastasis (P=0.519),
Prognostic significance of Tbx3 in patients with CRC
The association between Tbx3 expression and clinical outcome in CRC patients was shown in Figure 3A. CRC patients with high expression of Tbx3 had an overall survival rate of 34.6%, compared with 62.3% for CRC patients with low expression of Tbx3 (P<0.001). Similar result was observed in the disease-free survival analysis (P<0.001) (Figure 3B). Furthermore, patients in the intermediate stages (II and III stage) with low expression of Tbx3 had a better overall and disease-free survival rate than those with high expression of Tbx3 (P=0.004 and 0.003, respectively) (Figure 4A and 4B).
Figure 3.
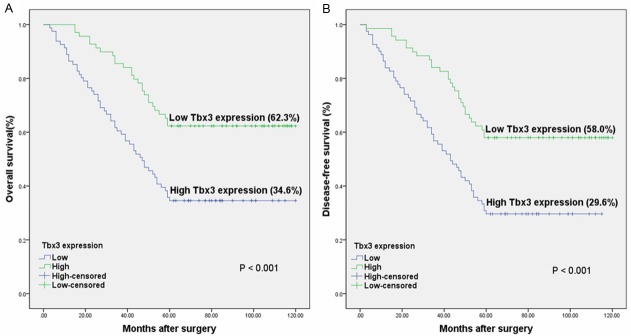
The Kaplan-Meier graph for 150 CRC patients stratified according to the immunoreactive score. A. The overall survival rate for CRC patients with high expression of Tbx3 was lower than those with low expression (P<0.001). B. The disease-free survival rate for CRC patients with high expression of Tbx3 was lower than those with low expression (P<0.001).
Figure 4.
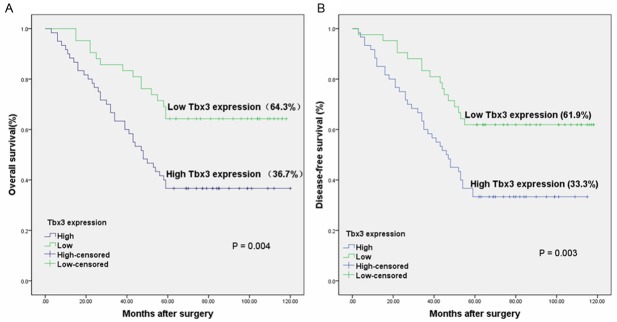
Kaplan-Meier graph for the overall survival (A) and disease-free survival (B) of 102 intermediate CRC patients with low and high Tbx3 expression (P=0.003 and 0.004 respectively).
Cox’s univariate and multivariate hazard regression model was applied to determine independent prognostic factors. As exhibited in Table 2, univariate analysis indicated overall survival of CRC patients was significantly associated with tumor differentiation, tumor invasion, lymph node metastasis, distant metastasis, Tbx3 expression, and TNM stage (P=0.026, 0.004, 0.008, 0.015, <0.001 and <0.001 respectively). In multivariate analysis, Tbx3 expression (P=0.010), Tumor differentiation (P=0.043) Lymph node metastasis (P=0.039), distance metastasis (P=0.016) and TNM stage (P=0.009) could be independent predictive factors in CRC patients.
Table 2.
Correlation between Tbx3 expression and EMT markers
| EMT markers | N | Tbx3 | r | P | |
|---|---|---|---|---|---|
|
| |||||
| Low expression | High expression | ||||
| E-cadherin | |||||
| Low expression | 96 | 29 | 67 | -0.422 | P<0.001 |
| High expression | 54 | 40 | 14 | ||
| N-cadherin | |||||
| Low expression | 56 | 45 | 11 | 0.532 | P<0.001 |
| High expression | 94 | 24 | 70 | ||
The correlation between Tbx3 expression and EMT phenotype in CRC tissues
To determine the association between Tbx3 expression and EMT, Immunochemistry was applied to examine the expression of two widely- acknowledged EMT markers (E-cadherin and N-cadherin). As shown in Figure 2, the membranal expression of E-cadherin in non-tumor tissues was abundantly higher than that in CRC tissues. Conversely, N-cadherin expression was mainly restricted to cytoplasm and substantially increased in CRC tissues when compared with adjacent normal tissues. 64% (96/150) CRC tissues samples exhibited loss of E-cadherin, while N-cadherin overexpression was observed in 63% (95/150) CRC tissues.
As shown in Table 3, in 81 patients with high expression of Tbx3, high expression of E-cadherin was only found in 14 patients, compared with high expression of N-cadherin in 70 patients. Nonparametric Spearman rank correlation coefficient analysis indicated that Tbx3 expression was negatively associated with E-cadherin (r=-0.422, P<0.001) but positively associated with N-cadherin (r=0.532, P<0.001).
Table 3.
Univariate analysis and multivariate analysis for factors influencing the overall survival rate of colorectal cancer patients
| Variables | Univariate analysis | Multivariate analysis | ||||
|---|---|---|---|---|---|---|
|
| ||||||
| HR | 95% CI | P value | HR | 95% CI | P value | |
| Age | 0.712 | 0.454-1.116 | 0.138 | NR | ||
| Gender | 0.881 | 0.566-1.370 | 0.573 | NR | ||
| Tumor location | 1.191 | 0.763-1.859 | 0.442 | NR | ||
| Tumor differentiation | 0.601 | 0.384-0.941 | 0.026* | 0.692 | 0.433-1.104 | 0.043* |
| Tumor size | 1.215 | 0.781-1.889 | 0.387 | NR | ||
| Tumor invasion | 0.509 | 0.321-0.809 | 0.004* | 0.767 | 0.470-1.254 | 0.667 |
| Lymph node metastasis | 0.538 | 0.340-0.851 | 0.008* | 0.612 | 0.381-0.983 | 0.039* |
| Distant metastasis | 0.565 | 0.356-0.896 | 0.015* | 0.698 | 0.431-1.132 | 0.016* |
| TNM stage | 0.472 | 0.296-0.753 | <0.001* | 0.562 | 0.346-0.914 | 0.009* |
| Tbx3 expression | 0.423 | 0.264-0.677 | <0.001* | 0.582 | 0.360-0.941 | 0.010* |
CI, confidence interval; NR, variable was not included in the resultant model; HR, hazard ratio.
Significant difference (P<0.05).
Discussion
Increasing studies have suggested that Tbx3 may be involved in malignant progression of several human cancers, including breast cancer, bladder cancer, melanoma and liver cancer [11,13-15]. However, its role in CRC remains inconclusive. In this study, we found the expression of Tbx3 was significantly up-regulated in CRC tissues in comparison to that in normal colorectal tissues, suggesting a potential promotion of Tbx3 in CRC initiation. This result is also in accordance with a recent genome wide association study that Tbx3 may be associated with colorectal tumor formation [19]. To further investigate its clinical significance, the immunochemistry was applied and the results suggested that the protein expression of Tbx3 was significantly associated with prognosis-related clinical parameters, including tumor size, tumor differentiation, tumor invasion, lymph node metastasis and TNM stages (all P<0.05). This result was similar with a recent study by Renard et al who found overexpression of Tbx3 may be associated with advanced tumor stage of patients with liver cancer [11]. The effective biomarkers predicting prognosis of patients play an important role in clinical management [20-22]. To investigate whether Tbx3 could be an independent predictive marker for CRC patients, we performed the Kaplan-Meier method as well as Cox univariate and multivariate proportional hazard model. The result showed overall survival rate was significantly lower in patients with high expression of Tbx3 than those with low expression of Tbx3, and Tbx3 could become an important independent prognostic factor for CRC patients. TNM classification have been reported not to be suitable to predict outcome in patients with intermediate levels of disease. Patients with intermediate stages even in the same pathologic stage may suffer different clinical outcomes [3]. So, intermediate levels of CRC (II and III) was applied to evaluate the effect of Tbx3 overexpression on the prognosis. Patients with high expression of Tbx3 achieved a poorer prognosis, compared with those with low expression of Tbx3 in the same pathologic stage. Therefore, Tbx3 biomarker may be a useful tool for patients to make clinical decision with respect to follow-up scheduling and administration of adjuvant therapy.
It has been widely accepted that metastasis is one of the most decisive factors influencing patient prognosis and current studies have suggested that a molecular mechanism known as EMT broadly regulates cancer metastasis [23]. Therefore, we also detected the protein expression of EMT markers (E-cadherin and N-cadherin) in CRC tissues by immunohistochemistry and analyzed the possible association between them and Tbx3. Interestingly, we found Tbx3 expression was negatively correlated with E-cadherin expression but positively correlated with N-cadherin expression, suggesting a potential involvement of Tbx3 in EMT phenotype. This deduction was also in accordance with previous studies in other tumors. Du et al. found Tbx3 may act as a target of PLCε to promote the invasion and metastasis of bladder cancer cells by activating the promoter of E-cadherin [14]. Similarly, Tbx3 was reported to be regulated by B-RAF and drive EMT program in B-RAF mutant melanomas [24]. Since EMT could confer abilities of anti-apoptosis and chemoradiotherapy resistance [25-26], researchers found silencing Tbx3 may enhance the sensitivity to Adriamycin and apoptosis resistance in hepatic cancer cells, also supporting a possible association between Tbx3 and EMT [11]. Furthermore, EMT has been reported to have a close relationship with cancer stem cell (CSC) characteristics [27-28] and a recent study suggested Tbx3 could become the CSC markers of colon cancer cells [29]. Taken together, it is reasonable that Tbx3 may be involved in development of CRC partly by participating in EMT. However, to investigate the specific regulatory role of Tbx3 in EMT, subsequent assays in vitro and vivo remains to be necessary.
In summary, our study for the first time demonstrates that Tbx3 may be associated with the progression of CRC and can act as an independent prognostic biomarker for patients with CRC. Furthermore, Tbx3 can also be an ideal prognostic biomarker for patients with intermediate levels of CRC. In particular, we also find Tbx3 may be associated with EMT phenotype in CRC. Taken together, these convincing evidences suggested that Tbx3 has the potential to be an effective therapeutic target and prognostic predictor for CRC patients in the forthcoming future. Further studies based on cellular and animal model will be continued to investigate the specific molecular mechanism that TBx3 regulates in the development of CRC.
Acknowledgements
We thank Department of General Surgery of Sixth People’s Hospital affiliated to Shanghai Jiao Tong University for providing the CRC tissues. We thank Professor Yu-ping Gao (Shanghai Key Laboratory for Assisted Reproduction and Reproductive Genetics, Center for Reproductive Medicine, Renji Hospital Affiliated to Shanghai Jiao Tong University) for her kind assistance in immunohistochemistry assay. We thank Science and Technology Commission of Shanghai Municipality (NO. 124119a7202 and 134119a9502) for fund support for our study.
Disclosure of conflict of interest
None.
References
- 1.Siegel R, Desantis C, Jemal A. Colorectal cancer statistics, 2014. CA Cancer J Clin. 2014;64:104–117. doi: 10.3322/caac.21220. [DOI] [PubMed] [Google Scholar]
- 2.Walker AS, Johnson EK, Maykel JA, Stojadinovic A, Nissan A, Brucher B, Champagne BJ, Steele SR. Future Directions for the Early Detection of Colorectal Cancer Recurrence. J Cancer. 2014;5:272–280. doi: 10.7150/jca.8871. [DOI] [PMC free article] [PubMed] [Google Scholar]
- 3.Schneider NI, Langner C. Prognostic stratification of colorectal cancer patients: current perspectives. Cancer Manag Res. 2014;6:291–300. doi: 10.2147/CMAR.S38827. [DOI] [PMC free article] [PubMed] [Google Scholar]
- 4.O’Connell JB, Maggard MA, Ko CY. Colon cancer survival rates with the new American Joint Committee on Cancer sixth edition staging. J Natl Cancer Inst. 2004;96:1420–1425. doi: 10.1093/jnci/djh275. [DOI] [PubMed] [Google Scholar]
- 5.Papaioannou VE, Silver LM. The T-box gene family. Bioessays. 1998;20:9–19. doi: 10.1002/(SICI)1521-1878(199801)20:1<9::AID-BIES4>3.0.CO;2-Q. [DOI] [PubMed] [Google Scholar]
- 6.Agulnik SI, Garvey N, Hancock S, Ruvinsky I, Chapman DL, Agulnik I, Bollag R, Papaioannou V, Silver LM. Evolution of mouse T-box genes by tandem duplication and cluster dispersion. Genetics. 1996;144:249–254. doi: 10.1093/genetics/144.1.249. [DOI] [PMC free article] [PubMed] [Google Scholar]
- 7.Tada M, Smith JC. T-targets: clues to understanding the functions of T-box proteins. Dev Growth Differ. 2001;43:1–11. doi: 10.1046/j.1440-169x.2001.00556.x. [DOI] [PubMed] [Google Scholar]
- 8.Washkowitz AJ, Gavrilov S, Begum S, Papaioannou VE. Diverse functional networks of Tbx3 in development and disease. Wiley Interdiscip Rev Syst Biol Med. 2012;4:273–283. doi: 10.1002/wsbm.1162. [DOI] [PMC free article] [PubMed] [Google Scholar]
- 9.Ballim RD, Mendelsohn C, Papaioannou VE, Prince S. The ulnar-mammary syndrome gene, Tbx3, is a direct target of the retinoic acid signaling pathway, which regulates its expression during mouse limb development. Mol Biol Cell. 2012;23:2362–2372. doi: 10.1091/mbc.E11-09-0790. [DOI] [PMC free article] [PubMed] [Google Scholar]
- 10.Lu R, Yang A, Jin Y. Dual functions of T-box 3 (Tbx3) in the control of self-renewal and extraembryonic endoderm differentiation in mouse embryonic stem cells. J Biol Chem. 2011;286:8425–8436. doi: 10.1074/jbc.M110.202150. [DOI] [PMC free article] [PubMed] [Google Scholar]
- 11.Renard CA, Labalette C, Armengol C, Cougot D, Wei Y, Cairo S, Pineau P, Neuveut C, de Reyniès A, Dejean A, Perret C, Buendia MA. Tbx3 is a downstream target of the Wnt/beta-catenin pathway and a critical mediator of beta-catenin survival functions in liver cancer. Cancer Res. 2007;67:901–910. doi: 10.1158/0008-5472.CAN-06-2344. [DOI] [PubMed] [Google Scholar]
- 12.Burgucu D, Guney K, Sahinturk D, Ozbudak IH, Ozel D, Ozbilim G, Yavuzer U. Tbx3 represses PTEN and is over-expressed in head and neck squamous cell carcinoma. BMC Cancer. 2012;12:481. doi: 10.1186/1471-2407-12-481. [DOI] [PMC free article] [PubMed] [Google Scholar]
- 13.Rodriguez M, Aladowicz E, Lanfrancone L, Goding CR. Tbx3 represses E-cadherin expression and enhances melanoma invasiveness. Cancer Res. 2008;68:7872–7881. doi: 10.1158/0008-5472.CAN-08-0301. [DOI] [PubMed] [Google Scholar]
- 14.Du HF, Ou LP, Yang X, Song XD, Fan YR, Tan B, Luo CL, Wu XH. A new PKCalpha/beta/TBX3/E-cadherin pathway is involved in PLCepsilon-regulated invasion and migration in human bladder cancer cells. Cell Signal. 2014;26:580–593. doi: 10.1016/j.cellsig.2013.11.015. [DOI] [PubMed] [Google Scholar]
- 15.Li J, Weinberg MS, Zerbini L, Prince S. The oncogenic TBX3 is a downstream target and mediator of the TGF-beta1 signaling pathway. Mol Biol Cell. 2013;24:3569–3576. doi: 10.1091/mbc.E13-05-0273. [DOI] [PMC free article] [PubMed] [Google Scholar]
- 16.Guo F, ParkerKerrigan BC, Yang D, Hu L, Shmulevich I, Sood AK, Xue F, Zhang W. Post-transcriptional regulatory network of epithelial-to-mesenchymal and mesenchymal-to-epithelial transitions. J Hematol Oncol. 2014;7:19. doi: 10.1186/1756-8722-7-19. [DOI] [PMC free article] [PubMed] [Google Scholar]
- 17.Le Bras GF, Taubenslag KJ, Andl CD. The regulation of cell-cell adhesion during epithelial-mesenchymal transition, motility and tumor progression. Cell Adh Migr. 2012;6:365–373. doi: 10.4161/cam.21326. [DOI] [PMC free article] [PubMed] [Google Scholar]
- 18.Zhang X, Liu G, Kang Y, Dong Z, Qian Q, Ma X. N-cadherin expression is associated with acquisition of EMT phenotype and with enhanced invasion in erlotinib-resistant lung cancer cell lines. PLoS One. 2013;8:e57692. doi: 10.1371/journal.pone.0057692. [DOI] [PMC free article] [PubMed] [Google Scholar]
- 19.Peters U, Jiao S, Schumacher FR, Hutter CM, Aragaki AK, Baron JA, Berndt SI, Bézieau S, Brenner H, Butterbach K, Caan BJ, Campbell PT, Carlson CS, Casey G, Chan AT, Chang-Claude J, Chanock SJ, Chen LS, Coetzee GA, Coetzee SG, Conti DV, Curtis KR, Duggan D, Edwards T, Fuchs CS, Gallinger S, Giovannucci EL, Gogarten SM, Gruber SB, Haile RW, Harrison TA, Hayes RB, Henderson BE, Hoffmeister M, Hopper JL, Hudson TJ, Hunter DJ, Jackson RD, Jee SH, Jenkins MA, Jia WH, Kolonel LN, Kooperberg C, Küry S, Lacroix AZ, Laurie CC, Laurie CA, Le Marchand L, Lemire M, Levine D, Lindor NM, Liu Y, Ma J, Makar KW, Matsuo K, Newcomb PA, Potter JD, Prentice RL, Qu C, Rohan T, Rosse SA, Schoen RE, Seminara D, Shrubsole M, Shu XO, Slattery ML, Taverna D, Thibodeau SN, Ulrich CM, White E, Xiang Y, Zanke BW, Zeng YX, Zhang B, Zheng W, Hsu L. Identification of Genetic Susceptibility Loci for Colorectal Tumors in a Genome-Wide Meta-analysis. Gastroenterology. 2013;144:799–807. doi: 10.1053/j.gastro.2012.12.020. [DOI] [PMC free article] [PubMed] [Google Scholar]
- 20.Gao P, Song YX, Xu YY, Sun Z, Sun JX, Xu HM, Wang ZN. Does the prognosis of colorectal mucinous carcinoma depend upon the primary tumour site? Results from two independent databases. Histopathology. 2013;63:603–615. doi: 10.1111/his.12190. [DOI] [PubMed] [Google Scholar]
- 21.Nitsche U, Zimmermann A, Späth C, Müller T, Maak M, Schuster T, Slotta-Huspenina J, Käser SA, Michalski CW, Janssen KP, Friess H, Rosenberg R, Bader FG. Mucinous and signet-ring cell colorectal cancers differ from classical adenocarcinomas in tumor biology and prognosis. Ann Surg. 2013;258:775–782. doi: 10.1097/SLA.0b013e3182a69f7e. [DOI] [PMC free article] [PubMed] [Google Scholar]
- 22.Piovano E, Attamante L, Macchi C, Cavallero C, Romagnolo C, Maggino T, Landoni F, Gadducci A, Sartori E, Gion M, Zola P. The Role of HE4 in Ovarian Cancer Follow-up: A Review. Int J Gynecol Cancer. 2014;24:1359–1365. doi: 10.1097/IGC.0000000000000218. [DOI] [PubMed] [Google Scholar]
- 23.Hanahan D, Weinberg RC. Hallmarks of cancer: the next generation. Cell. 2011;144:646–674. doi: 10.1016/j.cell.2011.02.013. [DOI] [PubMed] [Google Scholar]
- 24.Boyd SC, Mijatov B, Pupo GM, Tran SL, Gowrishankar K, Shaw HM, Goding CR, Scolyer RA, Mann GJ, Kefford RF, Rizos H, Becker TM. Oncogenic B-RAF(V600E) signaling induces the T-Box3 transcriptional repressor to repress E-cadherin and enhance melanoma cell invasion. J Invest Dermatol. 2013;133:1269–77. doi: 10.1038/jid.2012.421. [DOI] [PMC free article] [PubMed] [Google Scholar]
- 25.Voulgari A, Pintzas A. Epithelial-mesenchymal transition in cancer metastasis: Mechanisms, markers and strategies to overcome drug resistance in the clinic. Biochim Biophys Acta. 2009;1796:5–90. doi: 10.1016/j.bbcan.2009.03.002. [DOI] [PubMed] [Google Scholar]
- 26.Guarino M. Epithelial-mesenchymal transition and tumour invasion. Int J Biochem Cell Biol. 2007;39:2153–2160. doi: 10.1016/j.biocel.2007.07.011. [DOI] [PubMed] [Google Scholar]
- 27.Mani SA, Guo W, Liao MJ, Eaton EN, Ayyanan A, Zhou AY, Brooks M, Reinhard F, Zhang CC, Shipitsin M, Campbell LL, Polyak K, Brisken C, Yang J, Weinberg RA. The epithelial-mesenchymal transition generates cells with properties of stem cells. Cell. 2008;133:704–715. doi: 10.1016/j.cell.2008.03.027. [DOI] [PMC free article] [PubMed] [Google Scholar]
- 28.Yu Z, Pestell TG, Lisanti MP, Pestell RG. Cancer stem cells. Int J Biochem Cell Biol. 2012;44:2144–2151. doi: 10.1016/j.biocel.2012.08.022. [DOI] [PMC free article] [PubMed] [Google Scholar]
- 29.Amini S, Fathi F, Mobalegi J, Sofimajidpour H, Ghadimi T. The expressions of stem cell markers: Oct4, Nanog, Sox2, nucleostemin, Bmi, Zfx, Tcl1, Tbx3, Dppa4, and Esrrb in bladder, colon, and prostate cancer, and certain cancer cell lines. Anat Cell Biol. 2014;47:1–11. doi: 10.5115/acb.2014.47.1.1. [DOI] [PMC free article] [PubMed] [Google Scholar]