

Abstract
MicroRNAs (miRNAs) are a class of small noncoding RNAs that bind to 3’-untranslated (UTR) regions of target messenger RNAs to regulate protein synthesis. Reports have suggested that a set of specific miRNAs may be used as diagnostic and/or prognostic markers for astrocytoma grading. However, there are few studies of the specific miRNAs differentially expressed in each astrocytoma grade. MiRNA-containing total RNA was isolated from archived formalin-fixed, paraffin-embedded (FFPE) samples from WHO grade II-IV astrocytoma patients. The RNA was labeled and hybridized to Affymetrix miRNA 2.0 arrays. Statistical analysis identified several miRNAs differentially expressed in each astrocytoma grade. In particular, miR-27a, miR-210, and miR-1225-5p expression levels were able to differentiate grade IV from grade II and III astrocytomas as confirmed by real-time PCR. Kaplan-Meier survival analysis showed that disease progression occurred faster for Glioblastoma Multiforme (GBM) patients with a lower miR-27a expression level. Transfection of CRL-1690 GBM human cancer cells with a miR-27a oligonucleotide inhibitor followed by Real-time PCR identified six potential miR-27a target genes. Furthermore, the miR-27a oligonucleotide inhibitor induced CRL-1690 cell apoptosis. Taken together, our results provide additional miRNA signatures for distinguishing GBM from lower astrocytoma grades and suggest miR-27a as a prognostic and therapeutic target for GBM.
Keywords: miR-27a, glioblastoma multiforme, astrocytoma, microRNAs
Introduction
Astrocytomas, which are tumors derived from astrocytes, are the most common type of adult primary central nervous system (CNS) neoplasms, representing approximately 76% of all primary brain tumors [1,2]. The World Health Organization (WHO) histologically classifies astrocytomas by combining tumor type with the assignment of a defined malignancy grade [3]. Four histological malignancy grades have been defined, which range from slow-growing tumors associated with long-term survival i.e., WHO grade I, to highly malignant tumors i.e., WHO grade IV [1]. Grade IV astrocytoma, also called glioblastoma multiforme (GBM), is the most common and aggressive form of glioma and accounts for over 60% of all astrocytomas [1,3]. The median survival for patients diagnosed with GBM has only marginally changed in the last 25 years, and there continues to be rapid disease progression in 1 year [1]. Because the histopathological grading is insufficient to explain the major molecular events driving the tumor growth, there is an urgent need for better diagnostic, prognostic and therapeutic tools for patients with astrocytomas, particularly for GBMs.
MicroRNAs (miRNA) are small noncoding RNAs (18~22-nt) that bind to complementary sequences in 3’-UTRs of target messenger RNAs (mRNAs) and post-transcriptionally regulate gene expression [4]. MiRNAs play key roles in several biological processes, including cell proliferation, cell differentiation and apoptosis [4,5]. There is increasing in vitro and in vivo evidence that numerous miRNAs are dysregulated in a variety of cancers including astrocytoma [6-8]. Although the molecular biological consequences of a number of dysregulated miRNAs and their target genes in GBM have been well studied [9-19], there are few studies of specific miRNAs dysregulated in each astrocytoma grade. Studies have suggested that particular miRNA signatures may be associated with each astrocytoma grade [9,11,20-22]. These signatures may be used as an additional tool for diagnosis, staging, progression, prognosis and response to treatment. In this study, we performed miRNA expression profiling of WHO grade II, III and IV astrocytomas and identified several microRNAs that were associated with each astrocytoma grade. Further qPCR validation studies showed that miR-210, miR-27a, miR-92b, miR-130b, miR-1225-5p and miR-1908 are highly associated with GBM. MiRNA target prediction tools and ingenuity pathway analysis (IPA) demonstrated that many of these miRNAs control key pathways associated with cell growth, proliferation and cell cycle control. Kaplan-Meier curve analysis showed that miR-27a is a prognostic factor for GBM. Mechanistic studies identified a number of potential miR-27a target genes in human GBM cells. Finally, we used a miR-27a inhibitor and observed its effects on apoptosis and cell cycle progression of CRL-1690 human cancer cells.
Materials and methods
Tumor samples and RNA isolation
A total of 35 archived (2008-2010) formalin-fixed, paraffin-embedded (FFPE) tissue blocks from newly diagnosed (de novo) astrocytoma patients were obtained from the Pathology Department of the University of Puerto Rico Medical Sciences Campus. The research protocol was approved by the University of Puerto Rico Medical Sciences Campus Institutional Research Board. In this study we included 8 WHO grade II samples (5 females, 3 males; median age: 41), 8 WHO grade III samples (2 females, 6 males; median age: 33) and 19 WHO grade IV samples (13 females, 6 males; median age: 59). For 7 of the 19 WHO grade IV FFPE samples, surrounding non-tumor tissues was also collected. A representative hematoxylin and eosin (H&E)-stained slide from each of the selected tissue blocks was reviewed by a pathologist and a neurooncologist to corroborate the tumor grades and delineate the tumor areas. As a control, 5 FFPE brain samples from normal subjects (2 females, 3 males; median age: 38) were used and were selected based on the following criteria: non-neoplastic, non-infectious, brain tissue with no metabolic condition without hemorrhagic or necrotic diathesis. For each FFPE tissue block, a 3-mm punch biopsy sample was obtained from a tumor area that a pathologist had previously delineated on a corresponding glass slide. Each sample was identified with a numeric code (no personal identifiers were employed). Samples were placed in a microcentrifuge tube for miRNA extraction, and they were processed using the RecoverAll Total Nucleic Acid Isolation Kit (Ambion, Austin, TX, USA) according to the manufacturer’s instructions. Briefly, samples were subjected to deparaffinization with 100% xylene followed by washing with 100% ethanol, and they were dried in a centrifugal vacuum concentrator at 40°C. Three hundred microliters of digestion buffer and 6 μL of protease were added to each sample, which was incubated at 50°C for 3 hours, heated to 85°C for 15 minutes, and placed at -20°C overnight. Then, 200 μL of isolation additive was added to the samples, which were then vortexed and mixed with 550 μL ethanol. The final mixture was passed through a filter cartridge and centrifuged at 10,000× g for 30 seconds. Samples were washed once with wash solution 1 and once with wash solution 2/3. Each sample was then subjected to DNase digestion for 1 hour. Samples were subjected to a second consecutive washing step with wash solution 1 and wash solution 2/3. RNA was eluted by 60 μL dH2O, followed by centrifugation at maximum speed for 1 minute. RNA concentrations were calculated using a NanoDrop (Thermo Scientific, Wilmington, DE, USA). RNA isolation from culture cells was performed with the GenElute Mammalian Total RNA Miniprep Kit (Sigma-Aldrich, St. Louis, MO, USA). Briefly, 250 μL of β-mercaptoethanol/lysis buffer was added to the samples, which were mixed and added to a GenElute filtration column that was centrifuged at 15,000 rpm for 2 minutes. Subsequently, 250 μL of 70% ethanol was added to the lysate, and the mixture was then added to a GenElute binding column and centrifuged at 15,000 rpm for 15 seconds. Samples were washed with 500 μL solution 1 and twice with 500 μL solution 2. Total RNA was eluted by 50 μL RNAse/DNase-free water followed by centrifugation at 15,000 rpm for 1 minute. RNA integrity was evaluated using a Bioanalyzer from Agilent Technologies.
Cells and culture conditions
CRL-1690 GBM human cancer cells were purchased from American Type Culture Collection (ATCC) (Manassas, VA, USA). The cells were maintained in adherent culture in Dulbecco’s Modified Eagle Medium: Nutrient Mixture F-12 (DMEM/F-12; GIBCO) (Invitrogen Corp.) supplemented with 10% fetal bovine serum (FBS) (Thermo Scientific, Logan, UT, USA), 100 U/mL penicillin (Thermo Scientific), and 100 µg/mL streptomycin (Thermo Scientific) at 37°C in a humidified chamber with 5% CO2. In vitro assays were performed at 75-85% cell density. For transient transfections, CRL-1690 cells (3 × 10⁴ cells/mL) were plated in 6-well plates. Twenty-four hours later, a mixture of 100 nM (final concentration) of oligonucleotide inhibitor (Life Technology, Grand Island, NY, USA), lipofectamine RNAiMAX (Life Technology) (1:1 ratio, v/v), and Opti-MEM I (Life Technologies) was added to the cells. After 24 hours, cells were collected and used for RNA isolation.
Microarray experiments
The GeneChip miRNA 2.0 Array from Affymetrix (1,105 human miRNAs) was used to detect miRNA expression profiles (Affymetrix, Santa Clara, CA, USA). Five FFPE samples from each tumor grade and 5 controls were used. Total RNA was labeled with the Biotin HSR RNA Labeling Kit, which was purchased from Genisphere (Hatfield, PA, USA). Labeled samples were hybridized by incubation at 48°C and spinning at 60 rpm for 16-18 hours. Each microarray was hybridized with a single sample, and all procedures were performed according to the manufacturer’s protocol. Chips were scanned using a GeneChip Scanner 3000 7G from Affymetrix, and probe cell intensity data were extracted from the generated images using the GeneChip Command Console Software (AGCC) v.2.
Microarray data analysis
Non-parametric one-way ANOVA was used to analyze differences in the miRNA expression level of each astrocytoma grade versus control (normal brain tissue) using Partek Genomics suite (St Louis, MO, USA). This analysis was performed by applying the following parameters: no False Discovery Rate (FDR), P-value < 0.05 and fold change > 2 or < -2.
MiRNA target prediction and ingenuity pathway analysis
Identification of potential miRNA target molecules was performed using miRNA target prediction software (microrna.org, Diana-microt, Target Scan Human, and mRDB). These software packages are available via the miRBase searchable database (http://www.mirbase.org/). The most significantly regulated miRNAs in each grade were used to construct molecular pathways with Ingenuity Pathway Analysis (IPA) 7.1 Software (Ingenuity Systems, Redwood City, CA, USA; www.ingenuity.com). MiRNA regulated genes were associated with canonical pathways using IPA.
Reverse transcription and Taqman real-time polymerase chain reaction (qPCR)
Fifty nanograms of total RNA (5 controls, 8 grade II, 8 grade III and 19 grade IV astrocytomas) was reverse transcribed into cDNA using the TaqMan Reverse Transcription kit (Applied Biosystems, Carlsbad, CA, USA) in a 15 μL reaction mix containing 100 mM dNTPs, 10X Reverse Transcriptase Buffer, 20 U/μL RNase Inhibitor, 50 U/μl MultiScribe Reverse Transcriptase, and 5X RT primer. The mixture was incubated at 16°C for 30 minutes, 42°C for 30 minutes, and 85°C for 5 minutes. The resulting first-strand complementary DNA (cDNA) was used as template for TaqMan-based Real-Time PCR as follows: 1 μL of cDNA was added to TaqMan Universal PCR Master Mix II (Applied Biosystems, Carlsbad, CA, USA) containing a TaqMan Gene Expression Assay (20X) for each primer. PCR was performed using a StepOne plus (Applied Biosystems) real-time PCR instrument with the following thermal settings: one cycle of 2 minutes at 50°C, one cycle of 10 minutes at 95°C, and 40 cycles of 15 seconds at 95°C and 1 minute at 60°C. The threshold cycle (Ct) was used to calculate relative miRNA expression levels (2-ΔΔCt) [23,24]. RNU48 was used as an endogenous control [25]. For each miRNA, ΔCt was calculated as the Ct of each sample minus the Ct of RNU48, and the ΔΔCt was calculated as the ΔCt of each sample minus the mean ΔCt of the control group [25,26]. Values are expressed as “Relative Expression”.
Assessment of cell-cycle progression and cell apoptosis
CRL-1690 cells (3 × 10⁴ cells/mL) were plated in 6-well plates. After 24 hours, 100 nM (final concentration) miR-27a-3p oligonucleotide inhibitor (Life Technology, Grand Island, NY, USA) or 100 nM (final concentration) miRNA negative control (Life Technologies) was mixed with Lipofectamine RNAiMAX (Invitrogen Corp.) in a 1:1 ratio (v/v) and Opti-MEM I (100 µL final volume). The mix was incubated for 20 minutes at RT and then added to the cells. Forty-eight hours later, cell cycle progression was measured using a Muse Cell Cycle Kit (EMD Millipore Headquarters, Billerica, MA, USA), which uses propidium iodide (PI) and RNAse A to discriminate cells at different stages of the cell cycle. Cells were analyzed using the Muse Cell Analyzer (EMD Millipore Headquarters). Apoptosis was measured 72 hours after miRNA inhibitor transfection with the Muse Annexin V & Dead Cell Kit (EMD Millipore Headquarters), which uses Annexin V and a dead cell marker as an apoptotic and cell membrane integrity marker, respectively. Briefly, cells were washed, trypsinized and collected. Collected cells were incubated with 100 µl Muse Annexin V & Dead Cell reagent at room temperature in the dark according to the manufacturer’s instructions. The number of apoptotic cells was recorded with a Muse Cell Analyzer (EMD Millipore Headquarters).
Reverse transcription and SYBR-Green I RT-PCR for target identification
Total RNA was subjected to reverse transcription using the iScript cDNA Synthesis Kit from Bio-Rad. Briefly, a reaction mix containing 4 μL 5x iScript reaction mix, 100 ng RNA template, and nuclease-free water (20 µL final volume) was set up. The mixture was incubated at 25°C for 5 minutes followed by 42°C for 30 minutes and 85°C for 5 minutes. The resulting first-strand cDNA was used as template for PCR analysis. A master mix containing 1 μL cDNA, 10 μL iTaq Universal SYBR Green Supermix (2x), and nuclease-free water were mixed (25 µL final volume) and heated at 95°C for 2 minutes followed by 40 cycles of 5 seconds at 95°C and 30 seconds at 60°C. Data were collected and analyzed using StepOne Software v2.1 from Applied Biosystems. Gene expression values were calculated relative to β-actin, which was used as an internal standard [23,27].
Statistical analysis
Statistical analysis was performed using GraphPad Prism 5 (GraphPad Software, Inc., La Jolla, California). In vitro experiments and miRNA expression levels in tumor tissues were analyzed using Student’s t test for comparing two groups and ANOVA for multiple group comparisons, with p < 0.05 considered statistically significant. Kaplan-Meier analysis was performed using the log-rank (Mantel-Cox) test. Patients were grouped based on the expression differences compared with the median expression level of all GBM samples. All in vitro experiments were performed in triplicate.
Results
MicroRNA expression signatures in grade II, III and IV astrocytomas
To determine the miRNA expression pattern in WHO grade II-IV we performed microarray analysis comparing each astrocytoma grade with a control group. The intensity values for each miRNA probe in the array were used to calculate differences in miRNA expression with the Partek software. The distribution of the differentially expressed miRNAs in each astrocytoma grade is shown in a Venn diagram (Figure 1). In total, 40 miRNAs were a signature for grade II, 17 for grade III, and 20 for grade IV astrocytomas (*p < 0.05, fold-change: ± 2, Table 1A-C). Remarkably, 13 overlapping miRNAs were found to be differentially expressed in all WHO grade II-IV (Figure 1 and Table 2). Unsupervised hierarchical clustering analysis of both the miRNAs that were differentially abundant in each astrocytoma grade and the 13 dysregulated miRNAs in all astrocytoma grades are illustrated in heat maps in Figure 2A and 2B, respectively. A clear segregation of up-regulated (red color vs. black regions) and down-regulated (green color vs. black regions) miRNAs distinguished each grade (Figure 2A), which suggests that a miRNA signature profile distinguishes grade II, III and IV astrocytoma. The heatmap in Figure 2B demonstrates that the expression of some miRNAs increased (increasing red color intensity) or decreased (increasing green color intensity) based on astrocytoma grade. Remarkably, miR-92b was progressively up regulated from grades II to IV, while miR-3185 and miR-1908 were gradually down-regulated from grades II to IV (Figure 2B).
Figure 1.
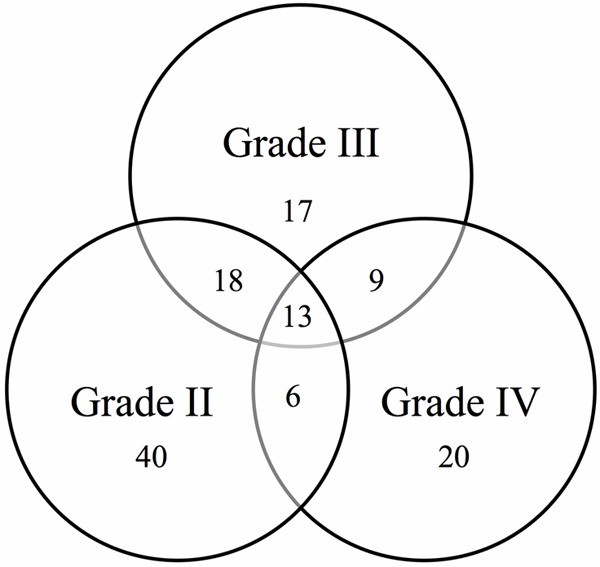
Venn diagram showing the number of dysregulated miRNAs in grade II, III and IV astrocytoma. A total of 40, 17 and 20 miRNAs were signatures for grades II, III and IV astrocytoma, respectively. Thirteen dysregulated miRNAs were common to all astrocytoma grades. Small nucleolar RNAs and ENSG genes were not included in this diagram.
Table 1.
List of miRNA signatures for each astrocytoma grade
| A. MiRNAs Signature in Grade II | |||||
|
| |||||
| Probeset ID | P-value | Fold-Change | Probeset ID | P-value | Fold-Change |
|
| |||||
| hsa-miR-1469 | 0.0016 | -4.41 | hsa-miR-30c-2-star | 0.0153 | 2.83 |
| hsa-miR-1308 | 0.0065 | -3.85 | hsa-miR-181a-star | 0.0087 | 2.97 |
| hsa-miR-762 | 0.0091 | -3.15 | hsa-miR-4260 | 0.0126 | 3.01 |
| hsa-miR-92b-star | 0.0021 | -2.97 | hsa-miR-18a | 0.0083 | 3.27 |
| hsa-miR-3196 | 0.0120 | -2.59 | hsa-miR-194 | 0.0103 | 3.29 |
| hsa-miR-149-star | 0.0169 | -2.19 | hsa-miR-99b-star | 0.0181 | 3.46 |
| hsa-miR-768-3p | 0.0103 | 2.05 | hsa-miR-25 | 0.0494 | 3.56 |
| hsa-miR-29c | 0.0405 | 2.06 | hsa-miR-500 | 0.0008 | 3.92 |
| hsa-miR-542-3p | 0.0202 | 2.09 | hsa-miR-15a | 0.0222 | 4.26 |
| hsa-miR-363 | 0.0092 | 2.11 | hsa-miR-489 | 0.0026 | 4.31 |
| hsa-miR-505-star | 0.0067 | 2.14 | hsa-miR-362-5p | 0.0045 | 4.50 |
| hsa-miR-17-star | 0.0225 | 2.21 | hsa-miR-500-star | 0.0001 | 4.57 |
| hsa-miR-20a | 0.0313 | 2.30 | hsa-miR-30b | 0.0306 | 4.88 |
| hsa-miR-125a-3p | 0.0082 | 2.36 | hsa-miR-335 | 0.0460 | 5.15 |
| hsa-miR-664-star | 0.0271 | 2.38 | hsa-miR-371-5p | 0.0196 | 5.42 |
| hsa-miR-30e | 0.0458 | 2.42 | hsa-miR-181c-star | 0.0102 | 5.44 |
| hsa-miR-28-5p | 0.0454 | 2.49 | hsa-miR-339-3p | 0.0038 | 6.24 |
| hsa-miR-4299 | 0.0405 | 2.65 | hsa-miR-532-5p | 0.0012 | 7.49 |
| hsa-miR-339-5p | 0.0485 | 2.77 | hsa-miR-19b | 0.0005 | 9.89 |
| hsa-miR-501-3p | 0.0023 | 2.82 | hsa-miR-497 | 0.0065 | 15.31 |
|
| |||||
| B. MiRNAs Signature in Grade III | |||||
|
| |||||
| Probeset ID | P-value | Fold-Change | |||
|
| |||||
| hsa-miR-487b | 0.0121 | -5.40 | |||
| hsa-miR-222 | 0.0384 | -4.27 | |||
| hsa-miR-126 | 0.0354 | -3.74 | |||
| hsa-miR-1979 | 0.0436 | -2.96 | |||
| hsa-miR-382 | 0.0472 | -2.87 | |||
| hsa-miR-409-3p | 0.0105 | -2.57 | |||
| hsa-miR-1826 | 0.0281 | -2.55 | |||
| hsa-miR-1909 | 0.0115 | -2.43 | |||
| hsa-miR-23b | 0.0166 | -2.09 | |||
| hsa-miR-3197 | 0.0499 | -2.01 | |||
| hsa-miR-1275 | 0.0165 | 2.00 | |||
| hsa-miR-4289 | 0.0067 | 2.01 | |||
| hp_hsa-mir-520h | 0.0419 | 2.13 | |||
| hsa-miR-455-3p | 0.0428 | 2.39 | |||
| hsa-miR-9 | 0.0320 | 2.53 | |||
| hsa-miR-423-5p | 0.0004 | 3.36 | |||
| hsa-miR-3201 | 0.0037 | 6.46 | |||
|
| |||||
| C. MiRNAs Signature in Grade IV | |||||
|
| |||||
| Probeset ID | P-value | Fold-Change | |||
|
| |||||
| hsa-miR-124 | 0.0127 | -46.60 | |||
| hp_hsa-mir-124-2 | 0.0092 | -28.79 | |||
| hp_hsa-mir-124-3 | 0.0086 | -28.76 | |||
| hp_hsa-mir-124-1 | 0.0091 | -28.17 | |||
| hsa-miR-139-5p | 0.0169 | -8.36 | |||
| hsa-miR-330-3p | 0.0047 | -6.03 | |||
| hsa-miR-29a | 0.0098 | -3.58 | |||
| hsa-miR-139-3p | 0.0470 | -3.55 | |||
| hsa-miR-4270 | 0.0279 | -3.18 | |||
| hsa-miR-423-3p | 0.0057 | 2.41 | |||
| hsa-miR-99a | 0.0011 | 3.19 | |||
| hp_hsa-mir-886 | 0.0107 | 3.40 | |||
| hsa-miR-193b | 0.0198 | 3.44 | |||
| hsa-miR-720 | 0.0074 | 4.07 | |||
| hsa-miR-106b | 0.0010 | 4.77 | |||
| hsa-miR-27a | 0.0257 | 4.79 | |||
| hsa-miR-34a | 0.0228 | 4.82 | |||
| hsa-miR-886-3p | 0.0433 | 5.44 | |||
| hsa-miR-1274b | 0.0086 | 7.52 | |||
| hsa-miR-210 | 0.0082 | 8.70 | |||
Table 2.
Dysregulated miRNAs that were common in all astrocytoma grades
| WHO Grade | Probeset ID | P-value | Fold-Change | WHO Grade | Probeset ID | P-value | Fold-Change |
|---|---|---|---|---|---|---|---|
| II | hsa-miR-3185 | 0.0002 | -19.89 | II | hsa-miR-106a | 0.0170 | 2.37 |
| III | hsa-miR-3185 | 0.0018 | -11.00 | III | hsa-miR-106a | 0.0098 | 2.83 |
| IV | hsa-miR-3185 | 0.0282 | -5.60 | IV | hsa-miR-106a | 0.0032 | 2.49 |
| II | hsa-miR-1225-5p | 0.0092 | -4.85 | II | hsa-miR-17 | 0.0089 | 2.78 |
| III | hsa-miR-1225-5p | 0.0010 | -2.81 | III | hsa-miR-17 | 0.0049 | 3.24 |
| IV | hsa-miR-1225-5p | 0.0017 | -3.46 | IV | hsa-miR-17 | 0.0084 | 2.53 |
| II | hsa-miR-1228-star | 0.0067 | -4.09 | II | hsa-miR-345 | 0.0004 | 9.22 |
| III | hsa-miR-1228-star | 0.0238 | -3.35 | III | hsa-miR-345 | 0.0410 | 3.24 |
| IV | hsa-miR-1228-star | 0.0047 | -3.30 | IV | hsa-miR-345 | 0.0103 | 3.97 |
| II | hsa-miR-1908 | 0.0050 | -4.26 | II | hsa-miR-93 | 0.0029 | 3.17 |
| III | hsa-miR-1908 | 0.0065 | -4.24 | III | hsa-miR-93 | 0.0001 | 6.84 |
| IV | hsa-miR-1908 | 0.0155 | -2.75 | IV | hsa-miR-93 | 0.0014 | 4.36 |
| II | hsa-miR-885-3p | 0.0357 | -4.04 | II | hsa-miR-130b | 0.0073 | 8.77 |
| III | hsa-miR-885-3p | 0.0224 | -2.17 | III | hsa-miR-130b | 0.0009 | 4.50 |
| IV | hsa-miR-885-3p | 0.0256 | -2.68 | IV | hsa-miR-130b | 0.0475 | 4.39 |
| II | hsa-miR-572 | 0.0446 | -4.20 | II | hsa-miR-92b | 0.0156 | 5.30 |
| III | hsa-miR-572 | 0.0182 | -2.45 | III | hsa-miR-92b | 0.0011 | 6.83 |
| IV | hsa-miR-572 | 0.0270 | -2.41 | IV | hsa-miR-92b | 0.0004 | 14.04 |
| II | hsa-miR-2861 | 0.0040 | -2.97 | ||||
| III | hsa-miR-2861 | 0.0230 | -2.46 | ||||
| IV | hsa-miR-2861 | 0.0210 | -2.26 |
Figure 2.
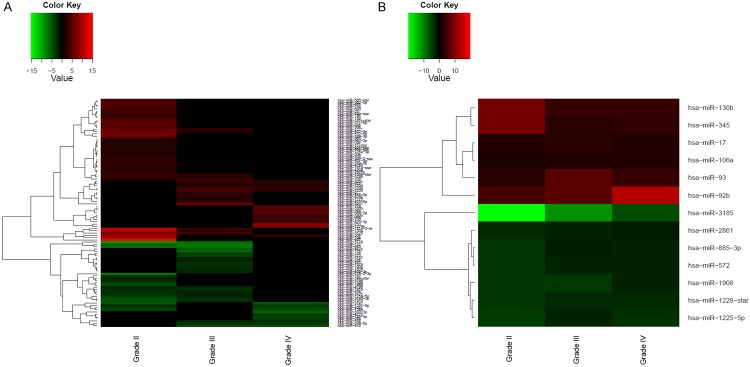
Heatmaps of the correlation between miRNA expression level and tumor grade. Unsupervised hierarchical clustering analysis grouped significantly expressed miRNAs in each astrocytoma grade based on fold change. (A) Differentially abundant miRNAs in each astrocytoma grade. (B) Dysregulated miRNAs common to all astrocytoma grades. A dual color-code was used: red: up-regulated miRNAs and green: down-regulated miRNAs.
Based on the P-values, fold changes and biological roles, some miRNAs were selected for validation using TaqMan-based real-time PCR (qPCR). Surprisingly, the qPCR results showed no significant miRNA expression differences neither for grades II (Figure 3A) nor for grade III (Figure 3B) astrocytomas compared with the other groups. However, the qPCR results showed significant differences in expression for miR-210 and miR-27a between astrocytoma grade IV relative to controls, grades II and III astrocytomas (Figure 3C), which corroborated the microRNA array findings. Although miR-193b showed a significant difference in expression between grade IV relative to grade II (**p < 0.01) and grade III (*p < 0.05) astrocytomas, there were no significant difference of miR-193b in astrocytoma grade IV compared with controls (Figure 3C) which suggest that this miR-193b is not a bona fide grade IV miRNA signature.
Figure 3.
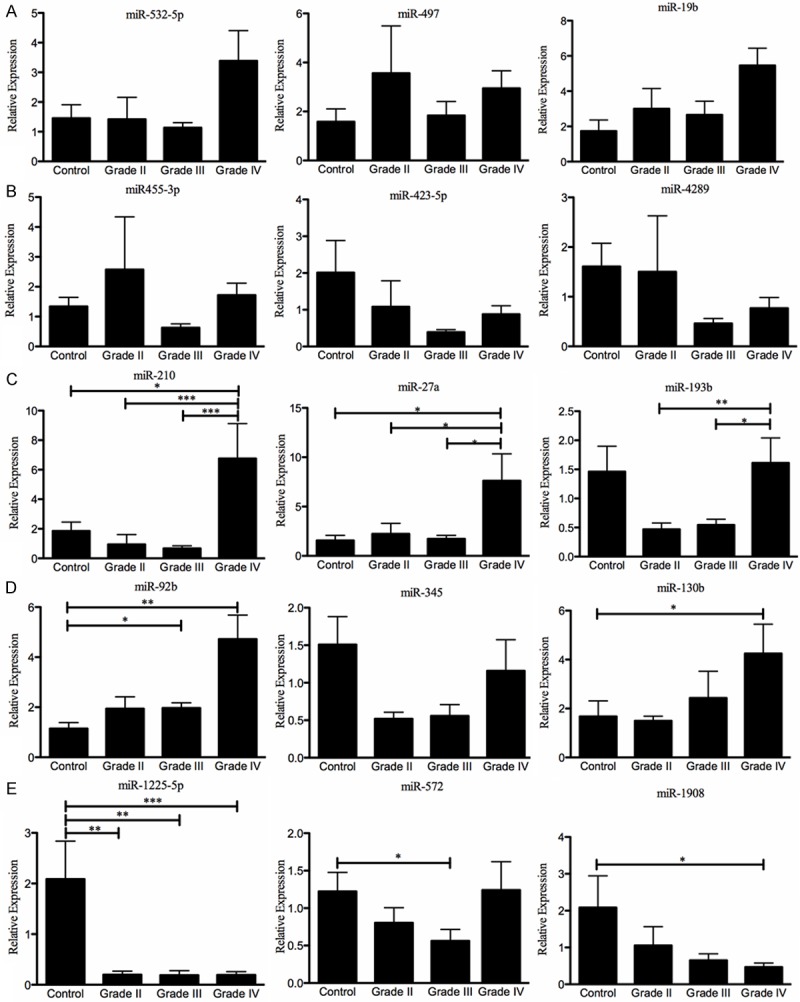
Real-time PCR validation of the highest differentially expressed miRNAs in each astrocytoma grade. Eight grade II, eight grade III, nineteen grade IV (GBM), and five non-neoplastic brain tissue samples were used in these experiments. RNU48 was used as an “endogenous control”. The miRNA expression level in each WHO grade II-IV FFPE tissue sample was calculated as described in the “Materials and Methods” section. (A) grade II, (B) grade III, (C) grade IV, (D) miRNAs up-regulated in all tumor grades and (E) miRNAs down-regulated in all tumor grades. *p < 0.05, **p < 0.01, and ***p < 0.001. Columns represent the mean of duplicates ± S.D.
The microarray results showed up-regulation of miR-92b, miR-345, and miR-130b-5p and down-regulation of miR-1908, miR-572, and miR-1225-5p in all astrocytoma grades (Table 2). The qPCR results confirmed the down-regulation of miR-1225-5p in all astrocytoma grades relative to controls (Figure 3E). On the other hand, up-regulation of miR-130b (*p < 0.05), and down-regulation of miR-1908 (*p < 0.05) were confirmed only for grade IV astrocytomas compared with control individuals (Figure 3D, 3E). Increased levels of miR-92b were significantly higher in grade III and IV astrocytomas relative to controls (Figure 3D). Decreased expression of miR-572 was confirmed for grade III astrocytoma relative to controls (Figure 3E). However, any of these miRNAs was able to discriminate between each astrocytoma grade. Finally, the miR-345 qPCR expression levels did not agree with those indicated by the microarray studies (Figure 3D and Table 2).
Target prediction and biological pathway analysis
A number of miRNA target prediction programs (microrna.org, Diana-microt, Target Scan Human, and miRDB) were used to identify potential target genes for each of the qPCR-validated miRNAs. Genes identified by at least three different programs were selected to construct pathway analysis using IPA (Figure 4). For this analysis, we focused on cancer-associated miRNA-regulated genes. Interestingly, miR-210 and miR-27a, which were increased in GBMs relative to grade II, grade III, and control individuals, regulate genes associated with GBM signaling (FOXO1, E2F3 and APC), molecular mechanism of cancer (SMAD4, SMAD5, SMAD3, NOTCH1, FADD, FOXO1, APC, and E2F3), and cell cycle G1/S checkpoint regulation (E2F3, SMAD3 and SMAD4) (Figure 4A). Equally, miR-92b and miR-130b, which were validated for grade IV astrocytomas, regulate genes that are involved in molecular mechanisms of cancer (BCL2L11, MAP2K4, RB1, TCF4, SMAD4 and E2F1), p53 signaling (RB1, E2F1, PTEN, and KAT2B), and in DNA damage response (E2F1 and RB1) (Figure 4B). Furthermore, miR-1225-5p, miR-572, and miR-1908, regulate genes involved in glioma signaling (IGF2, PRKCG, HRAS, CDKN2A, CDKN1A and RBL2), p53 signaling (MDM4, PRKCG, CDKN2A, CDKN1A and FAS), and molecular mechanisms of cancer (ARHGEF18, CDH1, CDKN1A, FAS, PRKCG, GNAI2, PRKDC, HRAS, CDKN2A and SUFU) (Figure 4C).
Figure 4.
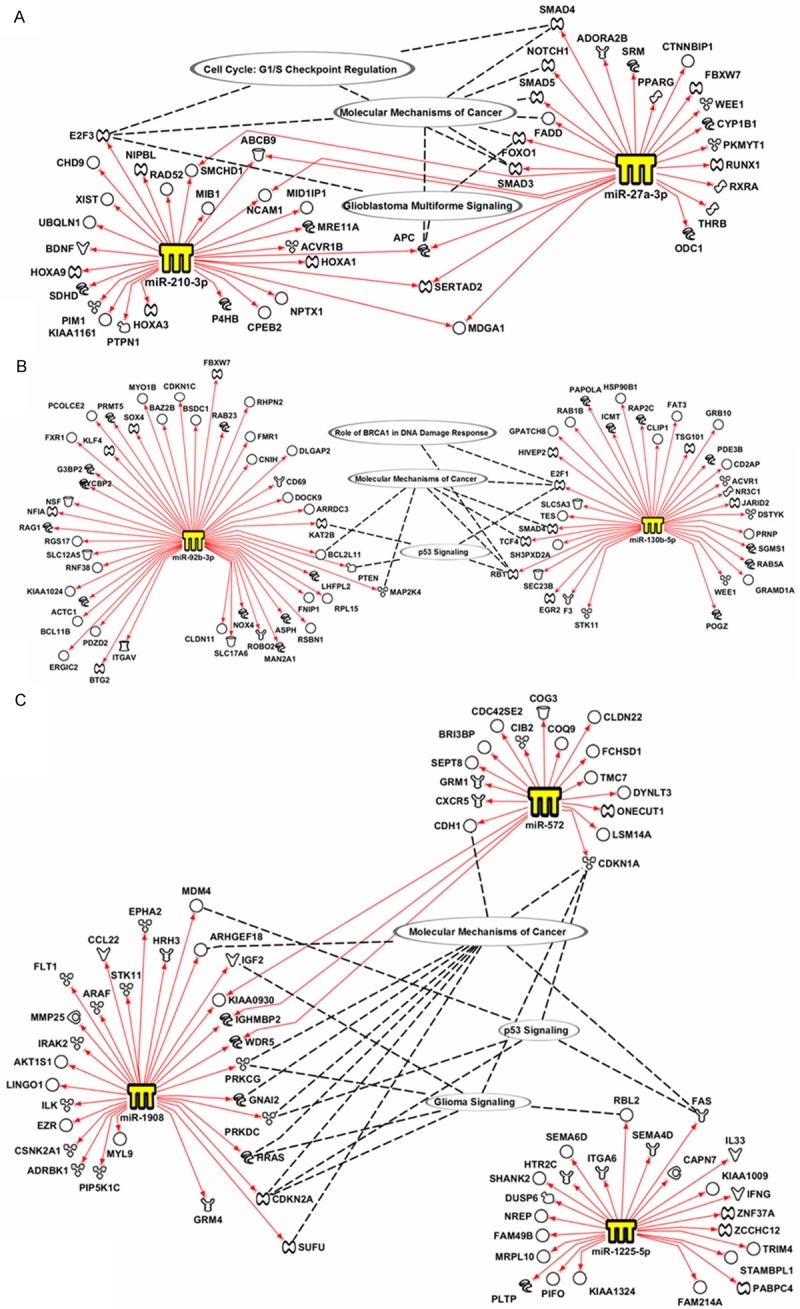
Network analysis of miRNA-regulated genes. miRDataBase, miRanda, and Diana Lab target prediction software were used to identify putative genes regulated by each miRNA. IPA was used to generate molecular networks for each miRNA and its target genes.
Kaplan-Meier survival analysis
To explore the potential clinical relevance of the qPCR-validated miRNAs, we asked whether their expression correlated with the prognosis of GBM patients. We found that the expression of miR-210, miR-92b, miR-130b, miR-1908 and miR-1225-5p did not correlate with the overall survival (OS) of GBM patients (data not shown). However, increased miR-27a expression was significantly associated with better overall survival (P = 0.0480) (Figure 5A). Interestingly, the qPCR results showed that miR-27a expression was also increased in FFPE GBM vs. paired adjacent non-neoplastic tissues (Figure 5B).
Figure 5.
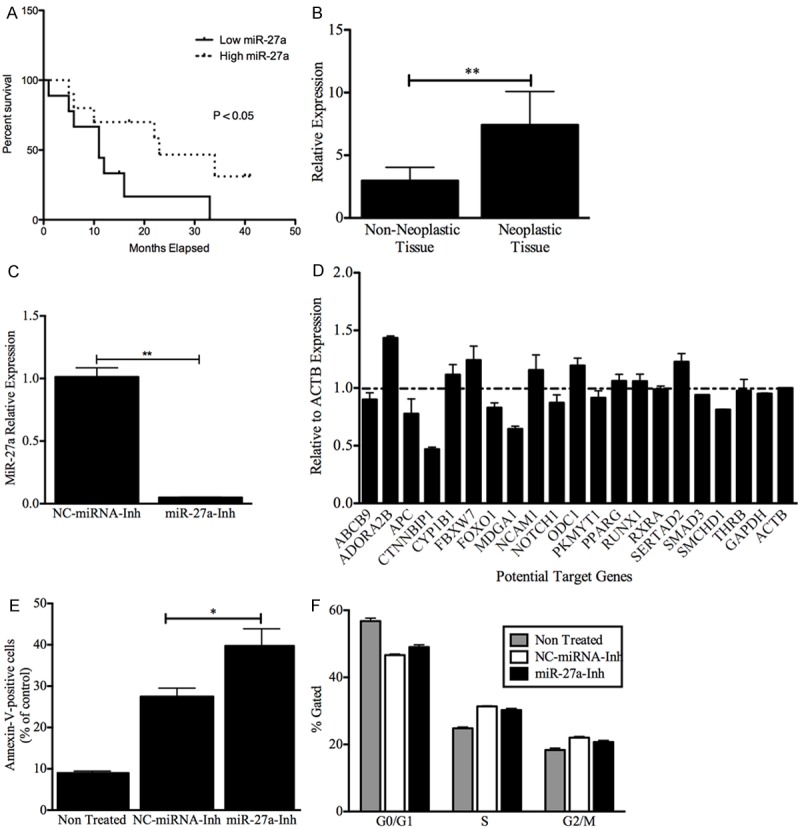
Clinical and Biological role of miR27a in GBMs. (A) Kaplan-Meier estimates of overall survival for GBM patients. GBM patients with a high miR-27a expression level have significantly better outcomes than do patients with a low miR-27a level. The expression level was categorized as low if the individual fold change of a GBM patient was under the median fold change for all GBM patients, and it was characterized as high if the individual fold change of a GBM patient was higher than the median fold change for all GBM patients. Low expression (9 patients), high expression (10 patients). (B) Non-neoplastic areas were collected from seven grade IV astrocytoma FFPE samples. RNA was isolated, and qPCR was performed as described in the “Materials and Methods” section. RNU48 was used as an “endogenous control”. MiRNA expression levels were calculated as described in the “Materials and Methods” section. **p < 0.01. Columns represent the mean of duplicates ± S.D. (C) CRL-1690 cells were transiently transfected with a miR-27a inhibitor or miRNA negative control inhibitor as described in the “Materials and Methods” section. Eight hours after transfection, cells were collected, total RNA was isolated, and RT-PCR was performed as described in the “Materials and Methods” section. The miR-27a levels significantly decreased compared with the negative control inhibitor. (D) CRL-1690 cells were transiently transfected with a miR-27a inhibitor or a miRNA negative control inhibitor. Twenty-four hours later, total RNA was isolated as described in the “Materials and Methods” section. SYBR Green I-based real-time PCR was performed, and changes in gene expression were calculated relative to the miRNA negative control using b-actin as an endogenous control. Columns represent the mean of duplicates ± S.D. (E) CRL-1690 cells were transfected as in C. Seventy-two hours after transfection the number of apoptotic cells were recorded as described in the “Materials and Methods” section. MiR-27a inhibition increases the number of apoptotic cells (*p < 0.05) compared with miRNA control inhibitor transfected cells. (F) CRL-1690 cells were transfected as in C. Forty-eight hours after transfection the number of cells in each phase of the cell cycle were recorded as described in the “Materials and Methods” section. MiR-27a inhibition did not induced significant changes in the cell cycle. *p < 0.05, **p < 0.01. Columns represent the mean of triplicates ± S.D.
Effect of miR-27a inhibition on miR-27a target genes
To further identify the miR-27a target genes in GBM cellls, we transiently transfected a miR-27a oligonulceotide inhibitor (miR-27a-Inh) or a negative control miRNA inhibitor (NC-miRNA-Inh) in the glioblastoma cell line CRL-1690. Transient transfection of CRL-1690 with the miR-27a-Inh reduced the miR-27a expression in more than 95% (**p < 0.01) compared with the NC-miRNA-Inh (Figure 5C). SYBR Green I-based real-time showed that transient transfection of miR-27a-Inh induced significant changes in the mRNA levels of some miR-27a-target genes (predicted by the in silico analysis) compared with NC-miRNA-Inh-transfected cells (Figure 5D). Table 3 summarizes the fold changes and biological role of the six potential miR-27a target genes whose mRNA levels increased following miR-27a down-regulation. Particularly, ADO-RA2B, an adenosine receptor that plays a central role in inflammation and cancer [28-30]. Multiple studies have demonstrated that adenosine generation and signaling via ADORA2B protects against ischemic injury in various organs [28]. Likewise, FBXW7, a member of the F-box family of proteins that mediate the ubiquitination and subsequent proteasomal degradation of different proteins, has been described as a tumor suppressor gene in a variety of cancer [31]. In addition, FBXW7 has been described to be essential for the ubiquitination of several oncoproteins including c-Myc, c-Jun, cyclin E1, and Notch [32-34]. Curiously, down-regulation of miR-27a reduced the expression of some putative miR-27a-target genes, including CTNNBIP1 (catenin, beta interacting protein 1), and MDGA1 (MAM domain containing glycosylphosphatidylinositol anchor 1) (Figure 5D).
Table 3.
Potential miR-27a Target Genes
| miR-27a Target | Gene Symbol | Fold Change | Biological role |
|---|---|---|---|
| Adenosine A2b Receptor | ADORA2B | 1.43 | Member of the G protein-coupled receptor superfamily involved in a variety of cancers [29,30]. ADORA2B, has been found up-regulated in colorectal carcinoma tissues and colon cancer cell lines [75]. |
| Cytochrome P450, Family 1, Subfamily B, | CYP1B1 | 1.12 | P450 enzyme involved in the metabolism of substances and plays a role in hormone-induced carcinogenesis [76]. CYP1B1 has been found to be up regulated in breast and endometrial cancer [77]. |
| F-Box And WD Repeat Domain Containing 7, E3 Ubiquitin Protein Ligase | FBXW7 | 1.24 | Member of the F-box family of proteins, mediator of the ubiquitination and subsequent proteasomal degradation of different proteins. FBXW7 has been described as a tumor suppressor gene in a variety of cancer [31]. |
| Neural Cell Adhesion Molecule 1 | NCAM 1 | 1.16 | Cell adhesion molecule detected in many neuroblastoma [78]. |
| Ornithine Decarboxylase 1 | ODC 1 | 1.19 | Enzyme involved in polyamine biosynthesis; associated with cell growth, angiogenesis, proliferation [79]. Increment in ODC activity represents a biological marker of malignancy in glioma [80]. |
| SERTA Domain Containing 2 | SERTAD2 | 1.23 | Nuclear factor implicated in cell cycle regulation [81]. It has been found that SERTAD2 plays important roles in governing cell cycle progression in Human osteosarcoma U2OS cells [81,82]. |
Effects of miR-27a inhibition on apoptosis and cell cycle progression
To better understand the role of miR-27a in GBM, we studied the biological effects of targeting miR-27a on apoptosis and cell cycle progression. Transient transfection of CRL-1690 cells with miR-27a-Inh induced 13% apoptosis (*p < 0.05) compared with NCmiRNA-Inh transfected cells (Figure 5E). However, miR-27a inhibition did not induce significant changes in cell cycle phases (Figure 5F). Together, these finding support the oncogenic role of miR-27a in GBM.
Discussion
The key finding of this study is that miR-210, miR-27a, and miR-1225-5p expression levels were able to differentiate grade IV from grade II and III astrocytomas. Moreover, increased expression of miR-130b, and miR-92b; and decreased expression of miR-1908 were highly associated with GBM. The role of some miRNAs in astrocytoma initiation and progression has been well studied [35-37]. In addition, some studies have used miRNA expression profiling to distinguish brain tumor subtypes according to their histology, malignant grade, and clinical features [6,7,21,38]. These studies have identified miRNAs that are differentially expressed in GBM patient samples compared with normal tissues [21,38,39], grade IV (GBM) vs. grade III astrocytoma [6] and grade III and IV cancer stem cell line populations vs. non-stem cells [12,40]. In this study, we identify additional miRNAs dysregulated in GBM compared with lower astrocytomas.
Although the microarray analysis showed that several miRNAs are differentially expressed in grade II or III astrocytoma, qPCR experiments could not validate the microarray data. qPCR detects differences in miRNA expression with superior sensitivity and specificity compared with large-scale screening techniques, including microarrays [41-43]. This evidence confirms previous reports indicating that microarray data should always be validated by other molecular techniques [44,45]. Nevertheless, in this study, only three up-regulated miRNAs per tumor grade were validated by qPCR. Future studies could assess the expression of other miRNAs in each astrocytoma grade. In addition, a higher number of samples are needed before proposing specific miRNAs as a signature for astrocytoma grading.
Our results suggest that GBM patients with high miR-27a expression levels have better outcome compared with GBM patients who have low miR-27a expression levels. Initially, this is a paradoxical observation, considering miR-27a as an oncomiR. Chin and co-workers found that low levels of the miR-34a tumor suppressor are a good prognostic factor for GBM patients [46]. Although increased levels of miR-27a promote tumor growth, GBM driven by miR-27a dysregulation pathways may be less aggressive than GBM where other molecular pathways are altered. It is possible that GBM patients with high miR-27a expression levels may respond better to certain chemotherapeutics agents.
The up-regulation of miR-27a has been implicated in a variety of malignancies, including acute lymphoblastic leukemia (ALL), acute myeloid leukemia (AML) [47], colorectal cancer (CRC) [48], prostate cancer [49] and breast cancer [50]. In glioblastoma cell lines, miR-27a antagonists reduce cell proliferation and invasion [51]. Recent reports have shown that miR-27a promotes cell proliferation in GBM cell lines by directly targeting MXI1, a member of the Mad (Mxi1) family that can form heterodimers with Max to function as an antagonist of the Myc oncoprotein [52,53]. Our study identified six potential miR-27a-target genes. Particularly, the FBXW7 and ADORA2B may be regulated by miR-27a in GBM patients. Interestingly, CTNNBIP1, and MDGA1 were decreased following miR-27a targeting. One possible explanation for this observation is that miR-27a stabilizes the mRNA of these genes, as occurred with other miRNAs [54,55]. Another possibility is that these two genes are transcriptionally regulated as a secondary effect of miR-27a down-regulation. All of these hypotheses should be further investigated.
Our functional studies showed activation of apoptosis but not significant changes in the cell cycle phases following miR-27a inhibition. These results suggest that the miR-27a-target genes could be more involved in cell death than in cell cycle control. Other studies have shown a reduction in cell proliferation and invasiveness potential for U87 GBM cells following miR-27a inhibition [51]. Taken together, these results suggest that miR-27a and its target genes promote cell survival of GBM cells.
The overexpression of miR-210 has been correlated with the late stages of non-small cell lung cancer (NSCLC) [56], triple-negative breast cancer [57], the hypoxic response [58], and pancreatic [58] and ovarian [59,60] cancer under hypoxic conditions. However, the biological and molecular consequences of miR-210 overexpression in GBM should be further investigated.
The microarray studies identified 13 miRNAs differentially abundant in all astrocytoma grades. qPCR validation of miR-92b, miR-1908, miR-130b, and miR-1225-5p showed that these miRNAs are differentially abundant only in GBM samples compared with controls. Earlier studies showed that miR-92b and miR-9/9* are overexpressed in primary brain tumors [61]. Recent studies have shown that miR-92b is up-regulated in GBM human samples and cell lines [11,62,63] and targeting miR-92b induced apoptosis and inhibited cell growth and glioma invasion in vitro and in vivo [11,62,64]. Wang et al. showed that these biological effects appear to be elicited through the miR-92b target gene Nemo-like kinase (NLK) and the Wnt/beta-catenin pathway [11]. However, Zhou and co-workers observed up-regulation of the TGF-beta/smad3/p21 signaling pathway after miR-92b inhibition in GBM cultured cells [62]. In contrast, Li et al. reported that the miR-92b inhibitory effects promote glioma cell apoptosis by targeting Dickkopf-3 gene (DKK3) and blocking the WNT/beta catenin signaling pathway [64]. In our in silico analysis, we identified other miR-92b target genes, including ASPHD2, BCL11B, CD69, CDKN1C, PRMT5, PTEN and RGS17. Some of these targets act as tumor suppressor genes and/or are related to cell proliferation, cell cycle control, epigenetics and signal transduction [65-68]. Together, our findings are in agreement with these studies, which indicate that miR-92b may be used as a target for glioma therapy [11,64].
Among the 13 miRNAs identified by microarrays in all astrocytoma grades, miR-17, miR-93, and miR-130b have been reported by other groups [69-71]. For example, Malzkorn et al. identified a miRNA signature that included the overexpression of miR-17 and miR-130b in patients with primary WHO grade II gliomas that spontaneously progressed to WHO grade II secondary GBM [69]. Subsequently, Jiao and co-workers showed that miR-17 expression was significantly higher in glioma tissues compared with normal tissues and that its expression was associated with poor overall survival for glioma patients [70]. Jiao and co-workers proposed that miR-17 has potential value as a poor prognosis predictor for glioma patients and miR-17 could contribute to tumor progression [70]. Fang et al. showed that miR-93 promotes angiogenesis and tumor growth in GBM by targeting integrin-β8 expression, suggesting that targeting miR-93 could suppress GBM tumor growth and angiogenesis [71]. The molecular consequences of miR-1908, miR-1225-5p, and miR-572 down-regulation in astrocytoma progression have not been studied. Interestingly, Sallustio et al. reported recently that miR-1915 and miR-1225-5p regulate the stemness and the repair capacity of adult renal progenitor cells [72].
Other studies have proposed the use of miRNA signatures to differentiate GBM from other tumors. For example, Ciafrè et al. reported the up-regulation of miR-221 and down-regulation of miR-128a, miR-181a, miR-181b and miR-181c in GBM compared with peripheral brain areas from the same patient [21]. Chan et al. found overexpression of the miR-21 level in human glioblastoma tumor tissues in six well-established glioblastoma cell lines and early-passage glioblastoma cultures [38]. Malzkorn et al. identified 12 miRNAs that have increased expression and two miRNAs with reduced expression in WHO grade II gliomas that spontaneously progressed to GBM [69]. In addition, the Progetto Emiliano-Romagnolo di Neuro-Oncologia (PERNO) project has identified a number of miRNAs characteristic of glioblastoma (including miR-27a) [73]. PERNO studies have also shown that different miRNA expression patterns are obtained depending on the non-neoplastic controls used as reference [74]. We observed that miR-27a was also up-regulated in FFPE GBM vs. paired adjacent non-neoplastic tissues, which suggests that miR-27a is a potential diagnostic and prognostic molecular marker for GBM and a therapeutic target. Together, our panel of miRNAs, as well as the previously reported miRNAs, may be miRNA signatures for GBM.
Overall, our results demonstrate that a miRNA signature distinguishes GBM from grade II and III astrocytoma and provide further evidence of other miRNAs that have not been previously associated with brain tumors may play an important role in astrocytoma progression. Finally, some of these miRNAs may be considered potential molecular targets for astrocytoma treatment, particularly for GBM.
Acknowledgements
We wish to thank Carlos Torres-Cintrón from the Puerto Rico Cancer Registry for the demographic and clinical information of the patient samples. This project was partially supported by institutional seed funds from the University of Puerto Rico Comprehensive Cancer Center (PEVM), PRCTRC (NCRR: U54 RR 026139-01A1 and NIMHD: 8U54 MD 007587-03), Minority Biomedical Research Support (MBRS) RISE Program R25-GM061838 (MRD), RCMI: UPRMSC (G12RR03051). Infrastructure support: RCMI: NCRR (2G12-RR003051) and NIMHD (8G12-MD007600) from the NIH. HOZ received partial support from Puerto Rico INBRE (NIGMS P20GM103475) and the UPR/MDACC Partnership for Excellence in Cancer Research (NCI U54CA096297) from the National Institutes of Health.
Disclosure of conflict of interest
None to declare.
References
- 1.Furnari FB, Fenton T, Bachoo RM, Mukasa A, Stommel JM, Stegh A, Hahn WC, Ligon KL, Louis DN, Brennan C, Chin L, DePinho RA, Cavenee WK. Malignant astrocytic glioma: genetics, biology, and paths to treatment. Genes Dev. 2007;21:2683–2710. doi: 10.1101/gad.1596707. [DOI] [PubMed] [Google Scholar]
- 2.Shugg D, Allen BJ, Blizzard L, Dwyer T, Roder D. Brain cancer incidence, mortality and case survival: observations from two Australian cancer registries. Int J Cancer. 1994;59:765–770. doi: 10.1002/ijc.2910590610. [DOI] [PubMed] [Google Scholar]
- 3.Kleihues P, Burger PC, Scheithauer BW. The new WHO classification of brain tumours. Brain Pathol. 1993;3:255–268. doi: 10.1111/j.1750-3639.1993.tb00752.x. [DOI] [PubMed] [Google Scholar]
- 4.Bartel DP. MicroRNAs: genomics, biogenesis, mechanism, and function. Cell. 2004;116:281–297. doi: 10.1016/s0092-8674(04)00045-5. [DOI] [PubMed] [Google Scholar]
- 5.Liu X, Fortin K, Mourelatos Z. MicroRNAs: biogenesis and molecular functions. Brain Pathol. 2008;18:113–121. doi: 10.1111/j.1750-3639.2007.00121.x. [DOI] [PMC free article] [PubMed] [Google Scholar]
- 6.Rao SA, Santosh V, Somasundaram K. Genome-wide expression profiling identifies deregulated miRNAs in malignant astrocytoma. Mod Pathol. 2010;23:1404–1417. doi: 10.1038/modpathol.2010.135. [DOI] [PubMed] [Google Scholar]
- 7.Reddy SP, Britto R, Vinnakota K, Aparna H, Sreepathi HK, Thota B, Kumari A, Shilpa BM, Vrinda M, Umesh S, Samuel C, Shetty M, Tandon A, Pandey P, Hegde S, Hegde AS, Balasubramaniam A, Chandramouli BA, Santosh V, Kondaiah P, Somasundaram K, Rao MR. Novel glioblastoma markers with diagnostic and prognostic value identified through transcriptome analysis. Clin Cancer Res. 2008;14:2978–2987. doi: 10.1158/1078-0432.CCR-07-4821. [DOI] [PubMed] [Google Scholar]
- 8.Lu J, Getz G, Miska EA, Alvarez-Saavedra E, Lamb J, Peck D, Sweet-Cordero A, Ebert BL, Mak RH, Ferrando AA, Downing JR, Jacks T, Horvitz HR, Golub TR. MicroRNA expression profiles classify human cancers. Nature. 2005;435:834–838. doi: 10.1038/nature03702. [DOI] [PubMed] [Google Scholar]
- 9.Srinivasan S, Patric IR, Somasundaram K. A ten-microRNA expression signature predicts survival in glioblastoma. PLoS One. 2011;6:e17438. doi: 10.1371/journal.pone.0017438. [DOI] [PMC free article] [PubMed] [Google Scholar]
- 10.Asuthkar S, Velpula KK, Chetty C, Gorantla B, Rao JS. Epigenetic regulation of miRNA-211 by MMP-9 governs glioma cell apoptosis, chemosensitivity and radiosensitivity. Oncotarget. 2012;3:1439–1454. doi: 10.18632/oncotarget.683. [DOI] [PMC free article] [PubMed] [Google Scholar]
- 11.Wang K, Wang X, Zou J, Zhang A, Wan Y, Pu P, Song Z, Qian C, Chen Y, Yang S, Wang Y. miR-92b controls glioma proliferation and invasion through regulating Wnt/beta-catenin signaling via Nemo-like kinase. Neuro Oncol. 2013;15:578–588. doi: 10.1093/neuonc/not004. [DOI] [PMC free article] [PubMed] [Google Scholar]
- 12.Silber J, Lim DA, Petritsch C, Persson AI, Maunakea AK, Yu M, Vandenberg SR, Ginzinger DG, James CD, Costello JF, Bergers G, Weiss WA, Alvarez-Buylla A, Hodgson JG. miR-124 and miR-137 inhibit proliferation of glioblastoma multiforme cells and induce differentiation of brain tumor stem cells. BMC Med. 2008;6:14. doi: 10.1186/1741-7015-6-14. [DOI] [PMC free article] [PubMed] [Google Scholar]
- 13.Tezcan G, Tunca B, Bekar A, Preusser M, Berghoff AS, Egeli U, Cecener G, Ricken G, Budak F, Taskapilioglu MO, Kocaeli H, Tolunay S. microRNA expression pattern modulates temozolomide response in GBM tumors with cancer stem cells. Cell Mol Neurobiol. 2014;34:679–692. doi: 10.1007/s10571-014-0050-0. [DOI] [PMC free article] [PubMed] [Google Scholar]
- 14.Wang YY, Sun G, Luo H, Wang XF, Lan FM, Yue X, Fu LS, Pu PY, Kang CS, Liu N, You YP. MiR-21 modulates hTERT through a STAT3-dependent manner on glioblastoma cell growth. CNS Neurosci Ther. 2012;18:722–728. doi: 10.1111/j.1755-5949.2012.00349.x. [DOI] [PMC free article] [PubMed] [Google Scholar]
- 15.Lakomy R, Sana J, Hankeova S, Fadrus P, Kren L, Lzicarova E, Svoboda M, Dolezelova H, Smrcka M, Vyzula R, Michalek J, Hajduch M, Slaby O. MiR-195, miR-196b, miR-181c, miR-21 expression levels and O-6-methylguanine-DNA methyltransferase methylation status are associated with clinical outcome in glioblastoma patients. Cancer Sci. 2011;102:2186–2190. doi: 10.1111/j.1349-7006.2011.02092.x. [DOI] [PMC free article] [PubMed] [Google Scholar]
- 16.Zhou X, Ren Y, Moore L, Mei M, You Y, Xu P, Wang B, Wang G, Jia Z, Pu P, Zhang W, Kang C. Downregulation of miR-21 inhibits EGFR pathway and suppresses the growth of human glioblastoma cells independent of PTEN status. Lab Invest. 2010;90:144–155. doi: 10.1038/labinvest.2009.126. [DOI] [PubMed] [Google Scholar]
- 17.Xiao B, Tan L, He B, Liu Z, Xu R. MiRNA-329 targeting E2F1 inhibits cell proliferation in glioma cells. J Transl Med. 2013;11:172. doi: 10.1186/1479-5876-11-172. [DOI] [PMC free article] [PubMed] [Google Scholar]
- 18.Tezcan G, Tunca B, Bekar A, Budak F, Sahin S, Cecener G, Egeli U, Taskapilioglu MO, Kocaeli H, Tolunay S, Malyer H, Demir C, Tumen G. Olea europaea leaf extract improves the treatment response of GBM stem cells by modulating miRNA expression. Am J Cancer Res. 2014;4:572–590. [PMC free article] [PubMed] [Google Scholar]
- 19.Rathod SS, Rani SB, Khan M, Muzumdar D, Shiras A. Tumor suppressive miRNA-34a suppresses cell proliferation and tumor growth of glioma stem cells by targeting Akt and Wnt signaling pathways. FEBS Open Bio. 2014;4:485–495. doi: 10.1016/j.fob.2014.05.002. [DOI] [PMC free article] [PubMed] [Google Scholar]
- 20.Manterola L, Guruceaga E, Gallego Perez-Larraya J, Gonzalez-Huarriz M, Jauregui P, Tejada S, Diez-Valle R, Segura V, Sampron N, Barrena C, Ruiz I, Agirre A, Ayuso A, Rodriguez J, Gonzalez A, Xipell E, Matheu A, Lopez de Munain A, Tunon T, Zazpe I, Garcia-Foncillas J, Paris S, Delattre JY, Alonso MM. A small noncoding RNA signature found in exosomes of GBM patient serum as a diagnostic tool. Neuro Oncol. 2014;16:520–527. doi: 10.1093/neuonc/not218. [DOI] [PMC free article] [PubMed] [Google Scholar]
- 21.Ciafre SA, Galardi S, Mangiola A, Ferracin M, Liu CG, Sabatino G, Negrini M, Maira G, Croce CM, Farace MG. Extensive modulation of a set of microRNAs in primary glioblastoma. Biochem Biophys Res Commun. 2005;334:1351–1358. doi: 10.1016/j.bbrc.2005.07.030. [DOI] [PubMed] [Google Scholar]
- 22.Conti A, Aguennouz M, La Torre D, Tomasello C, Cardali S, Angileri FF, Maio F, Cama A, Germano A, Vita G, Tomasello F. miR-21 and 221 upregulation and miR-181b downregulation in human grade II-IV astrocytic tumors. J Neurooncol. 2009;93:325–332. doi: 10.1007/s11060-009-9797-4. [DOI] [PubMed] [Google Scholar]
- 23.Vargas IM, Vivas-Mejia PE. Assessment of mRNA splice variants by qRT-PCR. Methods Mol Biol. 2013;1049:171–186. doi: 10.1007/978-1-62703-547-7_13. [DOI] [PMC free article] [PubMed] [Google Scholar]
- 24.Livak KJ, Schmittgen TD. Analysis of relative gene expression data using real-time quantitative PCR and the 2(-Delta Delta C(T)) Method. Methods. 2001;25:402–408. doi: 10.1006/meth.2001.1262. [DOI] [PubMed] [Google Scholar]
- 25.Gee HE, Buffa FM, Camps C, Ramachandran A, Leek R, Taylor M, Patil M, Sheldon H, Betts G, Homer J, West C, Ragoussis J, Harris AL. The small-nucleolar RNAs commonly used for microRNA normalisation correlate with tumour pathology and prognosis. Br J Cancer. 2011;104:1168–1177. doi: 10.1038/sj.bjc.6606076. [DOI] [PMC free article] [PubMed] [Google Scholar]
- 26.Mestdagh P, Van Vlierberghe P, De Weer A, Muth D, Westermann F, Speleman F, Vandesompele J. A novel and universal method for microRNA RT-qPCR data normalization. Genome Biol. 2009;10:R64. doi: 10.1186/gb-2009-10-6-r64. [DOI] [PMC free article] [PubMed] [Google Scholar]
- 27.Echevarria-Vargas IM, Valiyeva F, Vivas-Mejia PE. Upregulation of miR-21 in Cisplatin Resistant Ovarian Cancer via JNK-1/c-Jun Pathway. PLoS One. 2014;9:e97094. doi: 10.1371/journal.pone.0097094. [DOI] [PMC free article] [PubMed] [Google Scholar]
- 28.Grenz A, Homann D, Eltzschig HK. Extracellular adenosine: a safety signal that dampens hypoxia-induced inflammation during ischemia. Antioxid Redox Signal. 2011;15:2221–2234. doi: 10.1089/ars.2010.3665. [DOI] [PMC free article] [PubMed] [Google Scholar]
- 29.McCarthy N. Metastasis: ADORA(2B)tion. Nat Rev Cancer. 2013;13:294–295. doi: 10.1038/nrc3508. [DOI] [PubMed] [Google Scholar]
- 30.Desmet CJ, Gallenne T, Prieur A, Reyal F, Visser NL, Wittner BS, Smit MA, Geiger TR, Laoukili J, Iskit S, Rodenko B, Zwart W, Evers B, Horlings H, Ajouaou A, Zevenhoven J, van Vliet M, Ramaswamy S, Wessels LF, Peeper DS. Identification of a pharmacologically tractable Fra-1/ADORA2B axis promoting breast cancer metastasis. Proc Natl Acad Sci U S A. 2013;110:5139–5144. doi: 10.1073/pnas.1222085110. [DOI] [PMC free article] [PubMed] [Google Scholar]
- 31.Akhoondi S, Sun D, von der Lehr N, Apostolidou S, Klotz K, Maljukova A, Cepeda D, Fiegl H, Dafou D, Marth C, Mueller-Holzner E, Corcoran M, Dagnell M, Nejad SZ, Nayer BN, Zali MR, Hansson J, Egyhazi S, Petersson F, Sangfelt P, Nordgren H, Grander D, Reed SI, Widschwendter M, Sangfelt O, Spruck C. FBXW7/hCDC4 is a general tumor suppressor in human cancer. Cancer Res. 2007;67:9006–9012. doi: 10.1158/0008-5472.CAN-07-1320. [DOI] [PubMed] [Google Scholar]
- 32.Minella AC, Clurman BE. Mechanisms of tumor suppression by the SCF (Fbw7) Cell Cycle. 2005;4:1356–1359. doi: 10.4161/cc.4.10.2058. [DOI] [PubMed] [Google Scholar]
- 33.Koepp DM, Schaefer LK, Ye X, Keyomarsi K, Chu C, Harper JW, Elledge SJ. Phosphorylation-dependent ubiquitination of cyclin E by the SCFFbw7 ubiquitin ligase. Science. 2001;294:173–177. doi: 10.1126/science.1065203. [DOI] [PubMed] [Google Scholar]
- 34.Welcker M, Orian A, Jin J, Grim JE, Harper JW, Eisenman RN, Clurman BE. The Fbw7 tumor suppressor regulates glycogen synthase kinase 3 phosphorylation-dependent c-Myc protein degradation. Proc Natl Acad Sci U S A. 2004;101:9085–9090. doi: 10.1073/pnas.0402770101. [DOI] [PMC free article] [PubMed] [Google Scholar]
- 35.Xiao Y, Ping Y, Fan H, Xu C, Guan J, Zhao H, Li Y, Lv Y, Jin Y, Wang L, Li X. Identifying dysfunctional miRNA-mRNA regulatory modules by inverse activation, cofunction, and high interconnection of target genes: a case study of glioblastoma. Neuro Oncol. 2013;15:818–828. doi: 10.1093/neuonc/not018. [DOI] [PMC free article] [PubMed] [Google Scholar]
- 36.Wiedemeyer R, Brennan C, Heffernan TP, Xiao Y, Mahoney J, Protopopov A, Zheng H, Bignell G, Furnari F, Cavenee WK, Hahn WC, Ichimura K, Collins VP, Chu GC, Stratton MR, Ligon KL, Futreal PA, Chin L. Feedback circuit among INK4 tumor suppressors constrains human glioblastoma development. Cancer Cell. 2008;13:355–364. doi: 10.1016/j.ccr.2008.02.010. [DOI] [PMC free article] [PubMed] [Google Scholar]
- 37.Dong L, Li Y, Han C, Wang X, She L, Zhang H. miRNA microarray reveals specific expression in the peripheral blood of glioblastoma patients. Int J Oncol. 2014;45:746–756. doi: 10.3892/ijo.2014.2459. [DOI] [PubMed] [Google Scholar]
- 38.Chan JA, Krichevsky AM, Kosik KS. MicroRNA-21 is an antiapoptotic factor in human glioblastoma cells. Cancer Res. 2005;65:6029–6033. doi: 10.1158/0008-5472.CAN-05-0137. [DOI] [PubMed] [Google Scholar]
- 39.Godlewski J, Nowicki MO, Bronisz A, Williams S, Otsuki A, Nuovo G, Raychaudhury A, Newton HB, Chiocca EA, Lawler S. Targeting of the Bmi-1 oncogene/stem cell renewal factor by microRNA-128 inhibits glioma proliferation and self-renewal. Cancer Res. 2008;68:9125–9130. doi: 10.1158/0008-5472.CAN-08-2629. [DOI] [PubMed] [Google Scholar]
- 40.Gal H, Pandi G, Kanner AA, Ram Z, Lithwick-Yanai G, Amariglio N, Rechavi G, Givol D. MIR-451 and Imatinib mesylate inhibit tumor growth of Glioblastoma stem cells. Biochem Biophys Res Commun. 2008;376:86–90. doi: 10.1016/j.bbrc.2008.08.107. [DOI] [PubMed] [Google Scholar]
- 41.Arya M, Shergill IS, Williamson M, Gommersall L, Arya N, Patel HR. Basic principles of real-time quantitative PCR. Expert Rev Mol Diagn. 2005;5:209–219. doi: 10.1586/14737159.5.2.209. [DOI] [PubMed] [Google Scholar]
- 42.Wong ML, Medrano JF. Real-time PCR for mRNA quantitation. Biotechniques. 2005;39:75–85. doi: 10.2144/05391RV01. [DOI] [PubMed] [Google Scholar]
- 43.Wilhelm J, Pingoud A. Real-time polymerase chain reaction. Chembiochem. 2003;4:1120–1128. doi: 10.1002/cbic.200300662. [DOI] [PubMed] [Google Scholar]
- 44.Chuaqui RF, Bonner RF, Best CJ, Gillespie JW, Flaig MJ, Hewitt SM, Phillips JL, Krizman DB, Tangrea MA, Ahram M, Linehan WM, Knezevic V, Emmert-Buck MR. Post-analysis follow-up and validation of microarray experiments. Nat Genet. 2002;32(Suppl):509–514. doi: 10.1038/ng1034. [DOI] [PubMed] [Google Scholar]
- 45.Miron M, Woody OZ, Marcil A, Murie C, Sladek R, Nadon R. A methodology for global validation of microarray experiments. BMC Bioinformatics. 2006;7:333. doi: 10.1186/1471-2105-7-333. [DOI] [PMC free article] [PubMed] [Google Scholar]
- 46.Genovese G, Ergun A, Shukla SA, Campos B, Hanna J, Ghosh P, Quayle SN, Rai K, Colla S, Ying H, Wu CJ, Sarkar S, Xiao Y, Zhang J, Zhang H, Kwong L, Dunn K, Wiedemeyer WR, Brennan C, Zheng H, Rimm DL, Collins JJ, Chin L. microRNA regulatory network inference identifies miR-34a as a novel regulator of TGF-beta signaling in glioblastoma. Cancer Discov. 2012;2:736–749. doi: 10.1158/2159-8290.CD-12-0111. [DOI] [PMC free article] [PubMed] [Google Scholar]
- 47.Mi S, Lu J, Sun M, Li Z, Zhang H, Neilly MB, Wang Y, Qian Z, Jin J, Zhang Y, Bohlander SK, Le Beau MM, Larson RA, Golub TR, Rowley JD, Chen J. MicroRNA expression signatures accurately discriminate acute lymphoblastic leukemia from acute myeloid leukemia. Proc Natl Acad Sci U S A. 2007;104:19971–19976. doi: 10.1073/pnas.0709313104. [DOI] [PMC free article] [PubMed] [Google Scholar]
- 48.Xi Y, Shalgi R, Fodstad O, Pilpel Y, Ju J. Differentially regulated micro-RNAs and actively translated messenger RNA transcripts by tumor suppressor p53 in colon cancer. Clin Cancer Res. 2006;12:2014–2024. doi: 10.1158/1078-0432.CCR-05-1853. [DOI] [PubMed] [Google Scholar]
- 49.Fletcher CE, Dart DA, Sita-Lumsden A, Cheng H, Rennie PS, Bevan CL. Androgen-regulated processing of the oncomir miR-27a, which targets Prohibitin in prostate cancer. Hum Mol Genet. 2012;21:3112–3127. doi: 10.1093/hmg/dds139. [DOI] [PubMed] [Google Scholar]
- 50.Guttilla IK, White BA. Coordinate regulation of FOXO1 by miR-27a, miR-96, and miR-182 in breast cancer cells. J Biol Chem. 2009;284:23204–23216. doi: 10.1074/jbc.M109.031427. [DOI] [PMC free article] [PubMed] [Google Scholar]
- 51.Ge YF, Sun J, Jin CJ, Cao BQ, Jiang ZF, Shao JF. AntagomiR-27a targets FOXO3a in glioblastoma and suppresses U87 cell growth in vitro and in vivo. Asian Pac J Cancer Prev. 2013;14:963–968. doi: 10.7314/apjcp.2013.14.2.963. [DOI] [PubMed] [Google Scholar]
- 52.Xu W, Liu M, Peng X, Zhou P, Zhou J, Xu K, Xu H, Jiang S. miR-24-3p and miR-27a-3p promote cell proliferation in glioma cells via cooperative regulation of MXI1. Int J Oncol. 2013;42:757–766. doi: 10.3892/ijo.2012.1742. [DOI] [PubMed] [Google Scholar]
- 53.Swartling FJ. Myc proteins in brain tumor development and maintenance. Ups J Med Sci. 2012;117:122–131. doi: 10.3109/03009734.2012.658975. [DOI] [PMC free article] [PubMed] [Google Scholar]
- 54.Ma F, Liu X, Li D, Wang P, Li N, Lu L, Cao X. MicroRNA-466l upregulates IL-10 expression in TLR-triggered macrophages by antagonizing RNA-binding protein tristetraprolin-mediated IL-10 mRNA degradation. J Immunol. 2010;184:6053–6059. doi: 10.4049/jimmunol.0902308. [DOI] [PubMed] [Google Scholar]
- 55.Murphy AJ, Guyre PM, Pioli PA. Estradiol suppresses NF-kappa B activation through coordinated regulation of let-7a and miR-125b in primary human macrophages. J Immunol. 2010;184:5029–5037. doi: 10.4049/jimmunol.0903463. [DOI] [PMC free article] [PubMed] [Google Scholar]
- 56.Puissegur MP, Mazure NM, Bertero T, Pradelli L, Grosso S, Robbe-Sermesant K, Maurin T, Lebrigand K, Cardinaud B, Hofman V, Fourre S, Magnone V, Ricci JE, Pouyssegur J, Gounon P, Hofman P, Barbry P, Mari B. miR-210 is overexpressed in late stages of lung cancer and mediates mitochondrial alterations associated with modulation of HIF-1 activity. Cell Death Differ. 2011;18:465–478. doi: 10.1038/cdd.2010.119. [DOI] [PMC free article] [PubMed] [Google Scholar]
- 57.Radojicic J, Zaravinos A, Vrekoussis T, Kafousi M, Spandidos DA, Stathopoulos EN. MicroRNA expression analysis in triple-negative (ER, PR and Her2/neu) breast cancer. Cell Cycle. 2011;10:507–517. doi: 10.4161/cc.10.3.14754. [DOI] [PubMed] [Google Scholar]
- 58.Fasanaro P, D’Alessandra Y, Di Stefano V, Melchionna R, Romani S, Pompilio G, Capogrossi MC, Martelli F. MicroRNA-210 modulates endothelial cell response to hypoxia and inhibits the receptor tyrosine kinase ligand Ephrin-A3. J Biol Chem. 2008;283:15878–15883. doi: 10.1074/jbc.M800731200. [DOI] [PMC free article] [PubMed] [Google Scholar]
- 59.Chen WY, Liu WJ, Zhao YP, Zhou L, Zhang TP, Chen G, Shu H. Induction, modulation and potential targets of miR-210 in pancreatic cancer cells. Hepatobiliary Pancreat Dis Int. 2012;11:319–324. doi: 10.1016/s1499-3872(12)60168-4. [DOI] [PubMed] [Google Scholar]
- 60.Liu T, Zhao L, Chen W, Li Z, Hou H, Ding L, Li X. Inactivation of von Hippel-Lindau increases ovarian cancer cell aggressiveness through the HIF1alpha/miR-210/VMP1 signaling pathway. Int J Mol Med. 2014;33:1236–1242. doi: 10.3892/ijmm.2014.1661. [DOI] [PubMed] [Google Scholar]
- 61.Nass D, Rosenwald S, Meiri E, Gilad S, Tabibian-Keissar H, Schlosberg A, Kuker H, Sion-Vardy N, Tobar A, Kharenko O, Sitbon E, Lithwick Yanai G, Elyakim E, Cholakh H, Gibori H, Spector Y, Bentwich Z, Barshack I, Rosenfeld N. MiR-92b and miR-9/9* are specifically expressed in brain primary tumors and can be used to differentiate primary from metastatic brain tumors. Brain Pathol. 2009;19:375–383. doi: 10.1111/j.1750-3639.2008.00184.x. [DOI] [PMC free article] [PubMed] [Google Scholar]
- 62.Wu ZB, Cai L, Lin SJ, Lu JL, Yao Y, Zhou LF. The miR-92b functions as a potential oncogene by targeting on Smad3 in glioblastomas. Brain Res. 2013;1529:16–25. doi: 10.1016/j.brainres.2013.07.031. [DOI] [PubMed] [Google Scholar]
- 63.Hua D, Mo F, Ding D, Li L, Han X, Zhao N, Foltz G, Lin B, Lan Q, Huang Q. A catalogue of glioblastoma and brain MicroRNAs identified by deep sequencing. OMICS. 2012;16:690–699. doi: 10.1089/omi.2012.0069. [DOI] [PMC free article] [PubMed] [Google Scholar]
- 64.Li Q, Shen K, Zhao Y, Ma C, Liu J, Ma J. MiR-92b inhibitor promoted glioma cell apoptosis via targeting DKK3 and blocking the Wnt/beta-catenin signaling pathway. J Transl Med. 2013;11:302. doi: 10.1186/1479-5876-11-302. [DOI] [PMC free article] [PubMed] [Google Scholar]
- 65.Li J, Yen C, Liaw D, Podsypanina K, Bose S, Wang SI, Puc J, Miliaresis C, Rodgers L, McCombie R, Bigner SH, Giovanella BC, Ittmann M, Tycko B, Hibshoosh H, Wigler MH, Parsons R. PTEN, a putative protein tyrosine phosphatase gene mutated in human brain, breast, and prostate cancer. Science. 1997;275:1943–1947. doi: 10.1126/science.275.5308.1943. [DOI] [PubMed] [Google Scholar]
- 66.Gutierrez A, Kentsis A, Sanda T, Holmfeldt L, Chen SC, Zhang J, Protopopov A, Chin L, Dahlberg SE, Neuberg DS, Silverman LB, Winter SS, Hunger SP, Sallan SE, Zha S, Alt FW, Downing JR, Mullighan CG, Look AT. The BCL11B tumor suppressor is mutated across the major molecular subtypes of T-cell acute lymphoblastic leukemia. Blood. 2011;118:4169–4173. doi: 10.1182/blood-2010-11-318873. [DOI] [PMC free article] [PubMed] [Google Scholar]
- 67.Larson PS, Schlechter BL, King CL, Yang Q, Glass CN, Mack C, Pistey R, de Las Morenas A, Rosenberg CL. CDKN1C/p57kip2 is a candidate tumor suppressor gene in human breast cancer. BMC Cancer. 2008;8:68. doi: 10.1186/1471-2407-8-68. [DOI] [PMC free article] [PubMed] [Google Scholar]
- 68.Scoumanne A, Zhang J, Chen X. PRMT5 is required for cell-cycle progression and p53 tumor suppressor function. Nucleic Acids Res. 2009;37:4965–4976. doi: 10.1093/nar/gkp516. [DOI] [PMC free article] [PubMed] [Google Scholar]
- 69.Malzkorn B, Wolter M, Liesenberg F, Grzendowski M, Stuhler K, Meyer HE, Reifenberger G. Identification and functional characterization of microRNAs involved in the malignant progression of gliomas. Brain Pathol. 2010;20:539–550. doi: 10.1111/j.1750-3639.2009.00328.x. [DOI] [PMC free article] [PubMed] [Google Scholar]
- 70.Lu S, Wang S, Geng S, Ma S, Liang Z, Jiao B. Increased expression of microRNA-17 predicts poor prognosis in human glioma. J Biomed Biotechnol. 2012;2012:970761. doi: 10.1155/2012/970761. [DOI] [PMC free article] [PubMed] [Google Scholar]
- 71.Fang L, Deng Z, Shatseva T, Yang J, Peng C, Du WW, Yee AJ, Ang LC, He C, Shan SW, Yang BB. MicroRNA miR-93 promotes tumor growth and angiogenesis by targeting integrin-beta8. Oncogene. 2011;30:806–821. doi: 10.1038/onc.2010.465. [DOI] [PubMed] [Google Scholar]
- 72.Sallustio F, Serino G, Costantino V, Curci C, Cox SN, De Palma G, Schena FP. miR-1915 and miR-1225-5p regulate the expression of CD133, PAX2 and TLR2 in adult renal progenitor cells. PLoS One. 2013;8:e68296. doi: 10.1371/journal.pone.0068296. [DOI] [PMC free article] [PubMed] [Google Scholar]
- 73.Visani M, de Biase D, Marucci G, Cerasoli S, Nigrisoli E, Bacchi Reggiani ML, Albani F, Baruzzi A, Pession A. Expression of 19 microRNAs in glioblastoma and comparison with other brain neoplasia of grades I-III. Mol Oncol. 2014;8:417–430. doi: 10.1016/j.molonc.2013.12.010. [DOI] [PMC free article] [PubMed] [Google Scholar]
- 74.Visani M, de Biase D, Marucci G, Taccioli C, Baruzzi A, Pession A. Definition of miRNAs expression profile in glioblastoma samples: the relevance of non-neoplastic brain reference. PLoS One. 2013;8:e55314. doi: 10.1371/journal.pone.0055314. [DOI] [PMC free article] [PubMed] [Google Scholar]
- 75.Ma DF, Kondo T, Nakazawa T, Niu DF, Mochizuki K, Kawasaki T, Yamane T, Katoh R. Hypoxia-inducible adenosine A2B receptor modulates proliferation of colon carcinoma cells. Hum Pathol. 2010;41:1550–1557. doi: 10.1016/j.humpath.2010.04.008. [DOI] [PubMed] [Google Scholar]
- 76.Gajjar K, Owens G, Sperrin M, Martin-Hirsch PL, Martin FL. Cytochrome P1B1 (CYP1B1) polymorphisms and ovarian cancer risk: a meta-analysis. Toxicology. 2012;302:157–162. doi: 10.1016/j.tox.2012.09.009. [DOI] [PubMed] [Google Scholar]
- 77.Larsen MC, Angus WG, Brake PB, Eltom SE, Sukow KA, Jefcoate CR. Characterization of CYP1B1 and CYP1A1 expression in human mammary epithelial cells: role of the aryl hydrocarbon receptor in polycyclic aromatic hydrocarbon metabolism. Cancer Res. 1998;58:2366–2374. [PubMed] [Google Scholar]
- 78.Korja M, Jokilammi A, Salmi TT, Kalimo H, Pelliniemi TT, Isola J, Rantala I, Haapasalo H, Finne J. Absence of polysialylated NCAM is an unfavorable prognostic phenotype for advanced stage neuroblastoma. BMC Cancer. 2009;9:57. doi: 10.1186/1471-2407-9-57. [DOI] [PMC free article] [PubMed] [Google Scholar]
- 79.Pegg AE, Feith DJ. Polyamines and neoplastic growth. Biochem Soc Trans. 2007;35:295–299. doi: 10.1042/BST0350295. [DOI] [PubMed] [Google Scholar]
- 80.Ernestus RI, Rohn G, Schroder R, Els T, Lee JY, Klug N, Paschen W. Polyamine metabolism in gliomas. J Neurooncol. 1996;29:167–174. doi: 10.1007/BF00182140. [DOI] [PubMed] [Google Scholar]
- 81.Cheong JK, Gunaratnam L, Zang ZJ, Yang CM, Sun X, Nasr SL, Sim KG, Peh BK, Rashid SB, Bonventre JV, Salto-Tellez M, Hsu SI. TRIP-Br2 promotes oncogenesis in nude mice and is frequently overexpressed in multiple human tumors. J Transl Med. 2009;7:8. doi: 10.1186/1479-5876-7-8. [DOI] [PMC free article] [PubMed] [Google Scholar]
- 82.Cheong JK, Gunaratnam L, Hsu SI. CRM1-mediated nuclear export is required for 26 S proteasome-dependent degradation of the TRIP-Br2 proto-oncoprotein. J Biol Chem. 2008;283:11661–11676. doi: 10.1074/jbc.M708365200. [DOI] [PubMed] [Google Scholar]