

Abstract
The mammalian target of rapamycin (mTOR) has emerged as a critical effector in cell growth, proliferation, survival, angiogenesis, and autophagy through direct interaction with mTORC1 (mTOR complex 1) and mTORC2 (mTOR complex 2). The mTOR axis is aberrantly activated in about 50% of human hepatocellular carcinoma (HCC) cases and thus has become an attractive target for drug development in this disease. Allosteric inhibitors of mTORC1, rapamycin and its derivatives have been used to study in patients with HCC but have not shown significant clinical utility, likely because of the lack of inhibition of mTORC2. In the present study, we describe that AZD2014, a small molecular ATP-competitive inhibitor of mTOR, was a highly potent inhibitor of mTORC1 and mTORC2 in human HCC cells, which led to a more thorough inhibition of mTORC1 than rapamycin, and the inhibition of mTORC2 prevented the feedback activation of AKT signaling. Compared with rapamycin, AZD2014 resulted in more profound proliferation suppression, apoptosis, cell cycle arrest, and autophagy in HCC cells. Notably, we found blockage of both mTORC1 and mTORC2 by AZD2014 to be more efficacious than blockage of mTORC1 alone by rapamycin in inhibiting the migration, invasion and EMT progression of HCC cells. In conclusion, our current results highlight mechanistic differentiation between rapamycin and AZD2014 in targeting cancer cell proliferation, cell cycle, apoptosis, autophagy, migration, invasion and EMT progression, and provide support for further investigation of AZD2014 as an antitumor agent for the treatment of HCC in clinic.
Keywords: Hepatocellular carcinoma, mTOR kinase inhibitor, AZD2014, EMT, autophagy
Introduction
Hepatocellular carcinoma (HCC) is a common health problem, with the third most frequent cause of cancer-related death [1,2]. Although liver transplantation, resection and local ablation are potentially curative treatments, it is available for only a small fraction of patients with early-stage disease [2,3]. For the majority of patients who are often diagnosed at an advanced stage, limited treatment options are available [2,3]. It should be noted that, even if patients receive potentially curative therapies, the long-term prognosis of this disease remains dismal, due to a high rate of recurrence [2,3].
The mammalian target of rapamycin (mTOR) is a conserved serine-threonine protein kinase that functions as a central controller of cell growth, proliferation, survival, angiogenesis, and autophagy [4,5]. Depending on their binding partners and sensitivities to rapamycin, mTOR resides in at least two distinct complexes, termed mTOR complex 1 (mTORC1, containing Raptor, FKBP12, PRAS40 and mLST8) and mTOR complex 2 (mTORC2, containing Rictor, Sin1, Protor and mLST8) [6]. mTORC1 promotes cell growth and proliferation mainly through phosphorylating its two substrates, namely ribosomal protein S6 kinase (S6K) and eukaryotic translation initiation factor eIF4E-binding protein 1 (4EBP1) [7]. mTORC2 also plays a key role in regulating the growth, proliferation and angiogenesis of cancer cells, due to its contribution to the phosphorylation of AKT at Ser473 residue, which is vital for the maximal activation of AKT [8]. In addition, mTORC1 can negatively regulate AKT activity by inhibiting mTORC2 through a negative feedback loop [9-11]. As has been shown recently, the mTOR axis (PI3K/AKT/mTOR) is frequently aberrantly activated in multiple tumors including human HCC, largely due to activation of upstream signaling or dysregulation in PTEN [12-14]. Therefore, targeting of PI3K/Akt/mTOR is being investigated as a promising therapy for cancer.
Most studies targeting the mTOR pathway in cancer therapy mainly focus on rapamycin and its derivatives, which are inhibitors of mTORC1 but not of mTORC2 [15,16]. Unfortunately, current data indicate that rapamycin or its derivatives show encouraging efficacy only in several types of cancer, such as renal cell carcinoma [12,17]. Based on existing data, it appears that the efficacy of rapamycin or its derivatives monotherapy for HCC is highly limited [18,19]. This may be due to the fact that rapamycin and its derivatives do not completely block mTORC1 and lack effective inhibition of mTORC2 and result in feedback activation of AKT signaling that attenuate their antitumor activity [20-22]. In contrast to rapamycin and its derivatives, which inhibit only mTORC1, recently developed dual mTOR inhibitors are able to inhibit both mTORC1 and mTORC2 [23,24]. Thus, it is reasonable to hypothesize that dual mTOR inhibitors would exert greater antitumor activity than rapamycin and its derivatives.
In this study, we investigated the biochemical activity of AZD2014, a novel small molecular ATP-competitive inhibitor of mTOR kinase, in blocking mTORC1 and mTORC2 signaling in human HCC cell lines. Our results suggest that AZD2014 had differential effects on both mTORC1 and mTORC2 activity compared with rapamycin. Rapamycin treatment partially blocked mTORC1 outputs and resulted in feedback activation of AKT in HCC cells, whereas AZD2014 fully inhibited mTORC1 and mTORC2 activities, leading to a more complete inhibition of mTORC1 than rapamycin and prevention of the feedback activation of AKT. Then, we evaluated the potential therapeutic value of AZD2014 by determining its effects on the proliferation, apoptosis, cell cycle, autophagy, migration, invasion and EMT progression of HCC cells. Compared with rapamycin, AZD2014 was found to be more efficacious in the induction of apoptosis, autophagy, and cell cycle arrest, resulting in a significant proliferation suppression of these cells. Moreover, AZD2014 more effectively reversed EMT and inhibited migration and invasion than rapamycin in HCC cells. These promising results support potential clinical development of AZD2014 for the treatment of HCC.
Materials and methods
Reagents and antibodies
AZD2014, rapamycin and 3-methyladenine (3-MA) were purchased from Selleckchem (Houston, TX). AZD2014 and rapamycin were dissolved in dimethyl sulfoxide (DMSO) and used at the indicated concentration. The final concentrations of DMSO in the culture medium did not exceed 1%. All antibodies were purchased from Cell Signaling Technology (Beverly, MA), except mouse antibody specific to E-cadherin from BD PharMingen (San Diego, CA).
Cell lines
Human HCC cell lines HCCLM3, Huh-7, SMMC-7721, HepG2 and the immortalized liver cell line HL-7702 were purchased from Cell Bank of Type Culture Collection of Chinese Academy of Sciences (Shanghai, China). HCCLM3, Huh-7, HepG2 and HL-7702 cells were maintained in DMEM (Invitrogen, Carlsbad, CA) supplemented with 10% FBS (Hyclone, Logan, UT). SMMC-7721 cells were cultured in RPMI 1640 (GIBCO, Grand Island, NY) containing 10% FBS. All cell lines were incubated at 37°C in humidified 5% CO2.
Cell proliferation assay
The sensitivity of HCC cell lines to AZD2014 or rapamycin was determined by performing cell proliferation assay. Cells were seeded in 96-well plates at 4,000 to 8,000 cells per well for 12 h, treated with DMSO or various concentrations of AZD2014 or rapamycin. Cell number was determined 72 hours later by a Cell Counting Kit-8 (Dojindo, Tokyo, Japan) following the kit assay protocol. The half maximal inhibitory concentration (IC50) was generated for all cell lines and used in further experiments.
Apoptosis analysis
Cell apoptosis was quantitated using the Annexin V-FITC/PI Apoptosis Detection Kit (Sigma, MO, USA) as detailed in the manufacturer’s instructions. HCC cells were collected at 48 hours after incubation with or without AZD2014 or rapamycin. Cells were washed in cold PBS and incubated with Annexin V-FITC and propidium iodide (PI) in the dark, and then analyzed for apoptosis (acquired 10,000 cells/test) by flow cytometer (BD Bioscience). Apoptosis was also assessed by the TUNEL technique, according to the manufacturer’s protocol (Roche Applied Science, Mannhelm, Germany). The images were obtained by a fluorescent microscopy (Nikon, Tokyo, Japan) and accompanying NIS-Elements BR 3.1 software. Cells exhibiting green fluorescence were defined as TUNEL-positive apoptotic cells.
Cell cycle analysis
For cell cycle analysis, cells were harvested at 48 hours after the incubation with or without AZD2014 or rapamycin, washed with PBS and fixed overnight at 4°C in 70% ethanol. Cells were washed and stained with PI solution (Sigma, St Louis, MO) containing RNase in the dark, and analyzed for cell cycle distribution (acquired 10,000 cells/test) on flow cytometer (BD Biosciences) and Modfit LT Software (Verity Software House, Tosham, ME).
Transwell assay
After incubation with or without AZD2014 or rapamycin for 48 hours, cells were trypsinized and resuspended in serum-free medium, and 50,000 cells were added to the top well (insert) of each migration chamber with 8 um pores (Corning). The top well was loaded with 200 μl of cell suspension with or without AZD2014 or rapamycin. The migration was induced by the presence of 20% FBS medium in the bottom chambers. After 48 hours, cells in upper chambers were removed, and then inserts were fixed in 4% paraformaldehyde and stained with 0.5% crystal violet. The numbers of migrated cells were counted in three different fields with an inverted microscope (Nikon, Tokyo, Japan). For the invasion assay, all conditions were as described in the migration assays, except that 50,000 cells were added to the matrigel-coated inserts.
Labeling of autophagic vacuoles with monodansylcadaverine
The autofluorescent dye monodansylcadaverine (MDC) is commonly used to monitor autophagy. Cells were cultured in the presence or absence of AZD2014 or rapamycin for 48 hours, and then incubated with 0.05 mM MDC in PBS at 37°C for 10 minutes, and washed for four times with PBS. Cells were immediately observed under a confocal laser scanning microscope (FV10i-w, Olympus, Japan) and accompanying FV10i-ASW 3.0 software. In some experiments, HCC cells were pre-incubated for 3 hours with 10 mM 3-MA (autophagy inhibitor), before AZD2014 or rapamycin treatment.
Immunofluorescence
Cells were fixed with 4% paraformaldehyde for 20 minutes, permeabilized in 0.2% Triton X-100 for 10 minutes, and blocked with 5% BSA for 1 hour. Mouse anti-E-cadherin (BD PharMingen) and rabbit anti-Vimentin (Cell Signaling Technology) antibodies in 5% BSA were added for 18 hours at 4°C, and detected using anti-mouse antibodies conjugated to Alexa Fluor 488 and anti-rabbit antibodies conjugated to Alexa Fluor 555. Slides were mounted using ProLong® Gold antifade reagent with DAPI (Cell Signaling Technology). Images were acquired using a confocal laser scanning microscope (FV10i-w, Olympus, Japan) and accompanying FV10i-ASW 3.0 software.
Western blot analysis
Cells were lysed on ice with RIPA buffer containing protease and phosphatase inhibitors. Equal amounts of protein (30 or 40 μg) from each sample were separated by 10% or 12% SDS-PAGE gel electrophoresis and transferred to polyvinylidene difluoride (PVDF) membranes (Millipore, Bedford, MA). Membranes were blocked in 5% BSA in TBST and incubated with respective primary antibodies overnight at 4°C, then followed by incubation with HRP-conjugated secondary antibody for 1 h. The immunoblotted proteins were visualized by Gene-Gnome HR imaging system (Synoptics Ltd., UK).
Statistical analysis
SPSS version 13.0 software was used for statistical analysis. Comparisons among multiple groups were determined using one-way ANOVA, followed by LSD-t (for equal variances assumed) or Dunnett’s T3 (for equal variances not assumed) test to compare individual group differences. The data from cell proliferation assay were analyzed using GraphPad Prism version 5.0. Values of P < 0.05 were considered significant.
Results
The activation status of mTORC1 and mTORC2 in HCC cell lines
We first examined the activation status of mTOR pathway in human HCC cell lines, HCCLM3, Huh-7, SMMC-7721, and HepG2 cells (Figure 1A). HL-7702 cell line served as a normal control. mTORC1 activity was reflected by p-S6K and p-4EBP1, while mTORC2 activation was indicated by phosphorylation of AKT at Ser473. As shown in Figure 1A, the expression of p-S6K Thr389 and p-4EBP1 Thr37/46 was higher in the four HCC cell lines than that in HL-7702 cell line, indicating that aberrant activation of mTORC1 signaling exists in all HCC cell lines we tested. In contrast, we found that only SMMC-7721 cells showed an increased level of p-AKT Ser473 compared with HL-7702 cells (Figure 1A).
Figure 1.
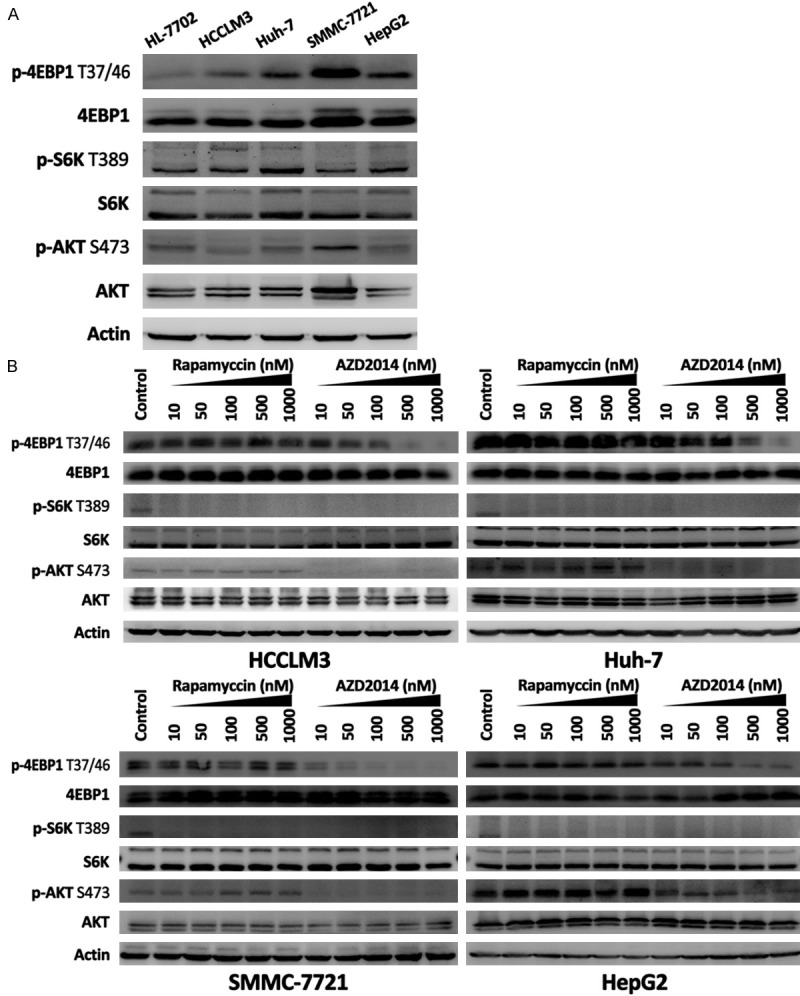
The activities of mTORC1 and mTORC2 and effects of AZD2014 and rapamycin on mTORC1 and mTORC2 signaling in HCC cells. A: Immunoblot analysis for mTORC1 and mTORC2 activity in HL-7702, HCCLM3, Huh-7, SMMC-7721, and HepG2 cells. mTORC1 activity was reflected by p-S6K Thr389 and p-4EBP1 Thr37/46, and mTORC2 activity was indicated by p-AKT Ser473. B: Biochemical activity of AZD2014 and rapamycin in blocking mTORC1 and mTORC2 signaling. HCC cells were treated with DMSO or increasing concentrations of AZD2014 or rapamycin for 1 hour before lysis and immunoblotting.
AZD2014 fully inhibits mTORC1 and mTORC2 signaling and prevents feedback activation of AKT
The biochemical activity of AZD2014 in blocking mTORC1 and mTORC2 signaling was investigated in HCCLM3, Huh-7, SMMC-7721, and HepG2 cells. Phosphorylation of AKT was measured at Ser473 (mTORC2 substrate), phosphorylation of S6K was measured at Thr389 (mTORC1 substrate) and phosphorylation of 4EBP1 was measured at Thr37/46 (mTORC1 substrate). Concentration-dependent experiments (from 10 to 1,000 nM) showed that AZD2014 effectively inhibited p-S6K Thr389 and p-4EBP1 Thr37/46 in a concentration-dependent manner (Figure 1B). Rapamycin, in contrast, potently inhibited p-S6K Thr389 but did not result in the inhibition of 4EBP1 phosphorylation at Thr37/46 even at a high dose of 1,000 nM (Figure 1B), suggesting that the Thr37/46 phosphorylation sites on 4EBP1 is resistant to rapamycin in HCC cells. As shown in Figure 1B, the direct mTORC2 substrate p-AKT Ser473 was markedly inhibited by AZD2014 in a concentration dependent manner. In contrast, rapamycin treatment resulted in a significant increase in p-AKT Ser473 (Figure 1B), suggesting that rapamycin treatment induced feedback activation of AKT signaling in HCC cells. These results indicate that AZD2014 is a potent inhibitor of mTORC1 and mTORC2 in human HCC cells, which leads to a more complete blockade of mTORC1 than rapamycin, and the inhibition of mTORC2 prevents the feedback activation of AKT signaling.
AZD2014 inhibits proliferation of HCC cells in vitro
To determine the effect of AZD2014 on cell proliferation, we treated HCC cell lines with AZD2014 for 72 hours at concentrations ranging from 10 nM to 20 mM. Rapamycin was used as a control. As shown in Figure 2A, AZD2014 exhibited a more profound antiproliferative activity than rapamycin in a dose-dependent manner in the four HCC cell lines tested here. HCCLM3, Huh-7, and HepG2 cells were found to be sensitive to AZD2014 at IC50 101.6, 441.6, and 600 nM, respectively (Figure 2B). Rapamycin, however, in general elicited a flat, modest suppression of cell proliferation (Figure 2A) and had a much higher IC50 than AZD2014 (Figure 2B). Interestingly, we found that SMMC-7721 cells were resistant to rapamycin, as shown by no significant decrease in cell proliferation even at a high concentration of 20 μM (Figure 2A), but were highly sensitive to AZD2014 at IC50 141 nM (Figure 2B). Taken together, we decided to treat HCCLM3, Huh-7, SMMC-7721, and HepG2 cells with AZD2014 at concentrations of 100, 440, 140 and 600 nM, respectively, for subsequent experiments, and an equal dose of rapamycin was used as a control.
Figure 2.

AZD2014 inhibits proliferation of HCC cells. A: Cell number determined by Cell Counting Kit-8 (CCK-8) in HCC cells exposed to DMSO (control) or increasing concentrations of AZD2014 or rapamycin for 72 hours. Columns, mean of quadruplicates of an experiment; bars, SD. B: The IC50 was generated by GraphPad Prism version 5.0 from CCK-8 assay.
AZD2014 induces selective apoptosis in HCC cells
Results in Figure 2A confirmed the cytotoxic effect of AZD2014 in HCC cells. Then, we examined whether the cytotoxicity is related to cell apoptosis. The Annexin V-FITC/PI FACS assay was conducted as described in Materials and Methods. In HCCLM3 and Huh-7 cells, both drugs induced an increase in apoptotic cells from 1.6% (control) to 19.0% and 49.0%, and 7.9% (control) to 29.0% and 43.2% with rapamycin and AZD2014, respectively (Figure 3A and 3B). Strangely enough, both rapamycin and AZD2014 did not have significant effect on apoptosis in SMMC-7721 and HepG2 cells (Figure 3A and 3B). Similar results were obtained by TUNEL assay (Figure 3C). Western blot analysis detected increased bax, and cleavage of poly ADP-ribose polymerase (PARP) and caspase-3 in HCCLM3 and Huh-7 cells treated with AZD2014 and rapamycin, but not in SMMC-7721 and HepG2 cells (Figure 3D), which was consistent with the results of Annexin V/PI staining and TUNEL assay. Collectively, these results indicate that AZD2014 induces apoptosis in subsets of HCC cells with a greater potency than that of rapamycin.
Figure 3.
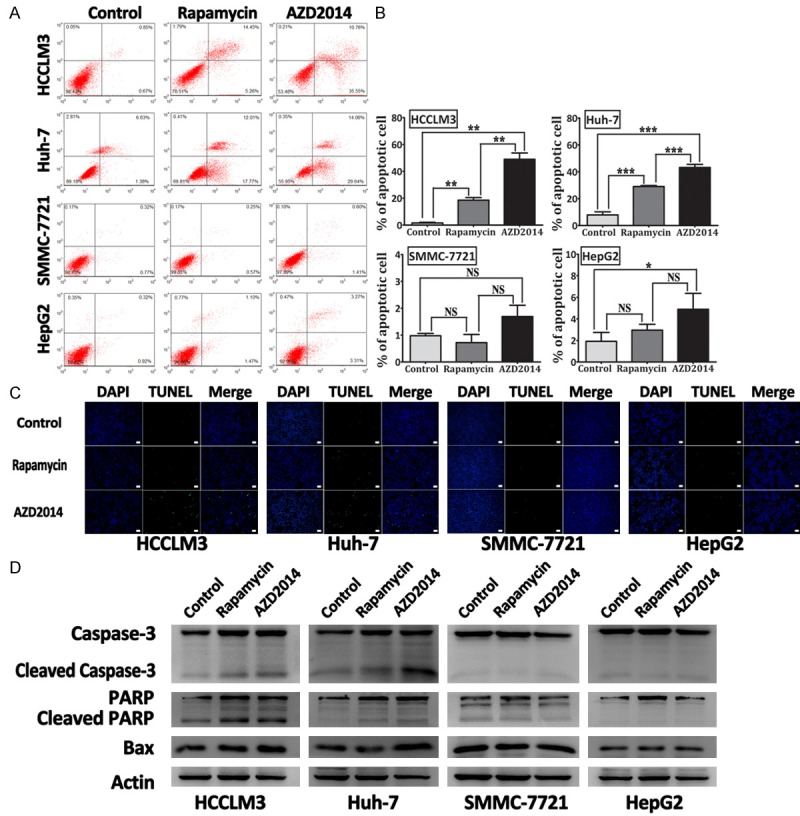
Apoptosis detection in HCC cells treated with AZD2014. A: Apoptosis was determined by Annexin V-FITC/PI staining on a flow cytometer. HCCLM3, Huh-7, SMMC-7721, and HepG2 cells were treated with AZD2014 or rapamycin at concentrations of 100, 440, 140 and 600 nM, respectively, for 48 hours. Then, cell apoptosis was determined on a flow cytometer. Cells in the control group were treated with DMSO. B: Quantification of the percentage of early and late apoptotic cells. Columns, mean of three independent experiments; bars, SD. *P < 0.05, **P < 0.01, ***P < 0.001, NS = not significant. C: TUNEL staining. HCC cells were treated as described above and labeled with Br-dUTP, and stained with an anti-Br-dUTP antibody for a TUNEL analysis. bar, 200 μm. D: Immunoblot analysis for PARP, caspase-3 and bax in HCC cells treated as described above.
AZD2014 leads to cell cycle arrest in HCC cells
Because it has been shown that mTOR signaling pathway plays a pivotal role in the coordination of cell growth and the cell cycle [25], we investigated the effects of rapamycin and AZD2014 on cell cycle in HCC cells. Flow cytometric analysis of rapamycin or AZD2014-treated HCC cells indicated that AZD2014 led to a more profound increase in G1-phase cells than rapamycin in the four HCC cell lines tested (Figure 4A and 4B), suggesting that AZD2014 caused a strong G1 arrest in HCC cells. We also observed reduced Cyclin D1, CDK4 levels in AZD2014-treated HCC cells (Figure 4C), which is consistent with its ability to induce G1 arrest. Notably, although rapamycin were able to induce a modest G1 arrest in HCCLM3 and Huh-7 cells, it had a minor effect on the cell cycle profile of SMMC-7721 and HepG2 cells, as shown by that rapamycin treatment induced only a little increase in G1-phase cells from 61.0% to 64.7% and 56.7% to 60.5% when comparing the control group in SMMC-7721 and HepG2 cells, respectively (Figure 4A and 4B).
Figure 4.
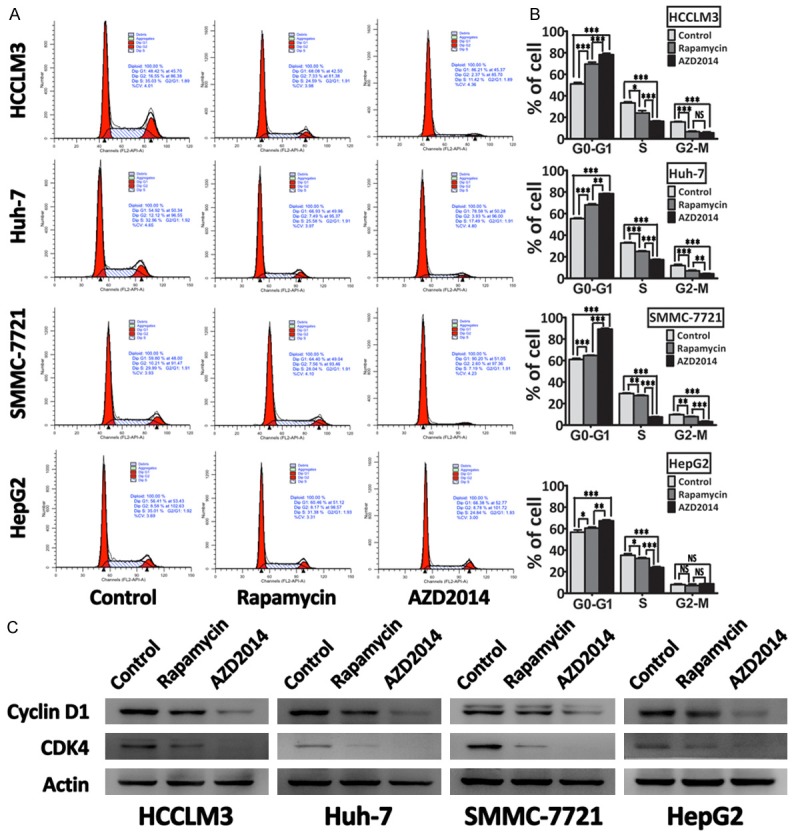
AZD2014 decreases cell cycle progression in HCC cells. A: HCCLM3, Huh-7, SMMC-7721, and HepG2 cells were treated with AZD2014 or rapamycin at concentrations of 100, 440, 140 and 600 nM, respectively, for 48 hours. Then, cell cycle profile was determined on a flow cytometer. Cells in the control group were treated with DMSO. B: Quantification of the percentage of cells in each cell cycle phase. Columns, mean of three independent experiments; bars, SD. *P < 0.05, **P < 0.01, ***P < 0.001, NS = not significant. C: Immunoblot analysis for Cyclin D1 and CDK4 in HCC cells treated as described above.
AZD2014 induces autophagy in HCC cells
It has been reported that inhibition of mTOR signaling is implicated in the induction of autophagy [26-28]. Hence, we evaluated whether AZD2014 would affect this process. Rapamycin was used as a positive control. After exposing HCC cells to AZD2014 for 48 hours, autophagic vacuoles were detected by monodansylcadaverine (MDC) staining. As shown in Figure 5A, AZD2014-treated HCC cells showed an increase in the number of MDC-labeled vacuoles as well as in their size. MDC staining could not be considered to be an indicator of autophagy until when the increased labeling of cellular compartments by this dye is prevented by treatment with autophagy inhibitors such as 3-MA. As expected, the formation of MDC-labeled vacuoles induced by AZD2014 was inhibited by 3-MA (Figure 5A), indicating that AZD2014 indeed induced the formation of autophagy. LC3B is the most widely monitored autophagy-related proteins. Thus, we detected the conversion of LC3B-I to LC3B-II by western blot. Consistent with the results of MDC staining, AZD2014 treatment resulted in an increase in the levels of LC3B-II, and this increase was more pronounced than rapamycin (Figure 5B and 5C). Beclin-1 is one of the critical proteins for the initiation of autophagy, and many researchers use it as a way to monitor autophagy [29]. We examined the amount of Beclin-1 by western blot. As shown in Figure 5B and 5D, AZD2014 treatment led to a significant upregulation of Beclin-1, suggesting that AZD2014 promotes initiation of autophagy. It should be noted that rapamycin increased the number and size of MDC-labeled vacuoles in HCCLM3 and Huh-7 cells, but not in HepG2 and SMMC-7721 cells (Figure 5A), and the result was confirmed by the expression of LC3B-II and Beclin-1 (Figure 5B-D). These results indicate that inhibition of mTORC1 by rapamycin induces autophagy in subsets of HCC cells, whereas blockade of mTORC1 and mTORC2 by AZD2014 induces a more profound autophagy in all of the four HCC cell lines tested here.
Figure 5.
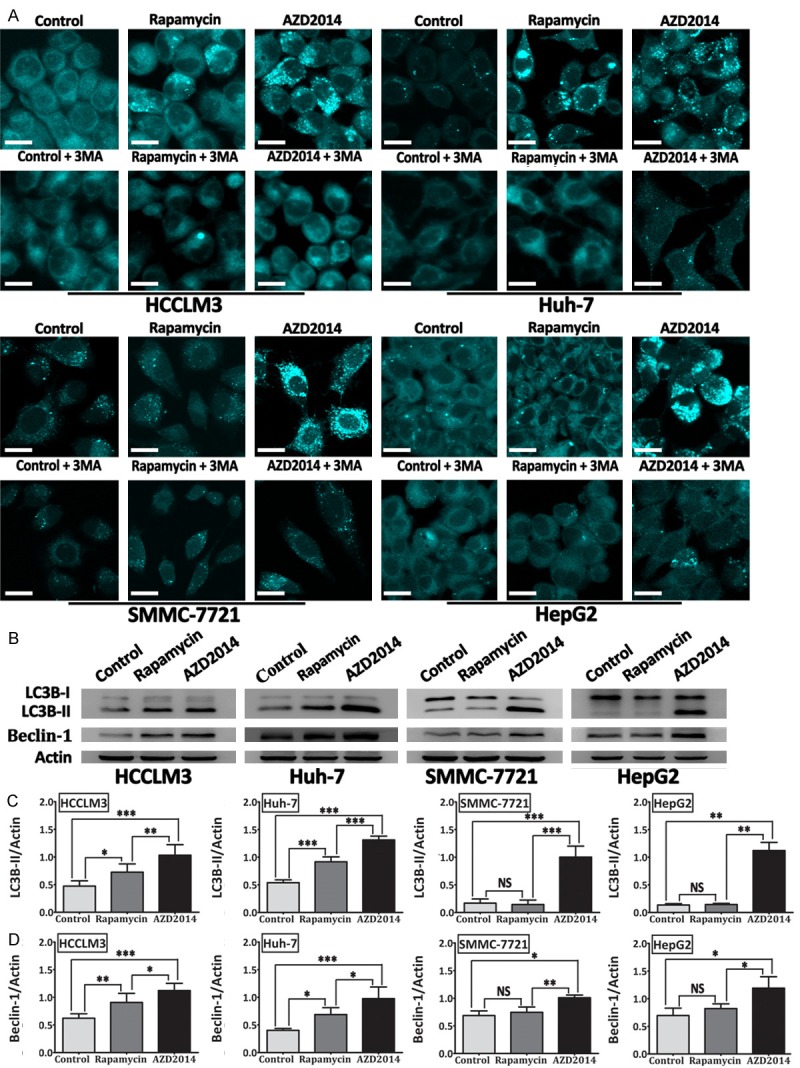
AZD2014 induces autophagy in HCC cells. (A) MDC-labeled vacuoles were induced by AZD2014 and inhibited by autophagy inhibitor (3-MA). HCCLM3, Huh-7, SMMC-7721, and HepG2 cells were treated with AZD2014 or rapamycin at concentrations of 100, 440, 140 and 600 nM, respectively, for 48 hours in the presence or absence of 3-MA, and then stained with MDC. Cells were immediately observed under a confocal microscope. Cells in the control group were treated with DMSO. bars, 20 μm. (B) Expression of LC3B (LC3B-I and LC3B-II) and Beclin-1 determined by immunoblot analysis in HCC cells treated as described above. ImageJ densitometric analysis was used for the measurement of LC3B-II/Actin (C), and Beclin-1/Actin (D) ratios from immunoblots. Each column was from the mean of at least three independent experiments; bars, SD. *P < 0.05, **P < 0.01, ***P < 0.001, NS = not significant.
AZD2014 inhibits migration, invasion and EMT progression in HCC cells
It was shown recently that inhibition of mTORC1 or mTORC2 by RNA interference significantly decrease the motility, EMT, and metastasis of colorectal cancer cells [30]. Therefore, we studied whether AZD2014 could attenuate the migration, invasion and EMT progression in HCC cells. The ability of migration was assessed by Transwell assay. Treatment with AZD2014 significantly decreased the migration of HCCLM3, Huh-7, SMMC-7721, and HepG2 cells (Figure 6A and 6B). Then, we evaluated the effect of AZD2014 on invasion using Matrigel-coated Transwell chambers. As shown in Figure 6C and 6D, AZD2014 potently decreased the invasion of HCCLM3, Huh-7, SMMC-7721, and HepG2 cells. During EMT, cells downregulate the expression of epithelial markers such as E-cadherin, and upregulate the expression of mesenchymal markers such as N-cadherin and Vimentin [31]. Because inhibition of mTOR signaling by AZD2014 decreased the migration and invasion of HCC cells, we tried to confirm whether AZD4014 could inhibit EMT by examining the expression of E-cadherin, N-cadherin and Vimentin. As shown in Figure 6E, AZD2014-treated HCC cells increased the expression of E-cadherin, whereas decreased Vimentin and N-cadherin levels. Immunofluorescence microscopy confirmed increased levels of E-cadherin and decreased levels of Vimentin in AZD2014-treated Huh-7 and SMMC-7721 cells compared with control cells (Figure 6F). EMT is also accompanied by the upregulation of Snail, a transcription factor that is implicated in transcriptional repression of E-cadherin [31]. In contrast to the increase in E-cadherin, the expression of Snail was decreased by AZD2014 treatment (Figure 6G). EMT further correlates with the increased expression of matrix metalloproteases (MMP), such as MMP2, thus enhancing extracellular matrix proteins degradation and facilitating invasion [31]. Because AZD2014 can inhibit the invasion of HCC cells, we determined whether AZD2014 could decrease MMP2 production. As shown in Figure 6G, the expression of MMP2 was significantly decreased by AZD2014. Similar but modest results were obtained when HCC cells were treated with rapamycin (Figure 6A-G).
Figure 6.
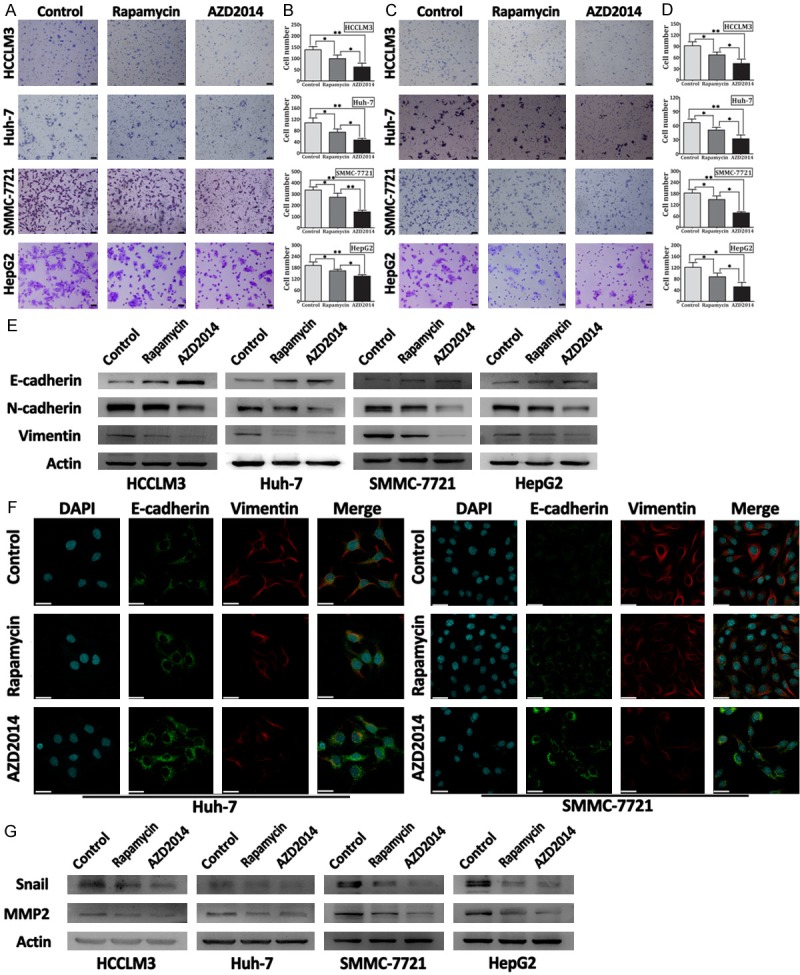
AZD2014 inhibit migration, invasion and EMT of HCC cells. A: Transwell migration assay carried out with HCC cells. HCCLM3, Huh-7, SMMC-7721, and HepG2 cells were treated with AZD2014 or rapamycin at concentrations of 100, 440, 140 and 600 nM, respectively. Cells in the control group were treated with DMSO. bars, 200 μm. B: Quantification of migrated cells. The number of migrated cells was counted in three different fields. Columns, mean of cell number in three different fields; bar, SD. *P < 0.05, **P < 0.01. C: Transwell invasion assay was conducted with HCC cells treated as described above. bars, 200 μm. D: Quantification of invasived cells. The number of invasived cells was counted in three different fields. Columns, mean of cell number in three different fields; bars, SD. *P < 0.05, **P < 0.01. E: Immunoblot analysis for EMT markers in HCCLM3, Huh-7, SMMC-7721, and HepG2 cells. HCC cells were treated with AZD2014 or rapamycin at concentrations of 100, 440, 140 and 600 nM, respectively, for 48 hours before lysis and immunoblotting. Cells in the control group were treated with DMSO. F: Immunofluorescence staining in Huh-7 and SMMC-7721 cells treated as described above. bars, 30 μm. G: Immunoblot analysis for Snail and MMP2 in HCC cells treated as described above.
Discussion
Evidence of mammalian target of rapamycin (mTOR) activation has been demonstrated in many cancers and thus mTOR has become an attractive target for cancer therapy. However, clinical results with conventional mTOR inhibitors, rapamycin and its derivatives, are frustrating in most types of cancer treatment. This may be due to the facts, including the incomplete blockage of mTORC1, ineffective inhibition of mTORC2, and feedback activation of AKT. Consequently, intense efforts are exerted to develop novel mTOR inhibitors that could inhibit both mTORC1 and mTORC2. In the present study, it is demonstrated that AZD2014, a novel small molecular ATP-competitive mTOR kinase inhibitor, was a highly potent inhibitor of mTORC1 and mTORC2 in human HCC cells, which led to a more complete inhibition of mTORC1 than rapamycin, and the inhibition of mTORC2 prevented the feedback activation of AKT signaling. In addition, the induction of apoptosis, autophagy, and cell cycle arrest by AZD2014 were more pronounced as compared with rapamycin, resulting in a more profound growth suppressive effect in HCC cells. What is more, AZD2014 treatment effectively inhibited the migration, invasion and EMT progression of HCC cells.
AZD2014 has differential effects on both mTORC1 and mTORC2 activity compared with that of rapamycin. Activated mTORC1 phosphorylates S6K and 4EBP1, two best-characterized substrates of mTORC1, to positively regulate protein synthesis driving cell growth and proliferation [7]. Therefore, p-S6K and p-4EBP1 are commonly used in research as a biomarker of mTORC1 activity. Consistent with recent studies [32], although rapamycin treatment resulted in a great dephosphorylation of S6K at Thr389, significant phosphorylation of 4EBP1 at Thr37/46 were still observed, suggesting that rapamycin cannot completely block all mTORC1 outputs in HCC cells. In contrast to rapamycin, AZD2014 induced a much greater dephosphorylation of both S6K at Thr389 and 4EBP1 at Thr37/46. Recent studies used knockdown of Rictor (a component of mTORC2) and Raptor (a component of mTORC1) to show that phosphorylation of 4EBP1 at Thr37/46 site is independent of mTORC2 but dependent on mTORC1 [21,33]. These results suggest that AZD2014 inhibits mTORC1 activity more completely than rapamycin in HCC cells.
mTORC2 has been considered to function mainly through activating AKT by phosphorylating it at Ser473, which is important for its maximal activation [8]. Therefore, the level of p-AKT Ser473 is widely used for measurement of mTORC2 activity. Recent studies suggest that the limited clinical efficacy of rapamycin may be largely due to the release of the S6K negative feedback loop and lack of direct inhibition of mTORC2 and, therefore, resulting in an increase in AKT activity [20-22]. Consistent with previous studies [34], an increase in p-AKT Ser473 was induced when HCC cells were treated with rapamycin, indicating that mTORC2 is insensitive to rapamycin and rapamycin treatment indeed results in feedback activation of AKT in HCC cells. In sharp contrast, AZD2014 treatment significantly decreased the phosphorylation of AKT at Ser473 in a concentration dependent manner in HCC cells, indicating that AZD2014 is effective in attenuating mTORC2 function and preventing the feedback activation of AKT. Our finding is in line with genetic knockout of Sin1 or Rictor (two components of mTORC2), where phosphorylation of Ser473 is inhibited [35,36]. These results indicate that AZD2014 is a highly potent inhibitor of mTORC1 and mTORC2 in human HCC cells.
AZD2014 shows a more antiproliferative potency than rapamycin in human HCC cell lines. The mTOR signaling integrates intracellular and extracellular cues to regulate many processes that are involved in cell growth and proliferation, such as protein synthesis, cell cycle, apoptosis or autophagy [7]. It was previously suggested that strong G1-phase cell cycle arrest induced by mTOR kinase inhibitors, WYE-125132 and AZD8055, is attributed to the dual targeting of mTORC1 and mTORC2 [37,38]. Our finding is that although rapamycin induced a modest G1 arrest in HCCLM3 and Huh-7 cells, it had only a minor effect on the cell cycle profile of SMMC-7721 and HepG2 cells. However, a substantial G1 arrest can be induced by AZD2014 in HCCLM3, Huh-7, SMMC-7721, and HepG2 cells, indicating that mTORC2 and/or rapamycin-insensitive function of mTORC1 may play a pivotal role in controlling G1/S-phase progression. Furthermore, AZD2014 induced more pronounced apoptotic cells in HCCLM3 and Huh-7 cells than rapamycin. Therefore, rapamycin induced a partial proliferation inhibition, whereas AZD2014 induced a profound proliferation inhibition in the four HCC cell lines we tested.
Another important function of mTOR signaling is the inhibition of autophagy [39]. Indeed, mTOR signaling is critical for autophagy induction through the phosphorylation of autophagy-related proteins [40]. In our study, however, inhibition of mTOR signaling by rapamycin could not induce autophagy in HepG2 and SMMC-7721 cells. Conversely, treatment with AZD2014 induced autophagy in all HCC cell lines tested here, including HepG2 and SMMC-7721 cells. Because the exact role of autophagy in cancer therapy is still under debate, further investigation is required to determine the effect of autophagy in AZD2014-treated tumor cells.
In the present study, the resistance of SMMC-7721 cells to rapamycin could not be explained by a failure of inhibition of mTORC1 activity, because rapamycin equally inhibited p-S6K Thr389 in SMMC-7721 cells as well as in HCCLM3, Huh-7 and HepG2 cells. The detailed mechanisms involved in the resistance of SMMC-7721 cells to rapamycin need further exploration. Collectively, these data not only emphasize the importance of rapamycin-sensitive function of mTORC1 in cell proliferation, cell cycle progression, survival and autophagy, but also suggest that mTORC2 and/or rapamycin-insensitive function of m TORC1 are equally, and perhaps more important in these processes.
Recently, mounting evidence stresses the importance of mTORC1 and mTORC2 in regulation of cancer cell motility, EMT and metastasis. We demonstrated here that AZD2014 significantly decreased the migration and invasion of HCC cells, whereas rapamycin did not have the same activity, suggesting that both mTORC1 and mTORC2 participate in regulating the migration and invasion of HCC cells. Our findings are consistent with several studies showing disruption of mTORC1 or mTORC2 by RNA interference decreased cell migration and invasion in various types of cancers [30,41-43]. A very recent study has shown that inhibition of mTORC1 or mTORC2 decreases cell motility associated with preventing the rearrangement of actin cytoskeleton and the formation of lamellipodia [30]. In addition, increased cell invasion is controlled by the expression and activity of MMP [44]. Our findings suggest that AZD2014 was more effective in decreasing the production of MMP2 than rapamycin in HCC cells. It has been well established that TGF-β signaling plays a predominant role in promoting EMT in vitro and in vivo [31,45]. In cells undergoing EMT, TGF-β activates mTORC1 and mTORC2 through PI3K, leading to increases in protein synthesis, migration, invasion and the transition from an epithelial to a mesenchymal phenotype [43,46]. In the present study, inhibition of both mTORC1 and mTORC2 by AZD2014 was found to be more efficacious than inhibition of mTORC1 by rapamycin in reversal of mesenchymal phenotype to epithelial phenotype, as demonstrated by that AZD2014 treatment resulted in more profound increase in E-cadherin and decrease in Vimentin and N-cadherin than rapamycin.
In summary, we demonstrated that AZD2014 was a highly potent inhibitor of mTORC1 and mTORC2 in human HCC cells, leading to a more complete inhibition of mTORC1 than rapamycin, and the inhibition of mTORC2 prevents the feedback activation of AKT signaling. AZD2014 induced more profound proliferation inhibition, apoptosis, cell cycle arrest and autophagy than rapamycin in HCC cells. Importantly, we found AZD2014 to be more efficacious than rapamycin in inhibiting the migration, invasion and EMT progression of HCC cells. Our current results forcibly support the investigation of AZD2014 as an antitumor agent in HCC.
Disclosure of conflict of interest
None.
References
- 1.Jemal A, Bray F, Center MM, Ferlay J, Ward E, Forman D. Global cancer statistics. CA Cancer J Clin. 2011;61:69–90. doi: 10.3322/caac.20107. [DOI] [PubMed] [Google Scholar]
- 2.Forner A, Llovet JM, Bruix J. Hepatocellular carcinoma. Lancet. 2012;379:1245–1255. doi: 10.1016/S0140-6736(11)61347-0. [DOI] [PubMed] [Google Scholar]
- 3.El-Serag HB. Hepatocellular carcinoma. N Engl J Med. 2011;365:1118–1127. doi: 10.1056/NEJMra1001683. [DOI] [PubMed] [Google Scholar]
- 4.Al-Batran SE, Ducreux M, Ohtsu A. mTOR as a therapeutic target in patients with gastric cancer. Int J Cancer. 2012;130:491–496. doi: 10.1002/ijc.26396. [DOI] [PubMed] [Google Scholar]
- 5.Fasolo A, Sessa C. Targeting mTOR pathways in human malignancies. Curr Pharm Des. 2012;18:2766–2777. doi: 10.2174/138161212800626210. [DOI] [PubMed] [Google Scholar]
- 6.Yang Q, Guan KL. Expanding mTOR signaling. Cell Res. 2007;17:666–681. doi: 10.1038/cr.2007.64. [DOI] [PubMed] [Google Scholar]
- 7.Zoncu R, Efeyan A, Sabatini DM. mTOR: from growth signal integration to cancer, diabetes and ageing. Nat Rev Mol Cell Biol. 2011;12:21–35. doi: 10.1038/nrm3025. [DOI] [PMC free article] [PubMed] [Google Scholar]
- 8.Sarbassov DD, Guertin DA, Ali SM, Sabatini DM. Phosphorylation and regulation of Akt/PKB by the rictor-mTOR complex. Science. 2005;307:1098–1101. doi: 10.1126/science.1106148. [DOI] [PubMed] [Google Scholar]
- 9.Dowling RJ, Topisirovic I, Fonseca BD, Sonenberg N. Dissecting the role of mTOR: lessons from mTOR inhibitors. Biochim Biophys Acta. 2010;1804:433–439. doi: 10.1016/j.bbapap.2009.12.001. [DOI] [PubMed] [Google Scholar]
- 10.Lang SA, Hackl C, Moser C, Fichtner-Feigl S, Koehl GE, Schlitt HJ, Geissler EK, Stoeltzing O. Implication of RICTOR in the mTOR inhibitor-mediated induction of insulin-like growth factor-I receptor (IGF-IR) and human epidermal growth factor receptor-2 (Her2) expression in gastrointestinal cancer cells. Biochim Biophys Acta. 2010;1803:435–442. doi: 10.1016/j.bbamcr.2010.01.009. [DOI] [PubMed] [Google Scholar]
- 11.Wander SA, Hennessy BT, Slingerland JM. Next-generation mTOR inhibitors in clinical oncology: how pathway complexity informs therapeutic strategy. J Clin Invest. 2011;121:1231–1241. doi: 10.1172/JCI44145. [DOI] [PMC free article] [PubMed] [Google Scholar]
- 12.Guertin DA, Sabatini DM. Defining the role of mTOR in cancer. Cancer Cell. 2007;12:9–22. doi: 10.1016/j.ccr.2007.05.008. [DOI] [PubMed] [Google Scholar]
- 13.Villanueva A, Chiang DY, Newell P, Peix J, Thung S, Alsinet C, Tovar V, Roayaie S, Minguez B, Sole M, Battiston C, Van Laarhoven S, Fiel MI, Di Feo A, Hoshida Y, Yea S, Toffanin S, Ramos A, Martignetti JA, Mazzaferro V, Bruix J, Waxman S, Schwartz M, Meyerson M, Friedman SL, Llovet JM. Pivotal role of mTOR signaling in hepatocellular carcinoma. Gastroenterology. 2008;135:1972–1983. 1983.e1–11. doi: 10.1053/j.gastro.2008.08.008. [DOI] [PMC free article] [PubMed] [Google Scholar]
- 14.Janku F, Kaseb AO, Tsimberidou AM, Wolff RA, Kurzrock R. Identification of novel therapeutic targets in the PI3K/AKT/mTOR pathway in hepatocellular carcinoma using targeted next generation sequencing. Oncotarget. 2014;5:3012–3022. doi: 10.18632/oncotarget.1687. [DOI] [PMC free article] [PubMed] [Google Scholar]
- 15.Willems L, Tamburini J, Chapuis N, Lacombe C, Mayeux P, Bouscary D. PI3K and mTOR signaling pathways in cancer: new data on targeted therapies. Curr Oncol Rep. 2012;14:129–138. doi: 10.1007/s11912-012-0227-y. [DOI] [PubMed] [Google Scholar]
- 16.Benjamin D, Colombi M, Moroni C, Hall MN. Rapamycin passes the torch: a new generation of mTOR inhibitors. Nat Rev Drug Discov. 2011;10:868–880. doi: 10.1038/nrd3531. [DOI] [PubMed] [Google Scholar]
- 17.Faivre S, Kroemer G, Raymond E. Current development of mTOR inhibitors as anticancer agents. Nat Rev Drug Discov. 2006;5:671–688. doi: 10.1038/nrd2062. [DOI] [PubMed] [Google Scholar]
- 18.Zhu AX, Abrams TA, Miksad R, Blaszkowsky LS, Meyerhardt JA, Zheng H, Muzikansky A, Clark JW, Kwak EL, Schrag D, Jors KR, Fuchs CS, Iafrate AJ, Borger DR, Ryan DP. Phase 1/2 study of everolimus in advanced hepatocellular carcinoma. Cancer. 2011;117:5094–5102. doi: 10.1002/cncr.26165. [DOI] [PMC free article] [PubMed] [Google Scholar]
- 19.Decaens T, Luciani A, Itti E, Hulin A, Roudot-Thoraval F, Laurent A, Zafrani ES, Mallat A, Duvoux C. Phase II study of sirolimus in treatment-naive patients with advanced hepatocellular carcinoma. Dig Liver Dis. 2012;44:610–616. doi: 10.1016/j.dld.2012.02.005. [DOI] [PubMed] [Google Scholar]
- 20.Cloughesy TF, Yoshimoto K, Nghiemphu P, Brown K, Dang J, Zhu S, Hsueh T, Chen Y, Wang W, Youngkin D, Liau L, Martin N, Becker D, Bergsneider M, Lai A, Green R, Oglesby T, Koleto M, Trent J, Horvath S, Mischel PS, Mellinghoff IK, Sawyers CL. Antitumor activity of rapamycin in a Phase I trial for patients with recurrent PTEN-deficient glioblastoma. PLoS Med. 2008;5:e8. doi: 10.1371/journal.pmed.0050008. [DOI] [PMC free article] [PubMed] [Google Scholar]
- 21.Feldman ME, Apsel B, Uotila A, Loewith R, Knight ZA, Ruggero D, Shokat KM. Active-site inhibitors of mTOR target rapamycin-resistant outputs of mTORC1 and mTORC2. PLoS Biol. 2009;7:e38. doi: 10.1371/journal.pbio.1000038. [DOI] [PMC free article] [PubMed] [Google Scholar]
- 22.Hsieh AC, Costa M, Zollo O, Davis C, Feldman ME, Testa JR, Meyuhas O, Shokat KM, Ruggero D. Genetic dissection of the oncogenic mTOR pathway reveals druggable addiction to translational control via 4EBP-eIF4E. Cancer Cell. 2010;17:249–261. doi: 10.1016/j.ccr.2010.01.021. [DOI] [PMC free article] [PubMed] [Google Scholar]
- 23.Pike KG, Malagu K, Hummersone MG, Menear KA, Duggan HM, Gomez S, Martin NM, Ruston L, Pass SL, Pass M. Optimization of potent and selective dual mTORC1 and mTORC2 inhibitors: the discovery of AZD8055 and AZD2014. Bioorg Med Chem Lett. 2013;23:1212–1216. doi: 10.1016/j.bmcl.2013.01.019. [DOI] [PubMed] [Google Scholar]
- 24.Sun SY. mTOR kinase inhibitors as potential cancer therapeutic drugs. Cancer Lett. 2013;340:1–8. doi: 10.1016/j.canlet.2013.06.017. [DOI] [PMC free article] [PubMed] [Google Scholar]
- 25.Cuyas E, Corominas-Faja B, Joven J, Menendez JA. Cell cycle regulation by the nutrient-sensing mammalian target of rapamycin (mTOR) pathway. Methods Mol Biol. 2014;1170:113–144. doi: 10.1007/978-1-4939-0888-2_7. [DOI] [PubMed] [Google Scholar]
- 26.Wan G, Xie W, Liu Z, Xu W, Lao Y, Huang N, Cui K, Liao M, He J, Jiang Y, Yang BB, Xu H, Xu N, Zhang Y. Hypoxia-induced MIR155 is a potent autophagy inducer by targeting multiple players in the MTOR pathway. Autophagy. 2014;10:70–79. doi: 10.4161/auto.26534. [DOI] [PMC free article] [PubMed] [Google Scholar]
- 27.Wang M, Miller RA. Fibroblasts from long-lived mutant mice exhibit increased autophagy and lower TOR activity after nutrient deprivation or oxidative stress. Aging Cell. 2012;11:668–674. doi: 10.1111/j.1474-9726.2012.00833.x. [DOI] [PMC free article] [PubMed] [Google Scholar]
- 28.Buss SJ, Muenz S, Riffel JH, Malekar P, Hagenmueller M, Weiss CS, Bea F, Bekeredjian R, Schinke-Braun M, Izumo S, Katus HA, Hardt SE. Beneficial effects of Mammalian target of rapamycin inhibition on left ventricular remodeling after myocardial infarction. J Am Coll Cardiol. 2009;54:2435–2446. doi: 10.1016/j.jacc.2009.08.031. [DOI] [PubMed] [Google Scholar]
- 29.Cao Y, Klionsky DJ. Physiological functions of Atg6/Beclin 1: a unique autophagy-related protein. Cell Res. 2007;17:839–849. doi: 10.1038/cr.2007.78. [DOI] [PubMed] [Google Scholar]
- 30.Gulhati P, Bowen KA, Liu J, Stevens PD, Rychahou PG, Chen M, Lee EY, Weiss HL, O’Connor KL, Gao T, Evers BM. mTORC1 and mTORC2 regulate EMT, motility, and metastasis of colorectal cancer via RhoA and Rac1 signaling pathways. Cancer Res. 2011;71:3246–3256. doi: 10.1158/0008-5472.CAN-10-4058. [DOI] [PMC free article] [PubMed] [Google Scholar]
- 31.Lamouille S, Xu J, Derynck R. Molecular mechanisms of epithelial-mesenchymal transition. Nat Rev Mol Cell Biol. 2014;15:178–196. doi: 10.1038/nrm3758. [DOI] [PMC free article] [PubMed] [Google Scholar]
- 32.Choo AY, Yoon SO, Kim SG, Roux PP, Blenis J. Rapamycin differentially inhibits S6Ks and 4E-BP1 to mediate cell-type-specific repression of mRNA translation. Proc Natl Acad Sci U S A. 2008;105:17414–17419. doi: 10.1073/pnas.0809136105. [DOI] [PMC free article] [PubMed] [Google Scholar]
- 33.Thoreen CC, Kang SA, Chang JW, Liu Q, Zhang J, Gao Y, Reichling LJ, Sim T, Sabatini DM, Gray NS. An ATP-competitive mammalian target of rapamycin inhibitor reveals rapamycin-resistant functions of mTORC1. J Biol Chem. 2009;284:8023–8032. doi: 10.1074/jbc.M900301200. [DOI] [PMC free article] [PubMed] [Google Scholar]
- 34.Shao H, Gao C, Tang H, Zhang H, Roberts LR, Hylander BL, Repasky EA, Ma WW, Qiu J, Adjei AA, Dy GK, Yu C. Dual targeting of mTORC1/C2 complexes enhances histone deacetylase inhibitor-mediated anti-tumor efficacy in primary HCC cancer in vitro and in vivo. J Hepatol. 2012;56:176–183. doi: 10.1016/j.jhep.2011.07.013. [DOI] [PubMed] [Google Scholar]
- 35.Jacinto E, Facchinetti V, Liu D, Soto N, Wei S, Jung SY, Huang Q, Qin J, Su B. SIN1/MIP1 maintains rictor-mTOR complex integrity and regulates Akt phosphorylation and substrate specificity. Cell. 2006;127:125–137. doi: 10.1016/j.cell.2006.08.033. [DOI] [PubMed] [Google Scholar]
- 36.Guertin DA, Stevens DM, Thoreen CC, Burds AA, Kalaany NY, Moffat J, Brown M, Fitzgerald KJ, Sabatini DM. Ablation in mice of the mTORC components raptor, rictor, or mLST8 reveals that mTORC2 is required for signaling to Akt-FOXO and PKCalpha, but not S6K1. Dev Cell. 2006;11:859–871. doi: 10.1016/j.devcel.2006.10.007. [DOI] [PubMed] [Google Scholar]
- 37.Willems L, Chapuis N, Puissant A, Maciel TT, Green AS, Jacque N, Vignon C, Park S, Guichard S, Herault O, Fricot A, Hermine O, Moura IC, Auberger P, Ifrah N, Dreyfus F, Bonnet D, Lacombe C, Mayeux P, Bouscary D, Tamburini J. The dual mTORC1 and mTORC2 inhibitor AZD8055 has anti-tumor activity in acute myeloid leukemia. Leukemia. 2012;26:1195–1202. doi: 10.1038/leu.2011.339. [DOI] [PubMed] [Google Scholar]
- 38.Yu K, Shi C, Toral-Barza L, Lucas J, Shor B, Kim JE, Zhang WG, Mahoney R, Gaydos C, Tardio L, Kim SK, Conant R, Curran K, Kaplan J, Verheijen J, Ayral-Kaloustian S, Mansour TS, Abraham RT, Zask A, Gibbons JJ. Beyond rapalog therapy: preclinical pharmacology and antitumor activity of WYE-125132, an ATP-competitive and specific inhibitor of mTORC1 and mTORC2. Cancer Res. 2010;70:621–631. doi: 10.1158/0008-5472.CAN-09-2340. [DOI] [PubMed] [Google Scholar]
- 39.Jewell JL, Russell RC, Guan KL. Amino acid signalling upstream of mTOR. Nat Rev Mol Cell Biol. 2013;14:133–139. doi: 10.1038/nrm3522. [DOI] [PMC free article] [PubMed] [Google Scholar]
- 40.Puissant A, Robert G, Auberger P. Targeting autophagy to fight hematopoietic malignancies. Cell Cycle. 2010;9:3470–3478. doi: 10.4161/cc.9.17.13048. [DOI] [PubMed] [Google Scholar]
- 41.Liu L, Li F, Cardelli JA, Martin KA, Blenis J, Huang S. Rapamycin inhibits cell motility by suppression of mTOR-mediated S6K1 and 4E-BP1 pathways. Oncogene. 2006;25:7029–7040. doi: 10.1038/sj.onc.1209691. [DOI] [PubMed] [Google Scholar]
- 42.Zhang F, Zhang X, Li M, Chen P, Zhang B, Guo H, Cao W, Wei X, Cao X, Hao X, Zhang N. mTOR complex component Rictor interacts with PKCzeta and regulates cancer cell metastasis. Cancer Res. 2010;70:9360–9370. doi: 10.1158/0008-5472.CAN-10-0207. [DOI] [PubMed] [Google Scholar]
- 43.Lamouille S, Connolly E, Smyth JW, Akhurst RJ, Derynck R. TGF-beta-induced activation of mTOR complex 2 drives epithelial-mesenchymal transition and cell invasion. J Cell Sci. 2012;125:1259–1273. doi: 10.1242/jcs.095299. [DOI] [PMC free article] [PubMed] [Google Scholar]
- 44.Kessenbrock K, Plaks V, Werb Z. Matrix metalloproteinases: regulators of the tumor microenvironment. Cell. 2010;141:52–67. doi: 10.1016/j.cell.2010.03.015. [DOI] [PMC free article] [PubMed] [Google Scholar]
- 45.Padua D, Massague J. Roles of TGFbeta in metastasis. Cell Res. 2009;19:89–102. doi: 10.1038/cr.2008.316. [DOI] [PubMed] [Google Scholar]
- 46.Lamouille S, Derynck R. Cell size and invasion in TGF-beta-induced epithelial to mesenchymal transition is regulated by activation of the mTOR pathway. J Cell Biol. 2007;178:437–451. doi: 10.1083/jcb.200611146. [DOI] [PMC free article] [PubMed] [Google Scholar]