Abstract
Distant metastasis is one of the most common causes for failure in treatment of advanced NSCLC, and it is a key factor to determine the patients’ prognosis. This study aims to screen the microRNAs associated with non-small cell lung cancer metastasis, so as to provide theoretical basis for investigating their roles in non-small cell lung cancer metastasis. In this study, the fluorescent transfected human non-small cell lung cancer cell lines H460 developed tumors subcutaneously, which were then in situ transplanted into the left lung of nude mice to obtain the tissue specimens of primary tumor and metastatic tumor. The differentially expressed microRNAs associated with non-small cell lung cancer metastasis were identified using the microRNA microarray and real-time quantitative polymerase chain reaction (RT-PCR) analysis, and bioinformatics analysis of the microRNAs was performed. The microarray analysis results revealed that 17 microRNAs with up-regulated expression and 7 with down-regulated expression between the non-small cell lung cancer metastatic primary loci and the non-metastatic primary loci (Group A), while 20 microRNAs with up-regulated expression (ratio > 1.5 times, P < 0.05) and 16 with down-regulated expression (ratio < 0.65 times, P < 0.05) between the non-small cell lung cancer metastatic loci and the metastatic primary loci (Group B). RT-PCR validation and bioinformatics analysis of some microRNAs identified 2 microRNAs with up-regulated expression, miR-10b and miR-144, and 3 microRNAs with down-regulated expression, miR-9, miR-31 and miR-34b in Group A; and 4 microRNAs with down-regulated expression, miR-25, miR-92a, miR-202 and miR-326 in Group B, which may be mediated by transcription factors activator protein 1 (AP-1), p53, STATs and NF-κB, regulate cell development, proliferation and cycle, DNA and RNA metabolism and signal transduction pathway, and promote tumor growth and metastasis through the effects on target genes like RARβ, RASSF1 and E2F-1. In conclusion, there are differences in microRNA expression between the non-small cell lung cancer metastatic and non-metastatic tissues, which provides experimental basis for exploring the mechanism of non-small cell lung cancer metastasis and provides a potential idea for molecular diagnosis and treatment, as well as prognosis.
Keywords: Non-small cell lung cancer, metastasis, microRNA, microarray, nude mouse model, target gene
Introduction
The incidence of lung cancer ranks second among malignant tumors worldwide, but it is the leading cause responsible for death of malignant tumors. Non-small cell lung cancer (NSCLC) is the most common, accounting for about 80% of all lung cancer. The disease has a low rate of early diagnosis, and local and distant metastases are detected in 75% of the cases while clinically diagnosed. Lymph node metastasis is an important prediction index for clinical staging and prognosis assessment, which suggests high tumor malignancy and poor prognosis [1,2]. Mountain and Dresler [2] investigated the relationship between lymph node metastasis and post-surgical survival, and revealed that lymph node metastasis indicated high tumor malignancy and poor prognosis, the patients usually did not die of primary loci-induced symptoms, but die of the related complications caused by metastatic loci, such as brain metastasis, the compression and infringement of mediastinal lymph node metastasis on adjacent organs, or the malignant pleural effusion caused by pleural metastasis. Currently, a great deal of advances has been achieved in molecular pathogenesis of NSCLC. However, only 1/8 of the patients are cured at an early stage, while other cases fail to be cured due to distant metastasis [3]. Distant metastasis is one of the most common causes for failure in treatment of advanced NSCLC, and it is a key factor to determine the patients’ prognosis. It is therefore, of great importance to explore the mechanism of NSCLC metastasis and the strategy to block the metastasis of the disease.
Multiple mechanisms are involved in tumor metastasis, which is an indicator for tumor malignancy. Tumor cells firstly bind with extracellular matrix adhesion protein. Subsequently, secreted proteases hydrolyze the matrix and migrate from the primary loci. Some cancer cells penetrate the endothelial basement membrane into the lymphatic vessels and blood vessels, migrate to new organs via the circulation, attach to vascular endothelial cells and stick out to form metastatic loci. Many mechanisms including factors-promoting mechanism, signal pathway mechanism, adhesion mechanism, extracellular matrix degradation mechanism, metastatic gene regulation mechanism, are involved in the process of metastasis. Target of tumor metastasis is the current research focus. With the deepening of research in microRNA (miRNA), it is indicated that post-transcriptional regulation is widely present in organisms. miRNAs are single-strand small-molecule RNAs with 21-24 nucleotides, which are involved in cell proliferation, differentiation, apoptosis, embryo development, morphogenesis and disease occurrence during the process of cell growth and development. It is estimated that about 1/3 of human genes are mediated by miRNAs, which negatively regulate gene expression by interfering with mRNA translation [4]. Each miRNA has many target genes, while several miRNAs may regulate the same gene. About 50% of the identified miRNAs are located at tumor-associated fragile sites in a genome [5]. Some miRNAs can function as oncogenes like miR-21, miR-155 and miR-17-92 gene cluster, and tumor suppressors such as miR-125b-1, miR-15a, miR-16-1, miR-143 and miR-145 [6]. During different stages of NSCLC occurrence and development, whether the invasion and metastasis of the disease is mediated by miRNAs remains unknown. It is assumed that the differentially expressed miRNAs between the metastatic primary loci and non-metastatic primary loci suggest the regulation of the beginning of metastasis, and the differentially expressed miRNAs between the metastatic loci and metastatic primary loci indicate the regulation of the metastasis.
To obtain the specimens of metastatic foci is critical to investigate the role of lung cancer metastasis-related miRNAs. Given that surgery is not recommended for the traditional stage IIIB-IV patients with NSCLC classified according to the taxonomy of cancer staging (TNM) system, it is difficult to obtain the specimens of metastatic foci. Although the NSCLC cases with stage earlier than IIIA are able to undergo surgery, the need of standard pathological examinations in clinical practices greatly limits the collection of the specimen of metastatic lymph node used for laboratory experiments, leading to the entry of previous studies with aim to explore the mechanism of lung cancer metastasis into a bottleneck. Therefore, the present study established animal models to obtain the specimen of lung cancer metastasis. Animal model is an important approach to conduct tumor study. Previously, nude mouse models of subcutaneous transplantation of lung cancer have been widely used, however, distant metastasis is rarely observed in this model. Since 1990s, the orthotopic implantation nude mouse models of human tumors have been sequentially established, which present the growth and metastasis similar to the clinical characteristics of human tumors. Replication of animal models of human tumors is able to study the in vivo tumor occurrence and development, which provides experimental basis for demonstrating the mechanism of tumor metastasis. The development of molecular imaging makes the real-time non-invasive in-vivo imaging of small animal tumor models possible [7,8]. Optical imaging, due to non-ionizing low-energy radiation, high sensitivity, no need of radioactive reagent and low cost of the imaging system, is particularly suitable for the research of small animal tumors. Green fluorescent protein (GFP), as a new generation of reporter gene, has been widely applied in the biomedical sciences. GFP-based in vivo fluorescence imaging can be used to reveal the cellular and molecular mechanisms of tumor occurrence and development. Yang et al. [9,10] employed whole-body optical imaging system for real-time, non-invasive fluorescence imaging of GFP-expressing tumors, and recording the process of tumor metastasis. The whole-body optical imaging system is external and noninvasive, and it is very sensitive and rapid for detection of soft organs and bone metastatic cancer [9]. Currently, GFP-expressing tumors of the lung, prostate, melanoma, colon, pancreas, breast, ovary, brain, and other organs have also been visualized externally by use of quantitative transcutaneous whole-body fluorescence imaging [11], and metastatic mouse model has been established (Anti-cancer Inc., http://www.metamouse.com/). Currently, the studies regarding metastatic mouse model mainly focus on tumor growth, there are few literatures regarding the tumor metastasis, and there are few studies reporting the NSCLC metastasis-related miRNAs using metastatic mouse models.
The present study used nude mice and large cell lung cancer cell lines H460 to establish orthotopic implantation animal models of lung cancer [12], to stimulate the process of natural occurrence of NSCLC and obtain specimens for miRNA microarray analysis, with aim to identify some metastasis-related miRNA markers, so as to investigate the possible mechanisms preliminarily.
Materials and methods
Animals
Forty-six 4-6 weeks aged nude mice of the BALB/c strain (23 males and 23 females), each weighing 18-22 g, were purchased from the Nanjing General Hospital of Nanjing Military Command (Nanjing, China; Certificate No. SCXK-(Jun) 2007-012). All nude mice were raised and all experiments were conducted under SPF-level barrier system.
Tumor cell line
The frozen NCI-H460 cells were obtained from the American Type Culture Collection (ATCC number: HTB-177TM), which were K-ras mutant and p53 wild human large cell lung cancer cell lines. The cells were cultured in RPMI-1640 (containing 10% fetal calf serum, 100 U/ml penicillin sodium and 100 μg/ml streptomycin) containing 10% fetal bovine serum at 37°C in an absolute humidity environment containing 5% CO2.
GFP retroviral expression vector and transfection of tumor cells
At 24 h before transfection, the cell culture solution for H460 cells was changed (cell density of 20%-40%). The packaging cell line RetroPackTM PT67 (Clontech Laboratories Inc., USA) containing pLPCX-GFP retroviral expression vector was cultured in RPMI-1640 medium. At 24 h before transfection, the culture solution for PT67 cells was changed. When the density of PT67 packaging cells reached 80%-90%, cells were centrifuged, and the supernatant containing pLPCX-GFP vector was isolated, which was then filtrated through the nitrocellulose (NC) membrane with a mesh size of 0.45 µm to remove the bacteria. 100 μl of the supernatant (containing about 5 × 10⁶ pLPCX-GFP) was added into the tumor cell culture plates (containing about 105-106 cells), and the tumor cells were transfected at at 37°C under a condition containing 5% CO2. After 24 h of transfection, the culture solution was changed, and transfection was performed 3 times within 72 h to increase the transfection efficiency and copy. The transfection efficiency was observed under a fluorescence microscope. After 72 h of transfection, cells were harvested and transferred to the selective medium containing 200 μg/ml G418 (Gibco, USA), and the concentration of G418 gradually increased to 2000 μg/ml. The high-level GFP-expressing cells were screened in the 96-well plates, and the screened clones were mixed, and cultured in media without G418. The monoclonal screening of high-level GFP-expressing cells (H460-GFP) was done in G418 for 10 passages to ensure the stable expression of fluorescent protein.
Subcutaneous implantation of lung cancer cells on nude mice
About 1 × 10⁶ H460-GFP cells were injected subcutaneously into the right side of the back of 2 nude mice. The post-seeding growth time was about 30-40 days. Many pre-tests for detection of cell cycle, fluorescence distribution curve and fluorescence rate by flow cytometry revealed that, when the diameter of the subcutaneous tumor of H460-GFP cells developed to 5-10 mm, cells grew well, almost during the logarithmic growth phase, and the fluorescence intensity became remarkably high, which were suitable for transplantation.
Orthotopic implantation of tumor tissues
The subcutaneous tumor was divided into tissue fragments measuring 1.0 mm × 1.0 mm × 1.0 mm in culture solutions, which were used as transplantation materials. The nude mice were anesthetized with 2.5% isoflurane, and the anesthesia was sustained using 1.5% isoflurane. Transverse incisions of about 1 cm long were cut on the left chest between the fourth and fifth rib of the nude mice using surgical scissors under a surgical operating microscope at a magnification of 8x. The muscle between the fourth and fifth rib was cut, crossing the parietal pleura, and the lung tissues were exposed. Two H460-GFP tumor tissues were seamed on the surface of the lower lobe of the left lung tissue using the surgery sutures 8-0. In order to prevent the direct contact of the transplanted tissues with the thoracic cavity of nude mice, the surface of the lower lobe of the left lung was covered with the upper or middle lobe of the left lung. Finally, the thoracic cavity was closed using the surgery sutures 5-0. The entire open thoracotomy was not less than 1 min, and strictly followed aseptic principles.
Observation on animal experiment and collection of specimen
The survival and tumor growth of nude mice was observed every other day. In-vivo fluorescence imaging system is consisted of a stereo microscope (ZOOM645S, Jiangnan Yucheng Optical Instrument Co., Ltd, China) installed with 510-540 nm emission filters, charge-coupled device (CCD, Retiga Exi cooled Digital Color, QIMAGING, USA) and fluorescence excitation apparatus (LG-150-A, Nanjing Chaoteng Sci-Tech Development Co., Ltd, China) installed with 470-490 nm excitation filters. The imaging analysis software was the Image-Pro supplied by the MediaCybernetics Company (USA). The longitudinal diameter and transverse diameter of the primary tumor on the nude mice were measured under a fluorescence imaging system, and the tumor volume was calculated using the software Image-Pro, and the picture of tumor was photographed at a resolution of 1392 × 1040 pixels.
Plenty of pre-tests showed the occurrence of metastasis when the volume of the transplanted tumor on the thoracic cavity of nude mice grew to 150-200 mm3, and the incidence of metastasis was about 70% when the tumor volume reached more than 1000 mm3. The primary transplanted lesions were observed using the in-vivo fluorescence imaging system, and the size was measured every other day. The nude mice with extreme emaciation and poor activity were first sacrificed. According to the present study design, metastasis was detected in about half of the sacrificed nude mice. Therefore, in the present study, the nude mice were sacrificed at 2 weeks after orthotopic implantation, when the size of the primary transplanted tumor was about 200 mm3, and most of the specimens collected were non-metastatic, and then a batch of nude mice were sacrificed every other week. On day 30 after orthotopic implantation, most of the left nude mice became remarkably emaciated, with significant reduction in activity, and outward expansion of the tumor mass on the left chest wall was observed by nude eyes, most of the tumors measured more than 1000 mm3, and metastasis was detected in most of the dead mice. The thoracic cavity was opened, postmortem examination was performed, and the transplanted tumor on the left lung was recorded under the fluorescence imaging system, and the size and metastases of the contralateral lung, lymph node, liver, kidney, brain and bone of the primary tumor were observed. The primary and metastatic lesions of the tumors were quickly cut, and stored in liquid nitrogen at -196°C, 2-3 h later, they were stored at -80°C. Somo lesions were fixed in 4% formaldehyde.
Pathological examination
The lesion specimens were embedded in paraffin wax, cut into sections and stained with hematoxylin and eosin (HE) in the Department of Pathology of Jiangsu Provincial People’s Hospital, and then the specimens were observed under a microscope, which was compared with the results revealed by the fluorescence imaging system.
RNA extraction
Four pairs of nude mice specimens with and without metastases (if the same nude mice had multiple metastases, all metastatic foci were considered as a specimen) were sampled from the aforementioned frozen tissues, including 4 primary lesions on non-metastatic nude mice, and 4 primary and metastatic lesions on metastatic nude mice. The frozen specimen were crashed, and then added with Trizol reagent (Invitrogen). After homogenating, RNA was extracted.
Assessment of RNA quality
The ratios of the absorbance at 260 nm (A 260) to the absorbance at 260 nm (A 280) of the RNA solution were between 1.9 and 2.1, indicating no protein pollution. Two clear bands of 28S and 18S of total RNA were observed under the ultraviolet light following 0.75% formaldehyde denaturing agarose gel electrophoresis, suggesting no RNA degradation and DNA pollution.
Microarray hybridization
The miRCURY LNATM (Locked Nucleic Acid) microRNA version 11.0 microarray (Exiqon, Denmark, http://www.exiqon.com/microrna-microarray-analysis) covered all miRNAs of humans, mice and rats in the miRBase 10.0 database (http://www.mirbase.org). Another 140 miRPlusTM probes were increased besides the miRBase database in the Exiqon microarray, and the number of probes reached 1300. The capture probes based on locked nucleic acid (LNA) technology were used, and each probe was repeated 4 times in the microarray, and the control probes included 12 small nuclear RNAs positive controls, 8 negative controls and 10 spike-in controls. miRNAs were labelled with Hy3TM or Hy5TM fluorescent groups using the miRCURYTM Array Power Labelling reagent kit to form fluorescent probes. A total of 13 microarrays were prepared for 12 specimens and their mixture, and the probes labelled with PhalanxTM heat shrinkable hybrid bags and the microarrays were hybridized under standard conditions.
Image collection and data analysis
The fluorescence intensity on the microarray was scanned using the Axon GenePix 4000B microarray scanner, and the original data were analyzed using the software GenePix pro version 6.0.
Screening of differentially expressed miRNAs
The background was removed from the signal value, and lowess and scale normalization was done. The ratio between groups > 1.5 times or < 0.65 times, and a P value < 0.05 revealed by t test indicated the miRNAs were differentially expressed. The ratio > 1.5 times was defined as up-regulation, while the ratio < 0.65 times was defined as down-regulation.
Bioinformatics analysis
The citation literatures were searched in NCBI-PubMed (http://www.ncbi.nlm.nih.gov/PubMed) using “non-small cell lung cancer” and “metastasis” as keywords. Based on over 5000 literatures, in combination with the recent studies regarding the mechanisms of NSCLC metastasis mediated by miRNAs, bioinformatics analysis of the differentially expressed miRNAs was performed.
Hierarchical clustering analysis
The expression values of the differentially expressed miRNAs were logarithm transformed, which were input into the hierarchical clustering algorithm. The distance chose “Pearson Correlation”, and the linkage selected “average” [13].
Prediction of target genes
The following common softwares were used for prediction of the target genes, and the result was obtained from the intersection [14-16]. PicTar 2005: http://pictar.mdc-berlin.de/cgi-bin/PicTar_vertebrate.cgi; miRanda V5: http://www.ebi.ac.uk/enright-srv/microcosm/htdocs/targets/v5/; TargetScan 5.1: http://www.targetscan.org/.
Gene ontology (GO) analysis of target genes
The GO database included three aspects of function information regarding the biological process with gene involvement, the position in cells and the molecular function, and the function concepts were organized to the directed acyclic graph (DAG) structure. In the gene expression profiling, GO was usually used for providing the background knowledge regarding gene function classification tags and gene function study. The two target gene clusters with up- and down-regulated expression were projected into various nodes in the GO database, and the gene number in each node was calculated. The GSEABase soft package in the R statistical program (http://www.r-project.org/) was used.
Pathway analysis of target genes
The target genes were projected into the KEGG pathway database using the software GenMAPP version 2.1, and the enrichment P-values of genes were calculated in each pathway.
Analysis of transcription factor binding sites
The 2500 bp upstream and 500 bp downstream of the transcriptional initiation site of all differentially expressed miRNAs were extracted. The transcription factor database TRANSFAC 7.0 public was used for analysis of initiator sequences. The transcription factor binding sites were predicted using the program patser (http://ural.wustl.edu/resources.html), and the relative score was set as > 0.9.
Regulatory network analysis
By integrating the regulation between miRNAs and target genes, and the mediation of miRNAs by transcription factors, the regulatory network among miRNAs, target genes and transcription factors was generated using the software Cytoscape (http://www.cytoscape.org/).
Real-time quantitative RT-PCR validation
According to the differentially expressed miRNAs with ratios between groups > 1.5 times or < 0.65 times screened by microarrays, in combination with the NSCLC metastasis regulation-related target genes and miRNAs revealed by bioinformatics analysis, some miRNAs were selected for real-time quantitative RT-PCR validation. RNA was extracted using the Trizol reagent kit, and reverse transcription reaction was performed for synthesis of cDNA on a PCR amplifier. Relative quantitative PCR detection was performed using the Sybergreen (Invitrogen) dye method on the ABI Prism 7900 Sequence Detection System. U6 was used as internal reference, each reaction was repeated 3 times, and the cycle threshold (Ct value) was expressed by the mean value. The PCR reaction condition was at 95°C for 5 min, with 40 cycles. Data were analyzed using the 2-ΔΔCt method.
Statistical analysis
The volumes of primary transplanted tumors were calculated in Table 1. All data were expressed as mean ± standard deviation (SD), and all statistical analyses were performed using the statistical software SPSS version 13.0. The data analyses and statistical analyses of miRNA microarray detection, bioinformatics analysis and real-time quantitative RT-PCR validation were described as above mentioned.
Table 1.
Growth and metastasis of the transplanted primary H460-GFP cells at different time after injection
| Day after transplantation (d) | No. of nude mice sacrificed | No. of nude mice with natural death | Volume of primary tumor (Mean ± SD, mm3) | No. of mice with mediastinal lymph node metastasis | No. of mice with right hilar lymph node metastasis | No. of mice with right lung metastasis | No. of mice with transverse septum metastasis | No. of mice with pericardial metastases | Total metastatic rate (%)* |
|---|---|---|---|---|---|---|---|---|---|
| 15 | 8 | 0 | 218.9 ± 24.7 | 2 | 1 | 0 | 0 | 0 | 3/8 |
| 23 | 4 | 0 | 677.4 ± 22.3 | 2 | 0 | 0 | 0 | 0 | 2/4 |
| 30 | 8 | 2 | 921.1 ± 37.8 | 6 | 3 | 2 | 1 | 1 | 6/10 |
| 37 | 14 | 2 | 1335.7 ± 38.4 | 11 | 5 | 2 | 1 | 0 | 11/16 |
| 45 | 2 | 1 | 2867.5 ± 34.9 | 2 | 1 | 1 | 0 | 0 | 3/3 |
Total metastatic rate (%) = No. of nude mice with metastases/No. of nude mice dissected × 100%.
Results
Fluorescent transfection of H460 cells
After 24-72 h of transfection, the H460-GFP lung cancer cells obtained by the PT67-pLPCX-GFP-transfected H460 cells emitted strong green fluorescence under blue light, and the positive rate of GFP expression was about 90% (Data not shown).
Growth and metastasis following orthotopic implantation on nude mice
Natural death was observed in 5 out of 46 nude mice prior to the sacrifice, and metastases were detected in all 5 mice by postmortem examination. Fluorescence imaging revealed local metastases in 3 nude mice, however, the pathological examinations of tissues in the corresponding sites showed no metastasis. Postmortem examination indicated free implantation in thoracic cavity of 2 nude mice; the mice with metastasis in upper organs of thoracic cavity were excluded. No metastases were detected in 16 nude mice by postmortem examination, and the left 20 nude mice had metastases on different organs indicated by postmortem examination, and their tissue specimens were collected. The nude mice with metastasis included multiple metastases, and all nude mice with metastases had mediastinal lymph node metastases (Table 1).
Anatomy of animal models
The anatomical figures of animal models were shown in Figure 1.
Figure 1.
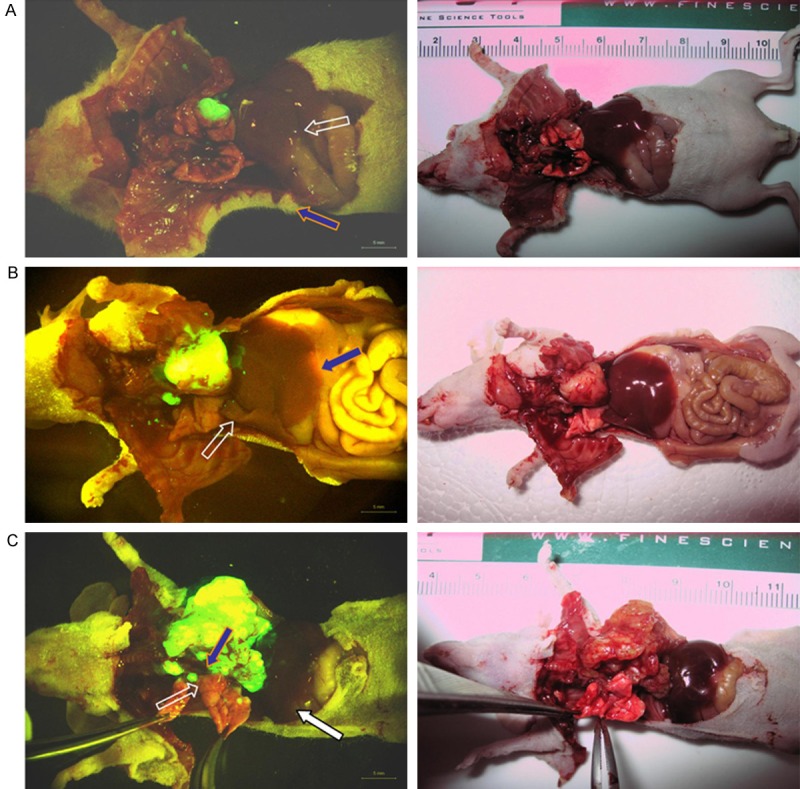
Nude mice with single or multiple metastatic foci under fluorescence stereo microscope and gross picture. A. The picture of nude mice without metastasis. The white hollow arrow shows the primary tumor on left lung, the blue solid indicates the normal right lung. B. The picture of nude mice with single metastatic foci. The yellow solid arrow shows the primary tumor on left lung, the white hollow arrow indicates the mediastinal lymph node metastatic foci. C. The picture of nude mice with multiple metastatic foci. The white hollow arrow shows the mediastinal lymph node metastatic foci, the blue solid arrow indicates the right hilar lymph node metastatic foci, and the white solid arrow indicates the metastatic foci on right lung.
Pathological examination
The pathological examinations of all 46 GFP-positive primary loci tissue specimens revealed low-differentiation carcinoma. Except that GFP was positive while pathological examination detected no infiltration of tumor cells in the mediastinal lymph node of a case, right hilar lymph node of a case and pericardial tissues of a case, the pathological examinations of the GFP-positive metastatic loci tissue specimens all revealed metastases (Figure 2). The coincidence rate between the fluorescence imaging and pathological examination was 92.3%.
Figure 2.
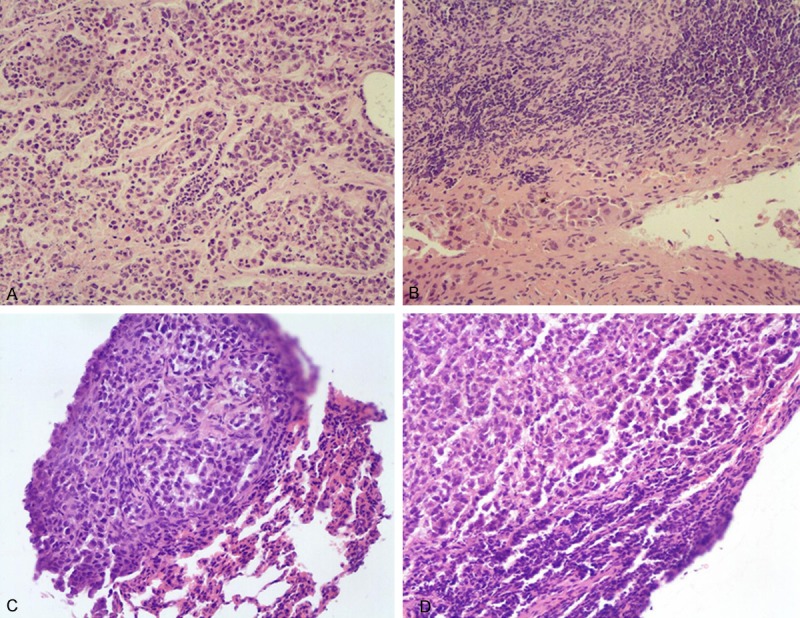
HE staining for the mediastinal lymph node metastatic foci under a microscope. A. HE staining of sections of the primary foci on the left lung (×200). B. HE staining of sections of the mediastinal lymph node metastatic foci (×200). C. HE staining of sections of the metastatic foci on the right lung (×200). D. HE staining of sections of the right hilar lymph node metastatic tumor (×200).
miRNA microarray analysis
In comparison to the primary lesions on the left lung of nude mice without metastases (Group A), there were 17 miRNAs with up-regulated expression and 7 miRNAs with down-regulated expression on the primary foci of the left lung of nude mice with metastases. Compared with the primary lesions on the left lung of nude mice with metastases (Group B), there were 20 miRNAs with up-regulated expression and 16 miRNAs with down-regulated expression on the metastatic foci on the nude mice with metastases (Table 2).
Table 2.
miRNAs expression determined using miRNA microarray
| microRNA name | Ratio in Group A | P value | Regulation |
| hsa-miR-9 | 0.513703 | 0.002219 | Down-regulation |
| hsa-miR-487b | 0.519319 | 0.001241 | Down-regulation |
| hsa-miR-302e | 0.539167 | 0.004202 | Down-regulation |
| hsa-miR-197 | 0.583689 | 0.005646 | Down-regulation |
| hsa-miR-34b | 0.594804 | 0.010702 | Down-regulation |
| hsa-miR-31 | 0.619606 | 0.000190 | Down-regulation |
| hsa-miR-374a | 0.633897 | 0.045309 | Down-regulation |
| hsa-miR-140-3p | 1.551432 | 0.049092 | Up-regulation |
| hsa-miR-129-5p | 1.552450 | 0.010142 | Up-regulation |
| hsa-miR-483-5p | 1.574305 | 0.042309 | Up-regulation |
| hsa-miR-296-5p | 1.631601 | 0.025065 | Up-regulation |
| hsa-miR-489 | 1.735225 | 0.026254 | Up-regulation |
| hsa-miR-299-5p | 1.853741 | 0.020911 | Up-regulation |
| hsa-miR-127-5p | 1.904299 | 0.009323 | Up-regulation |
| hsa-miR-378 | 2.041047 | 0.044381 | Up-regulation |
| hsa-miR-136 | 2.076979 | 0.029656 | Up-regulation |
| hsa-miR-490-5p | 2.366702 | 0.00188 | Up-regulation |
| hsa-miR-208a | 2.377387 | 0.008612 | Up-regulation |
| hsa-miR-202 | 2.704407 | 0.017291 | Up-regulation |
| hsa-miR-379 | 2.855973 | 0.032209 | Up-regulation |
| hsa-miR-144 | 2.891786 | 0.038692 | Up-regulation |
| hsa-miR-10b | 3.215242 | 0.019688 | Up-regulation |
| hsa-miR-205 | 3.299635 | 0.007460 | Up-regulation |
| hsa-miR-451 | 3.391433 | 0.027467 | Up-regulation |
|
| |||
|---|---|---|---|
| microRNA name | Ratio in Group B | P value | Regulation |
|
| |||
| hsa-miR-202 | 0.219985 | 0.000215 | Down-regulation |
| hsa-miR-296-5p | 0.347058 | 0.000084 | Down-regulation |
| hsa-miR-92a | 0.359559 | 0.006977 | Down-regulation |
| hsa-miR-326 | 0.373480 | 0.011006 | Down-regulation |
| hsa-miR-198 | 0.433532 | 0.007426 | Down-regulation |
| hsa-miR-489 | 0.459701 | 0.010411 | Down-regulation |
| hsa-miR-423-5p | 0.496108 | 0.001277 | Down-regulation |
| hsa-miR-147b | 0.498099 | 0.042430 | Down-regulation |
| hsa-miR-423-3p | 0.505681 | 0.001232 | Down-regulation |
| hsa-miR-129-5p | 0.515690 | 0.000107 | Down-regulation |
| hsa-miR-483-5p | 0.558565 | 0.018858 | Down-regulation |
| hsa-miR-339-3p | 0.565076 | 0.014175 | Down-regulation |
| hsa-miR-92b | 0.569215 | 0.030819 | Down-regulation |
| hsa-miR-484 | 0.595075 | 0.023668 | Down-regulation |
| hsa-miR-25 | 0.635789 | 0.017739 | Down-regulation |
| hsa-miR-492 | 0.644407 | 0.020063 | Down-regulation |
| hsa-let-7g | 1.500944 | 0.002003 | Up-regulation |
| hsa-miR-34b | 1.528312 | 0.022985 | Up-regulation |
| hsa-miR-494 | 1.535862 | 0.002241 | Up-regulation |
| hsa-miR-30e | 1.610943 | 0.041878 | Up-regulation |
| hsa-miR-497 | 1.644439 | 0.008635 | Up-regulation |
| hsa-let-7e | 1.655107 | 0.005946 | Up-regulation |
| hsa-miR-337-3p | 1.684633 | 0.003579 | Up-regulation |
| hsa-miR-338-5p | 1.729264 | 0.016106 | Up-regulation |
| hsa-miR-146b-5p | 1.736796 | 0.031588 | Up-regulation |
| hsa-miR-486-5p | 1.893567 | 0.014392 | Up-regulation |
| hsa-miR-490-3p | 1.964172 | 0.001443 | Up-regulation |
| hsa-miR-340 | 2.067369 | 0.001391 | Up-regulation |
| hsa-miR-495 | 2.103060 | 0.011562 | Up-regulation |
| hsa-miR-212 | 2.274477 | 0.012768 | Up-regulation |
| hsa-miR-302e | 2.291677 | 0.001529 | Up-regulation |
| hsa-miR-146b-3p | 2.304957 | 0.003745 | Up-regulation |
| hsa-miR-422a | 2.984432 | 0.048098 | Up-regulation |
| hsa-miR-297 | 2.984726 | 0.000832 | Up-regulation |
| hsa-miR-302f | 3.369296 | 0.028652 | Up-regulation |
| hsa-miR-491-3p | 4.137266 | 0.000168 | Up-regulation |
Bioinformatics analysis
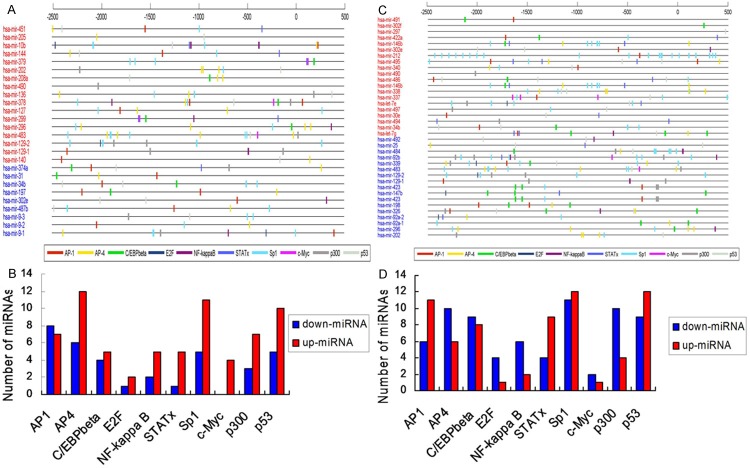
Hierarchical clustering analyses were performed in all differentially expressed miRNAs (Figure 3). The color indicated the intensity of signal value, the signal value increased sequentially from green, black, to red. A total of 128 genes were predicted in the intersection by the 3 softwares TargetScan + miRanda + PicTar in Group A, and these genes had a high possibility of being the real target genes. For example, it was highly possible that RARβ and E2F-1 played key roles in the initial mechanisms of NSCLC metastasis. In Group B, 63 genes were identified in the intersection predicted by the 3 softwares, and the genes like RASSF1, E2F-3 and TCF7L1 were highly possible to play critical roles in the mediation mechanisms of metastasis development (Figure 4). The differentially expressed genes were classified according to the 3 independent manners of biological process, cellular component and molecular function (Figure 5).
Figure 3.
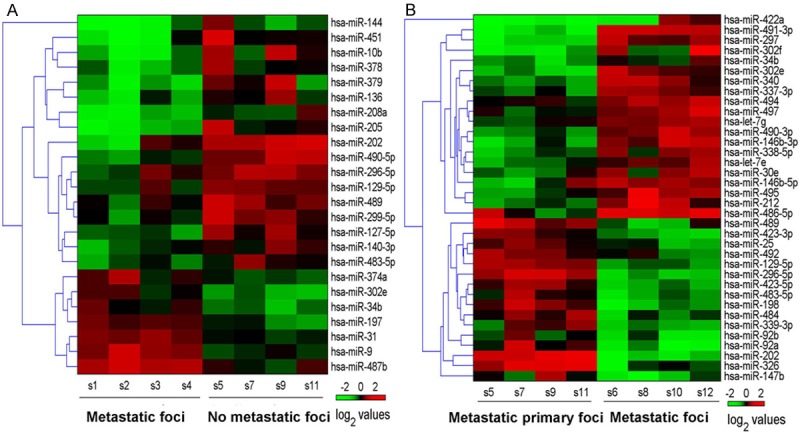
Hierarchical clustering map of the differentially expressed miRNAs in Group A (A) and Group B (B).
Figure 4.
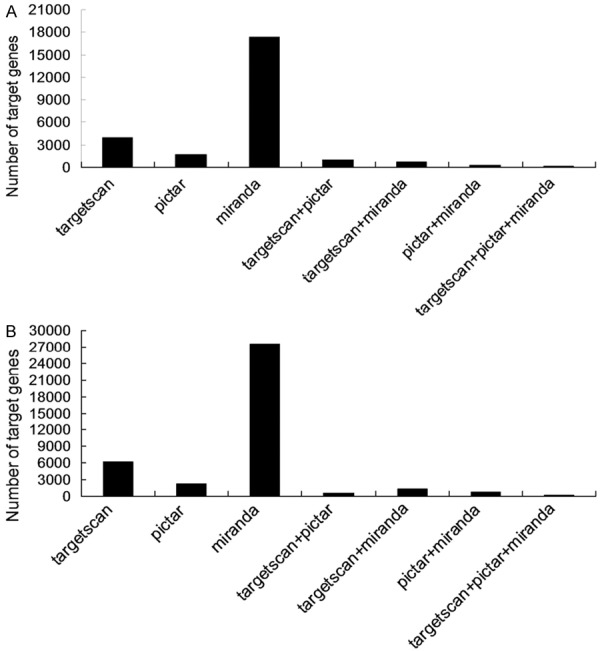
Prediction of target genes of the differentially expressed miRNAs in Group A (A) and Group B (B). Longitudinal axis is the number of target genes, horizontal axis is the prediction software used.
Figure 5.
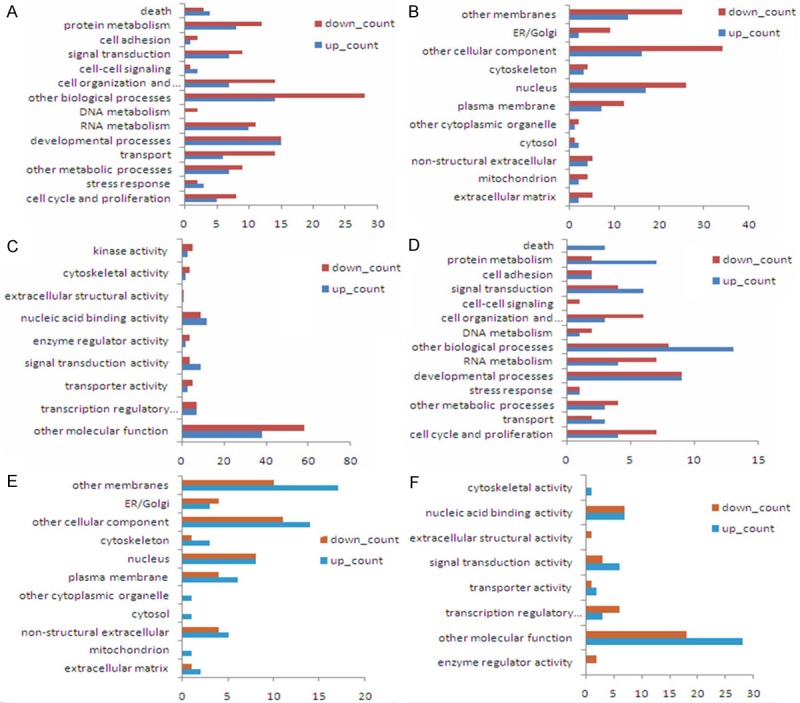
The biological process classification (A, D) cellular component classification (B, E) and molecular function classification (C, F) of target genes in groups A and B. Longitudinal axis is the category of gene functions, horizontal axis is the proportions of the number of target genes with this function in total number of target genes.
Pathway analysis detected 62 pathways in Group A, including 22 pathways with gene count ≥ 2, and retinoic acid receptor β (PARβ) and E2F1 were the target genes up-regulating miR-144 and miR-205, respectively in NSCLC-related signal pathway (Figure 6A). Pathway analysis observed 47 pathways in Group B, including 10 pathways with gene count ≥ 2, and RASSF1 and E2F3 were the target genes down-regulating miR-326 and miR-25, respectively in NSCLC-related signal pathway (Figure 6B). Analysis of transcription factor binding sites demonstrated that, the transcription factors like activator protein 1 (AP-1), p53, CEBPB, NF-κB, c-Myc and E2F may mediate the differentially expressed miRNAs in Group A, while the transcription factors like AP-1, AP-4, p53, NF-κB, E2F and SP-1 may mediate the differentially expressed miRNAs in Group B (Figure 7).
Figure 6.
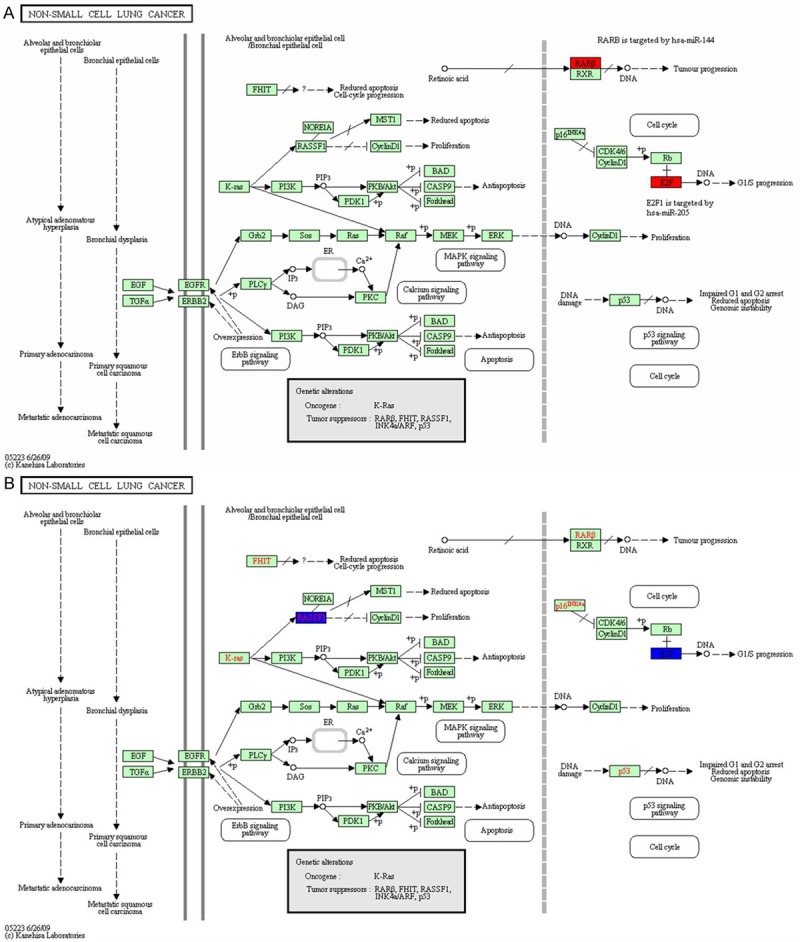
Pathway analysis in groups A (A) and B (B).
Figure 7.
Analysis of transcription factor loci (A, C) and distribution of related transcription factors (B, D) in groups A and B. In Figure 8B and 8D, longitudinal axis is the number of miRNAs regulated by transcription factors, horizontal axis is the name of the corresponding transcription factors.
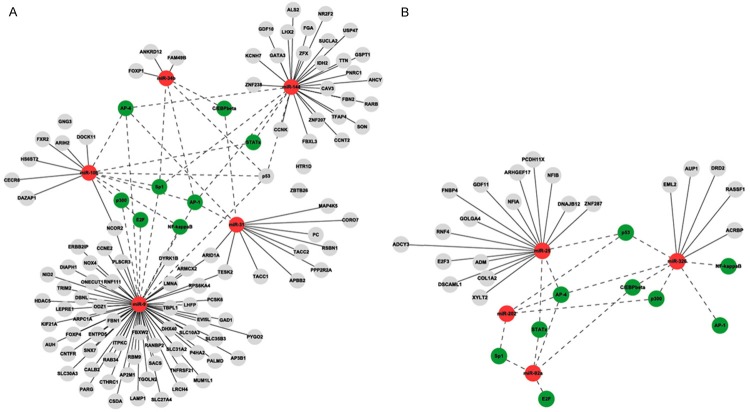
In the regulatory network map, the solid edge indicated the regulation of target genes by miRNAs, the dotted edge indicated the regulation of related miRNAs by transcription factors; while red nodes indicated miRNAs, green nodes indicated transcription factors and grey nodes indicated target genes (Figure 8).
Figure 8.
miRNAs regulation network in groups A (A) and B (B).
Real-time quantitative RT-PCR analysis
A total of 24 differentially expressed miRNAs were identified in Group A, while 36 were detected in Group B (Figure 1). The NSCLC-associated Pathway analysis revealed miR-144 and miR-205 in Group A and miR-25 and miR-326 in Group B and their corresponding target genes were possible to be involved in metastasis occurrence and development (Figure 6). The regulatory network demonstated that miR-10b, miR-34b, miR-144, miR-31, miR-9 from Group A and miR-25, miR-326, miR-202 and miR-92a from Group B were highly correlated with the metastasis-related target genes and transcription factors (Figure 8). Based on aforementioned results, combined with previous studies, miR-let-7 [17,18] and miR-205 [19,20] were involved in mediation of metastasis of many malignant tumors including NSCLC. Therefore, 6 miRNAs in Group A including miR-10b, miR-34b, miR-144, miR-31, miR-9 and miR-205, and 5 miRNAs in Group B including miR-25, miR-326, miR-202, miR-92a and miR-let-7e were selected for further real-time quantitative RT-PCR validation.
The corresponding tissue specimens from 16 nude mice without metastases and 20 nude mice with metastases were used from RT-PCR validation. The primers for RT-PCR analysis were designed using the software Primer 5.0, and synthesized by the Shanghai Invitrogen Bio-tech Co., Ltd (Shanghai, China), and the sequences of primers were listed in Table 3.
Table 3.
Primers for real-time quantitative PCR
| Gene name | Sequence of double-strand primers* |
|---|---|
| U6 | F: 5’-TGGGGTTATACATTGTGAGAGGA-3’, |
| R: 5’-GTGTGCTACGGAGTTCAGAGGTT-3’. | |
| hsa-miR-10b | F: 5’-GGATACCCTGTAGAACCGAA-3’, |
| R: 5’-CAGTGCGTGTCGTGGAGT-3’. | |
| hsa-miR-31 | F: 5’-GGAGGCAAGATGCTGGC-3’, |
| R: 5’-CAGTGCGTGTCGTGGAGT-3’. | |
| hsa-miR-205 | F: 5’-GCTCCTTCATTCCACCG-3’, |
| R: 5’-CAGTGCGTGTCGTGGAGT-3’. | |
| hsa-miR-144 | F: 5’-GGGGGTACAGTATAGATGAT-3’, |
| R: 5’-TGCGTGTCGTGGAGTC-3’. | |
| hsa-miR-9 | F: 5’-GGGTCTTTGGTTATCTAGC-3’, |
| R: 5’-TGCGTGTCGTGGAGTC-3’. | |
| hsa-miR-202 | F: 5’-GGGGAGAGGTATAGGGCA-3’, |
| R: 5’-CAGTGCGTGTCGTGGAGT-3’. | |
| hsa-let-7e | F: 5’-CAGTGCGTGTCGTGGAGT-3’, |
| R: 5’-CGGTGAGGTAGGAGGTTGTAT-3’. | |
| hsa-miR-34b | F: 5’-TGCGTGTCGTGGAGTC-3’, |
| R: 5’-GCGAATCACTAACTCCACT-3’. | |
| hsa-miR-25 | F: 5’-CCAGTGCGTGTCGTGGA-3’, |
| R: 5’-GGCATTGCACTTGTCTCG-3’. | |
| hsa-miR-326 | F: 5’-CCAGTGCGTGTCGTGG-3’, |
| R: 5’-CCTCTGGGCCCTTCCT-3’. | |
| hsa-miR-92a | F: 5’-ATCCAGTGCGTGTCGTG-3’, |
| R: 5’-GGTATTGCACTTGTCCCG-3’. |
F (Forward) is the corresponding miRNAs specific primer, R (Reverse) is the primer matched with RT-PCR primers.
The data from the real-time quantitative RT-PCR were analyzed using the 2-ΔΔCt method, and figures were generated based on the difference of gene expression among specimens (vertical coordinate) and the corresponding miRNAs (horizontal coordinate) (Figure 9). Figures were plotted based on the difference folds of miRNAs ratio (ratio > 1 was defined as up-regulation, ratio < 1 was defined as down-regulation) (vertical coordinate), and the corresponding miRNAs (horizontal coordinate). miRNA microarray analysis revealed consistent regulation in 6 miRNAs from Group A; in Group B, except that miR-let-7e expression was up-regulated in miRNA microarray but down-regulated in RTPCR, consistent regulation was observed in other 4 miRNAs (Figure 10).
Figure 9.
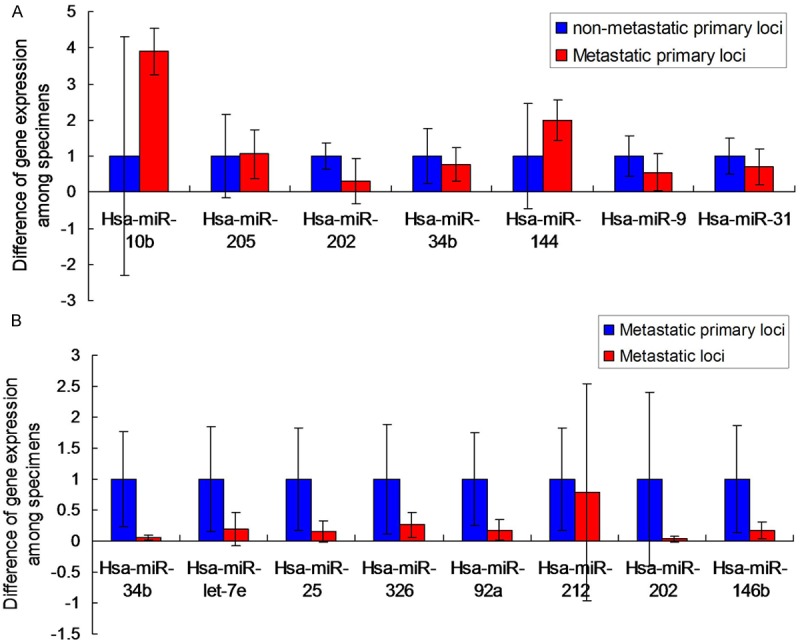
RT-PCR validation of samples from groups A (metastatic primary loci vs. non-metastatic primary loci) (A) and B (metastatic loci vs. metastatic primary loci) (B).
Figure 10.
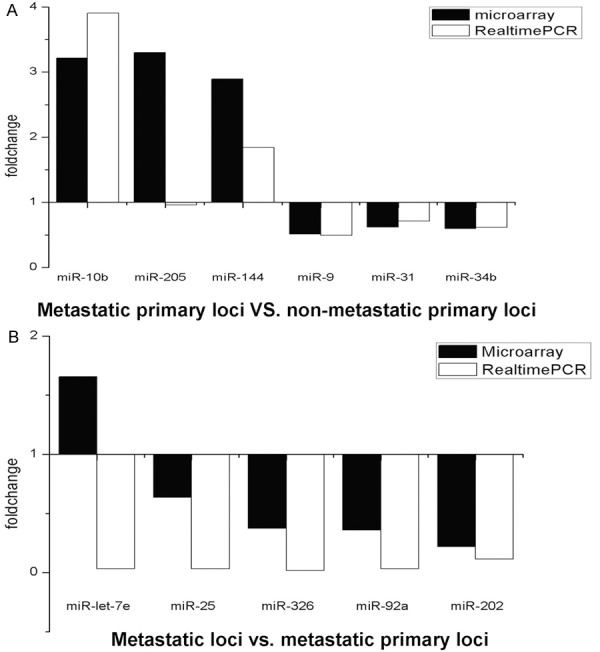
Comparison of miRNAs microarray and RT-PCR analysis of differentially expressed miRNAs in groups A (A) and B (B).
Discussion
Currently, GFP is one of the best in-vivo molecular markers, which is widely applied in studies at cellular and sub-cellular levels, notably in determination of the tumor volume and infiltration range. The present study used the GFP-transfected human large cell lung cancer cell line H460 to establish orthotopic implantation animal models of lung cancer, and carried out real-time and non-invasive observation on tumor growth in nude mice using the fluorescence stereo microscope, so as to accurately determine the tumor size and metastatic organs.
It has been demonstrated that miRNAs mediate the metastatic process of multiple malignant tumors. Ma et al. [21] observed miR-10b was involved in breast cancer invasion and metastasis. In colorectal and breast cancer cell lines with high metastatic characteristics, miR-21 functions through regulation of the tumor suppressor genes like PTEN, PDCD4 and TPM1 [9,22,23], and high expression of miR-21 is correlated with advanced staging of breast cancer and lymph node metastasis [24]. Upregulation of miR-373 and miR-520c inhibits CD44 expression, and thus promotes tumor invasion and metastasis [25]. miR-155 leads to increase in invasion of mammary epithelial cells through regulation of target gene RhoA [26]. Gregory et al. [18,27] reported that miR-200 family and miR-205 led to epithelial to mesenchymal transition (EMT), which was considered as an essential step in early tumor metastasis. Lujambio and colleagues [28] observed silencing of miRNAs with tumor suppressor features by DNA methylation caused tumor metastasis. It has been reported that miR-10b, miR-9, miR-31, miR-34b, miR-92a, miR-205 and miR-202 mediate metastases of malignant tumor like lung cancer, breast cancer, ovarian cancer, gastric cancer, prostate cancer and bladder cancer mainly through the mechanisms such as DNA methylation in the promoter region, EMT and signal transduction pathway. However, there are few studies reporting the roles of miR-25, miR-144 and miR-326 in tumor metastasis.
The target genes of the differentially expressed miRNAs were mainly involved in regulation of cell proliferation, cell cycle and development, DNA and/or RNA metabolism, and signal transduction pathway. Bioinformatics analysis of miRNAs and Pathway analysis (Figure 6A) and regulatory network analysis of target genes (Figure 8A) all indicated the target gene that up-regulated miR-144 expression may be PARβ, which bound with all-trans retinoic acid (ATRA) to mediate the effect of retinoic acid. Up-regulation of miR-144 inhibits the role of PARβ in blocking tumor cell metastasis, which is characterized in the following aspects. Angiogenesis is particularly important during the process of malignant tumor metastasis, and the new angiogenesis of tumor tissues is positively proportional to invasion and metastasis of cancer tissues. It has been shown that ATRA down-regulates tumor growth factor-beta (TGF-β) expression, and significantly inhibits the proliferation of vascular smooth muscle cells [29]. In addition, ATRA significantly reduces the synthesis of low collagen, fibronectin and laminin, leading to reduction of motility in tumor cells [30]. Immunosuppression caused by tumor is another important mechanism for escaping from immunological surveillance and the resultant invasion and infiltration. ATRA increases the killing ability of natural killer (NK) cells and lymphokine-activated killer (LAK) cells through inducing the differentiation of the immature bone marrow cells, improves tumor-specific immune response mediated by CD4+ and CD8+ cells, up-regulates the expression of RARα and RARβ in blood lymphocytes, promotes the expression of cytokines which play important roles in immune process and destroys the tumor cells in the circulatory system and the emerged minor metastatic lesions, leading to inhibition of occurrence and development of tumor metastasis [30,31]. The Pathway (Figure 6B) and regulatory network analyses (Figure 8B) of miRNAs and target genes all revealed the target gene which up-regulated miR-326 expression may be Ras association domain-containing protein family 1 (RASSF1), which is a novel tumor suppressor gene cloned from the small arm of human chromosome 3 [32]. Down-regulation of miR-326 inhibits the anti-tumor and anti-metastatic activity of RASSF1. In primary lung cancer and breast cancer, hypermethylation of RASSF1A in the promoter 5’ CpG island region is closely related with the pathological progression of the disease. More distinct tumor local invasion, more distant lymph node metastasis and more advanced tumor stage lead to higher incidence of methylation [33]. The mechanism may be the imbalance of RAS caused by inhibition of RASSF1, or the blockage of accumulation of cyclin D1 and shift from G1 phase to S phase in the cell cycle [34,35], leading to promotion of malignant tumor formation and metastasis. It is predicted that E2F-1 is the target gene to up-regulate miR-205 expression, and E2F-3 is the target gene to down-regulate miR-25 expression, both belonging to nuclear transcription factor E2F family. E2F is the most important transcription factor in the Rb/E2F pathway, which exhibits dual regulatory effect on cell transcription, proliferation and apoptosis, and whether it acts as oncogene or tumor suppressor gene is determined by the degree of the dual effect and is associated with organ-specificity. Lujambio et al. [28] reported that the reduction in expression of oncogenes like E2F-3 and C-myc inhibited tumor metastasis. High expression of E2F-1 in head and neck cancer is closely related with tumor metastasis and prognosis [36].
GO analysis and transcription factor binding site analysis of target genes demonstrated that it was highly possible the transcription factors AP-1, AP-4, p53, STATs and NF-κB were involved in regulation of NSCLC metastasis-related miRNAs. AP-1 inhibits cell growth through regulation of cell cycle regulators cyclin D, cyclin A, p53, p21Cip, p16INK4a and p19Arf [37]. Many target gene products mediated by AP-1 are involved in the invasion and metastasis of tumor cells, which needs degradation of extracellular matrix components to enable angiogenesis and cell migration. In addition, AP-1 mediates the transcription of tumor metastasis-related factors like CD44, cathepsin L and MTS1. p53 is a protein referring to cell cycle regulation and apoptosis, its wild type acts as a tumor suppressor gene, while the mutant type functions as an oncogene. It is considered that the mutant p53 protein enables cell survival under anoxic conditions, and promotes angiogenesis and metastasis of tumors through inducing the expression of inducible NO synthase (iNOS) and vascular endothelial growth factor (VEGF) [38]. Signal transducer and activator of transcription (STAT) is an important member in the JAKs-STATs transduction pathway. The STATs family, notably STAT3, plays important roles in promoting tumor cell proliferation, inhibiting tumor cell apoptosis and promoting invasion and metastasis, as well as immune evasion. STAT3 regulates cell growth, differentiation and apoptosis through mediating the transcription of the downstream target genes, notably cyclin D1. In addition, activation of NF-κB up-regulates the expression of VEGF, E-selectin, integrin, ICAM-1, VCAM-1 and MMP-9 which are associated with tumor metastasis, and chemical factor receptors like CXCR4, uPA and IL-8, through increasing the adhesion ability of tumor cells, degrading surrounding matrix, promoting EMT and tumor angiogenesis [39-41]. Therefore, most of these transcription factors are involved in the proliferation, differentiation, transformation and apoptosis, as well as regulation of cell cycle signal pathway.
Comparison between miRNA microarray and RT-PCR validation showed that there was big difference of difference fold value of miR-205 expression between the miRNA microarray and RT-PCR analysis (Figure 10A) in Group A. miRNA microarray analysis revealed that miR-let-7e was up-regulated, while it was down-regulated in RT-PCR validation in Group B (Figure 10B), which may attribute to the variation in sample size used in miRNA microarray and RT-PCR. In the present study, miRNA microarray used 4 pairs of nude mice with and without metastases, while 16 nude mice without metastases and 20 mice with metastases were used in RT-PCR. Due to small sample size, miRNA microarray is only used as a tool for preliminary screening, and the probability of “false positive” and/or “false negative” is relatively high. Therefore, the RT-PCR validation is more credible than the results revealed by the miRNA microarray.
The present study compared the difference of miRNA expression profiling in NSCLC tissues with and without metastases, and predicted the corresponding target genes and transcription factors of these differentially expressed miRNAs using bioinformatics method. The results showed that the differentially expressed miRNAs and the related target genes and transcription factors may be involved in the occurrence and development of NSCLC metastasis. Further studies to investigate the possibility that the expression profiling of these differentially expressed miRNAs is used as markers for detecting NSCLC metastasis and assessing prognosis seem justified. Curren-tly, the study to explore the role of miRNAs in NSCLC metastasis remains at a theoretical level, and the mechanism is still superficial. Therefore, further studies should be carried out to provide new ideas for exploring diagnosis, treatment and prognosis of tumor metastasis.
Acknowledgements
This work was funded by Jiangsu Provincial Special Program of Medical Science (BL2012008).
Disclosure of conflict of interest
None to declare.
References
- 1.Li B, Blanc JM, Sun Y, Yang L, Zaorsky NG, Giacalone NJ, Torossian A, Lu B. Assessment of M867, a selective caspase-3 inhibitor, in an orthopic mouse model for non-small cell lung carcinoma. Am J Cancer Res. 2014;4:161–171. [PMC free article] [PubMed] [Google Scholar]
- 2.Mountain CF, Dresler CM. Regional lymph node classification for lung cancer staging. Chest. 1997;111:1718–1723. doi: 10.1378/chest.111.6.1718. [DOI] [PubMed] [Google Scholar]
- 3.Ying H, Yang XD, Sun Z, Ning X, Wang Y, Bai C, Chen S, Wang Y. Lifestyle risks exposure and response predictor of gefitinib in patients with non-small cell lung cancer. Med Oncol. 2014;31:220. doi: 10.1007/s12032-014-0220-4. [DOI] [PubMed] [Google Scholar]
- 4.Huang BW, Miyazawa M, Tsuji Y. Distinct regulatory mechanisms of the human ferritin gene by hypoxia and hypoxia mimetic cobalt chloride at the transcriptional and post-transcriptional levels. Cell Singnal. 2014;26:2702–2709. doi: 10.1016/j.cellsig.2014.08.018. [DOI] [PMC free article] [PubMed] [Google Scholar]
- 5.Calin GA, Sevignani C, Dumitru CD, Hyslop T, Noch E, Yendamuri S, Shimizu M, Rattan S, Bullrich F, Negrini M, Croce CM. Human microRNA genes are frequently located at fragile sites and genomic regions involved in cancers. Proc Natl Acad Sci U S A. 2004;101:2999–3004. doi: 10.1073/pnas.0307323101. [DOI] [PMC free article] [PubMed] [Google Scholar]
- 6.Esquela-Kerscher A, Slack FJ. Oncomirs-microRNAs with a role in cancer. Nat Rev Cancer. 2006;6:259–269. doi: 10.1038/nrc1840. [DOI] [PubMed] [Google Scholar]
- 7.Rashidi B, Yang M, Jiang P, Baranov E, An Z, Wang X, Moossa AR, Hoffman RM. A highly metastatic Lewis lung carcinoma orthotopic green fluorescent protein model. Clin Exp Metastasis. 2000;18:57–60. doi: 10.1023/a:1026596131504. [DOI] [PubMed] [Google Scholar]
- 8.Salmon HW, Guha A, Rojiani AM, Siemann DW. Vascular development in mouse lung metastases. Am J Cancer Res. 2012;2:581–588. [PMC free article] [PubMed] [Google Scholar]
- 9.Yang LX, Huang XF, Shao Q, Huang MY, Deng L, Wu QL, Zeng YX, Shao JY. MicroRNA miR-21 overexpression in human breast cancer is associated with advanced clinical stage, lymph node metastasis and patient poor prognosis. RNA. 2008;14:2348–2360. doi: 10.1261/rna.1034808. [DOI] [PMC free article] [PubMed] [Google Scholar]
- 10.Yang K, Li Z, Cao Y, Yu X, Mei J. Effect of peptide-conjugated near-infrared fluorescent quantum dots (NIRF-QDs) on the invasion and metastasis of human tongue squamous cell carcinoma cell line Tca8113 in vitro. Int J Mol Sci. 2009;10:4418–4427. doi: 10.3390/ijms10104418. [DOI] [PMC free article] [PubMed] [Google Scholar]
- 11.Huang P, McKee TD, Jain RK, Fukumura D. Green fluorescent protein (GFP)-expressing tumor model derived from a spontaneous osteosarcoma in a vascular endothelial growth factor (VEGF)-GFP transgenic mouse. Comp Med. 2005;55:236–243. [PubMed] [Google Scholar]
- 12.Liao W, Jordaan G, Srivastava MK, Dubinett S, Sharma S, Sharma S. Effect of epigenetic histone modifications on E-cadherin splicing and expression in lung cancer. Am J Cancer Res. 2013;3:374–389. [PMC free article] [PubMed] [Google Scholar]
- 13.Zou Z, Hu C, Zhang F, Zhao H, Shen S. WSNs data acquisition by combining Hierarchical routing method and compressive sensing. Sensors (Basel) 2014;14:16766–16784. doi: 10.3390/s140916766. [DOI] [PMC free article] [PubMed] [Google Scholar]
- 14.Muller S. In silico analysis of regulatory network underlines the role of miR-10b-5p and its target BDNF in huntington’s disease. Transl Neurodegener. 2014;3:17. doi: 10.1186/2047-9158-3-17. [DOI] [PMC free article] [PubMed] [Google Scholar]
- 15.An J, Lai J, Lehman ML, Nelson CC. miRDeep: an integrated application tool for miRNA identification from RNA sequencing data. Nucleic Acids Res. 2013;41:727–737. doi: 10.1093/nar/gks1187. [DOI] [PMC free article] [PubMed] [Google Scholar]
- 16.Fujiwara S, Ida H, Yoshioka Y, Yoshida H, Yamaguchi M. The warts gene as a novel target of the Drosophila DRE/DREF transcription pathway. Am J Cancer Res. 2012;2:36–44. [PMC free article] [PubMed] [Google Scholar]
- 17.Appari M, Babu KR, Kaczorowski A, Gross W, Herr I. Sulforaphane, quercetin and catechins complement each other in elimination of advanced pancreatic cancer by miR-let-7 induction and K-ras inhibition. Int J Oncol. 2014:1391–1400. doi: 10.3892/ijo.2014.2539. [DOI] [PMC free article] [PubMed] [Google Scholar]
- 18.Gregory PA, Bert AG, Paterson EL, Barrt SC, Tsykin A, Farshid G, Vadas MA, Khew-Goodall Y, Goodall GJ. The miR-200 family and miR-205 regulate epithelial to mesenchymal transition by targeting ZEB1 and SIP1. Nat Cell Biol. 2008;10:593–601. doi: 10.1038/ncb1722. [DOI] [PubMed] [Google Scholar]
- 19.Kim J, Lim NJ, Jang SG, Kim HK, Lee GK. miR-592 and miR-552 can distinguish between primary lung adenocarcinoma and colorectal cancer metastases in the lung. Anticancer Res. 2014;34:2297–2302. [PubMed] [Google Scholar]
- 20.Larzabal L, de Aberasturi AL, Redrado M, Rueda P, Rodriguez MJ, Bodegas ME, Montuenga LM, Calvo A. TMPRSS4 regulates levels of integrin alpha-5 in NSCLC through miR-205 activity to promote metastasis. Br J Cancer. 2014;110:764–774. doi: 10.1038/bjc.2013.761. [DOI] [PMC free article] [PubMed] [Google Scholar]
- 21.Ma L, Teruya-Feldstein J, Weinberg RA. Tumour invasion and metastasis initiated by microRNA- 10b in breast cancer. Nature. 2007;449:682–688. doi: 10.1038/nature06174. [DOI] [PubMed] [Google Scholar]
- 22.Asangani I, Rasheed SAK, Nikolova DA, Leupold JH, Colburn NH, Post S, Allgayer H. MicroRNA-21 post-transcriptionally downregulates tumor suppressor Pdcd4 and stimulates invasion,intravasion and metastasis in colorectal cancer. Oncogene. 2008;27:2128–2136. doi: 10.1038/sj.onc.1210856. [DOI] [PubMed] [Google Scholar]
- 23.Mishra S, Lin CL, Huang TH, Bouamar H, Sun LZ. MicroRNA-21 inhibits p57Kip2 expression in prostate cancer. Mol Cancer. 2014;13:212. doi: 10.1186/1476-4598-13-212. [DOI] [PMC free article] [PubMed] [Google Scholar]
- 24.Walter BA, Gomez-Macias G, Valera VA, Sobel M, Merino MJ. miR-21 expression in pregnancy-associated breast cancer: a possible marker of poor prognosis. J Cancer. 2011;2:67–75. doi: 10.7150/jca.2.67. [DOI] [PMC free article] [PubMed] [Google Scholar]
- 25.Huang Q, Gumireddy K, Schrier M, Le Sage C, Nagel R, Nair S, Egan DA, Li A, Huang G, Klein-Szanto AJ, Gimotty PA, Katsaros D, Coukos G, Zhagn L, Pure E, Agami R. The microRNAs miR-373 and miR-520c promote tumour invasion and metastasis. Nat Cell Biol. 2008;10:202–210. doi: 10.1038/ncb1681. [DOI] [PubMed] [Google Scholar]
- 26.Kong W, Yang H, He L, Zhao JJ, Coppola D, Dalton WS, Cheng JQ. MicroRNA-155 is regulated by the transforming growth factor beta/Smad pathway and contributes to epithelial cell plasticity by targeting RhoA. Mol Cell Biol. 2008;28:6773–6784. doi: 10.1128/MCB.00941-08. [DOI] [PMC free article] [PubMed] [Google Scholar]
- 27.Gregory PA, Bracken CP, Bert AG, Goodall GJ. MicroRNA as regulators of epithelial-mesenchymal transition. Cell Cycle. 2008;7:3112–3118. doi: 10.4161/cc.7.20.6851. [DOI] [PubMed] [Google Scholar]
- 28.Lujambio A, Calin GA, Villanueva A, Ropero S, Sanchez-Cespedes M, Blanco D, Montuenga LM, Rossi S, Nicoloso MS, Faller WJ, Gallagher WM, Eccles SA, Croce CM, Esteller M. A microRNA DNA methylation signature for human cancer metastasis. Proc Natl Acad Sci U S A. 2008;105:13556–13561. doi: 10.1073/pnas.0803055105. [DOI] [PMC free article] [PubMed] [Google Scholar]
- 29.Ostriker A, Horita HN, Pocazobutt J, Weiser-Evans MC, Nemenoff RA. Vascular smooth muscle cell-derived transforming growth factor-beta promotes maturation of activated, neointima lesion-like macrophages. Arterioscler Thromb Vasc Biol. 2014;34:877–886. doi: 10.1161/ATVBAHA.114.303214. [DOI] [PMC free article] [PubMed] [Google Scholar]
- 30.Wang W, Xu G, Ding CL, Zhao LJ, Zhao P, Ren H, Qi ZT. All-trans retinoic protects hepatocellular carcinoma cells against serum-starvation-induced cell death by upregulating collagen 8A2. FEBS J. 2013;280:1308–1319. doi: 10.1111/febs.12122. [DOI] [PubMed] [Google Scholar]
- 31.Liang QL, Chen GQ, Liu QL, Li ZY, Zhang XN, Zhou Y, Ou WT, Wang BR, Hu LR. Tumor suppressor TSLC1 inhibits growth, proliferation, invasiveness and angiogenesis in nude mice xenografted tumor of Eca109 cells. Int J Clin Exp Med. 2014;7:1507–1515. [PMC free article] [PubMed] [Google Scholar]
- 32.Valencia K, Martin-Fernandez M, Zandueta C, ormazabal C, Martinez-Canarias S, Bandres E, de la Piedra C, Lecanda F. miR-326 associated with biochemical markers of bone turnover in lung cancer bone metastasis. Bone. 2013;52:532–539. doi: 10.1016/j.bone.2012.10.033. [DOI] [PubMed] [Google Scholar]
- 33.Dammann R, Schagdarsurengin U, Seidel C, Strunnikova M, Rastetter M, Baier K, Pfeifer GP. The tumor suppressor RASSF1A in human carcinogenesis: an update. Histol Histopathol. 2005;20:645–663. doi: 10.14670/HH-20.645. [DOI] [PubMed] [Google Scholar]
- 34.Vos MD, Ellis CA, Bell A, Birrer MJ, Clark GJ. Ras uses the novel tumor supressor RASSF1 as an effector to mediate apoptosis. J Biol Chem. 2000;275:35669–35672. doi: 10.1074/jbc.C000463200. [DOI] [PubMed] [Google Scholar]
- 35.Agathanggelou A, Honorio S, Macartney DP, Martinez A, Dallol A, Rader J, Fullwood P, Chauhan A, Walker R, Shaw JA, Hosoe S, Lerman MI, Minna JD, Maher ER, Latif F. Methylation associated inactivation of RASSF1A from region 3p21.3 in lung, breast and ovarian tumors. Oncogene. 2001;20:1509–1518. doi: 10.1038/sj.onc.1204175. [DOI] [PubMed] [Google Scholar]
- 36.Zhang SY, Liu SC, Johnson DG, Klein-Szanto AJ. E2F-1 gene transfer enhances invasiveness of human head and neck carcinoma cell lines. Cancer Res. 2000;60:5972–5976. [PubMed] [Google Scholar]
- 37.Eferl R, Wagner EF. AP-1: a double-edged sword in tumorigenesis. Nat Rev Cancer. 2003;3:859–868. doi: 10.1038/nrc1209. [DOI] [PubMed] [Google Scholar]
- 38.Trarallo V, Tudisco L, De Falco S. A placenta growth 2 variant acts as dominant negative of vascular endothelial growth factor a by heterodimerization mechanism. Am J Cancer Res. 2011;1:265–274. [PMC free article] [PubMed] [Google Scholar]
- 39.Huang S, Pettaway CA, Uehara H, Bucana CD, Fidler IJ. Blockade of NF-kappaB activity in human prostate cancer cells is associated with suppression of angiogenesis, invasion, and metastasis. Oncogene. 2001;20:4188–4197. doi: 10.1038/sj.onc.1204535. [DOI] [PubMed] [Google Scholar]
- 40.Stathopoulos GT, Sherrill TP, Han W, Sadikot RT, Polosukhin VV, Fingleton B, Yull FE, Blackwell TS. Use of bioluminescent imaging to investigate the role of nuclear factor-kappa Beta in experimental non-small cell lung cancer metastasis. Clin Exp Metastasis. 2008;25:43–51. doi: 10.1007/s10585-007-9100-z. [DOI] [PubMed] [Google Scholar]
- 41.Zhu H, Bhaijee F, Ishaq N, Pepper DJ, Backus K, Brown AS, Zhou X, Miele L. Correlation of Notch1, pAKT and nuclear NF-kB expression in triple negative breast cancer. Am J Cancer Res. 2013;3:230–239. [PMC free article] [PubMed] [Google Scholar]


